

Abstract
Introduction
Endothelial cells (ECs) morphology strongly depends on the imposed mechanical stimuli. These mechanical stimuli include wall shear stress (WSS) and biaxial cyclic stretches (CS). Under combined loading, the effect of CS is not as simple as pure CS. The present study investigates the morphological response of ECs to the realistic mechanical stimuli.
Methods
The cell population is theoretically studied using our previous validated model. The mechanical stimuli on ECs are described using four parameters; WSS magnitude (0 to 2.0 Pa), WSS angle (− 50° to 50°), and biaxial CS in two perpendicular directions (0 to 10%). The morphology of ECs is reported using four parameters; average shape index (SI) and orientation angle (OA) of the cell population as well as the standard deviation (SD) of SI and OA as measures for scattering of cells’ SI and OA from these average values.
Results
A new effective strain ratio (ESR) is defined as the ratio of the undesirable CS to the desirable one. The obtained results of the model, illustrated that the SI and OA of cells increase with absolute value of ESR. In addition, the scattering in the SI of cells decreases with the absolute value of ESR, which means that the cell shapes become more regular. It is shown that the angular irregularity of cells increases at higher ESR values.
Conclusions
The results indicated that, the defined ESR is a stand-alone parameter for describing the realistic mechanical loading on the ECs and their morphological response.
Keywords: Endothelium, Mechanical stimuli, Atherosclerosis, Biaxial cyclic stretch, Wall shear stress
Introduction
Atherosclerosis is a disease that occurs in large- and medium-size arteries. Coronary arteries are important arteries that are commonly affected by atherosclerosis. Many traditional risk factors have been known for atherosclerosis. These risk factors include high LDL levels, hypertension, smoking, diabetes, and family history of coronary artery disease.12,44 Despite these traditional risk factors, it is well documented that inappropriate endothelial cells (ECs) function associates with the process of atherogenesis.3,13 In addition, it is reported that ECs morphology and configuration can be a standalone parameter that determines the chance of atherosclerosis at different locations in the artery.28 ECs are round with irregular shape and without any preferential orientation in the atheroprone sites, while the cells elongate and orient in the athero-protected sites.28,33 The morphology of ECs is strongly related to the mechanical stimuli on them. The blood flow imposed wall shear stress (WSS) on ECs. On the other hand, the temporal variation of blood pressure deforms the arterial wall. This deformation causes ECs to experience a circumferential cyclic stretch (CS). For some specific arteries such as coronary arteries another stretch applies to ECs. Due to the heart beat, coronary arteries are also stretched in the longitudinal direction.4–6 Therefore, ECs relying on coronary arteries are under combined loadings of WSS and biaxial CS. There are numerous articles which studied the morphological response of ECs under these mechanical stimuli.
First of all, many researchers investigated the shape of ECs under WSS using in vitro experiments. These studies unanimously reported that ECs orient and elongate in the direction of imposed WSS.7,14,24,50 Fewer studies were also performed for the ECs response to the CS. Almost all these studies were performed under uniaxial CS. The results demonstrated that ECs tend to elongate and align in the perpendicular direction of imposed CS.16,23,29,41 A few researchers, studied the morphological response of ECs under biaxial CS. Wang et al.45 investigated the effect of equi-biaxial stretch on ECs. Their results indicate that while ECs elongate and orient perpendicular to the direction of uniaxial CS, the shapes of ECs are round and tent-like under equi-biaxial stretch. The effect of CS on ECs still needs further investigation and understanding.1,20 Recently, some studies were done on the morphological response of ECs under combined WSS and CS.26,27,34 These studies illustrated that the CS can influence the effect of WSS on the ECs. Although, all these studies performed for uniaxial CS, ECs of coronary arteries are under combined WSS and biaxial CS. According to our best knowledge, there is not any experimental or theoretical study which investigated the morphological response of ECs under realistic conditions of the coronary arteries (i.e. under combined WSS and biaxial CS).
In the absence of appropriate in vivo and in vitro results of the effect of realistic mechanical stimuli on ECs, some researchers developed theoretical models for predicting the morphological response of ECs. There are some proposed models for response of ECs to the WSS43,47 and some for CS.21,22 Recently, we proposed a theoretical model for simulating the morphological response of ECs under combined WSS and CS and the model was validated carefully with in vitro results.35
Based on the above review and in the absence of comprehensive results of morphological response of ECs under combined WSS and biaxial CS, the present study deals with this topic. Attempts were made to model the mechanical stimuli on ECs similar to one occurs at coronary arteries. The mechanical stimuli on cells is described using four parameters: WSS magnitude, WSS angle, and CS in two directions. Using our previous proposed model35 the morphology of ECs are studied for wide ranges of these four parameters. The morphology of ECs is determined using average shape index (SI) of cells, average orientation angle of cells (OA), non-uniformity in SI of cells, as well as non-uniformity in OA of cells.
Methods
We use our previous cell population model35 to study the morphological response of ECs under combined WSS and biaxial CS loadings. Since ECs are adherent cells, the model is two-dimensional.18 Initially, each cell is created by generating Nc random nodes within a circle with diameter d. A convex hull is implemented to the cell and considered as the cell membrane. The nodes on the convex hull can interact with neighboring cells. After that Na filaments are randomly generated between these nodes. These filaments represent the stress fibers.48 These cytoskeletal elements behave as Voigt viscoelastic elements. The force of the gth element of the pth cell which connects the ith node to the jth node is computed as19,21,42:
| 1 |
where kCSK and µCSK are spring and damper constants of the Voigt model for the cytoskeletal element. is the length of the cytoskeletal and is the equilibrium length of the element. r and v are position and velocity vectors, respectively. The cell-ECM interaction is modeled as a drag force15:
| 2 |
where D is the drag coefficient between the cell and ECM. The cell population is created by generating n cells using the above mentioned procedure. Cell-cell interaction is implemented by an adhesive-repulsive force via nodes on the cell membrane. The adhesive component of this force is modeled as another Voigt model19:
| 3 |
where kadh and µadh are spring and damper constants of the Voigt model for the cell-cell interaction links. If the cell-cell distance is reduced to a constant value of drep the repulsive force is activated as19:
| 4 |
where is the constant of the repulsive force and is the minimum distance between the ith node of the pth cell to the membrane of the qth cell. Therefore, the total exerted force to the ith node of the pth cell is:
| 5 |
The position of each nodes is determined due to the net force acted on them and using the Euler-Richardson algorithm.11 The created cell population remodels to the confluent condition with this procedure (Fig. 1).
Figure 1.
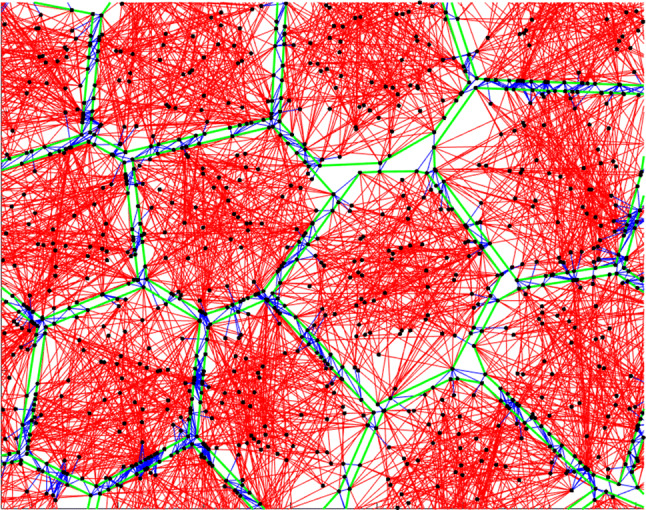
The cell population model. Red lines are cytoskeletal filaments, blue lines are cell–cell interaction links, green lines are cell membranes, and black dots are cell nodes representing adhesion sites.
After this stage, the loadings are applied on the cell population model. CS of substrate is applied on the cells by displacing the cell nodes proportional to the imposed stretch. The CS could be bi-directional, i.e. in and directions. After maximum stretch, the strain of each filament is calculated and the number of filaments are disassembled using a probability function as35:
| 6 |
where and are the probability functions for pure CS and pure WSS loadings, respectively and are defined as35:
| 7 |
| 8 |
and are the stretches of the gth cytoskeletal element of the pth cell and a reference stretch which is unity, respectively. is the orientating angle of the gth element of the pth cell and is the angle of the imposed WSS. After that, at the minimum strain, the number of filaments are randomly generated. These steps are repeated until that the angular distribution of filaments does not change with the loading cycle. At the last stage of the modeling, the actin fibers polymerization is modeled with increasing the lengths of filaments.30 Finally, the morphology of ECs is obtained and shape index and cells orientation angle are computed from the obtained morphology. The values of model parameters are shown in Table 1. Figure 1 shows the obtained cell population before applying mechanical stimuli. Red lines show the cytoskeletal filaments, blue lines are cell-cell interaction links, green lines are cell membranes, and black dots are cell nodes representing adhesion sites. The more details of the model can be found at our previous article.35 There, the model was carefully validated with the available experimental results.16,17,25,49
Table 1.
The values of model parameters.35
| Parameter | Definition of parameter | Unit | Value |
|---|---|---|---|
| n | Number of cells in each simulation | – | 50 |
| Number of filaments in each cell | – | 300 | |
| Number of disassembled and assembled filaments in each cell and each cycle | – | 10 | |
| Spring constant for cytoskeletal filaments | kg/s2 | ||
| Damping constant for cytoskeletal filaments | kg/s | ||
| Drag coefficient between cell and ECM | kg/s | ||
| Spring constant for cell–cell links | kg/s2 | ||
| Damping constant for cell–cell links | kg/s | ||
| constant of repulsive force | kg m2/s2 | ||
| Coefficient of CS probability function | – | ||
| Coefficient of WSS probability function | – |
The WSS and CSs are implemented to the cell population model as stated previously. Figure 2 shows these loadings on the cell population. The WSS direction creates an angle with the x-direction. The x-direction could be a representation of the longitudinal direction of the artery. Generally, the WSS makes an angle with longitudinal direction of the artery, due to the secondary flows, curvature of the artery, or bifurcation.36 Therefore, in the present study the angle between WSS direction and arterial length is shown by .
Figure 2.
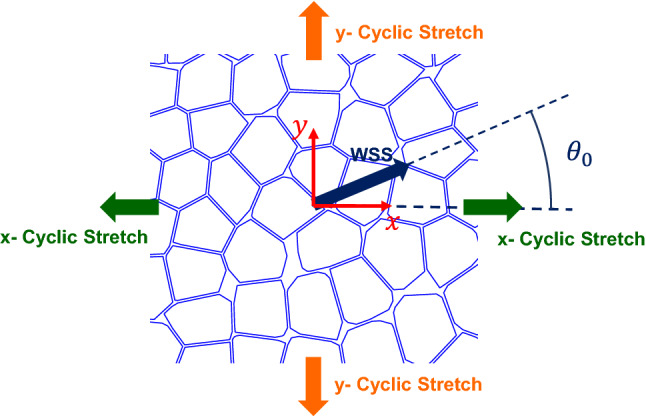
Schematics of the application of WSS and CSs to the cell population model with respect to x–y coordinate.
We studied the biaxial CS loading. As illustrated in Fig. 2, one CS are applied in the x-direction and the other in the y-direction. We name these stretches as x-CS and y-CS. The y-CS is the circumferential stretch due to the temporal variation of the blood pressure and the x-CS is the longitudinal stretch which can be arisen from tissue deformation or bifurcation sites. An important tissue deformation which causes this longitudinal deformation is the dynamic curvature of the coronary arteries due to the heart beat.9
Results and Discussion
In the present study, based on more than 150 simulations each for 50 cells, the effects of four independent variables on the morphology of ECs are studied. These variables are x-CS, y-CS, WSS magnitude, and the angle between WSS and arterial direction. The morphology of Endothelial cells is described with shape index (SI) and orientation angle (OA), similar to previous studies.17,27 Shape index is defined as32:
| 9 |
where and are adherent area and perimeter of a 2D cell, respectively. The angle of orientation is defined as the angle between large diagonal axis of the cell and a reference direction such as x-direction.24 In addition, we use two other parameters for morphological description of ECs. The standard deviation (SD) of SI as well as SD of OA for all cells of cell population are employed as a measure for SI dispersion and OA dispersion of cells from the average values, respectively. It is obvious that lower SD of SI means the shape of cells are more uniform and lower SD of OA is corresponding to uniform orientation of all cells. These uniformities show that the morphology of ECs are more regular and corresponding to athero-protective sites.28
The results of this study are presented, as plots of morphological parameters (SI, OA, SD of SI, and SD of OA) with respect to mechanical loadings (WSS, WSS angle, CSs, and parameters related to them). The plots are only sketched for meaningful and significant correlations. When any combination of a morphological parameter vs. a mechanical loading parameter is not presented, it means that these parameters have not shown a meaningful correlation.
Validation Results
Figure 3 shows the obtained SI values under pure WSS loadings from the model. The results are compared with three different experimental results.17,25,49 This comparison shows that the model can accurately predict the SI value of the cell population under pure WSS loading.
Figure 3.
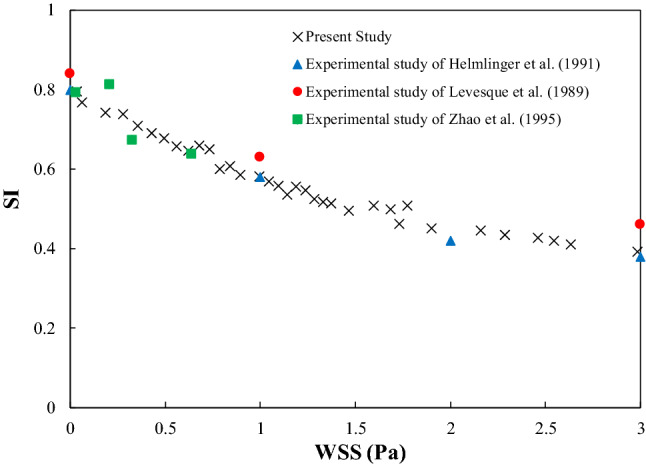
Comparison of computed SI values from the model with three different in vitro studies under pure WSS loading17,25,49.
Table 2 compares the SI values from present model with an available experimental result16 under pure CS loading. For three CS values reported in this experimental study, maximum difference between model prediction and in vitro results is 6.25% for SI.
Table 2.
Comparison of computed SI values (mean ± SEM) from the model with the in vitro study16 under pure uniaxial CS loading.
| CS (%) | Present study | Haghighipour et .al 16 | Difference (%) |
|---|---|---|---|
| 0.0 | 0.85 ± 0.01 | 0.80 ± 0.02 | 6.25 |
| 10.0 | 0.57 ± 0.01 | 0.55 ± 0.01 | 3.64 |
| 15.0 | 0.52 ± 0.02 | 0.52 ± 0.01 | 0.00 |
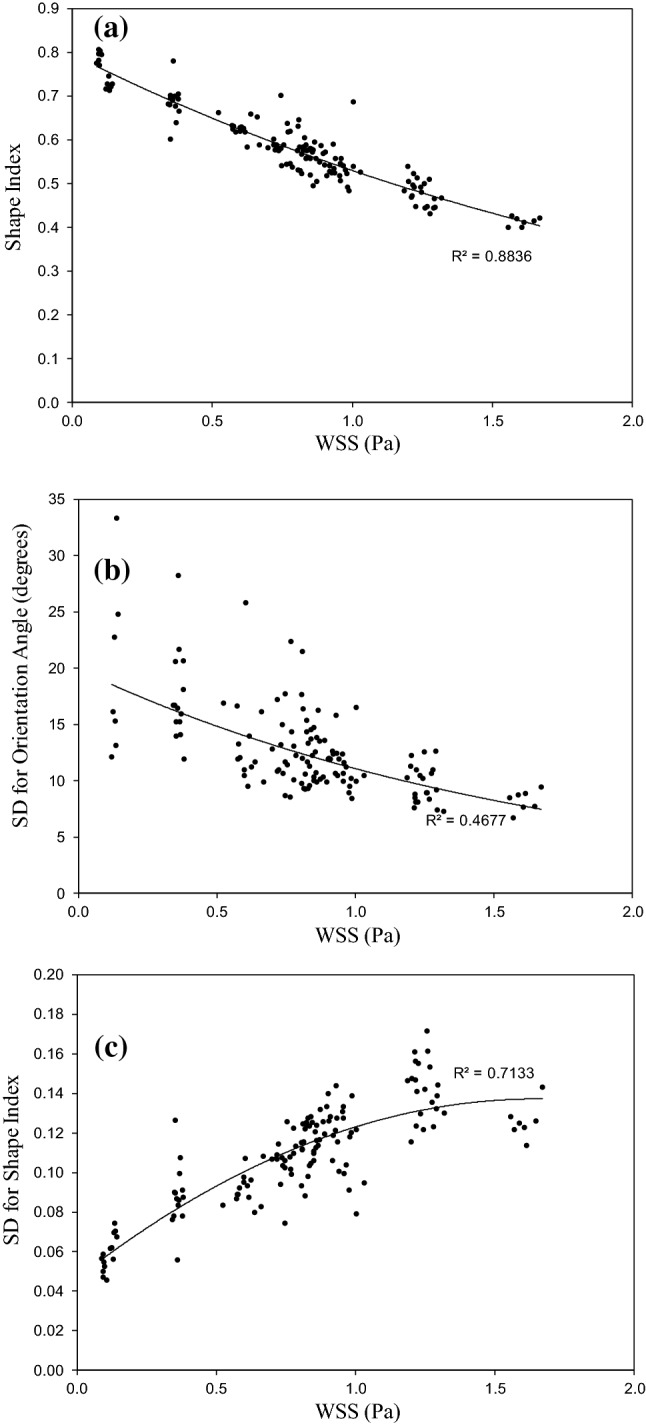
After model validation for pure WSS and pure CS, the model is used to simulate an available experimental results for the case of combined WSS and uniaxial CS.49 Table 3 demonstrates the SI values and OA values for different combined loadings from present model and experimental study.49 The table shows that the error in SI prediction is less than 8.0% and error in OA prediction is less than 35%. However, it can be seen that the model accuracy improves for higher mechanical loadings. For 7% CS the maximum error for OA prediction is less than 16%. These validation results confirm the validity and accuracy of the proposed model.
Table 3.
Comparison of computed SI OA values (mean ± SEM) from the model with the in vitro study49 under combined WSS and CS loadings.
| Combined loading | SI | OA (°) | |||||
|---|---|---|---|---|---|---|---|
| CS (%) | WSS (Pa) | Present study | Zhao et al.49 | Difference (%) | Present study | Zhao et al.49 | Difference (%) |
| 0.0 | 0.03 | 0.81 ± 0.01 | 0.79 ± 0.01 | 2.53 | 42.1 ± 4.1 | 50.5 ± 1 | 16.63 |
| 0.0 | 0.20 | 0.77 ± 0.01 | 0.81 ± 0.01 | 4.94 | 32.2 ± 4.5 | 49.6 ± 2 | 35.0 |
| 0.0 | 0.32 | 0.71 ± 0.01 | 0.67 ± 0.01 | 5.97 | 24.0 ± 2.9 | 23.3 ± 1 | 3.0 |
| 0.0 | 0.63 | 0.64 ± 0.01 | 0.64 ± 0.01 | 0.00 | 20.8 ± 2.9 | 16.4 ± 1 | 26.8 |
| 4.0 | 0.03 | 0.63 ± 0.01 | 0.68 ± 0.01 | 7.35 | 19.1 ± 2.3 | 20.7 ± 1 | 7.73 |
| 4.0 | 0.33 | 0.59 ± 0.02 | 0.64 ± 0.01 | 7.81 | 15.1 ± 1.7 | 15.8 ± 1 | 4.43 |
| 4.0 | 0.56 | 0.52 ± 0.02 | 0.52 ± 0.01 | 0.00 | 10.9 ± 1.8 | 8.8 ± 1 | 23.86 |
| 7.0 | 0.03 | 0.59 ± 0.01 | 0.63 ± 0.01 | 6.35 | 14.9 ± 2.1 | 15.1 ± 1 | 1.32 |
| 7.0 | 0.33 | 0.55 ± 0.02 | 0.59 ± 0.01 | 6.78 | 12.1 ± 1.5 | 12.8 ± 1 | 0.78 |
| 7.0 | 0.53 | 0.52 ± 0.02 | 0.52 ± 0.01 | 0.00 | 9.4 ± 1.0 | 8.1 ± 1 | 16.0 |
Graphical Representation of Cells Morphology
Figure 4 illustrates the morphology of cell population for sixteen different loadings. Figure 4a shows the morphology of ECs without any mechanical stimuli and Figs. 4b–4p) demonstrates the morphology for different combined loadings. The WSS magnitude, CSs, and WSS angle is illustrated for each case. At a first glance, it can be seen that OA of cells approximately follows the WSS angle. In addition, generally higher WSS causes higher cells elongation and lower SI. Comparison of Figs. 4i and 4l shows that for approximately equal WSS and WSS angle the morphologies of cells are different due to different CSs. Therefore, the combination of loadings determines the cells morphology. To be more specific, the hemodynamics is not the only effective parameter on ECs morphology. For more detailed examination and more accurate prediction, the next sections quantitatively analyze the implemented loading as well as morphological response.
Figure 4.

The morphology of cells population (a) without mechanical stimuli, and (b–p) for different mechanical loadings. The imposed mechanical stimuli are shown in left corner of each simulation with cyclic stretch magnitude in x-direction (green), cyclic stretch magnitude in y-direction (orange), wall shear stress magnitude (navy blue), and wall shear stress angle with respect to x-direction (navy blue).
The Effect of WSS Magnitude
Figure 5a shows the effect of WSS magnitude on the average SI of the cells. Although, the other three parameters (i.e. x-CS, y-CS, and ) influence the morphology of ECs, it can be seen that the SI of ECs are strongly correlated with WSS magnitude. This result was reported in the previous experimental studies24,25,39 and are widely accepted. Figure 5a indicates that the SI of ECs decreases with WSS magnitude. In other words, ECs elongate with increase in WSS.
Figure 5.
The effect of WSS on the (a) average SI , (b) variation of OA of cells , and (c) variation of SI of cells .
Figure 5b illustrates the effect of WSS on the SD of OA. As mentioned before, SD of OA is a measure for scattering in OA of cells. Figure 5b shows that the SD of OA decreases with WSS and the orientation of cells become more regular. This finding is also available in some previous studies.7,8,25 Figure 5c demonstrates the effect of WSS on the SD of SI. The SD of SI increases with WSS. It means that with increase in WSS the elongation of cells become less uniform. According to these results it can be concluded that the WSS causes three morphological changes: (i) lowering SI, (ii) lowering non-uniformity in OA, and iii) elevating non-uniformity in cell shapes. Based on these results, we speculate that, higher WSS is favorable for protection against atherosclerosis in terms of ECs morphology. On the other hand, very high values of WSS may cause adverse effects such as platelet activation and thrombus formation.10 In addition, as we expected, our results show that WSS magnitude has no effect on the OA of the cells.
The Effect of WSS Angle
Figure 6a shows the effect of WSS angle on the OA of ECs. It can be seen that the OA of cells are strongly dependent on the WSS angle. Small variations from the fitted curve is due to the effect of other three parameters (WSS, x-CS, and y-CS). Figure 6b shows that the SD of SI decreases as WSS angle approaches zero. It indicates that for lower WSS angles, more ECs follow the wall shear stress angle. The reason for this behavior is that with increase in WSS angle, the circumferential strain (y-CS) which is usually higher than longitudinal direction (x-CS), becomes an adverse effect for orientation of ECs. However, the p-value for this variation is high and this means that the variation of SD of OA with WSS angle is not significant.
Figure 6.

The effect of WSS angle on the (a) average OA and (b) SD of OA .
Effect of CSs
The results of this study, indicated that both x-CS and y-CS do not have significant effect on the SI, OA, SD of SI, and SD of OA (). However, the obtained cell morphologies from the model show that the cell shapes change with CSs. Regarding this controversial results, attempts were made to define appropriate parameters related to CSs which have significant effect on the ECs morphology. Based on the experimental results, ECs tend to elongate and orient in the perpendicular direction of the applied uniaxial CS.21,42,46 Therefore, y-CS (circumferential strain) tends to align cells parallel to the longitudinal direction of the artery and can be a favorable parameter which protects against atherosclerosis.20,27 On the other hand, x-CS (longitudinal strain) tends to align cells perpendicular to the longitudinal direction of the artery and can be an adverse effect.45 First of all, based on these reported results, we speculated that the ratio of y-CS to the x-CS (named as or strain ratio) could be the appropriate parameter which correlates CSs to the ECs morphology. Figure 7 illustrates the effects of y-CS to the x-CS ratio (strain ratio) on the OA and SD of OA. Figure 7a shows that OA approaches zero as the strain ratio increases. These results are in accordance with previous reported results.21,42,46 The relative value of circumferential strain to the longitudinal strain increases with strain ratio. Therefore, ECs tend to align in the direction of the artery and the absolute value of OA decreases. However, these results is still insignificant (). Figure 7b shows that the scattering in OA of cells reduces as strain ratio increases. Although this result is expected, but the results is still insignificant ().
| 10 |
and the desirable strain in the perpendicular direction to the imposed WSS is defined as:
| 11 |
Figure 7.

The effect of strain ratio on the (a) average OA and (b) SD of OA of cells .
Using these new strain definitions, an effective parameter is defined as effective strain ratio (ESR) which is the ratio of undesirable strain to the desirable strain:
| 12 |
ESR is used to study the morphological response of ECs to the combined loading. Figure 8a shows the SI of ECs with respect to the absolute value of ESR. SI increases monotonically with ESR. Increase in ESR value means that the relative importance of undesirable strain to desirable strain increases and the elongation of ECs reduces which results in increase in SI. Figure 8b shows that the OA increases monotonically with ESR.
Figure 8.

The effect of ESR on the (a) average SI , (b) average OA , (c) SD of SI of cells , and (d) SD of OA of cells .
Figure 8c indicates that as the absolute value of ESR increases, the non-uniformity in ECs shapes decreases. This result is against our expectations. ESR is an adverse parameter and we thought that the cell shapes must become more irregular as ESR increases. However, the obtained result is significant and the subject can be open for future researches. Unfortunately, to our best knowledge, there is not any experimental study of ECs morphology under combined WSS and biaxial stretch which could be used for comparing these results. The diversity in OA of ECs with changes in ESR is studied in Fig. 8d. Scattering in OA of cells increases with absolute value of ESR. It means that as ESR increases, the orientation of ECs become more irregular and the location in the artery with this kind of loading can be prone to atherosclerosis.
Therefore, the defined ESR parameter has significant effect on the all morphological parameters for describing the configuration of ECs. These parameters are SI, OA, SD of SI and SD of OA. The above results emphasis that the combined loading influences the morphology of ECs and not WSS or CSs solely, which is in agreement with previous reported results.2,27,34 The defined ESR parameter can be used for justifying the high risk of atherosclerosis in coronary arteries. Coronary arteries which are lying on heart, are under longitudinal deformation due to heartbeats. This heart motion influences the blood flow in the artery and also imposes high longitudinal CS on the ECs.37 These conditions increase the WSS angle and undesirable strain. Therefore, ESR value at coronary arteries are higher than other arteries. This higher ESR value causes ECs become round and irregular which is an indication for atheroprone sites. This conclusion are in agreement with previous speculations.9
Conclusion
Using our previous proposed cell population model,35 the morphological response of ECs to the combined WSS and biaxial CS loadings was studied. The obtained results indicated that the ECs elongate and orient in the direction of WSS. This finding is in agreement with previous reported data.31 Biaxial CS was defined with two components, x-CS and y-CS. y-CS is a representation of circumferential CS in the artery and x-CS is for longitudinal CS. Longitudinal CS in coronary arteries comes from the contraction of heart muscle in each heartbeat. The results demonstrated that these two components of CS had no significant effects on the describing parameters of ECs morphology. We defined the desirable and undesirable CS as the CS components in the perpendicular direction to the WSS direction and in the direction of WSS, respectively. Effective strain ratio (ESR) was defined as the ratio of undesirable CS to the desirable CS. The results showed that ESR has significant effect on all morphological parameters (). The average SI and OA of cells increase with increase in the absolute value of ESR. In addition, the scattering in the SI of cells decreases with the absolute value of ESR, which means that the cell shapes become more regular. The scattering in the OA of cells increases with the absolute value of ESR. This indicates that the angular irregularity of cells increases at higher ESR values.
Based on the results of this study, the positioning of coronary arteries on the myocardium elevates the risk of atherosclerosis at these arteries. ECs on coronary arteries experience a longitudinal stretch due to contraction of heart muscle at each heartbeat. In addition, the motion of coronary arteries can alter the blood flow in the artery which could increase the WSS angle with respect to the arterial direction. On the other hand, at bifurcation locations, circumferential and longitudinal directions cannot be defined properly. Therefore, at these locations, ESR value may be so high. According to our results, these conditions lead to irregular and round-shape cells and make the locations as atheroprone sites. Previous studies also speculated that the dynamic curvature of coronary arteries could increase the risk of atherosclerosis.9
The results of the present study are unanimous with previous reported data; which hemodynamics (e.g. WSS) plays role in atherosclerosis. However, we demonstrated that the CSs at both directions have significant effect on ECs morphology and atherosclerosis. It was shown34 that, WSS and CS are equipotent for ECs response.
To our knowledge, the present study is the first one for morphological response of ECs under combined WSS and biaxial CS. Therefore, it can be a new milestone in ECs biology in the absence of in vitro or in vivo data at this subject. The results of this study show that how different combinations of mechanical stimuli can alter the ECs shape and configuration. However, as a first step, the study has some limitations and needs further improvements. The model does not consider the effect of CS frequency and waveform. Some studies showed that the CS frequency and waveform could influence the response of ECs.16,23,40 Besides, the torsional loading38 is not considered in the model. In addition, other parameters except than mechanical ones, such as biochemical signals can alter the ECs morphology. The biochemical parameters are not considered in the present study.
Acknowledgments
Conflict of interest
Hossein Ali Pakravan, Mohammad Said Saidi, and Bahar Firoozabadi declare that they have no conflicts of interest.
Ethical Approval
No human studies were carried out by the authors for this article; no animal studies were carried out by the authors for this article.
Footnotes
Publisher's Note
Springer Nature remains neutral with regard to jurisdictional claims in published maps and institutional affiliations.
References
- 1.Bernardi L, Giampietro C, Marina V, Genta M, Mazza E, Ferrari A. Adaptive reorientation of endothelial collectives in response to strain. Integr. Biol. 2018;10:527–538. doi: 10.1039/c8ib00092a. [DOI] [PubMed] [Google Scholar]
- 2.Breen LT, McHugh PE, Murphy BP. Multi-axial mechanical stimulation of HUVECs demonstrates that combined loading is not equivalent to the superposition of individual wall shear stress and tensile hoop stress components. J. Biomech. Eng. 2009;131:081001. doi: 10.1115/1.3127248. [DOI] [PubMed] [Google Scholar]
- 3.Campbell JH, Campbell GR. The cell biology of atherosclerosis-new developments. Aust. N. Z. J. Med. 1997;27:497–500. doi: 10.1111/j.1445-5994.1997.tb02225.x. [DOI] [PubMed] [Google Scholar]
- 4.Choi G, Cheng CP, Wilson NM, Taylor CA. Methods for quantifying three-dimensional deformation of arteries due to pulsatile and nonpulsatile forces: implications for the design of stents and stent grafts. Ann. Biomed. Eng. 2009;37:14–33. doi: 10.1007/s10439-008-9590-0. [DOI] [PubMed] [Google Scholar]
- 5.Choi G, Xiong G, Cheng CP, Taylor CA. Methods for characterizing human coronary artery deformation from cardiac-gated computed tomography data. IEEE Trans. Biomed. Eng. 2014;61:2582–2592. doi: 10.1109/TBME.2014.2323333. [DOI] [PubMed] [Google Scholar]
- 6.Choi G, Chen J, Carroll J, Cheng CP. Handbook of Vascular Motion. New York: Elsevier; 2019. pp. 87–116. [Google Scholar]
- 7.Cucina A, Sterpetti AV, Pupelis G, Fragale A, Lepidi S, Cavallaro A, Giustiniani Q, D’Angelo LS. Shear stress induces changes in the morphology and cytoskeleton organisation of arterial endothelial cells. Eur. J. Vasc. Endovasc. Surg. 1995;9:86–92. doi: 10.1016/s1078-5884(05)80230-8. [DOI] [PubMed] [Google Scholar]
- 8.Cunningham KS, Gotlieb AI. The role of shear stress in the pathogenesis of atherosclerosis. Lab. Invest. 2005;85:9–23. doi: 10.1038/labinvest.3700215. [DOI] [PubMed] [Google Scholar]
- 9.Ding Z, Friedman MH. Dynamics of human coronary arterial motion and its potential role in coronary atherogenesis. J. Biomech. Eng. 2000;122:488–492. doi: 10.1115/1.1289989. [DOI] [PubMed] [Google Scholar]
- 10.Dolan JM, Kolega J, Meng H. High wall shear stress and spatial gradients in vascular pathology: a review. Ann. Biomed. Eng. 2013;41:1411–1427. doi: 10.1007/s10439-012-0695-0. [DOI] [PMC free article] [PubMed] [Google Scholar]
- 11.Gatland IR. Numerical integration of Newton’s equations including velocity-dependent forces. Am. J. Phys. 1994;62:259–265. [Google Scholar]
- 12.George SJ, Johnson J. Atherosclerosis: molecular and cellular mechanisms. New York: Wiley; 2010. [Google Scholar]
- 13.Gimbrone MA, García-Cardeña G. Vascular endothelium, hemodynamics, and the pathobiology of atherosclerosis. Cardiovasc. Pathol. 2013;22:9–15. doi: 10.1016/j.carpath.2012.06.006. [DOI] [PMC free article] [PubMed] [Google Scholar]
- 14.Girard PR, Nerem RM. Shear stress modulates endothelial cell morphology and F-actin organization through the regulation of focal adhesion-associated proteins. J. Cell. Physiol. 1995;163:179–193. doi: 10.1002/jcp.1041630121. [DOI] [PubMed] [Google Scholar]
- 15.Green J, Waters S, Shakesheff K, Byrne H. A mathematical model of liver cell aggregation in vitro. Bull. Math. Biol. 2009;71:906–930. doi: 10.1007/s11538-008-9387-1. [DOI] [PubMed] [Google Scholar]
- 16.Haghighipour N, Tafazzoli-Shadpour M, Shokrgozar MA, Amini S. Effects of cyclic stretch waveform on endothelial cell morphology using fractal analysis. Artif. Org. 2010;34:481–490. doi: 10.1111/j.1525-1594.2010.01003.x. [DOI] [PubMed] [Google Scholar]
- 17.Helmlinger G, Geiger R, Schreck S, Nerem R. Effects of pulsatile flow on cultured vascular endothelial cell morphology. J. Biomech. Eng. 1991;113:123–131. doi: 10.1115/1.2891226. [DOI] [PubMed] [Google Scholar]
- 18.Hsu H-J, Lee C-F, Kaunas R. A dynamic stochastic model of frequency-dependent stress fiber alignment induced by cyclic stretch. PLoS ONE. 2009;4:e4853. doi: 10.1371/journal.pone.0004853. [DOI] [PMC free article] [PubMed] [Google Scholar]
- 19.Jamali Y, Azimi M, Mofrad MR. A sub-cellular viscoelastic model for cell population mechanics. PLoS ONE. 2010;5:e12097. doi: 10.1371/journal.pone.0012097. [DOI] [PMC free article] [PubMed] [Google Scholar]
- 20.Jufri NF, Mohamedali A, Avolio A, Baker MS. Mechanical stretch: physiological and pathological implications for human vascular endothelial cells. Vasc. Cell. 2015;7:8. doi: 10.1186/s13221-015-0033-z. [DOI] [PMC free article] [PubMed] [Google Scholar]
- 21.Kang J, Steward RL, Kim Y, Schwartz RS, LeDuc PR, Puskar KM. Response of an actin filament network model under cyclic stretching through a coarse grained Monte Carlo approach. J. Theor. Biol. 2011;274:109–119. doi: 10.1016/j.jtbi.2011.01.011. [DOI] [PMC free article] [PubMed] [Google Scholar]
- 22.Kaunas R, Hsu H-J. A kinematic model of stretch-induced stress fiber turnover and reorientation. J. Theor. Biol. 2009;257:320–330. doi: 10.1016/j.jtbi.2008.11.024. [DOI] [PubMed] [Google Scholar]
- 23.Lee C-F, Haase C, Deguchi S, Kaunas R. Cyclic stretch-induced stress fiber dynamics—dependence on strain rate, Rho-kinase and MLCK. Biochem. Biophys. Res. Commun. 2010;401:344–349. doi: 10.1016/j.bbrc.2010.09.046. [DOI] [PubMed] [Google Scholar]
- 24.Levesque M, Nerem R. The elongation and orientation of cultured endothelial cells in response to shear stress. J. Biomech. Eng. 1985;107:341–347. doi: 10.1115/1.3138567. [DOI] [PubMed] [Google Scholar]
- 25.Levesque M, Sprague E, Schwartz C, Nerem R. The influence of shear stress on cultured vascular endothelial cells: the stress response of an anchorage-dependent mammalian cell. Biotechnol. Prog. 1989;5:1–8. [Google Scholar]
- 26.Meza D. The Effect of Combined Fluid Shear Stress and Cyclic Tensile Stretch on Vascular Endothelial Cells. New York: State University of New York at Stony Brook; 2017. [Google Scholar]
- 27.Moore JE, Jr, Bürki E, Suciu A, Zhao S, Burnier M, Brunner HR, Meister J-J. A device for subjecting vascular endothelial cells to both fluid shear stress and circumferential cyclic stretch. Ann. Biomed. Eng. 1994;22:416–422. doi: 10.1007/BF02368248. [DOI] [PubMed] [Google Scholar]
- 28.Nerem RM, Levesque MJ, Cornhill J. Vascular endothelial morphology as an indicator of the pattern of blood flow. J. Biomech. Eng. 1981;103:172–176. doi: 10.1115/1.3138275. [DOI] [PubMed] [Google Scholar]
- 29.Ngu H, Lu L, Oswald SJ, Davis S, Nag S, Yin F. Strain-induced orientation response of endothelial cells: effect of substratum adhesiveness and actinmyosin contractile level. Mol. Cell. Biomech. 2008;5:69. [PubMed] [Google Scholar]
- 30.Noria S, Xu F, McCue S, Jones M, Gotlieb AI, Langille BL. Assembly and reorientation of stress fibers drives morphological changes to endothelial cells exposed to shear stress. Am. J. Pathol. 2004;164:1211–1223. doi: 10.1016/S0002-9440(10)63209-9. [DOI] [PMC free article] [PubMed] [Google Scholar]
- 31.Ohashi T, Sato M. Remodeling of vascular endothelial cells exposed to fluid shear stress: experimental and numerical approach. Fluid Dyn. Res. 2005;37:40–59. [Google Scholar]
- 32.Ookawa K, Sato M, Ohshima N. Changes in the microstructure of cultured porcine aortic endothelial cells in the early stage after applying a fluid-imposed shear stress. J. Biomech. 1992;25:1321–1328. doi: 10.1016/0021-9290(92)90287-b. [DOI] [PubMed] [Google Scholar]
- 33.Osborn EA, Rabodzey A, Dewey CF, Hartwig JH. Endothelial actin cytoskeleton remodeling during mechanostimulation with fluid shear stress. Am. J. Physiol. Cell Physiol. 2006;290:C444–C452. doi: 10.1152/ajpcell.00218.2005. [DOI] [PubMed] [Google Scholar]
- 34.Owatverot TB, Oswald SJ, Chen Y, Wille JJ, Yin FC. Effect of combined cyclic stretch and fluid shear stress on endothelial cell morphological responses. J. Biomech. Eng. 2005;127:374–382. doi: 10.1115/1.1894180. [DOI] [PubMed] [Google Scholar]
- 35.Pakravan, H., M. Saidi, and B. Firoozabadi. A mechanical model for morphological response of endothelial cells under combined wall shear stress and cyclic stretch loadings. Biomechanics and Modeling in Mechanobiology:1-15, 2016. [DOI] [PubMed]
- 36.Pakravan HA, Saidi MS, Firoozabadi B. FSI simulation of a healthy coronary bifurcation for studing the mechanical stimuli of endothelial cells under different physiological conditions. J. Mech. Med. Biol. 2015 doi: 10.1142/S021951941550089X. [DOI] [Google Scholar]
- 37.Pakravan HA, Saidi MS, Firoozabadi B. A multiscale approach for determining the morphology of endothelial cells at a coronary artery. Int. J. Numer. Methods Biomed. Eng. 2017;33:e2891. doi: 10.1002/cnm.2891. [DOI] [PubMed] [Google Scholar]
- 38.Pao Y, Lu J, Ritman E. Bending and twisting of an in vivo coronary artery at a bifurcation. J. Biomech. 1992;25:287–295. doi: 10.1016/0021-9290(92)90026-w. [DOI] [PubMed] [Google Scholar]
- 39.Reneman RS, Arts T, Hoeks AP. Wall shear stress–an important determinant of endothelial cell function and structure–in the arterial system in vivo. J. Vasc. Res. 2006;43:251–269. doi: 10.1159/000091648. [DOI] [PubMed] [Google Scholar]
- 40.Sáez P, Malvè M, Martínez M. A theoretical model of the endothelial cell morphology due to different waveforms. J. Theor. Biol. 2015;379:16–23. doi: 10.1016/j.jtbi.2015.04.038. [DOI] [PubMed] [Google Scholar]
- 41.Sipkema P, van der Linden PJ, Westerhof N, Yin FC. Effect of cyclic axial stretch of rat arteries on endothelial cytoskeletal morphology and vascular reactivity. J. Biomech. 2003;36:653–659. doi: 10.1016/s0021-9290(02)00443-8. [DOI] [PubMed] [Google Scholar]
- 42.Stamenović D, Lazopoulos KA, Pirentis A, Suki B. Mechanical stability determines stress fiber and focal adhesion orientation. Cell. Mol. Bioeng. 2009;2:475–485. doi: 10.1007/s12195-009-0093-3. [DOI] [PMC free article] [PubMed] [Google Scholar]
- 43.Suciu A, Civelekoglu G, Tardy Y, Meister J-J. Model for the alignment of actin filaments in endothelial cells subjected to fluid shear stress. Bull. Math. Biol. 1997;59:1029–1046. doi: 10.1007/BF02460100. [DOI] [PubMed] [Google Scholar]
- 44.Vogel RA. Coronary risk factors, endothelial function, and atherosclerosis: a review. Clin. Cardiol. 1997;20:426–432. doi: 10.1002/clc.4960200505. [DOI] [PMC free article] [PubMed] [Google Scholar]
- 45.Wang JH-C, Goldschmidt-Clermont P, Wille J, Yin FC-P. Specificity of endothelial cell reorientation in response to cyclic mechanical stretching. J. Biomech. 2001;34:1563–1572. doi: 10.1016/s0021-9290(01)00150-6. [DOI] [PubMed] [Google Scholar]
- 46.Yamada H, Takemasa T, Yamaguchi T. Theoretical study of intracellular stress fiber orientation under cyclic deformation. J. Biomech. 2000;33:1501–1505. doi: 10.1016/s0021-9290(00)00114-7. [DOI] [PubMed] [Google Scholar]
- 47.Yamaguchi T, Yamamoto Y, Liu H. Computational mechanical model studies on the spontaneous emergent morphogenesis of the cultured endothelial cells. J. Biomech. 2000;33:115–126. doi: 10.1016/s0021-9290(99)00159-1. [DOI] [PubMed] [Google Scholar]
- 48.Zeng Y, Yip AK, Teo S-K, Chiam K-H. A three-dimensional random network model of the cytoskeleton and its role in mechanotransduction and nucleus deformation. Biomech. Model. Mechanobiol. 2012;11:49–59. doi: 10.1007/s10237-011-0292-4. [DOI] [PubMed] [Google Scholar]
- 49.Zhao S, Suciu A, Ziegler T, Moore JE, Bürki E, Meister J-J, Brunner HR. Synergistic effects of fluid shear stress and cyclic circumferential stretch on vascular endothelial cell morphology and cytoskeleton. Atertio. Thromb. Vasc. Biol. 1995;15:1781–1786. doi: 10.1161/01.atv.15.10.1781. [DOI] [PubMed] [Google Scholar]
- 50.Ziegler T, Bouzourène K, Harrison VJ, Brunner HR, Hayoz D. Influence of oscillatory and unidirectional flow environments on the expression of endothelin and nitric oxide synthase in cultured endothelial cells. Atertio. Thromb. Vasc. Biol. 1998;18:686–692. doi: 10.1161/01.atv.18.5.686. [DOI] [PubMed] [Google Scholar]