

Abstract
Oxidative damage results in protein modification and is observed in many diseases, such as heart failure and renal insufficiency. Human serum albumin is an index of oxidative change and is conventionally measured using high-performance liquid chromatography (HPLC). Although this method is more sensitive than the colorimetric method, it is time-consuming for clinical practice and the sera must be stored at –80°C before analysis. To overcome these limitations, in the present study we developed a new reagent for a more rapid and convenient quantification of oxidative stress, involving determination of the ratio of human nonmercaptalbumin to total albumin using a colorimetric method with bromocresol purple. The clinical utility of the developed reagent was confirmed by demonstrating the consistently higher oxidative stress levels in dialysis patients than in healthy control subjects, matching the results of the conventional HPLC method. This novel approach could be a valuable tool for immediate estimation of the state of oxidative stress during the course of disease and treatment, and could aid clinical treatment decisions.
Keywords: serum albumin, bromocresol purple, human mercaptalbumin, human nonmercaptalbumin, dialysis patients, oxidative stress
Introduction
The generation of excess reactive oxygen species beyond the scavenging ability of cells results in a state of oxidative stress, which is a major characteristic of many diseases, such as heart failure and renal insufficiency. Therefore, proper evaluation and control of oxidative stress is expected to help prevent such diseases. The major oxidative stress markers currently used in clinical settings include aldehyde lipid peroxides, such as 4-hydroxy-2-nonenal and malondialdehyde, along with protein oxides, such as 8-hydroxy-2-deoxyguanosine;(1,2) however, there is still no standardized method for evaluation of oxidative stress.
Human serum albumin (HSA) is the most abundant oxidative stress marker in the blood and is, thus, a useful marker to estimate the degree of oxidative stress. HSA comprises a mixture of human mercaptalbumin (HMA, reduced form) and nonmercaptalbumin (HNA, oxidized form). The conversion of HMA to HNA via an intermolecular SH/SS exchange reaction (i.e., mercapt-nonmercapt conversion) is reported to play an important role in the management of oxidative stress in the body, functioning as a scavenger of oxidation products.(3,4) Therefore, the ratio of HNA to total serum albumin (%HNA) is markedly increased in the blood of patients with various diseases and some physical conditions compared with that in healthy subjects.(2–7) In addition, blood purification techniques, such as hemodialysis, can increase the %HMA and decrease the %HNA, contributing to the consistent state of oxidative stress in dialysis patients.(3,4) Sogami et al.(3,4) reported that high-performance liquid chromatography (HPLC) analysis of HSA on Asahipak GS-520 columns at neutral pH showed three peaks: the principal component corresponding to HMA, and the secondary and tertiary components corresponding to HNA carrying mixed disulfides. Therefore, %HNA serves as a reliable biomarker of oxidative stress in human serum. However, the HPLC analysis of HSA is a time-consuming process and the sera must be stored at −80°C to prevent the conversion of HMA to HNA at room temperature (about 20°C), 3°C, and −20°C.(8,9) Therefore, we sought to develop a new, more rapid, method to estimate the %HNA.
Toward this end, we established a dye-binding method with advantages of reduced cost and suitability for automation, allowing for its routine use in the evaluation of several samples in a standard clinical laboratory simultaneously. Bromocresol green has been shown to overestimate the serum albumin concentration as a result of non-specific reactions with some serum proteins,(10,11) whereas bromocresol purple (BCP) reacts only with albumin, and shows excellent agreement with the results of electroimmunoassays.(12) Given a difference in the reaction of HMA and HNA with BCP, Muramoto et al.(13) developed a new method that reduced this reaction by the addition of sodium dodecyl sulfate (SDS) and 5,5'-dithiobis(2-nitrobenzoic acid) (DTNB) to the BCP reagent (i.e., the improved BCP method).
In the present study, we applied and further optimized the BCP method with regard to the difference in the reaction between HMA and HNA and validated its performance in measuring the %HNA, compared to that of conventional HPLC, as a marker of oxidative stress. We further evaluated the clinical utility of the developed reagent for screening patients with a high degree of oxidative stress. For this purpose, we targeted dialysis patients whose oxidative stress levels are consistently high owing to exposure to uremic substances, and the inflammatory cytokines produced by dialysis membranes, the dialysate, and dialysis circuit.(12) In addition, the degree of oxidative stress was shown to decrease in parallel with the removal of uremic substances after dialysis.(13) Therefore, we also compared the ability of our newly developed reagent to detect the decrease in oxidative stress after dialysis in comparison to oxidative stress levels estimated in healthy controls. This newly optimized BCP reagent can facilitate the rapid and convenient detection of oxidative stress to improve diagnosis and treatment monitoring for more immediate clinical decisions.
Materials and Methods
Subjects
Control blood samples were obtained from healthy young volunteers (n = 86; mean age, 32 ± 12.4 years). Sera were separated from the blood samples by centrifugation at 1,800 × g for 5 min and divided into two samples: one serum sample was immediately frozen and stored at –80°C until the analysis, and the other was stored at room temperature. For assessment of the clinical utility of the new method, sera were also obtained from 85 patients (53 men, 32 women, mean age 62 ± 14.9 years) undergoing maintenance hemodialysis. After obtaining informed consent, blood samples were collected immediately before and after hemodialysis. Ethical approval for this study was obtained from Kyushu University Institutional Review Board for Clinical Research (27-369).
Optimization of the BCP method
A HITACHI 7150 automated analyzer was used for assessment of HNA using the optimized BCP reagents. Two reagents (reagent A and B) were prepared. Reagent A, used to measure total albumin, was prepared according to the method of Muramoto et al.(13) The final concentration of reagent A is mentioned in Table 1. We then searched for the optimal condition for developing the new reagent B that would be the most sensitive for HNA. When we developed the reagent B, we specifically varied the type and concentration of the surfactant in the reagents, pH of the buffer solution, sample volume, and BCP dye concentration to find the combination with maximum sensitivity to HNA, and determined the reagent composition in this order. The final concentration of reagent B is mentioned in Table 2. Measurement for each sample was done in the same way. First, 180 µl of reagent 1 (R1) was added to the serum and left to react at 37°C after stirring for 5 min; this was followed by the addition of 90 µl of reagent 2 (R2). After reacting at 37°C, with stirring for 5 min, the absorbance was measured at 605 nm (main) and 660 nm (sub) (Fig. 1). For comparison, the HNA levels in the same samples were determined using HPLC according to the method described by Sogami et al.(3)
Table 1.
Final concentration of reagent A used to measure total albumin quantity
| Volume (µl) | Reagent | Final concentration | |
|---|---|---|---|
| Sample | 2 | ||
| R1 | 180 | Succinate buffer (pH 5.6) | 120 (mM) |
| Triton X-100 | 0.1 (%) | ||
| SDS | 0.02 (%) | ||
| DTNB | 66.7 (µM) | ||
| R2 | 90 | Succinate buffer (pH 5.6) | 120 (mM) |
| BCP | 50 (µM) | ||
| Triton X-100 | 0.1 (%) | ||
Table 2.
Final concentration of reagent B used to measure HNA
| Volume (µl) | Reagent | Final concentration | |
|---|---|---|---|
| Sample | 4 | ||
| R1 | 180 | Succinate buffer (pH 4.8) | 123 (mM) |
| Triton X-405 | 0.2 (%) | ||
| R2 | 90 | Succinate buffer (pH 4.8) | 123 (mM) |
| BCP | 150 (µM) | ||
| Triton X-405 | 0.2 (%) | ||
Fig. 1.

Schematic of the method for determining the quantities of total albumin (reagent A) and human nonmercaptalbumin (HNA) (reagent B).
Optimization of the type and concentration of surfactant
We examined the optimal condition for reagent B using three kinds of surfactants: Triton X-405 (Sigma-Aldrich, Tokyo, Japan), Triton X-100 and Brij 35 (FUJIFILM Wako Pure Chemical Corporation, Osaka, Japan), at five surface-active concentrations (0.1, 0.2, 0.3, 0.4, and 0.5%). The Day (0) control specimen and Day (6) oxidation specimen were used to determine the oxidation rate (A) according to the following formula.
A (%) = {[Day (x) – Day (0)]/[Day (0) – Blank]} × 100
Where Day (0) indicates the absorbance value of the serum stored at −80°C immediately after blood collection, Day (x) indicates the absorbance of the serum stored at room temperature on day X after drawing the blood, and Blank indicates the absorbance of the control saline sample. Because the oxidation rate in serum preserved at room temperature was higher than that in serum preserved at −80°C, we considered that the reagent showing a difference in reaction at the two temperature conditions would be the one that most strongly reacted with HNA. Therefore, [Day (0) – Blank] is the denominator, which indicates the sensitivity to serum albumin of the BCP method, and [Day (x) – Day (0)] in the numerator reflects the increase in HNA relative to that in the sample stored at room temperature on Day X. In other words, the oxidation rate (A) indicates the sensitivity of HNA in albumin, which is considered to reflect the degree of the increase in HNA in a subtler manner. In this study, we used the serum stored for six days at room temperature. All other conditions were the same, with a buffer pH of 5.6, sample volume of 8 µl, and final concentration of BCP dye being 50 µM. The pH was selected based on the method reported previously.(13)
Optimization of the pH of the buffer solution
For reagent B, we examined the optimal condition for using succinic acid buffers with pH 4.4, 4.6, 4.8, and 5.0. The oxidation rate (A) was measured from the Day (0) control specimen and Day (6) oxidation specimen. Other conditions were the same, with 0.2% Triton X-405 used a surfactant, a sample volume of 8 µl, and the final concentration of BCP dye being 50 µM.
Optimization of the sample volume
For a reagent B, we next examined the optimal condition of sample volume with 8, 6, 4, or 2 µl. The oxidation rate (A) was measured from the Day (0) control specimen and Day (6) oxidation specimen. Other conditions were fixed with a surfactant of 0.2% Triton X-405, pH 4.8 of the buffer and final concentration of BCP dye of 50 µM.
Optimization of BCP dye concentration
For a reagent B, we next examined the optimal condition of BCP dye concentration with 250, 200, 150, 100, or 50 µM. The oxidation rate (A) was measured from the Day (0) control specimen and Day (6) oxidation specimen. Other conditions were fixed with a surfactant of 0.2% Triton X-405, pH 4.8 of the buffer and sample volume of 4 µl.
HNA assessment in serum samples
The estimated ratio of HNA using the two optimized reagents (reagent A and B) was calculated using the following formula:
Estimated ratio of HNA ≒ Absorbance using reagent B/Absorbance using reagent A
Because reagent A was developed by correcting the discrepancy between the reaction of HMA and HNA with the reagent that had better accuracy for total albumin, while maintaining high specificity of BCP, SDS and DTNB were added to effectively convert HMA to HNA.(13) Therefore, the denominator in this formula expresses the quantity of total albumin. Reagent B was developed to react most strongly with HNA. Thus, we established the above formula to estimate ratio of HNA of samples.
Statistical analysis
Analysis of variance was used to compare the results of the normal healthy control, pre-dialysis, and post-dialysis groups using the JMP software (SAS Institute Inc., Cary, NC). P<0.05 was considered statistically significant.
Results
Optimization of the type and concentration of surfactant
Under fixed conditions of a buffer with pH 5.6, sample volume of 8 µl, and 50 µM BCP dye, the oxidation ratio (A) decreased with increasing concentration of the surfactant for all the surfactants tested. Among the three kinds of surfactants, 0.1% Triton X-405 demonstrated the highest reactivity, followed by 0.2% Triton X-405. However, the reaction stability of the reagent and albumin was poor, and plasticity at the time of measurement decreased, resulting in a low surfactant concentration; therefore, 0.2% Triton X-405 was considered the optimal surfactant for the new reagent (Fig. 2A).
Fig. 2.

Reagent optimization for reaction with human nonmercaptalbumin (HNA) in albumin. The vertical axis indicates the absorbance percentage calculated by the equation [(Day (x) – Day (0))/(Day (0) – Blank)] × 100. Data represent means ± SD. (A) Optimization for surfactant concentration. The horizontal axis indicates various surfactant concentrations tested under the fixed condition with buffer pH 5.6, sample volume of 8 µl, and final concentration of bromocresol purple (BCP) dye being 50 µM. The number of experiments was three. (B) Optimization for pH of the succinate buffer. The horizontal axis indicates the pH of the succinate buffer under the fixed condition with 0.2% Triton X-405 as the surfactant, sample volume of 8 µl, and final concentration of BCP dye being 50 µM. The number of experiments was two. (C) Optimization for the volume of serum sample. The horizontal axis indicates the sample volume under the fixed condition with 0.2% Triton X-405, buffer pH 4.8, and final concentration of BCP dye being 50 µM. Samples were used in triplicate and the number of experiments was three. (D) Optimization for the BCP dye concentration. The horizontal axis indicates the BCP dye concentration under the fixed condition with 0.2% Triton X-405 as the surfactant in the reagent, buffer pH 4.8, and sample volume of 4 µl. Samples were used in triplicate and the number of experiments was three.
Optimization of the pH of the buffer solution
With the surfactant fixed at 0.2% Triton X-405, sample volume of 8 µl, and final concentration of BCP dye being 50 µM, the highest oxidation percentage was detected when the pH of the buffer was 4.8 (Fig. 2B).
Optimization of the sample volume
Using 0.2% Triton X-405, the buffer with pH 4.8, and final concentration of BCP dye being 50 µM, the highest oxidation percentage was found using a sample volume of 6 µl, followed by 8 and 4 µl (Fig. 2C). However, the performance of reagent requires some dilution linearity; in the case of 6 or 8 µl sample volume, the deviation rate from the theoretical value of dilution linearity was high. Therefore, we selected 4 µl as the optimal sample volume because some linearity was confirmed (Fig. 3A).
Fig. 3.

Linearity curve for bromocresol purple (BCP) development reagents. Samples were used in triplicate. Data represent means ± SD. (A) Linearity curve when changing the sample volume. The deviation ratios from the theoretical value of dilution linearity are ~10.6%–37.0% (8 µl), ~8.7%–25.6% (6 µl), ~5.7%–14.5% (4 µl), ~2.2%–4.5% (2 µl). (B) Linearity curve when changing the concentration of BCP dye. The deviation ratios from the theoretical value of dilution linearity are ~0.3%–0.6% (250 µM), ~0.6 %–1.3% (200 µM), ~1.6%–2.4% (150 µM), ~3.2%–5.4% (100 µM), and ~6.6%–15.1% (50 µM).
Optimization of BCP dye concentration
Using 0.2% Triton X-405 as the surfactant in the reagent, the buffer with pH 4.8, and a sample volume of 4 µl, we assessed the influence of different concentrations of BCP. As the BCP concentration increased, there was a clear drop in the oxidation rate (Fig. 2D). Because the lowest concentration of BCP dye did not demonstrate dilution linearity, we chose a concentration of 150 µM for optimization, which displayed linearity (Fig. 3B).
Comparison of the clinical utility and performance of the optimized BCP method with conventional HPLC
Figure 4A and B show the comparisons of %HNA or ratio of HNA between the healthy group and pre-dialysis group and post-dialysis groups using HPLC and the optimized BCP method. In the HPLC results, there was a significant difference in the %HNA between the healthy and pre-dialysis groups, and between the pre-dialysis and post-dialysis groups (p<0.01), whereas there was no significant difference between the healthy and post-dialysis groups (p = 0.37, Fig. 4A). However, using the optimized BCP method, there was a significant difference in ratio of HNA detected among all the groups (p<0.01, Fig. 4B). Comparison of the same specimen showed that ratio of HNA in the post-dialysis group increased in 17 of 85 patients when the BCP method was used, whereas the %HNA decreased in all patients of the post-dialysis group, according to the HPLC results (Fig. 4C and D). Finally, the correlation between ratio of HNA assessed using the optimized BCP method with the new development reagent (y) and %HNA determined with the HPLC method (x) considering all the three groups was y = 0.0056x + 2.53 (r = 0.53) (Fig. 5). When considering the difference only between the healthy and pre-dialysis groups, the correlation increased to y = 0.0071x + 2.45 (r = 0.66).
Fig. 4.
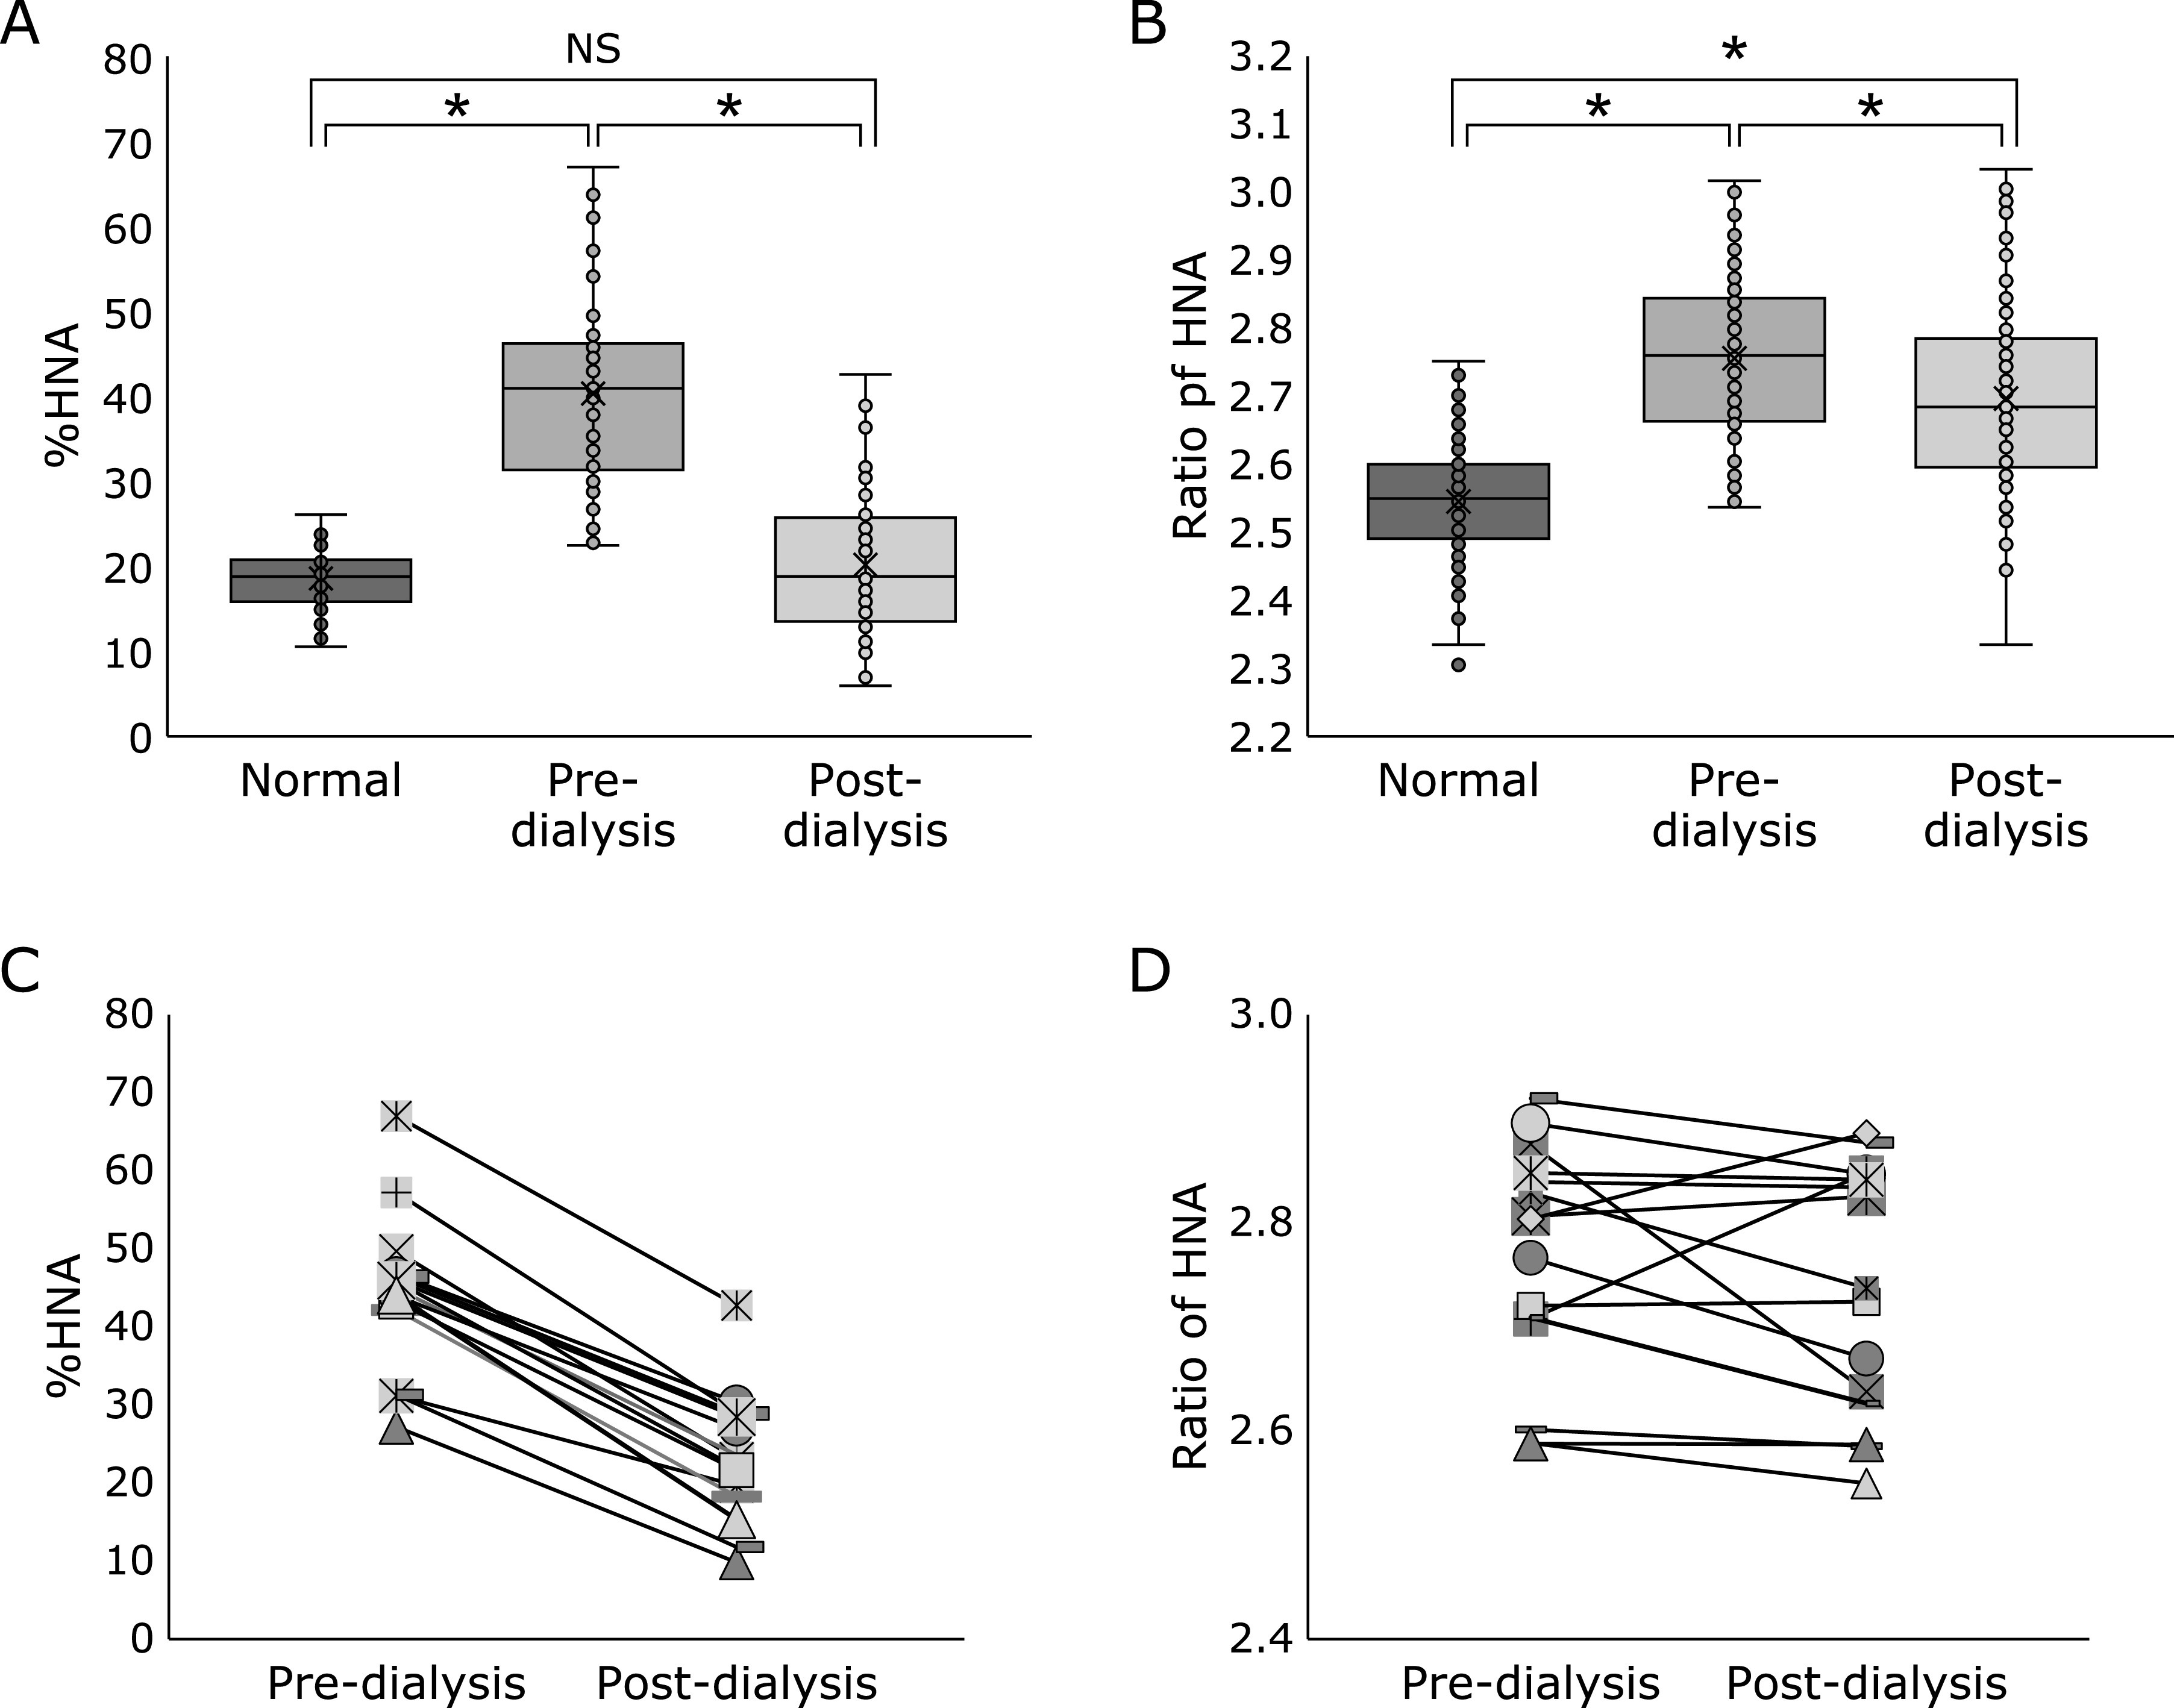
Comparison of %HNA or ratio of HNA among the normal (n = 86), pre-dialysis (n = 85), and post-dialysis (n = 85) groups using dot plots employing (A) HPLC and (B) new development reagent for BCP. *p<0.01; NS, not significant. (C) and (D) show comparison of %HNA or ratio of HNA between the pre-dialysis (n = 15) and post-dialysis (n = 15) groups using dot plots.
Fig. 5.

Correlation of the results obtained with the new development reagent for the bromocresol purple (BCP) method and HPLC. Samples were normal group (n = 86), and pre-dialysis group (n = 85), and post-dialysis group (n = 85) group.
Discussion
The %HNA of the total serum albumin for clinical assessments of oxidative stress is conventionally measured with HPLC.(14) However, this method is time-consuming and requires specialized and expensive equipment, thus limiting its widespread applicability. To overcome these limitations, we developed an updated colorimetric method using a new reagent that reflects the HNA level in serum and can be measured by an automated analyzer. The color intensity in the BCP method obtained with albumin differs for HMA and HNA with changing conditions, which is due to a structural change in albumin at the time of the reaction.(13) By exploiting this characteristic, we developed a reagent that showed a more sensitive response for HNA. As a result, the most suitable condition to measure the quantity of HNA using the BCP method was determined to be 0.2% Triton X-405 as the surfactant, pH 4.8 of the buffer, a sample volume of 4 µl, and BCP dye at a final concentration of 150 µM.
In addition, we evaluated the clinical utility of the developed reagent for screening patients with a high degree of oxidation stress using serum from patients obtained during the enforcement of maintenance hemodialysis. Oxidation stress is considered to be related to the condition of a patient at disease onset and can also reflect the disease progression during hemodialysis. Moreover, oxidation stress is considered to be perpetually high during hemodialysis.(15) Indeed, the serum from the pre-dialysis group showed a greater level of oxidative stress compared to that from the normal, healthy control group using the developed reagent, as measured by ratio of HNA, which was consistent with the results of conventional HPLC. Similarly, both the new method and conventional HPLC showed consistently higher levels of oxidative stress in the pre-dialysis group compared to those in the post-dialysis group. However, comparison of pre- and post-dialysis results for the same patients showed a greater HNA abundance in the post-dialysis specimens in 17 out of 85 patients, which was in contrast to the HPLC results. This inconsistency is considered to be due to the influence of an interference factor that cannot capture the post-dialysis drop in the oxidation rate. Patients undergoing hemodialysis typically take various drugs, such as heparin to prevent blood coagulation as well as antihypertensive agents to prevent complications, such as heart disease and stroke. In particular, in this study, blood was collected as a pre-dialysis specimen before heparin administration, which is used for extracorporeal blood circulation, and as a post-dialysis specimen immediately after heparin administration was completed. Therefore, it is considered that the sample after dialysis contains excessive heparin. In the BCP method used for samples after dialysis, it has been reported that heparin causes turbidity and cross-reaction with fibrinogen, resulting in an error.(16) Therefore, it is conceivable that the sample collected after dialysis also shows a pseudo high value due to the effect of heparin. In addition, there are many potential factors that can affect the specimen after dialysis. In view of these facts, and considering the results of this study, we do not recommend this method for post-dialysis patients.
Accordingly, we believe that the optimized BCP method is a useful and reliable tool for screening the high HNA levels at the onset of disease. Measuring the high state of HNA at an early stage can provide guidance for timely intervention to prevent diseases related to oxidative stress, such as cardiovascular diseases, chronic obstructive pulmonary disease, chronic kidney disease, neurodegenerative diseases, and cancer.(17)
In future work, we plan to validate the clinical utility of this method for patients with other types of diseases related to oxidative stress.
Author Contributions
YK was the principal investigator and developed the concept for the study. TI, SY, HO, and HY contributed to the conception and design of the study. SY and TI wrote the paper. All authors reviewed and approved the final version of the manuscript.
Acknowledgments
The authors acknowledge the support received at the Kidney, Hypertension, and Cerebrovascular Medicine department of Kyushu University Hospital for collection of samples.
Abbreviations
- BCP
bromocresol purple
- DTNB
5,5'-dithiobis(2-nitrobenzoic acid)
- HMA
human mercaptalbumin
- HNA
human nonmercaptalbumin
- HPLC
high-performance liquid chromatography
- HSA
human serum albumin
- SDS
sodium dodecyl sulfate
Conflicts of Interest
No potential conflicts of interest were disclosed.
References
- 1.Niki E. Biomarkers of lipid peroxidation in clinical material. Biochim Biophys Acta 2014; 1840: 809–817. [DOI] [PubMed] [Google Scholar]
- 2.Kasai H. Analysis of 8-hydroxyguanosine as a marker of oxidative stress. Foods Food Ingredients J 2001; 194: 10–16. [Google Scholar]
- 3.Sogami M, Era S, Nagaoka S, et al. HPLC-studies on nonmercapt-mercapt conversion of human serum albumin. Int J Pept Protein Res 1985; 25: 398–402. [DOI] [PubMed] [Google Scholar]
- 4.Sogami M, Era S, Nagaoka S, et al. High-performance liquid chromatographic studies on non-mercapt in equilibrium with mercapt conversion of human serum albumin. II. J Chromatogr 1985; 332: 19–27. [DOI] [PubMed] [Google Scholar]
- 5.Era S, Hamaguchi T, Sogami M, et al. Further studies on the resolution of human mercapt- and nonmercaptalbumin and on human serum albumin in the elderly by high-performance liquid chromatography. J Chromatogr 1988; 31: 435–442. [DOI] [PubMed] [Google Scholar]
- 6.Suzuki E, Yasuda K, Takeda N, et al. Increased oxidized form of human serum albumin in patients with diabetes mellitus. Diabetes Res Clin Pract 1992; 18: 153–158. [DOI] [PubMed] [Google Scholar]
- 7.Terawaki H, Yoshimura K, Hasegawa T, et al. Oxidative stress is enhanced in correlation with renal dysfunction: examination with the redox state of albumin. Kidney Int 2004; 66: 1988–1993. [DOI] [PubMed] [Google Scholar]
- 8.Era S, Kuwata K, Imai H, Nakamura K, Hayashi T, Sogami M. Age-related change in redox state of human serum albumin. Biochim Biophys Acta 1995; 1247: 12–16. [DOI] [PubMed] [Google Scholar]
- 9.Hayashi T, Imai H, Kuwata K, Sogami M, Era S. The importance of sample preservation temperature for analysis of the redox state of human serum albumin. Clin Chim Acta 2002; 316: 175–178. [DOI] [PubMed] [Google Scholar]
- 10.Gustafsson JE. Improved specificity of serum albumin determination and estimation of “acute phase reactants” by use of the bromocresol green reaction. Clin Chem 1976; 22: 616–622. [PubMed] [Google Scholar]
- 11.Webster D. A study of the interaction of bromocresol green with isolated serum globulin fractions. Clin Chim Acta 1974; 53: 109–115. [DOI] [PubMed] [Google Scholar]
- 12.Pinnell AE, Northam BE. New automated dye-binding method for serum albumin determination with bromocresol purple. Clin Chem 1978; 1: 80–86. [PubMed] [Google Scholar]
- 13.Muramoto Y, Matsushita M, Irino T. Reduction of reaction differences between human mercaptalbumin and human nonmercaptalbumin measured by the bromocresol purple method. Clin Chim Acta 1999; 289: 69–78. [DOI] [PubMed] [Google Scholar]
- 14.Nakae H, Tomida K, Kikuya Y, Okuyama M, Igarashi T. Comparison of quality of human serum albumin preparations in two pharmaceutical products. Acute Med Surg 2017; 4: 251–254. [DOI] [PMC free article] [PubMed] [Google Scholar]
- 15.Taki K, Takayama F, Tsuruta Y, Niwa T. Oxidative stress, advanced glycation end product, and coronary artery calcification in hemodialysis patients. Kidney Int 2006; 70: 218–224. [DOI] [PubMed] [Google Scholar]
- 16.Muramoto Y. Kesseiarubumin no nichijyoukensahou [Routinely clinical methods of serum albumin]. Med Technol 2004; 32: 731–737 (in Japanese). [Google Scholar]
- 17.Liguori I, Russo G, Curcio F, et al. Oxidative stress, aging, and diseases. Clin Interv Aging 2018; 13: 757–772. [DOI] [PMC free article] [PubMed] [Google Scholar]