

Abstract
Mitotic spindle microtubules (MTs) undergo continuous poleward flux, whose driving force and function in humans remain unclear. Here, we combined loss‐of‐function screenings with analysis of MT‐dynamics in human cells to investigate the molecular mechanisms underlying MT‐flux. We report that kinesin‐7/CENP‐E at kinetochores (KTs) is the predominant driver of MT‐flux in early prometaphase, while kinesin‐4/KIF4A on chromosome arms facilitates MT‐flux during late prometaphase and metaphase. Both these activities work in coordination with kinesin‐5/EG5 and kinesin‐12/KIF15, and our data suggest that the MT‐flux driving force is transmitted from non‐KT‐MTs to KT‐MTs by the MT couplers HSET and NuMA. Additionally, we found that the MT‐flux rate correlates with spindle length, and this correlation depends on the establishment of stable end‐on KT‐MT attachments. Strikingly, we find that MT‐flux is required to regulate spindle length by counteracting kinesin 13/MCAK‐dependent MT‐depolymerization. Thus, our study unveils the long‐sought mechanism of MT‐flux in human cells as relying on the coordinated action of four kinesins to compensate for MT‐depolymerization and regulate spindle length.
Keywords: kinesins, kinetochore, microtubules, mitosis, mitotic spindle
Subject Categories: Cell Adhesion, Polarity & Cytoskeleton; Cell Cycle
The mysterious phenomenon of continuous mitotic microtubule flux is found to be associated with regulation of spindle length after establishment of stable end‐on kinetochore‐microtubule attachments.
Introduction
Microtubule (MT) poleward flux is an evolutionarily conserved process in metazoan spindles and is defined as a continuous poleward motion of MTs, typically coordinated with addition of new tubulin subunits at the MT plus‐ends and their removal at the MT minus‐ends at spindle poles (Forer, 1965; Bajer & Molè‐Bajer, 1972; Hiramoto & Izutsu, 1977; Hamaguchi et al, 1987; Mitchison, 1989). Although its functions remain unclear, MT‐flux was proposed to play a role in various aspects of mitosis. For instance, MT‐flux has been implicated in the regulation of spindle length (Gaetz & Kapoor, 2004; Rogers et al, 2004; Fu et al, 2015; Renda et al, 2017). However, this role remains controversial, as attenuation of MT‐flux led to spindle elongation in Drosophila embryos (Rogers et al, 2004) and Xenopus egg extracts (Gaetz & Kapoor, 2004), while its reduction in human cells either had no effect on spindle length (Ganem et al, 2005; Jiang et al, 2017), or resulted in shorter spindles (Maffini et al, 2009; Fu et al, 2015). Additionally, MT‐flux was proposed to regulate kinetochore (KT) activity (Maddox et al, 2003) and chromosome movements (Rogers et al, 2004; Ganem et al, 2005), mediate the correction of erroneous KT‐MT attachments (Ganem et al, 2005), and equalize spindle forces at metaphase KTs prior to their segregation (Matos et al, 2009).
In addition to its unclear function, the molecular mechanism underlying MT‐flux also remains controversial. Two main models were proposed to drive spindle MT‐flux. The first model envisions MT‐flux to be driven by kinesin‐13‐induced depolymerization of MT minus‐ends at the spindle poles (Rogers et al, 2004; Ganem et al, 2005). However, several lines of evidence have challenged this model. In particular, fluorescence speckle microscopy in newt lung cells showed no flux in astral MTs (Waterman‐Storer et al, 1998), which originate at the poles and extend toward the cell cortex. Moreover, laser microsurgery experiments on KT‐MTs (also called k‐fibers) revealed normal MT‐flux despite stable MT minus‐ends detached from the spindle poles (Maiato et al, 2004; Matos et al, 2009). Finally, MTs continued to flux at unchanged rates even when MT‐depolymerization at spindle poles was inhibited by controlled mechanical compression applied to metaphase mitotic spindles (Dumont & Mitchison, 2009). Together, these experiments demonstrate that MT‐flux can be uncoupled from MT minus‐end depolymerization.
The second model proposes that MT‐depolymerization (and polymerization) are a response to kinesin‐5‐mediated sliding of antiparallel interpolar MTs (Brust‐Mascher & Scholey, 2002; Miyamoto et al, 2004; Matos et al, 2009; Pereira & Maiato, 2012), which could then be translated from interpolar‐ to KT‐MTs via MT crosslinking molecules (Shimamoto et al, 2011; Vladimirou et al, 2013). However, this mechanism was challenged by experiments showing that inhibition of kinesin‐5 (EG5 in humans) only slightly reduced MT‐flux rates both in bipolar and monopolar spindles (Cameron et al, 2006). Moreover, the ability of monopolar spindles to flux (Cameron et al, 2006) further suggests that antiparallel interpolar MTs do not play an essential role in this process in mammalian cells.
Thus, although MT‐flux has been studied over three decades, the molecular mechanisms underlying spindle MT‐flux, as well as its cellular function(s), remain to be elucidated. In this study, we demonstrate that MT‐flux is sequentially driven from prometaphase to metaphase by CENP‐E/kinesin‐7 at KTs and KIF4A/kinesin‐4 on chromosome arms, respectively, and these kinesins work in close cooperation with the MT‐crosslinking motors EG5 and KIF15. We further propose that these activities are coordinated with the action of the MT‐crosslinking molecules HSET and NuMA, which couple non‐KT‐MTs to KT‐MTs, thereby ensuring a uniform distribution of spindle forces on metaphase KTs.
Lastly, we shed new light on the cellular function of MT‐flux in human cells and propose a role in the regulation of mitotic spindle length by counteracting MCAK‐mediated MT‐depolymerizing activity on KT‐MTs.
Results
KIF4A mediates MT‐flux
In order to gain insight into the molecular mechanisms underlying MT‐flux in human cells, we combined RNA interference (RNAi; Fig EV1) and chemical inhibitors with photoactivation‐based spinning disk confocal live‐cell imaging of late prometaphase/metaphase bipolar spindles and S‐trityl‐l‐cysteine (STLC)‐treated monopolar spindles in U2OS cells stably expressing photoactivatable (PA)‐GFP tubulin (Fig 1A–C, [Link], [Link]). We tested established contributors to MT‐flux (kinesin‐13/KIF2A, CLASP1 + 2 and kinesin‐5/EG5), as well as several additional potential candidates (kinesin‐12/KIF15, kinesin‐7/CENP‐E, kinesin‐10/hKID, and kinesin‐4/KIF4A). KIF2A was investigated because of its ability to depolymerize MT minus‐ends at spindle poles and because of its previous implication in MT‐flux (Ems‐McClung & Walczak, 2010), whereas CLASPs contribute to MT polymerization at the KT (Maiato et al, 2005; Maffini et al, 2009). hKID and KIF4A are chromokinesins, MT plus‐end directed motor proteins localized on chromosome arms that generate chromosomal polar ejection forces (PEFs), promoting proper positioning of chromosome arms and accurate chromosome alignment and segregation (Rieder et al, 1986; Rieder & Salmon, 1994; Vernos et al, 1995; Antonio et al, 2000; Funabiki & Murray, 2000; Levesque & Compton, 2001; Mazumdar et al, 2004; Brouhard & Hunt, 2005; Wandke et al, 2012; Barisic et al, 2014; Tipton et al, 2017; Dong et al, 2018). KIF4A also interacts with PRC1 at interpolar MTs, facilitating accurate cytokinesis (Zhu & Jiang, 2005). CENP‐E is a KT‐ and MT‐localized plus‐end directed motor protein required for congression of peripheral chromosomes and proper chromosome segregation (Yen et al, 1991; Schaar et al, 1997; Wood et al, 1997; Kapoor et al, 2006; Barisic et al, 2014). KIF15 is another plus‐end directed motor with the ability to slide antiparallel MTs in a way similar to EG5 (Tanenbaum et al, 2009; Drechsler et al, 2014). Analysis of sum‐projected kymographs (Fig 1D) excluded EG5, KIF15, and hKID as strong individual drivers of MT‐flux (Fig 1E and F). However, depletion of KIF4A revealed a strong contribution to MT‐flux, not only in bipolar spindles (0.32 ± 0.14 μm/min, compared with 0.61 ± 0.22 μm/min in controls), as previously reported (Wandke et al, 2012), but also in monopolar spindles (0.33 ± 0.11 μm/min, compared with 0.5 ± 0.14 μm/min in controls). Intriguingly, while inhibition of CENP‐E did not significantly affect MT‐flux in bipolar spindles (0.52 ± 0.21 μm/min; see also (Logarinho et al, 2012)), we detected a significant reduction of MT‐flux in monopolar spindles (0.34 ± 0.07 μm/min; Fig 1E and F). As expected, depletion of KIF2A and CLASPs led to a strong reduction in flux rates in bipolar (0.17 ± 0.12 μm/min and 0.27 ± 0.18 μm/min, respectively (see also (Maffini et al, 2009)) and monopolar spindles (0.17 ± 0.09 μm/min and 0.28 ± 0.07 μm/min, respectively; Fig 1E and F), consistent with their respective roles in MT minus‐end depolymerization and plus‐end polymerization. These data are consistent with either of the proposed models of flux; however, in one model, KIF2A and CLASPs are interpreted as flux drivers, whereas in the other these are interpreted as part of cell's response to flux to regulate spindle length.
Figure EV1. Efficient RNAi‐mediated knockdown of selected MT‐flux driving candidates.
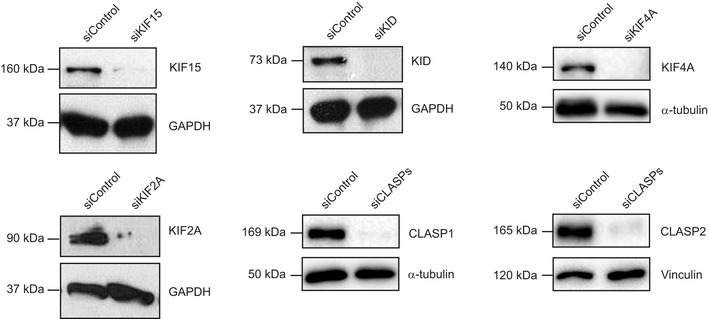
Immunoblot analysis of lysates from U2OS cells stably expressing PA‐GFP/mCherry‐α‐tubulin treated with control or indicated siRNAs. Antibodies against respective proteins were used to validate siRNA mediated knockdown, with GAPDH, α‐tubulin and vinculin serving as the loading controls.
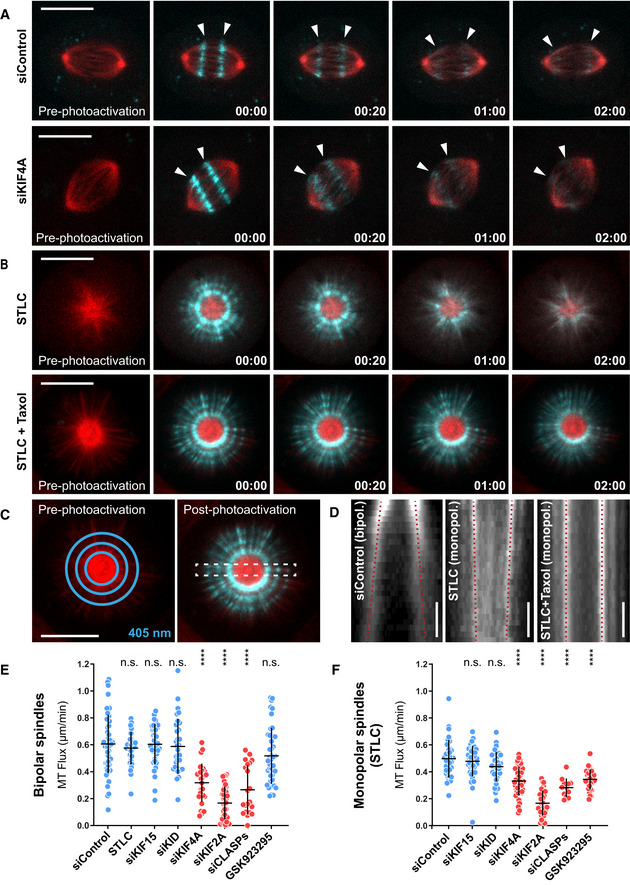
Figure 1. KIF4A mediates MT‐flux.
-
ARepresentative spinning disk confocal live‐cell imaging time series of U2OS cells stably co‐expressing PA‐GFP-α‐tubulin (cyan) and mCherry‐α‐tubulin (red), treated with control and KIF4A siRNAs. White arrowheads highlight poleward motion of the photoactivated regions due to MT‐flux. Scale bars, 10 μm. Time, min:s.
-
BRepresentative spinning disk confocal live‐cell imaging time series images of S‐trityl‐l‐cysteine (STLC)‐treated U2OS cells stably co‐expressing PA‐GFP-α‐tubulin (cyan) and mCherry‐α‐tubulin (red). Note that MT‐flux is abrogated in the presence of taxol (lower panel). Scale bars, 10 μm. Time, min:s.
-
CIllustration of 405 nm laser‐photoactivated regions in monopolar spindles (blue circles, left). The effect of photoactivation and region selected for kymograph generation (dashed white rectangle, right). Scale bar, 10 μm.
-
DCorresponding kymograph profiles of the photoactivated regions in bipolar and monopolar spindles used for quantification of the flux rates (red dotted lines highlight MT‐flux slopes). Scale bars, 30 s.
-
E, FQuantification of MT‐flux in bipolar (E) and monopolar (F) spindles subjected to indicated treatments. Graphs represent MT‐flux of individual cells with mean ± SD. N (number of cells, number of independent experiments): – bipolar spindles: siControl (49, 5), STLC (31, 3), siKIF15 (39, 3), siKID (32, 3), siKIF4A (28, 3), siKIF2A (36, 3), siCLASPs (21, 2), GSK923295 (44, 3); – monopolar spindles: siControl (35, 3), siKIF15 (44, 3), siKID (38, 3), siKIF4A (44, 3), siKIF2A (38, 3), siCLASPs (12, 2), GSK923295 (33, 3). P‐values were calculated against control using one‐way ANOVA and Kruskal–Wallis H‐test. n.s.—not significant, ****P ≤ 0.0001.
KIF4A drives MT‐flux via its chromosome arm‐based motor activity
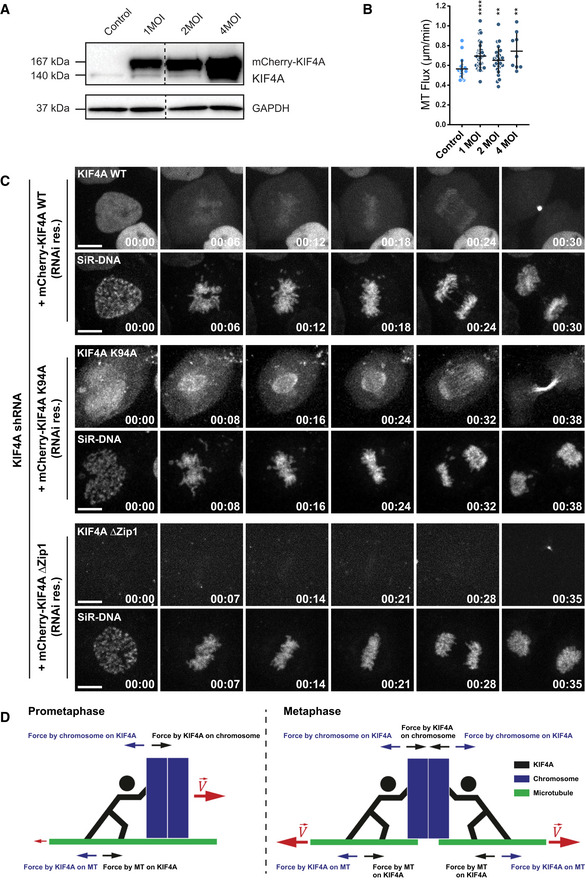
Because of its strong contribution, we sought to characterize the molecular mechanisms by which the chromokinesin KIF4A drives MT‐flux. First, we examined the effect of KIF4A overexpression on MT‐flux rates. To do so, we designed a dose‐response system by cloning KIF4A into an adenoviral vector to infect target cells with increasing virus titers (multiplicity of infection ratios [MOI]; Fig EV2A). KIF4A overexpression resulted in increased MT‐flux rates (Fig EV2B), supporting the hypothesis that KIF4A drives MT‐flux. Although RNAi and overexpression experiments clearly showed the importance of KIF4A for MT‐flux, it remained unclear how KIF4A contributed to this process. To address this question, we conditionally reconstituted KIF4A‐depleted cells expressing near physiological levels of RNAi‐resistant versions of wild‐type KIF4A, the ATPase‐dead K94A motor mutant, and a chromatin non‐binding KIF4A mutant (∆Zip1) that was still able to bind to central spindle interpolar MTs (Wu & Chen, 2008; Sigl et al, 2014) (Figs 2A and B, and EV2C and Movie EV3). While wild‐type KIF4A successfully rescued the reduced MT‐flux rates in KIF4A RNAi cells (0.53 ± 0.15 μm/min, compared with 0.57 ± 0.1 μm/min in uninduced cells and to 0.29 ± 0.13 μm/min in KIF4A shRNA), neither the motor mutant (K94A; 0.32 ± 0.14 μm/min, compared with 0.61 ± 0.15 μm/min in uninduced cells), nor the chromatin‐binding mutant (ΔZip1; 0.3 ± 0.1 μm/min, compared with 0.63 ± 0.13 μm/min in uninduced cells) were able to recover MT‐flux rates (Fig 2A and C). These results indicate that both the motor activity and localization of KIF4A on chromosome arms are essential for MT‐flux (Fig 2D).
Figure EV2. Evaluation of localization of KIF4A expression variants and the effect of KIF4A overexpression on MT‐flux.
- Immunoblot analysis of cell lysates obtained from U2OS cells stably expressing PA‐GFP-α‐tubulin infected with different multiplicity of infection (MOI) ratios of mCherry‐KIF4A expressing adenovirus. Expression levels of KIF4A upon adenoviral titration were detected using anti‐KIF4A antibody, with GAPDH as loading control.
- Quantification of the MT‐flux rates upon KIF4A overexpression. The individual values and their mean ± SD are plotted. N (number of cells, number of independent experiments): Control (untreated) (23, 3); 1 MOI (33, 3); 2 MOI (26, 3), 4 MOI (9, 1). P‐values were calculated using Mann–Whitney U‐test. **P ≤ 0.01, ****P ≤ 0.0001.
- Representative spinning disk confocal live‐cell imaging time series images of U2OS PA-GFP‐α‐tubulin cells conditionally co‐expressing KIF4A shRNA and RNAi‐resistant mCherry‐KIF4A variants induced using doxycycline. Chromosomes were stained using SiR‐DNA. Scale bars, 10 μm. Time, h:min.
- Schematic model illustrating KIF4A‐mediated forces in MT‐flux driving. Forces exerted by KIF4A motors promote motion of chromosomes relative to MTs. Once a bi‐oriented chromosome aligns at the metaphase plate, KIF4A forces can no longer do work on it. Rather, the reactive force on MTs may promote non‐KT-MTs to flux toward the poles.
Figure 2. KIF4A drives MT‐flux via its chromosome arm‐based motor activity.
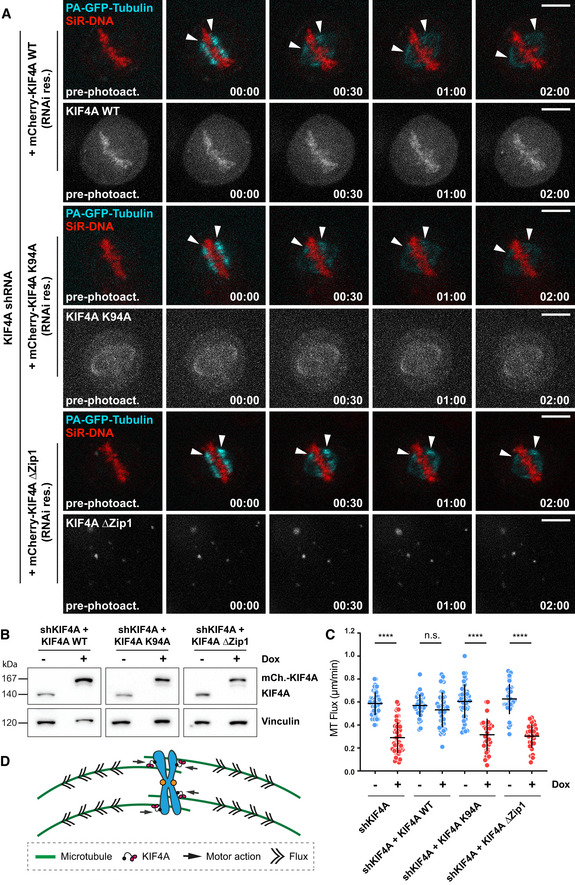
- Representative spinning disk confocal live‐cell imaging time series images of U2OS PA-GFP‐α‐tubulin cells conditionally co‐expressing KIF4A shRNA and RNAi‐resistant mCherry‐Kif4A variants induced using doxycycline. Chromosomes were stained using SiR‐DNA. White arrowheads highlight poleward flux of the photoactivated regions. Scale bar, 10 μm. Time, min:s.
- Representative immunoblot of cell lysates obtained before and after doxycycline induction to validate the efficiency of KIF4A shRNA construct and expression of the RNAi‐resistant mCherry‐KIF4A variants. The anti‐KIF4A antibody was used, together with anti‐vinculin antibody as a loading control.
- Quantification of MT‐flux upon shRNA‐mediated depletion of KIF4A alone or in combination with conditional expression of the RNAi‐resistant mCherry‐KIF4A variants. The bars in graph represent mean ± SD. N (number of cells, number of independent experiments): uninduced shKIF4A (48, 4), shKIF4A (60, 4), uninduced KIF4A WT (36, 5), shKIF4A + KIF4A WT (43, 5), uninduced KIF4A K94A (42, 7), shKIF4A + KIF4A K94A (38, 6), uninduced KIF4A ΔZip1 (32, 4), and shKIF4A + ΔZip1 (30, 4). P‐values were calculated using Student's t‐test and Mann–Whitney U‐test. n.s.—not significant, ****P ≤ 0.0001.
- Model illustrating chromosome arms‐localized KIF4A driving MT‐flux.
Based on these data, we speculate that after helping chromosomes to congress to the metaphase plate during early mitosis (Wandke et al, 2012), KIF4A cannot push the chromosomes any further due to equivalent forces applied from opposite spindle sides. Nevertheless, processive KIF4A on interacting MTs would provide the reactive force necessary to drive poleward flux (Fig EV2D).
To further elucidate the involvement of chromatin in MT‐flux, we established U2OS cells to undergo mitosis with unreplicated genomes (MUGs) (Brinkley et al, 1988; O'Connell et al, 2008), in which chromatin is physically detached from spindle MTs (Figs 3A and C, and EV4B, and Movie EV4). In agreement with the data obtained using KIF4A mutants, MT‐flux in bipolar MUG spindles was strongly reduced (0.31 ± 0.13 μm/min, compared with 0.5 ± 0.13 μm/min in control cells treated with caffeine alone; Fig 3B), consistent with the importance of chromatin as the locus of KIF4A activity relevant for MT‐flux. However, other features that are normally present in MUGs, such as merotelic KT‐MT attachments, cannot be excluded to contribute to the observed attenuation of MT‐flux.
Figure 3. Bipolar spindles with expelled chromatin in MUGs exhibit reduced MT‐flux.
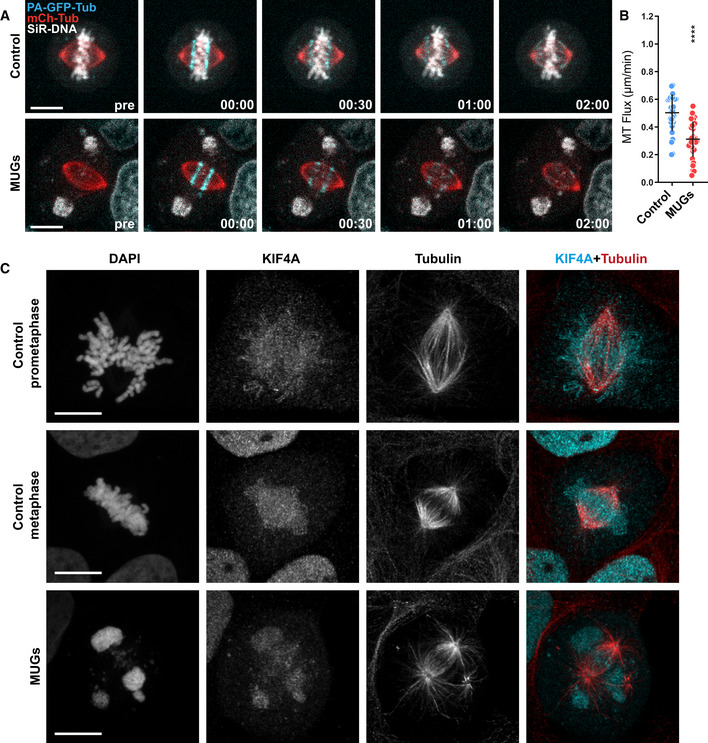
- Representative spinning disk confocal time series of MT‐flux in bipolar spindles in control cells and cells undergoing mitosis with unreplicated genomes (MUGs). U2OS cells stably co‐expressing PA‐GFP-α‐tubulin (cyan) and mCherry‐α‐tubulin (red), labeled for chromosomes with SiR‐DNA (gray) are shown, with 5 mM caffeine used as a control. Scale bar, 10 μm. Time, min:s.
- Quantification of the MT‐flux rates from indicated conditions. MT‐flux values with mean ± SD are plotted. N (number of cells, number of independent experiments): Caffeine‐only control (30, 3) and MUGs (34, 3). P‐values from Mann–Whitney U‐test. ****P ≤ 0.0001.
- Representative point‐scanning confocal maximum‐intensity projected images of mitotic spindles in U2OS cells subjected to indicated conditions, immunostained with antibodies against KIF4A and α‐tubulin. DNA was counterstained with DAPI. KIF4A in cyan and α‐tubulin in red in merged image. Scale bar, 10 μm.
Figure EV4. Analysis of CENP‐E contribution to MT‐flux in the absence of stable end‐on KT‐MT attachments.
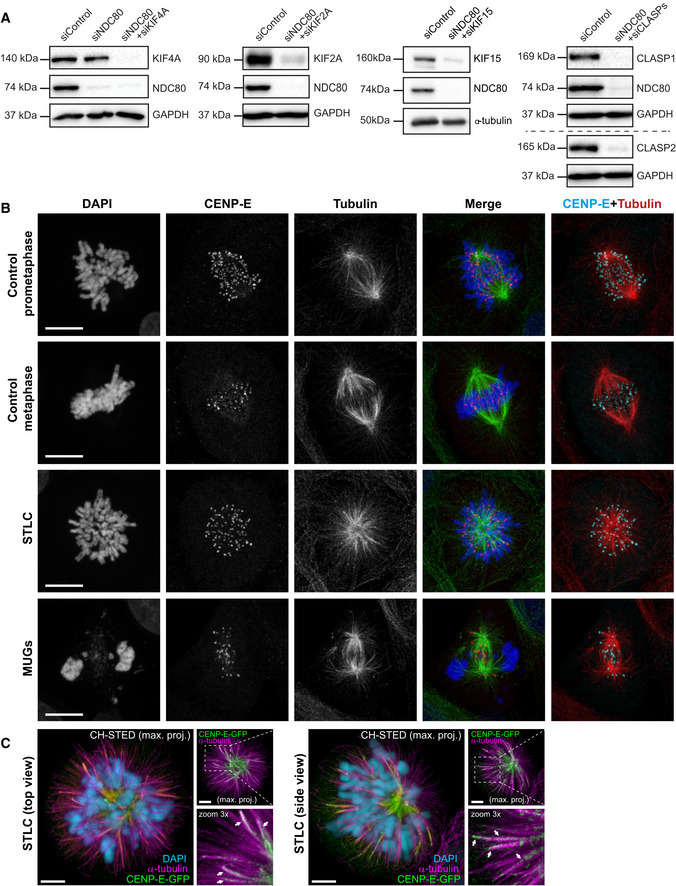
- Immunoblot analyses of the efficiency of knockdown from U2OS cells stably expressing PA‐GFP/mCherry‐α‐tubulin treated with control or indicated siRNAs, with GAPDH or α‐tubulin used as the loading control.
- Representative point‐scanning confocal maximum intensity projections of control, STLC‐treated and MUGs mitotic spindles in U2OS cells, immunostained with antibodies against CENP‐E and α‐tubulin. DNA was counterstained with DAPI. CENP‐E in red, α‐tubulin in green and DNA in blue in merged image. Scale bar, 10 μm.
- CH‐STED analyses of HeLa cells stably expressing CENP‐E-GFP treated with STLC to induce the formation of monopolar spindles. A top view and a side view of different monopolar spindles are shown. Chromosomes (confocal mode only) were revealed in the larger panels with DAPI (cyan) and MTs (magenta) were detected with an anti‐α‐tubulin antibody. Arrows indicate examples of clear MT bundles. Scale bar in all panels is 5 μm.
The MT‐crosslinking proteins HSET and NuMA facilitate the distribution of MT‐flux associated spindle forces on metaphase chromosomes
If our model based on KIF4A driving MT‐flux from chromosome arms was correct, one would predict that the action of MT crosslinking molecules is required to transmit spindle forces from fluxing non‐KT‐MTs to KT‐MTs, as proposed by the “coupled spindle” model (Matos et al, 2009). In order to test this hypothesis, we investigated the contribution of three well‐established MT‐crosslinking proteins to MT‐flux, namely NuMA, kinesin‐14/HSET, and PRC1. NuMA localizes to the spindle poles together with the MT minus‐end‐directed motor Dynein to crosslink and focus MT minus‐ends (Merdes et al, 1996; Radulescu & Cleveland, 2010; Hueschen et al, 2017). HSET is a MT minus‐end‐directed kinesin motor with the ability to crosslink and slide antiparallel MTs, thereby generating an inward force within the spindle, similar to that proposed for Dynein (Mountain et al, 1999). PRC1 is involved in the assembly of the central spindle during late mitosis (Mollinari et al, 2002) and acts as a crosslinker between KT‐MTs and bridging interpolar MTs throughout mitosis (Kajtez et al, 2016; Polak et al, 2017; Vukusic et al, 2017; Suresh et al, 2020). We found that, while depletion of NuMA and/or HSET significantly reduced MT‐flux rates (0.48 ± 0.13, 0.36 ± 0.13, and 0.35 ± 0.16 μm/min, respectively; Figs 4A and B, and EV3A, and Movie EV5), depletion of PRC1 had no such effect (0.61 ± 0.22 μm/min, compared with 0.61 ± 0.22 μm/min in control cells; Figs 4B and EV3A). Thus, KIF4A's requirement for MT‐flux is independent of its PRC1‐dependent localization at interpolar MTs (Kurasawa et al, 2004; Nguyen et al, 2018), further strengthening the argument of its association with chromatin in driving MT‐flux.
Figure 4. The MT‐crosslinking proteins HSET and NuMA facilitate the distribution of MT‐flux associated spindle forces on metaphase chromosomes.
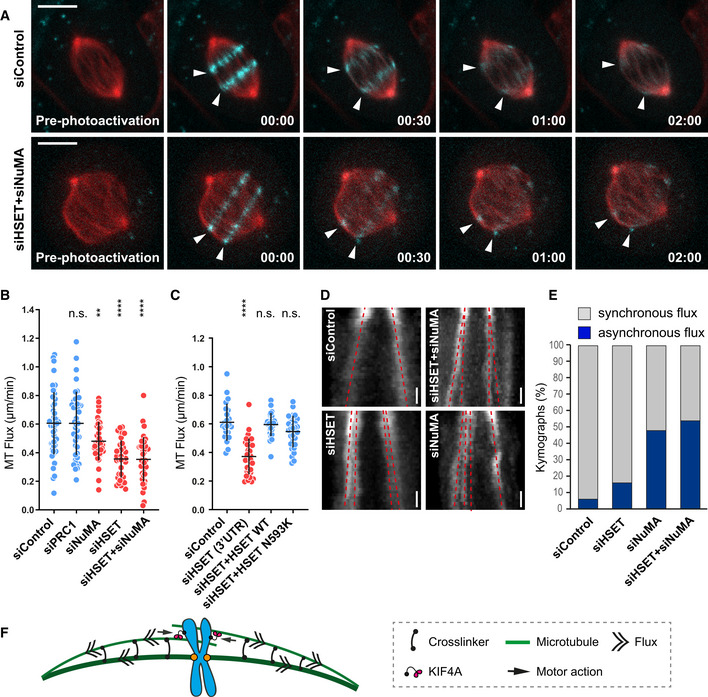
- Representative spinning disk confocal live‐cell image series of MT‐flux in U2OS cells stably co‐expressing PA‐GFP-α‐tubulin (cyan) and mCherry‐α‐tubulin (red) treated with indicated siRNAs. White arrowheads highlight poleward motion of the photoactivated regions due to MT‐flux. Scale bars, 10 μm. Time, min:s.
- Quantification of the impact of the MT‐crosslinking proteins on MT‐flux in U2OS PA‐GFP/mCherry‐α‐tubulin cells transfected with respective siRNAs. Graph represent MT‐flux values with mean ± SD. N (number of cells, number of independent experiments): siControl (49, 5), siPRC1 (45, 3), siNuMA (40, 3), siHSET (37, 3), and siHSET + siNuMA (39, 3). P‐values were calculated against control using one‐way ANOVA. n.s., not significant, **P ≤ 0.01, ****P ≤ 0.0001.
- Quantification of the impact of the motor activity of HSET on MT‐flux in U2OS cells stably expressing mEOS‐α‐tubulin treated with control or HSET 3′UTR siRNAs in presence or absence of the respective RNAi‐resistant GFP‐HSET constructs. Graph represent MT‐flux values with mean ± SD. N (number of cells, number of independent experiments): siControl (23, 3), siHSET 3′UTR (33, 3), siHSET 3′UTR + HSET WT (29, 5), and siHSET 3′UTR + HSET N593K (30, 4). P‐values were calculated against control using one‐way ANOVA. n.s., not significant, ****P ≤ 0.0001.
- Representative kymographs of the photoactivated spindles from (B) displaying asynchronous flux motion (split of the two red dashed lines toward individual poles) upon RNAi‐mediated depletion of MT‐crosslinkers. Scale bars, 30 s.
- Percentage of cells with asynchronous flux movements calculated from (B).
- Model illustrating the role of MT‐crosslinking activities of NuMA and HSET in uniform distribution of poleward forces across the mitotic spindle.
Figure EV3. Analysis of the roles of MT‐crosslinking proteins NuMA, HSET and PRC1 in MT‐flux.
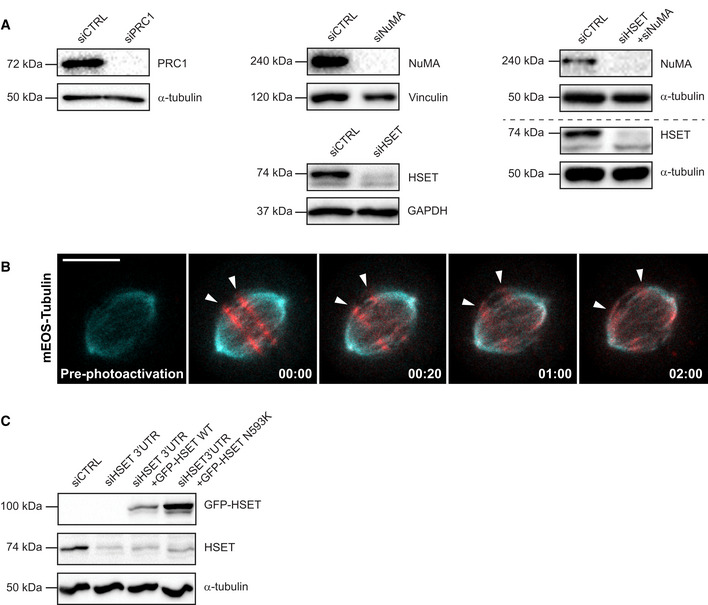
- Immunoblot analysis of the respective knockdown efficiencies in U2OS cells stably expressing PA-GFP/mCherry‐α‐tubulin treated with control or indicated siRNAs. GAPDH, α‐tubulin and vinculin were used as a loading control.
- Spinning disk confocal time series images of photoconverted mEOS‐α‐tubulin (red) in U2OS cells stably expressing mEOS‐α‐tubulin (cyan). White arrowheads highlight the photoconverted regions fluxing toward the poles. Scale bar, 10 μm. Time, min:s.
- Immunoblot analysis of U2OS cells stably expressing mEOS‐α‐tubulin transfected with control or HSET 3′UTR‐targeting siRNAs and co‐transfected with the RNAi‐resistant GFP‐HSET constructs. Expression levels of HSET was observed using anti‐HSET antibody with α‐tubulin serving as the loading control.
In order to dissect whether the contribution of HSET for MT‐flux depends on its MT‐crosslinking ability, or on its motor activity, we designed a rescue experiment in which we individually expressed WT HSET and a non‐processive motor mutant that is still able to crosslink MTs (N593K) (Cai et al, 2009b). Because our HSET constructs were GFP‐tagged and could thus interfere with the PA‐GFP tubulin signal, we used a U2OS cell line stably expressing green‐red photoconvertible mEOS‐tubulin (Wandke et al, 2012) (Fig EV3B). By monitoring MT‐flux rates after depletion of endogenous HSET by 3′UTR‐targeting siRNAs (0.37 ± 0.13 μm/min, compared with 0.61 ± 0.13 μm/min in control cells), we observed that both WT HSET and the motor mutant successfully ensured normal MT‐flux (0.59 ± 0.1 μm/min and 0.55 ± 0.11 μm/min, respectively; Figs 4C and EV3C). This suggests that MT‐flux relies on HSET MT‐crosslinking capacity, rather than its motor activity (Fig 4F). Interestingly, spindles depleted of NuMA and HSET revealed a frequent occurrence of asynchronous flux tracks, as inferred from a multi‐stripe pattern on the kymographs of photoactivated spindles (6% in control cells, 16% in HSET RNAi, 48% in NuMA RNAi, and 54% in HSET + NuMA RNAi; Fig 4D and E), suggesting weakened mechanical coupling between non‐KT‐MTs and KT‐MTs. Altogether, these data suggest that MT‐crosslinking activities of NuMA and kinesin‐14/HSET are required to transmit the MT‐flux forces generated on non‐KT‐MTs to KT‐MTs, thereby promoting a uniform distribution of spindle forces on metaphase chromosomes (Fig 4F).
CENP‐E is the predominant driver of MT‐flux in early prometaphase
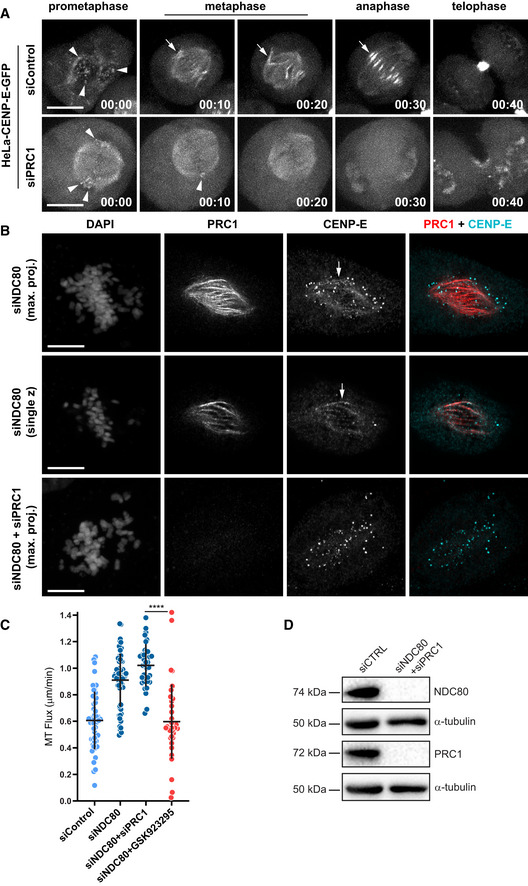
Another prediction of the “coupled spindle” model is that KT‐MTs flux at slightly slower rates compared with non‐KT‐MTs due to imperfect coupling (Matos et al, 2009). Indeed, this was shown to be the case in insect spermatocytes (LaFountain et al, 2004), Xenopus oocyte spindles assembled in vitro (Maddox et al, 2003) and human cells (Lecland & Luders, 2014). To examine this further in human cells, we measured MT‐flux rates after perturbation of end‐on KT‐MT attachments by depletion of NDC80/HEC1, the main MT‐anchoring protein at KTs (Wigge & Kilmartin, 2001; DeLuca et al, 2002; McCleland et al, 2003; Cheeseman et al, 2006; Wei et al, 2007) (Fig EV4A). Indeed, MTs in these cells fluxed faster (0.91 ± 0.2 μm/min; Fig 5A and B, and Movie EV6), suggesting that stable end‐on KT‐MT attachments work as flux brakes, in agreement with the “coupled spindle” model. Remarkably, depletion of KIF4A did not compromise MT‐flux after NDC80 RNAi (Figs 5B and EV4A), suggesting that KIF4A is dispensable for MT‐flux prior to the establishment of end‐on KT‐MT attachments (Figs 4F and EV2D).
Figure 5. CENP‐E is the predominant driver of MT‐flux in early prometaphase.
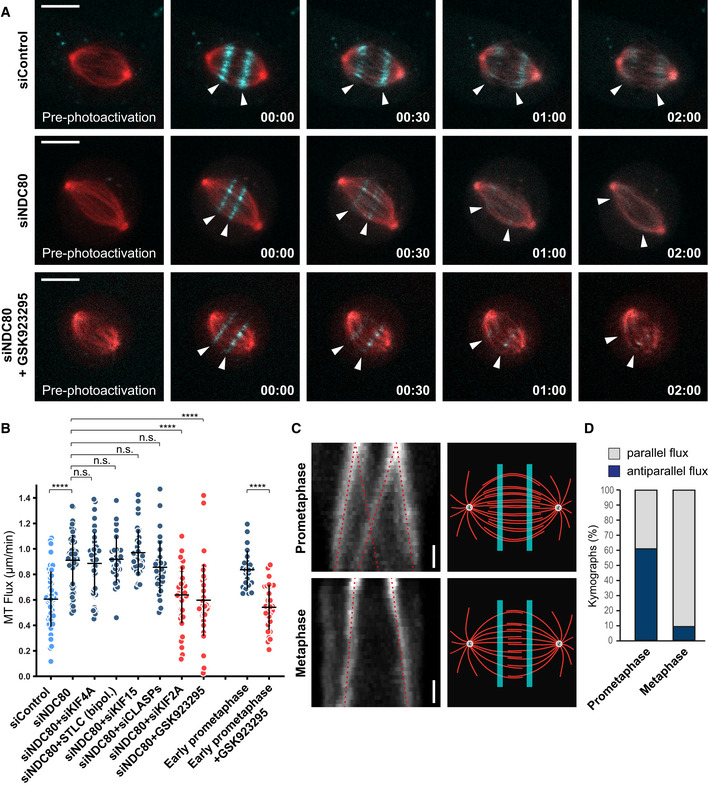
- Representative spinning disk confocal live‐cell time series of MT‐flux in U2OS cells stably co‐expressing PA‐GFP-α‐tubulin (cyan) and mCherry‐α‐tubulin (red) treated with indicated conditions. White arrowheads follow the poleward motion of the photoactivated regions due to MT‐flux. Scale bars, 10 μm. Time, min:s.
- Quantification of the impact of stable end‐on KT‐MT attachments on MT‐flux in NDC80‐depleted cells under indicated conditions and in early prometaphase cells with and without the CENP‐E inhibitor GSK923295. MT‐flux values are plotted with mean ± SD. N (number of cells, number of independent experiments): siControl (49, 5), siNDC80 (59, 6), siNDC80 + siKIF4A (41, 3), siNDC80 + STLC (bipol.) (28, 3), siNDC80 + siKIF15 (36, 4), siNDC80 + siCLASPs (33, 3), siNDC80 + siKIF2A (38, 4), siNDC80 + GSK923295 (38, 3), early prometaphase (23, 3), and early prometaphase + GSK923295 (28, 3). P‐values were calculated using Kruskal–Wallis H‐test compared with siNDC80, except for early prometaphase data for which Student's t‐test was used. n.s., not significant, ****P ≤ 0.0001.
- Kymograph profiles (left) highlighting that the photoactivated regions in prometaphase (upper panel) split and move toward both poles, whereas metaphase spindles (lower panel) flux uniformly toward individual poles (indicated by red dotted lines). Illustration of the photoactivated regions (right) in prometaphase and metaphase spindles, highlighting that interpolar MTs overlap over a broader region in early mitosis, becoming focused at the spindle equator in metaphase. Scale bar, 30 s.
- Percentage of cells with parallel and antiparallel flux movements during prometaphase and metaphase. N (number of cells, number of independent experiments): prometaphase (23, 3), metaphase (22, 3).
To investigate the molecular mechanism underlying MT‐flux before the establishment of stable end‐on KT‐MT attachments, we further examined the potential contributions of EG5 and KIF15 (Figs 5B and EV4A). Similar to the effect of KIF4A depletion, neither EG5 inhibition nor depletion of KIF15 reduced MT‐flux rate after NDC80 RNAi. Since CENP‐E inhibition had a negative impact on MT‐flux rate exclusively in monopolar spindles, which contain less end‐on KT‐MT attachments (Kapoor et al, 2000; Shrestha & Draviam, 2013) (Fig 1E and F), we sought to inhibit CENP‐E in NDC80‐depleted cells. Unlike its knockdown, chemical inhibition of CENP‐E keeps the inactive motor at KTs, allowing its interaction with CLASPs, thus excluding any potential indirect effects (Maffini et al, 2009; Logarinho et al, 2012). Strikingly, CENP‐E inhibition in NDC80‐depleted cells strongly decreased MT‐flux rate (0.6 ± 0.28 μm/min, compared with 0.91 ± 0.2 μm/min in NDC80 RNAi; Fig 5A and B, and Movie EV6), similar to the effect of NDC80 co‐depletion with KIF2A (0.64 ± 0.22 μm/min; Figs 5B and EV4A). Importantly, co‐depletion of NDC80 and CLASPs did not reduce MT‐flux rate (0.86 ± 0.21 μm/min) compared with NDC80 knockdown (Figs 5B and EV3A), in agreement with the recently proposed role of CLASPs in sustaining the growth of KT‐attached MTs necessary for flux (Girao et al, 2020), and further demonstrating the specificity of the observed CENP‐E phenotype.
Taken together, these data suggest that CENP‐E drives MT‐flux in early prometaphase, prior to the establishment of stable end‐on KT‐MT attachments. To directly test this, we first compared flux rates between early and late prometaphase/metaphase and found that MT‐flux in early prometaphase was indeed faster (0.84 ± 0.15 and 0.61 ± 0.22 μm/min, respectively; Figs 5B and EV5A), consistent with the increased flux found in NDC80‐depleted cells. Subsequent measurement of MT‐flux in CENP‐E‐inhibited early prometaphase cells showed a significant decrease in MT‐flux rate (0.54 ± 0.18 μm/min; Fig 5B), comparable to the one observed upon CENP‐E inhibition in NDC80‐depleted cells. We concluded that CENP‐E motor activity is required for MT‐flux prior to the establishment of end‐on KT‐MT attachments, independently from its role in CLASPs recruitment to KTs.
Figure EV5. Distribution of antiparallel interpolar MTs during mitosis.
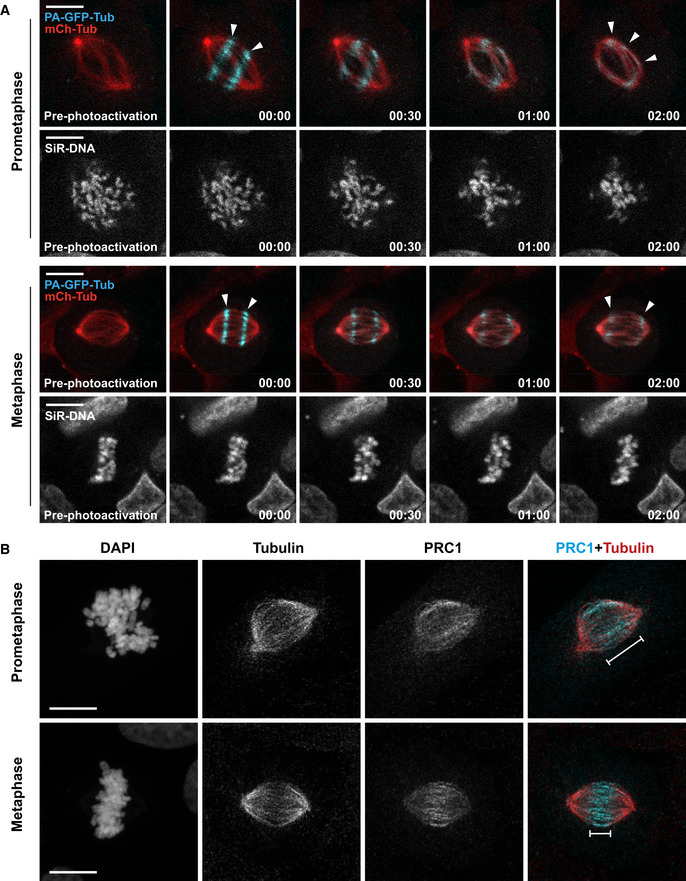
- Representative spinning disk confocal time series of MT‐flux during prometaphase (upper panel) and metaphase (lower panel) in U2OS cells stably co‐expressing PA‐GFP-α‐tubulin (cyan) and mCherry‐α‐tubulin (red), with chromosomes labeled using SiR‐DNA (gray). White arrowheads highlight that the photoactivated regions in prometaphase split and move toward both poles (upper panel), whereas metaphase spindles flux uniformly toward individual poles (lower panel). Scale bars, 10 μm. Time, min:s.
- Representative maximum projections of point‐scanning confocal immunofluorescence images of prometaphase and metaphase spindles in U2OS cells, stained using antibodies against PRC1 and α‐tubulin. DNA was counterstained with DAPI. PRC1 (cyan) and α‐tubulin (red) are shown in merged image. The white line signifies area of PRC1‐stained antiparallel MTs within the spindle. Scale bar, 10 μm.
Unlike in metaphase, photoactivated tubulin marks in early prometaphase showed splitting and moved simultaneously toward both poles (61% in prometaphase, compared with 9% in metaphase; Figs 5C and D, and EV5A, and Movie EV7), as it was observed in in vitro‐assembled Xenopus egg extract spindles (Sawin & Mitchison, 1991). This strongly suggests that interpolar MTs overlap over a broader region in early mitosis, but then become more restricted to the spindle equator as cells reach metaphase. The broad distribution of antiparallel MTs in early mitosis coincides with CENP‐E localization at laterally attached KTs during “prometaphase rosette” configuration (Itoh et al, 2018) (Figs 6A and B, and EV4B), and is consistent with the localization of the antiparallel MT‐crosslinker PRC1, which also covers a wider region in prometaphase (Fig EV5B). To gain a deeper mechanistic insight into how CENP‐E drives MT‐flux in early mitosis, we used super‐resolution coherent‐hybrid STED (CH‐STED) microscopy (Pereira et al, 2019) to more accurately determine CENP‐E localization in the complex context of the mitotic spindle (Fig 6A and B). Surprisingly, apart from its well‐established localization at KTs (Figs 6A and B, and EV4B) (Yen et al, 1991; Schaar et al, 1997; Wood et al, 1997; Kapoor et al, 2006) and antiparallel midzone MTs during late anaphase and telophase (Yen et al, 1991), we found that CENP‐E also localized at interpolar MTs, both in control and NDC80‐depleted early mitotic cells (Fig 6A and B). These observations raised two possible explanations for how CENP‐E could drive MT‐flux prior to the establishment of end‐on KT‐MT attachments. On one hand, given CENP‐E's localization at the expanded fibrous corona of unattached outer KTs during early mitosis (Figs 6A and B, and EV4B), and its lateral association with spindle MT bundles in the absence of K‑fibers (Cai et al, 2009a), KT‐localized CENP‐E might interact with antiparallel interpolar MTs, sliding them apart toward the poles (Fig 6B). This would be consistent with a role for CENP‐E in the transition from lateral to end‐on KT‐MT attachments (Shrestha & Draviam, 2013; Sikirzhytski et al, 2018; Chakraborty et al, 2019). On the other hand, CENP‐E might directly crosslink antiparallel MTs and slide them apart (Fig 6B). To further investigate this novel CENP‐E localization on interpolar MTs in early mitosis, we used HeLa cells stably expressing a bacterial artificial chromosome encoding CENP‐E‐GFP under control of its own promotor (Poser et al, 2008) (Fig 6C and D, and Movie EV8). Both CH‐STED imaging (Fig 6C) and spinning disk confocal live‐cell imaging (Fig 6D and Movie EV8) confirmed the presence of CENP‐E on interpolar MTs throughout mitosis. Noteworthy, CH‐STED imaging clearly showed that CENP‐E exclusively colocalized with more stable spindle MTs and was excluded from astral MTs, in line with our earlier finding that CENP‐E has a bias toward detyrosinated MTs (Barisic et al, 2015). Moreover, CENP‐E‐GFP was associated with non‐KT‐MT bundles, but not with individual astral MTs even in STLC‐treated monopolar spindles, but whether these bundled MTs are parallel or antiparallel could not be determined (Fig EV4C). Thus, CENP‐E localizes to both KTs and non‐KT‐MT bundles (including antiparallel MTs) throughout mitosis in human cells.
Figure 6. CENP‐E localizes to KTs and MT bundles, including overlapping antiparallel MTs during early mitosis.
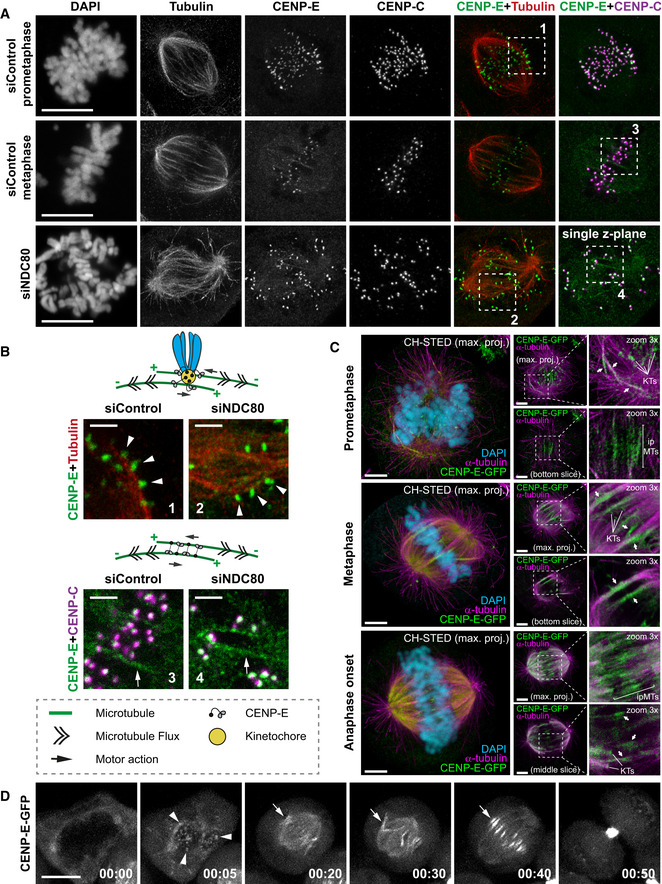
- Representative maximum‐intensity projected coherent‐hybrid STED (CH‐STED) images of mitotic spindles in U2OS cells treated with control and NDC80 siRNAs and stained for DNA (DAPI), KTs (CENP‐C, magenta), α‐tubulin (red), and CENP‐E (green). Scale bar, 10 μm.
- Model illustrating potential mechanisms for CENP‐E mediated MT‐flux forces either through its KT‐ or antiparallel MT‐based localization and sliding. Zoomed insets from (A) highlight CENP‐E localized at KTs laterally interacting with MTs (white arrowheads in 1, 2), and CENP‐E localized at interpolar MTs (white arrows in 3, 4), in control and NDC80‐depleted mitotic cells. Scale bars, 2 μm.
- CH‐STED analyses of HeLa cells stably expressing CENP‐E-GFP illustrating bipolar spindles in prometaphase, metaphase and just after sister‐chromatid separation at anaphase onset. Approximate x–y resolution is 70 nm. The expected/described localization of CENP‐E-GFP (green) at KTs is shown. In addition, CENP‐E-GFP was found associated with interpolar MTs (ipMTs), including regions of overlapping antiparallel MTs, and k‐fibers. Chromosomes (confocal mode only) were revealed in the larger panels with DAPI (cyan) and MTs (magenta) were detected with an anti‐α‐tubulin antibody. Arrows indicate examples of clear MT bundles, including regions of overlapping antiparallel MTs. Scale bar in all panels is 5 μm.
- Representative spinning disk confocal live‐cell time series of HeLa cells stably expressing CENP‐E-GFP. White arrowheads highlight CENP‐E-GFP at KTs, white arrows highlight CENP‐E-GFP on interpolar MTs. Scale bar, 10 μm. Time, h:min.
Since earlier work showed that CENP‐E localization at the spindle midzone in late anaphase depends on PRC1 (Kurasawa et al, 2004), we tested whether CENP‐E localization on interpolar MTs in early mitosis also depended on PRC1. Depletion of PRC1 both in HeLa cells stably expressing CENP‐E‐GFP and in NDC80‐depleted U2OS cells, led to a complete removal of CENP‐E from interpolar MTs, but not from KTs, indicating that CENP‐E association with interpolar MTs in early mitosis also depends on PRC1 (Figs EV6A and B). Next, we applied this knowledge to dissect which CENP‐E pool (KTs vs. interpolar MTs) is more relevant for MT‐flux in early mitosis. We used NDC80‐depleted cells lacking stable end‐on KT‐MT attachments, as the condition where the contribution of CENP‐E to MT‐flux was most prominent (Fig 5A and B), to compare the respective impacts of PRC1 and CENP‐E inactivation on MT‐flux. Unlike CENP‐E inhibition (Fig 5A and B), PRC1 depletion did not reduce MT‐flux rate in NDC80‐depleted cells (1.02 ± 0.16 μm/min, compared with 0.91 ± 0.2 μm/min in NDC80 RNAi; Fig EV6C), suggesting that the observed role of CENP‐E on MT‐flux relies more on its KT‐associated pool, rather than on its interpolar MT localization. In agreement, as the localization of CENP‐E during mitosis gradually decreases at KTs and increases at the interpolar MTs, its impact on MT‐flux simultaneously declines from prometaphase to metaphase.
Figure EV6. CENP‐E localization on interpolar MTs depends on PRC1.
- Representative spinning disk confocal live‐cell time series of control and PRC1‐depleted HeLa cells stably expressing CENP‐E-GFP. White arrowheads highlight CENP‐E-GFP at KTs, white arrows highlight CENP‐E-GFP on interpolar MTs. Scale bar, 10 μm. Time, h:min.
- Representative point‐scanning confocal immunofluorescence images of U2OS cells, stained using antibodies against PRC1 and CENP‐E. PRC1 (red) and CENP‐E (cyan) are shown in merged image. DNA was counterstained with DAPI. Scale bar, 10 μm. White arrows highlight CENP‐E on interpolar MTs.
- Quantification of the impact of PRC1 depletion versus CENP‐E inhibition on MT‐flux in NDC80‐depleted cells. MT‐flux values are plotted with mean ± SD. P‐values were calculated using Mann–Whitney U‐test. ****P ≤ 0.0001. siControl, siNDC80 and siNDC80 + GSK923295 data are from Figs 1E and 5B. N (number of cells, number of independent experiments): siNDC80 + siPRC1 (37, 3).
- Immunoblot analyses of the efficiency of knockdown from U2OS cells stably expressing PA‐GFP/mCherry‐α‐tubulin treated with control or indicated siRNAs, with α‐tubulin used as a loading control.
Combined action of EG5 and KIF15 support MT‐flux driving activities of CENP‐E and KIF4A
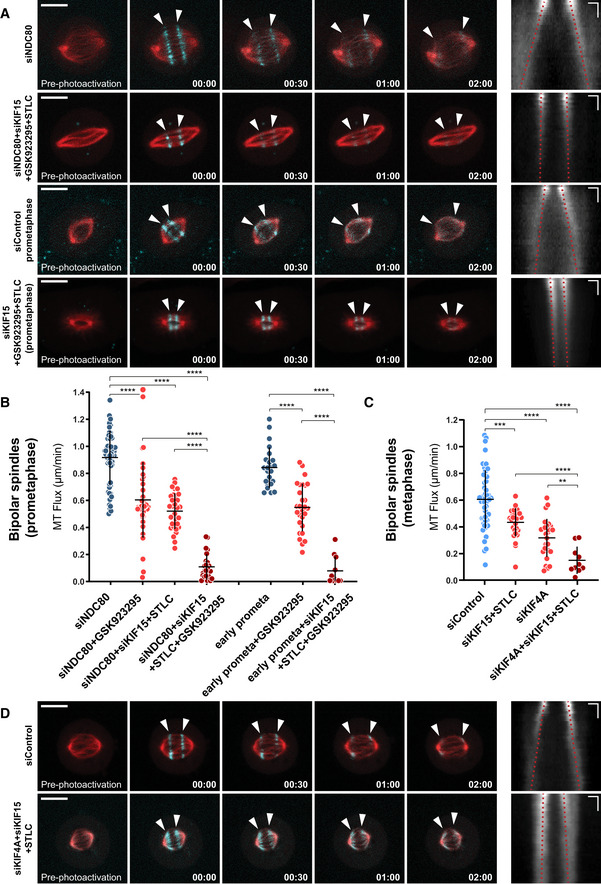
Although we identified CENP‐E and KIF4A as drivers of MT‐flux in prometaphase and metaphase, respectively, functional inactivation of either of these two motors resulted in only around 50% decrease in MT‐flux rate, indicating the presence of other important contributor(s). Therefore, we tested whether EG5 and KIF15 play a synergistic role in driving MT‐flux. Importantly, in contrast to their individual functional inactivation, which did not affect MT‐flux rates (Fig 1E), inhibition of EG5 in KIF15‐depleted cells resulted in a significant decrease of MT‐flux in bipolar spindles (0.43 ± 0.11 μm/min, compared with 0.61 ± 0.22 μm/min in controls), as well as in NDC80‐depleted spindles (0.52 ± 0.13 μm/min, compared with 0.91 ± 0.2 μm/min in NDC80 RNAi only; Fig 7B and C), suggesting that these two antiparallel MT‐sliding motors play redundant roles, similar to their role in bipolar spindle assembly (Tanenbaum et al, 2009). Therefore, we examined whether MT‐flux is driven by the cooperative actions between CENP‐E, EG5, and KIF15 prior to the establishment of stable end‐on KT‐MT attachments. Strikingly, triple inactivation of CENP‐E, EG5, and KIF15 resulted in virtually no flux both in NDC80‐depleted cells (0.1 ± 0.09 μm/min, compared with 0.91 ± 0.2 μm/min in NDC80 RNAi only) and in early prometaphase cells (0.07 ± 0.11 μm/min, compared with 0.84 ± 0.15 μm/min in control early prometaphase cells; Fig 7A and B, and Movie EV9). Next, we tested whether EG5 and KIF15 also cooperate with KIF4A to drive MT‐flux upon the establishment of stable end‐on KT‐MT attachments. Triple inactivation of KIF4A, EG5 and KIF15 in late prometaphase/metaphase cells led to a much stronger reduction in MT‐flux, compared with either KIF4A‐depletion or co‐inactivation of EG5 and KIF15 (0.15 ± 0.12 μm/min, compared with 0.43 ± 0.1 μm/min in STLC + KIF15 RNAi and 0.32 ± 0.14 in KIF4A RNAi; Fig 7C and D, and Movie EV9). Altogether, these data demonstrate that mitotic MT‐flux in human cells is sequentially driven by the coordinated action of 4 kinesins.
Figure 7. Combined action of EG5 and KIF15 support MT‐flux driving activities of CENP‐E and KIF4A.
-
ARepresentative spinning disk confocal time series of U2OS cells stably co‐expressing PA‐GFP-α‐tubulin (cyan) and mCherry‐α‐tubulin (red), with indicated treatments (left). White arrowheads highlight poleward flux of the photoactivated regions. Scale bar, 10 μm. Time, min:s. Right panels display corresponding kymographs of the photoactivated spindles used for quantification of the flux rates (red dotted lines highlight MT‐flux slopes). Scale bars, 2 μm (horizontal) and 30 s (vertical).
-
B, CQuantification of MT‐flux in prometaphase (B) and metaphase (C) bipolar spindles subjected to indicated treatments. Graphs represent MT‐flux of individual cells with mean ± SD. siNDC80, siNDC80 + GSK923295, early prometaphase, early prometaphase + GSK923295, siControl, and siKIF4A data are from Figs 1E and 5B. N (number of cells, number of independent experiments): siNDC80 + KIF15 + STLC (33, 5), siNDC80 + KIF15 + STLC + GSK923295 (25, 3), early prometaphase + KIF15 + STLC + GSK923295 (11, 2), siKIF15 + STLC (29, 3), siKIF4A + siKIF15 + STLC (10, 3). P‐values were calculated using Student's t‐test and Mann–Whitney U‐test. **P ≤ 0.01, ***P ≤ 0.001 ****P ≤ 0.0001.
-
DRepresentative spinning disk confocal time series of U2OS cells stably co‐expressing PA‐GFP-α‐tubulin (cyan) and mCherry‐α‐tubulin (red), with indicated treatments (left) and corresponding kymographs (right) as described in (A). Scale bars, 2 μm (horizontal) and 30 s (vertical).
MT poleward flux regulates spindle length in response to MCAK‐mediated depolymerization of KT‐MTs
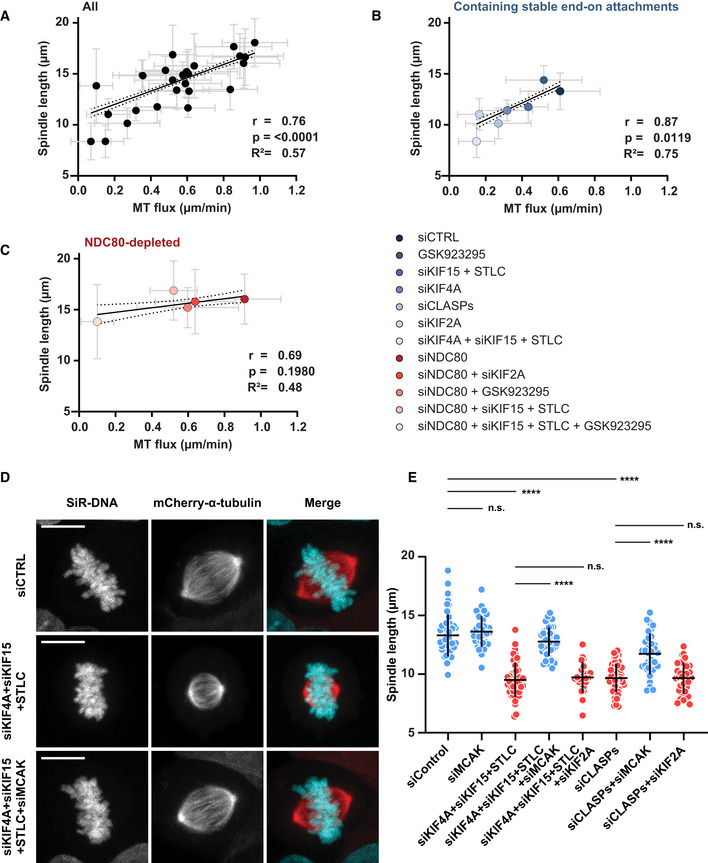
Similar to what was observed upon CLASPs depletion (Maffini et al, 2009), we observed substantial reduction of spindle length under certain conditions that resulted in highly attenuated MT‐flux rates (Fig 7A and D). To investigate the relationship between MT‐flux and spindle length, we analyzed the correlation between altered MT‐flux rates and spindle lengths from different treatments. We found that MT‐flux rate and spindle length showed a strong positive correlation overall (Pearson correlation coefficient, r = 0.76; P value = < 0.0001; Fig 8A and Table EV1). Importantly, we noticed that spindle length did not dramatically change in NDC80‐depleted cells with reduced flux rates, where no correlation between MT‐flux rate and spindle length was observed (Pearson correlation coefficient, r = 0.69; P value = 0.1980; Fig 8C). Accordingly, when we analyzed the correlation between MT‐flux and spindle length in cells containing mainly stable end‐on KT‐MT attachments that displayed reduced flux, the correlation between MT‐flux rate and spindle length was strong (Pearson correlation coefficient, r = 0.87; P value = 0.0119; Fig 8B).
Figure 8. MT poleward flux regulates spindle length in response to MCAK‐mediated depolymerization of KT‐MTs.
-
A–CGraph depicting a direct correlation between MT‐flux and mitotic spindle where mean spindle length is plotted over mean MT‐flux rates for all indicated conditions (A), mitotic conditions containing stable end‐on attachments (B), and NDC80 depleted conditions lacking stable end‐on attachments (C). Solid and dotted lines represent the linear regression and 95% confidence interval, respectively. Pearson correlation coefficient (r), coefficient of determination (r 2), and corresponding P‐values are indicated. The error bars over x and y axes represent the standard deviation of MT‐flux and spindle length, respectively.
-
DRepresentative images from spinning disk confocal live‐cell time series of U2OS PA-GFP‐α‐tubulin/mCherry‐α‐tubulin cells under indicated treatments, with SiR‐DNA-labeled DNA. Microtubules are shown in red and DNA in cyan in the merged image. Scale bar: 10 μm.
-
EQuantification of spindle lengths at metaphase following indicated treatments. Graph represents the spindle length of individual cells with mean ± SD. N (number of cells, number of independent experiments): siControl (49, 5), siMCAK (34,3), siKIF4A + siKIF15 + STLC (46, 6), siKIF4A + siKIF15 + STLC + siMCAK (43, 3), siKIF4A + siKIF15 + STLC + siKIF2A (22, 3), siCLASPs (64, 6), siCLASPs + siMCAK (33, 3), siCLASPs + siKIF2A (32, 3). P‐values were calculated using Student's t‐test and Mann–Whitney U‐test. n.s.—not significant, ****P ≤ 0.0001.
These data suggest that MT‐flux regulates spindle length in response to the formation of stable end‐on KT‐MT attachments (Fig EV7A). Previously, it was shown that although depletion of MCAK (kinesin‐13‐family member with MT‐depolymerizing activity (Desai et al, 1999)) alone did not affect MT‐flux rate, its co‐depletion with KIF2A not only strongly reduced MT‐flux rate but also restored spindle bipolarity and size in KIF2A‐depleted cells (Ganem & Compton, 2004; Ganem et al, 2005). Because simultaneous inactivation of KIF4A, EG5 and KIF15 in late prometaphase/metaphase cells led to much shorter spindles (Figs 7D, and 8A and B, Table EV1), we tested whether MT‐flux regulates spindle length by preventing MCAK‐mediated depolymerization of k‐fibers. Strikingly, we found that spindle shortening after triple inactivation of KIF4A, EG5, and KIF15 was fully rescued upon co‐depletion of MCAK (12.76 ± 1.22 μm compared with 9.5 ± 1.49 μm in triple inactivated cells and 13.3 ± 1.79 μm in controls; Figs 8D and E, and EV7D). In addition to its effect on spindle length, MCAK co‐depletion significantly reduced spindle collapsing in bipolar triple inactivated cells (Fig EV7B). To further investigate the impact of MCAK on spindle length in cells with reduced MT‐flux, we co‐depleted MCAK and CLASPs. Similar to its co‐depletion in cells with triple inactivated KIF4A, EG5, and KIF15, depletion of MCAK also successfully recovered spindle length in CLASP‐depleted cells (Fig 8E). Importantly, while MCAK depletion recovered spindle length in both of these conditions (Fig 8E), the MT‐flux rates remained reduced (Fig EV7C). Finally, to dissect whether MT‐flux regulates spindle length by counteracting specifically MCAK or kinesin‐13‐driven MT‐depolymerizing activity in general, we co‐depleted KIF2A in cells with triple inactivated KIF4A, EG5, and KIF15, as well as in CLASP‐depleted cells. In contrast to co‐depletion of MCAK, KIF2A co‐depletion did not rescue spindle shortening neither after triple inactivation of KIF4A, EG5, and KIF15 nor in CLASP‐depleted cells (Figs 8E and EV7D). Overall, these data indicate that MT‐flux regulates spindle length by specifically counteracting MCAK‐driven MT‐depolymerization on KT‐MTs.
Figure EV7. MT‐flux counterbalances MCAK activity to maintain spindle length.
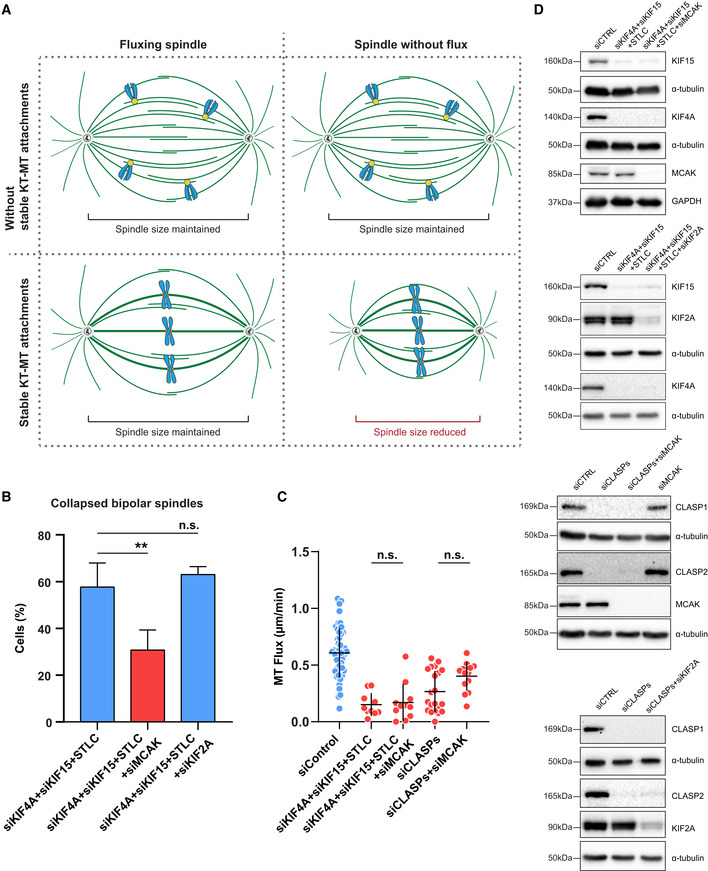
- Illustration of the relationship between MT‐flux and spindle length in the presence or absence of stable KT‐MT end‐on attachments.
- Percentage of cells where bipolar spindle collapses to become monopolar after indicated treatments. N (number of cells, number of independent experiments): siKIF4A + siKIF15 + STLC (80, 6), siKIF4A + siKIF15 + STLC + siMCAK (94, 3), siKIF4A + siKIF15 + STLC + siKIF2A (37, 3). Graph represents the mean values of individual experiments ± SD. P‐values were calculated using Student's t‐test. **P ≤ 0.01, n.s.—not significant.
- Quantification of the impact of MCAK‐mediated recovery on MT‐flux. MT‐flux with mean ± SD are plotted. siControl, siKIF4A + siKIF15 + STLC and siCLASPs values are from Figs 1E and 7C. N (number of cells, number of independent experiments): siKIF4A + siKIF15 + STLC + siMCAK (11, 3) siCLASPs + siMCAK (14, 3). P‐values were calculated using Student's t‐test. n.s.—not significant.
- Immunoblot analysis of the knockdown efficiency of indicated proteins in U2OS PA‐GFP/mCherry‐α‐tubulin cells treated with control or target‐specific siRNAs. GAPDH and α‐tubulin serve as the loading controls.
Discussion
Mitotic spindle MTs remain highly dynamic even when the overall structure maintains a certain steady‐state length. This is explained by the continuous poleward MT‐flux, which is balanced by MT polymerization and depolymerization at their plus‐ and minus‐ends, respectively. However, the drivers and functional role of MT poleward flux in human cells have remained elusive for more than three decades.
Our study establishes the long‐sought molecular mechanisms underlying MT‐flux and explains its role in regulating spindle length upon the establishment of stable end‐on KT‐MT attachments. Thus, MT‐flux is not just an epiphenomenon of MT‐dynamics but plays important roles for spindle function. Altogether, our findings support a model in which MT‐flux in human cells is driven by the coordinated action of four kinesins. Accordingly, interpolar MTs are slid apart by the collaborative activity of the MT‐sliding motors EG5 and KIF15, assisted by the sequential contribution of CENP‐E at KTs in prometaphase and KIF4A on chromosome arms in metaphase (Fig 9). This sequential contribution of CENP‐E and KIF4A might be explained by the fact that upon bi‐orientation, a large amount of CENP‐E is stripped away from the KTs (Howell et al, 2001) and therefore KIF4A gradually takes over during chromosome alignment to compensate for the weakened CENP‐E contribution (Figs 4F and EV2D). In addition, we have previously shown that CENP‐E is dominant over KIF4A in early mitosis (Barisic et al, 2014). In metaphase, KIF4A cannot move the chromosomes any further due to equivalent opposite forces, but instead, KIF4A might cause non‐KT‐MTs to flux toward the poles (Figs 9 and EV2D), contributing to MT‐flux at this stage. Thus, because of its ability to move chromosomes away from the pole in prometaphase, KIF4A contributes to chromosome congression. However, when chromosomes align at the metaphase plate and cannot move further, KIF4A helps driving MT‐flux.
Figure 9. The model illustrating how MT poleward flux is driven by the coordinated action of four kinesins.
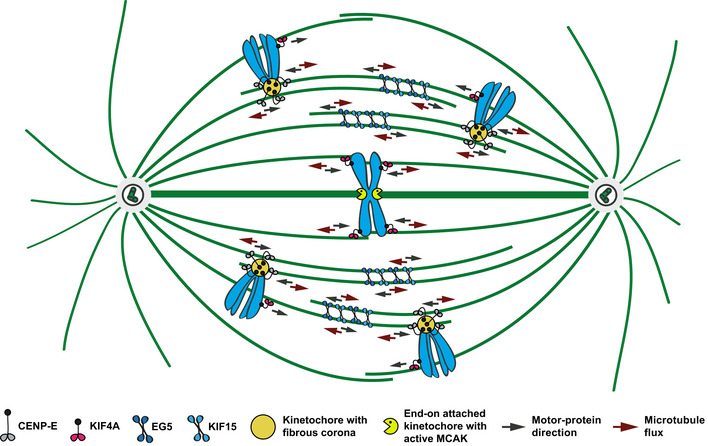
In our MT‐flux model, interpolar MTs are slid apart by the collaborative activity of the MT‐crosslinking motors EG5 and KIF15, supported by sequential contribution of CENP‐E at KTs in prometaphase and KIF4A on chromosome arms in metaphase. CENP‐E at laterally attached KTs during early mitosis interacts with antiparallel MTs and slides them apart. During chromosome alignment to the metaphase plate, when CENP‐E is partially stripped away from the KTs, KIF4A gradually takes over, promoting MTs to flux toward the poles.
Interestingly, although CENP‐E inhibition prior to establishment of end‐on KT‐MT attachments, as well as KIF4A depletion in metaphase, strongly compromised MT‐flux, the reduction was not complete (Figs 1E and 5B). This was explained by the fact that simultaneous abrogation of the functions of EG5 and KIF15, together with CENP‐E inhibition in early mitosis, and KIF4A depletion in metaphase, respectively, resulted in virtually no flux (Fig 7A–D), demonstrating that MT‐flux in human cells is driven by coordinated action of these four kinesins and further exposing the collaborative nature of the MT‐flux‐driving machinery.
During early mitosis, CDK1 and PLK1 phosphorylate PRC1, keeping it mostly inactive (Zhu et al, 2006; Hu et al, 2012). At anaphase onset, PRC1 is activated by dephosphorylation and brought to the midzone MTs by KIF4A (Zhu & Jiang, 2005). However, recent studies proposed PRC1 to bridge KT‐MTs with interpolar MTs already during spindle assembly (Kajtez et al, 2016; Polak et al, 2017), opening the possibility that a pool of KIF4A co‐localizes with PRC1 at interpolar MTs even before anaphase. Moreover, a recent study showed that co‐inactivation of KIF4A and EG5 in RPE‐1 cells impaired the sliding of interpolar MTs during anaphase (preprint: Vukušić et al, 2019), thus suggesting that similar players are involved in MT‐flux and MT‐sliding in anaphase. Nevertheless, our KIF4A mutants‐ and PRC1 RNAi‐based data suggest that the contribution of KIF4A to MT‐flux depends on its motor activity and its localization on chromosome arms (Fig 2A and C), but not on its association with spindle midzone MTs (Figs 2A and C, and 4B). Thus, it will be of interest in future studies to address on which level the molecular basis of MT‐flux and anaphase MT‐sliding overlap.
Since KIF4A is not localized at KTs, the MT‐fluxing force generated on chromosome arms has to be transmitted to KT‐MTs. We showed that MTs fluxed faster in NDC80‐depleted cells, indicating that stable KT‐MT end‐on attachments normally work as flux brakes (Fig 5A and B). This is in line with earlier observations in Xenopus egg extracts (Maddox et al, 2003), crane‐fly spermatocytes (LaFountain et al, 2004), and human cells (Lecland & Luders, 2014) that, likely due to a drag, KT‐MTs flux slightly slower than the neighboring interpolar MTs, and that MT‐flux is lost in spindles containing only KT‐MTs (Mitchison et al, 2004). Moreover, this explains why kinesin‐5 contribution to MT‐flux is much stronger in Xenopus egg extracts spindles, in which most MTs are not associated with KTs (Miyamoto et al, 2004), as compared with spindles of human cells that contain a higher proportion of KT‐MTs. Our finding that stable end‐on KT‐MT attachments work as flux brakes is also consistent with the “coupled spindle” model, in which fluxing non‐KT‐MTs transmit force to “passive” KT‐MTs via MT‐crosslinking (Matos et al, 2009). In agreement, we found that depletion of the MT‐crosslinking proteins NuMA and HSET resulted in asynchronous MT‐flux within different spindle MT subpopulations (Fig 4D and E). Instead of the signal smearing, the asynchrony in these kymograph tracks is represented by a few bifurcations. This points to the occurrence of rare, but more severe decoupling incidents, rather than to an increased frequency of small decoupling events. Since k‐fibers are more bundled and therefore appear as the brightest signal within a kymograph, the asynchrony likely represents few k‐fibers fluxing slower than the others. Although we cannot exclude the possibility that these effects arise from changes in overall spindle architecture, we favor the interpretation that MT‐crosslinking molecules ensure the uniform distribution of spindle forces on metaphase chromosomes, enabling KT‐MTs to flux due to coupling with non‐KT‐MTs (Fig 4F). Interestingly, chromosomes were shown to be dispensable for MT‐flux in Xenopus egg extracts (Sawin & Mitchison, 1994), arguing against the role of chromatin in driving MT‐flux. However, because the system lacked kinetochores as well (Sawin & Mitchison, 1994), it is reasonable to conceive that MT‐flux depends on chromatin‐based KIF4A only in the presence of stable end‐on KT‐MT attachments, as supported by the data presented in this study (Fig 5B). Our data are also in agreement with the “slide‐and‐cluster” model of spindle assembly, in which the chromatin‐derived interpolar MTs undergo coordinated sliding toward the poles by a plus‐end‐directed motor, and clustering by a minus‐end‐directed motor (Burbank et al, 2007).
Several studies showed that MT‐flux can be uncoupled from MT minus‐end depolymerization (Waterman‐Storer et al, 1998; Maiato et al, 2004; Dumont & Mitchison, 2009; Matos et al, 2009). Moreover, our data here demonstrate that CLASPs are dispensable for MT‐flux in the absence of end‐on KT‐MT attachments (Fig 5B). These findings suggest that the MT growth‐promoting activity of CLASPs and MT‐depolymerizing activity of KIF2A, supported by MT‐severing enzymes (Zhang et al, 2007; Jiang et al, 2017), act as MT‐flux governing elements rather than its driving force.
In addition, our study shows that although MT‐flux rate is in general positively correlated with spindle length, this correlation is lost in cells without stable end‐on KT‐MT attachments. Because MCAK depletion fully restored spindle length in metaphase cells with reduced MT‐flux, we concluded that the role of MT‐flux in human cells is to regulate mitotic spindle length in response to MCAK activity on KT‐MTs. This explains why MT‐flux becomes dispensable to regulate spindle length in the absence of either MCAK (Ganem et al, 2005) or stable end‐on KT‐MT attachments (Fig 8A and C), and why overexpression of MCAK leads to substantially shorter spindles (Liao et al, 2019). Moreover, our model is also in agreement with previous work showing that ectopic enrichment of MCAK activity at centromeres attenuates MT‐flux, reduces spindle length, and suppresses inter‐KT tension (Wordeman et al, 2007). An appealing possibility is that MT‐flux counteracts MCAK‐dependent depolymerization of k‐fibers by providing a bias for their plus‐end polymerization. Indeed, when we attenuated the growth of k‐fibers by depleting CLASPs, the k‐fibers switched to MCAK‐dependent depolymerization, which resulted in shorter spindles (Fig 8E). Thus, MT‐flux might regulate the fine balance between MCAK‐dependent depolymerization and CLASPs‐promoting polymerization of k‐fibers to ensure the steady‐state length of the mitotic spindle. Interestingly, a recent elegant study used microneedle‐based mechanical manipulation to pull on photomarked k‐fibers and showed that the applied pulling force on KTs suppressed depolymerization of k‐fibers, resulting in their elongation via MT plus‐end polymerization (Long et al, 2020). Likewise, the sliding activities of four MT‐flux driving motors might exert similar forces on KTs to promote MT plus‐end polymerization. However, future work is required to address the precise molecular basis of this regulation, e.g., by dissecting whether MT‐flux regulates the localization and/or activities of MCAK and CLASPs and whether the interplay between KT/centromere‐localized kinases and phosphatases play an important regulatory role in this process.
In conclusion, our study demonstrates that MT‐flux in human cells is driven by the coordinated action of four kinesins and is required to maintain mitotic spindle length by counteracting MCAK‐mediated MT‐depolymerizing activity on KT‐MTs.
Materials and Methods
Cell culture, cloning, and plasmids
All cell lines were grown in Dulbecco's Modified Eagle Medium (DMEM) supplemented with 10% fetal bovine serum (FBS; Thermo Fisher Scientific) at 37°C in humidified conditions with 5% CO2. U2OS photoactivatable GFP (PA‐GFP)‐α‐tubulin (Ganem et al, 2005) cell line expressing stable inducible short hairpin RNA (shKIF4A) targeting KIF4A sequence 5′‐GCAAGATCCTGAAAGAGAT‐3′ was generated using a multipurpose GATEWAY‐based lentiviral tetracycline‐regulated conditional RNAi system (GLTR) using pENTR‐THT‐III (Addgene plasmid #55791) and pGLTR‐X‐Puro (Addgene plasmid #58246) plasmids (Sigl et al, 2014; Pfeiffenberger et al, 2016). Stable inducible U2OS PA‐GFP‐α‐tubulin KIF4A shRNA cell lines conditionally expressing RNAi‐resistant mCherry‐KIF4A variants were generated by lentiviral infection followed by clonal selection with antibiotics.
The RNAi‐resistant KIF4A and K94A motor mutant were generated using site‐directed mutagenesis. RNAi targeting sequence 5′‐GCAAGATCCTGAAAGAGAT‐3′ was mutated into 5′‐GCAAGATATTAAAAGAGAT‐3′ (mutated nucleotides are underlined). Overlap extension PCR was used to generate KIF4A ΔZip1 mutant (Δ757–778) using RNAi‐resistant KIF4A WT as a template and the following primers: KIF4A FWD: 5′‐AAGGAAAAAAGCGGCCGCCATGAAGGAAGAGGTGAAGGGA‐3′, KIF4A REV: 5′‐CCGGATATCGTGGGCCTCTTCTTCGATAG‐3′, KIF4AΔZip1 FWD: 5′‐AACGAAATTGAGGTTATGGTCAGTGCTCAACTCAAAGAAAAAAAGGAA‐3′, and KIF4AΔZip1 REV: 5′‐TTCCTTTTTTTCTTTGAGTTGAGCACTGACCATAACCTCAATTTCGTA‐3′. For Gateway cloning compatible N‐terminal mCherry tagging of KIF4A, pENTR4‐mCherry plasmid was generated by PCR amplification of the mCherry tag from pmCherry‐C1 using the following primers mCh FWD: 5′‐CGCGTCGACATGGTGAGCAAGGGCGAGGA‐3′ and mCh REV: 5′‐ACGCGGATCCCTTGTACAGCTCGTCCATGC‐3′ and ligating it into pENTR4 no ccDB (gift from E. Campeau, Addgene plasmid #17424) plasmid (Campeau et al, 2009). The amplified PCR products of KIF4A variants were first cloned into pENTR4‐mCherry and then sub‐cloned into pLenti‐CMV/TO‐DEST (gift from E. Campeau, Addgene plasmid #17291) (Campeau et al, 2009) by LR recombination (Invitrogen) according to manufacturer's instructions. Production and expression of adenovirus encoding mCherry/mCherry‐KIF4A was performed using pAd/CMV/V5‐DEST Gateway Vector Kit (Thermo Fisher Scientific) according to manufacturer's instructions. The plasmids and corresponding mutations were verified by sequencing.
For rescue experiments, GFP‐HSET and GFP‐HSET N593K plasmids (gift from C. Walczak, Indiana University School of Medicine, USA) (Cai et al, 2009b) were transiently transfected (1 μg) for 24 h using Lipofectamine 2000 (Thermo Fisher Scientific) according to the manufacturer's protocol.
Drug treatments
To induce monopolar spindles by inhibiting Eg5, 5 μM S‐Trityl‐l‐Cysteine (STLC; Santa Cruz) was added to the medium 20 min before live‐cell imaging, or 5 h before fixation. CENP‐E was inhibited by adding 200 nM GSK923295 (Sigma‐Aldrich) 20 min prior to imaging. DNA was labeled by adding 20 nM SiR‐DNA (Spirochrome) 2 h prior to live‐cell imaging. To inhibit MT‐flux, 10 nM taxol (LC laboratories) was added to the medium for 30 min before live‐cell imaging. To induce shRNA‐mediated depletion of Kif4A and simultaneous expression of its respective RNAi‐resistant variants, 1 μg/ml of doxycycline (Sigma‐Aldrich) was added to the refreshed medium each day for 2 days.
Mitosis with unreplicated genomes
Mitosis with unreplicated genomes was induced as described previously (Schlegel & Pardee, 1986; Wise & Brinkley, 1997). Briefly, U2OS cells stably expressing PA‐GFP/mCherry‐α‐tubulin (gift from R. Medema, NKI, Amsterdam, the Netherlands) (van Heesbeen et al, 2014) were first synchronized in mitosis with 2 μM nocodazole (Sigma‐Aldrich) for 16 h. Mitotic cells were collected by shake‐off, washed in DMEM and plated at a density 4.5 × 10⁵ cells in 35 mm glass‐bottomed dish (14 mm, No. 1.5, MatTek Corporation). To inhibit DNA replication, 2 mM hydroxyurea (HU; Sigma‐Aldrich) was added directly to the cell culture medium for 23 h. Next day, the medium was replaced with fresh medium containing 2 mM HU and 5 mM caffeine and incubated for an additional 6 h.
RNAi interference
U2OS cells stably expressing PA‐GFP/mCherry‐α‐tubulin (van Heesbeen et al, 2014) were transfected with 50 nM siRNAs for 48–72 h, using Lipofectamine RNAiMAX (Thermo Fisher Scientific). The siRNAs used in this study are: KIF4A, 5′‐GCAGAUUGAAAGCCUAGAG‐3′ (Wandke et al, 2012); KIF2A, 5′‐GGCAAAGAGAUUGACCUGG‐3′ (Ganem & Compton, 2004); hKID, 5′‐CAAGCUCACUCGCCUAUUGTT‐3′ (Wolf et al, 2006; Wandke et al, 2012); KIF15, 5′‐GGACAUAAAUUGCAAAUACTT‐3′ (Tanenbaum et al, 2009); CLASP1, 5′‐GGAUGAUUUACAAGACUGG‐3′ (Mimori‐Kiyosue et al, 2006); CLASP2, 5′‐GACAUACAUGGGUCUUAGA‐3′ (Mimori‐Kiyosue et al, 2006); NDC80, 5′‐GAAUUGCAGCAGACUAUUA‐3′; NuMA, 5′‐AAGGGCGCAAACAGAGCACUA‐3′ (Kotak et al, 2012); HSET, 5′‐UCAGAAGCAGCCCUGUCAA‐3′ (Cai et al, 2009b); PRC1, 5′‐AAAUAUGGGAGCUAAUUGGGA‐3′ (Mollinari et al, 2002); MCAK, 5′‐GAUCCAACGCAGUAAUGGU‐3′ (Cassimeris & Morabito, 2004) and non‐targeting control siRNA (D‐001810‐01‐05, Dharmacon Inc.), 5′‐UGGUUUACAUGUCGACUAA‐3′. For rescue experiments of HSET, U2OS cells stably expressing mEOS‐α‐tubulin (Wandke et al, 2012) were transfected with 100 nM siRNA targeting 3′UTR for HSET, 5′‐CAUGUCCCAGGGCUAUCAAAU‐3′ (Cai et al, 2009b).
Immunoblotting and immunofluorescence
For immunoblotting, cells following subjected treatments were collected and lysed in NP40 buffer (50 mM Tris–HCl pH 8, 150 mM NaCl, 5 mM EDTA, 0.5% NP‐40, 1× EDTA‐free protease inhibitor [Sigma‐Aldrich], 1× phosphatase inhibitor cocktail [Sigma‐Aldrich], 1 mM PMSF) by two cycles of freezing and thawing using liquid N2. Protein extracts collected after centrifugation were subjected to SDS–PAGE and transferred onto nitrocellulose membrane (Bio‐Rad). After blocking with PBS containing 0.1% Tween‐20 and 5% milk, membranes were incubated overnight with primary antibodies, washed in PBS containing 0.1% Tween‐20, and then incubated 1 h with HRP‐conjugated secondary antibodies (Jackson ImmunoResearch). After washing with PBS containing 0.1% Tween‐20, immunodectection was performed with ECL (Bio‐Rad). Immunoblots were performed using the following primary antibodies: rabbit anti‐KIF15 (1:1,000; Cytoskeleton Inc., Cat#AKIN13), rabbit anti‐KIF2A (1:1,000; Novus Biologicals, NB500‐180); rabbit anti‐KIF4A (1:1,000) (Wandke et al, 2012), mouse anti‐hKID (8C12; 1:1,000) (Wandke & Geley, 2006); rat anti‐CLASP1 (1:200) and rat anti‐CLASP2 (1:200) (Maffini et al, 2009), mouse anti‐PRC1 (C‐1; 1:500; Santa Cruz, sc‐3769839), mouse anti‐NDC80/HEC1 (1:2,000; Nordic Biosite, GTX70268), mouse anti‐NuMA (F‐11; 1:250; Santa Cruz, sc‐365532), rabbit anti‐HSET (1:500; Bethyl, A300‐951A), mouse anti‐MCAK (1:1,000; Abnova H00011004‐M01), mouse anti‐Vinculin (1:5,000; Sigma‐Aldrich, SAB4200729, Vin‐11‐5), mouse anti‐α‐tubulin (1:10,000; Sigma‐Aldrich T5168, B‐5‐1‐2), mouse anti‐GAPDH (1:25,000; Proteintech 60004‐1‐Ig), HRP‐conjugated secondary antibodies (1:10,000; Jackson ImmunoResearch), and visualized by ECL (Bio‐Rad).
For immunofluorescence, U2OS cells grown on glass coverslips were fixed either by ice‐cold methanol for 4 min at −20°C, or by 4% paraformaldehyde in PHEM buffer for 20 min at 37°C as described before (DeLuca, 2010). Cells were washed with 1× phosphate‐buffered saline (PBS) and immunostained with primary and Alexa Fluor‐conjugated secondary antibodies diluted in IF stain (1× PBS, 1% FBS, 0.5% Tween). DNA was counterstained with DAPI (Sigma‐Aldrich, final concentration 0.1 μg/ml) and mounted on glass slides using Fluoromount‐G mounting media (Southern Biotech). Images were acquired using LSM700 confocal microscope (Carl Zeiss Microimaging Inc.) mounted on a Zeiss Axio imager Z1 equipped with plan‐apochromat 63×/1.40 oil DIC M27 objective (Carl Zeiss, Inc.) and Zen 2008 software (Carl Zeiss, Inc.). Primary antibodies used were mouse anti‐α‐tubulin (DM1A; 1:2,000; Sigma‐Aldrich, T9026), rabbit anti‐α‐tubulin (1:500; Abcam, ab15246); rabbit anti‐KIF4A (1:500; Bethyl, A301‐074A), rabbit anti‐CENP‐E (1:500, Abcam, ab133583), and mouse anti‐PRC1 (1:250; Santa Cruz, sc‐3769839) and the Alexa Fluor‐conjugated secondary antibodies (1:1,000; Thermo Fisher Scientific).
Live‐cell imaging
Time‐lapse imaging was performed in a heated incubation chamber at 37°C with controlled humidity and 5% CO2 supply using a Plan‐Apochromat 63x/1.4NA oil objective with differential interference contrast mounted on an inverted Zeiss Axio Observer Z1 microscope (Marianas Imaging Workstation [3i—Intelligent Imaging Innovations, Inc., Denver, CO, USA]), equipped with a CSU‐X1 spinning disk confocal head (Yokogawa Corporation of America) and four laser lines (405, 488, 561, and 640 nm). Images were acquired using an iXon Ultra 888 EM‐CCD camera (Andor Technology). Fifteen 1 μm‐separated z‐planes were collected every 1 min for 2 h. Cells with collapsing spindles (e.g., STLC‐treated and KIF15‐depleted) were discarded from quantifications of MT‐flux and spindle length in bipolar spindles and only the ones that maintained spindle length during filming were quantified.
To quantify the spindle length, the distance between mCherry‐labeled spindle poles was measured in 3D using ImageJ (National Institute of Health, Bethesda, MD, USA). For MCAK RNAi‐mediated recovery experiments, the spindle length was quantified using time‐lapse images of mitotic spindles with fifteen 1 μm‐separated z‐planes imaged every 2 min.
Photoactivation and MT‐flux analysis
For the MT poleward flux measurement, photoactivation and photoconversion experiments were performed using U2OS‐PA‐GFP/mCherry‐α‐tubulin (van Heesbeen et al, 2014), U2OS‐PA‐GFP (Ganem et al, 2005), and U2OS‐mEOS‐α‐tubulin (Wandke et al, 2012) cell lines, cultured in 35 mm glass‐bottomed dishes (14 mm, No. 1.5, MatTek Corporation). Fluorescent signals of SiR‐DNA and mCherry‐α‐tubulin were used to differentiate between early prometaphase and metaphase cells. Two transversal line‐shaped regions of interest, placed perpendicular to the main spindle axis on both sides of the metaphase plate, were photoactivated using a laser‐based point scanner (Vector, 3i—Intelligent Imaging Innovations, Inc., Denver, CO, USA) in bipolar spindles, while 2–3 concentric rings were used for photoactivation of monopolar spindles. Photoactivation was carried out by one 5 ms pulse from a 405 nm laser. Images were acquired every 5 s for 4 min over three 0.5 μm‐separated z‐planes. Kymograph generation and velocity quantification were performed using a custom‐written MATLAB script (Pereira & Maiato, 2010). Initially, the spindle is stabilized by tracking the spindle poles, the coordinates of which are looked up to rotate and translate the rectangular ROIs covering the whole spindle for the definition of each kymograph layer. Each layer (a matrix) is then collapsed into a vector using a projection criteria (maximum or sum), generating a collapsed kymograph such as the ones shown in Fig 1D. To calculate flux velocity, a sparse set of manually chosen points is used as a first guess for stripe position at specific points. This initial estimate is made continuous by computing a cubic spline curve. Within a preset neighborhood, the position of the stripe at each time point is then corrected by calculating an intensity‐based centroid. Finally, a linear fit is performed to these corrected positions, the slope of which is the stripe velocity averaged over the time window used to generate the kymograph. In fact, two stripes are imprinted in each cell, the velocities of which (one positive and one negative) are subtracted and then halved to yield a poleward flux velocity relative to a virtual spindle equator, which is used as the final readout presented in quantifications.
CH‐STED microscopy
U2OS cells grown on glass coverslips and HeLa cells stably expressing a bacterial artificial chromosome encoding mouse CENP‐E‐GFP (LAP) under control of its own promotor and low copy number (Poser et al, 2008) grown on fibronectin‐coated coverslips were fixed using a solution of 4% paraformaldehyde (Electron microscopy sciences) and 0.1% glutaraldehyde (Electron microscopy sciences) for 10 min at RT. Autofluorescence was quenched using freshly prepared 0.01% sodium borohydride for 7 min at RT. Cells were permeabilized with 0.5% Triton X‐100 in PBS for 10 min at RT, washed, and incubated in blocking solution (10% fetal bovine serum [FBS] in 0.05% PBS‐Tween) for 30 min. Immunolabeling was performed with the following primary antibodies: rabbit anti‐CENP‐E (1:25, Abcam, ab133583), rabbit anti‐KIF4A (1:50; PA5‐30492, Thermo Scientific), rat anti‐tyrosinated tubulin (1:100, MCA77G, AbD Serotec), guinea pig anti‐CENP‐C (1:500, PD030, MBL International), rabbit anti‐GFP (1:100; house made), mouse anti‐α‐tubulin (1:500; clone B512, Sigma); and the following fluorescently labeled secondary antibodies: anti‐rabbit 580 STAR (1:100; Abberior), anti‐rat STAR RED (1:100, Abberior), anti‐mouse 635p STAR (1:100; Abberior), Alexa Fluor‐488 (1:1,000, Thermo Fisher Scientific), and DAPI (1 μg/ml) as DNA counterstain. CH‐STED microscopy was performed as described previously (Pereira et al, 2019). Briefly, CH‐STED uses a bivortex phase mask that generates a depletion beam with a tunable dip and high resilience to spherical and the other “radial” aberrations. Essentially, CH‐STED differs from conventional 2D‐STED in that it creates an axially concave excitation point‐spread function, meaning that the fluorophores at the focal plane region become the preferential source of fluorescence. This qualitative change provides optical sectioning without a pinhole. If a confocal pinhole is indeed used at the detection side, as in the case of this study, the two sectioning contributions operate serially, mutually reinforcing background reduction. An Abberior Instruments “Expert Line” gated‐STED was used coupled to a Nikon Ti microscope with 60× 1.4NA Plan‐Apo objective (Nikon, Lambda Series) oil‐immersion, pinhole size of 0.8 Airy units, 40 MHz modulated excitation (405, 488, 560, and 640 nm) and depletion (775 nm) lasers. Abberior's Inspector software was used to control the acquisition process.
Quantification and statistical analysis
Statistical analysis and graphs were generated in GraphPad Prism 8.0. Statistical details of experiments and tests used are indicated in the figure legends. The data points were tested for normality using Shapiro–Wilk test. Accordingly, statistical significance was determined by Student's t‐test (unpaired, two‐tailed) or one‐way ANOVA with Dunnet's post hoc test for data sets that followed a normal distribution pattern. For data sets that significantly deviated from a normal distribution, Mann–Whitney U‐test (unpaired, two‐tailed) or Kruskal–Wallis H‐test with Dunn's post hoc test were used. For parametric tests, F‐test was used to compare variances and Welch's correction was employed for conditions that did not have equal variances. Details of the statistical significance and n values for each conditions can be found in the figures and figure legends.
Author contributions
YS, GR, AJP, HM, and MB designed experiments; YS generated tools and performed and analyzed most of the experiments; YS and MB performed photoactivation experiments, image quantification, and analysis. GR performed and analyzed the spindle length‐related experiments. MO performed and analyzed initial photoactivation experiments; YS, AJP, and HM performed CH‐STED experiments and analysis; SG and AJ provided reagents; SE contributed to designing and analyzing the experiments; MB, YS, and GR wrote the manuscript, with contributions from all authors; MB conceived and coordinated the project.
Conflict of interest
The authors declare that they have no conflict of interest.
Supporting information
Expanded View Figures PDF
Table EV1
Movie EV1
Movie EV2
Movie EV3
Movie EV4
Movie EV5
Movie EV6
Movie EV7
Movie EV8
Movie EV9
Review Process File
Acknowledgements
We thank Duane Compton and Rene Medema for providing the U2OS PA‐GFP‐tubulin and U2OS PA‐GFP‐tubulin/mCherry‐tubulin cell lines, respectively. We thank Claire Walczak for providing the GFP‐HSET and GFP‐HSET N593K plasmids. We thank Martina Barisic for technical assistance. Work in the laboratory of MB is supported by grants from the Danish Cancer Society Scientific Committee (KBVU; R146‐A9322), the Lundbeck Foundation (R215‐2015‐4081), and the Novo Nordisk Foundation (NNF19OC0058504). Work in the laboratory of HM is funded by the European Research Council (grant agreement No 681443) under the European Union's Horizon 2020 research and innovation program.
The EMBO Journal (2020) 39: e105432
Data availability
This study includes no data deposited in external repositories.
References
- Antonio C, Ferby I, Wilhelm H, Jones M, Karsenti E, Nebreda AR, Vernos I (2000) Xkid, a chromokinesin required for chromosome alignment on the metaphase plate. Cell 102: 425–435 [DOI] [PubMed] [Google Scholar]
- Bajer AS, Molè‐Bajer J (1972) Spindle dynamics and chromosome movements. Int Rev Cytol Supplement 3: 271 [Google Scholar]
- Barisic M, Aguiar P, Geley S, Maiato H (2014) Kinetochore motors drive congression of peripheral polar chromosomes by overcoming random arm‐ejection forces. Nat Cell Biol 16: 1249–1256 [DOI] [PubMed] [Google Scholar]
- Barisic M, Silva e Sousa R, Tripathy SK, Magiera MM, Zaytsev AV, Pereira AL, Janke C, Grishchuk EL, Maiato H (2015) Mitosis. Microtubule detyrosination guides chromosomes during mitosis. Science 348: 799–803 [DOI] [PMC free article] [PubMed] [Google Scholar]
- Brinkley BR, Zinkowski RP, Mollon WL, Davis FM, Pisegna MA, Pershouse M, Rao PN (1988) Movement and segregation of kinetochores experimentally detached from mammalian chromosomes. Nature 336: 251–254 [DOI] [PubMed] [Google Scholar]
- Brouhard GJ, Hunt AJ (2005) Microtubule movements on the arms of mitotic chromosomes: polar ejection forces quantified in vitro . Proc Natl Acad Sci USA 102: 13903–13908 [DOI] [PMC free article] [PubMed] [Google Scholar]
- Brust‐Mascher I, Scholey JM (2002) Microtubule flux and sliding in mitotic spindles of Drosophila embryos. Mol Biol Cell 13: 3967–3975 [DOI] [PMC free article] [PubMed] [Google Scholar]
- Burbank KS, Mitchison TJ, Fisher DS (2007) Slide‐and‐cluster models for spindle assembly. Curr Biol 17: 1373–1383 [DOI] [PubMed] [Google Scholar]
- Cai S, O'Connell CB, Khodjakov A, Walczak CE (2009a) Chromosome congression in the absence of kinetochore fibres. Nat Cell Biol 11: 832–838 [DOI] [PMC free article] [PubMed] [Google Scholar]
- Cai S, Weaver LN, Ems‐McClung SC, Walczak CE (2009b) Kinesin‐14 family proteins HSET/XCTK2 control spindle length by cross‐linking and sliding microtubules. Mol Biol Cell 20: 1348–1359 [DOI] [PMC free article] [PubMed] [Google Scholar]
- Cameron LA, Yang G, Cimini D, Canman JC, Kisurina‐Evgenieva O, Khodjakov A, Danuser G, Salmon ED (2006) Kinesin 5‐independent poleward flux of kinetochore microtubules in PtK1 cells. J Cell Biol 173: 173–179 [DOI] [PMC free article] [PubMed] [Google Scholar]
- Campeau E, Ruhl VE, Rodier F, Smith CL, Rahmberg BL, Fuss JO, Campisi J, Yaswen P, Cooper PK, Kaufman PD (2009) A versatile viral system for expression and depletion of proteins in mammalian cells. PLoS ONE 4: e6529 [DOI] [PMC free article] [PubMed] [Google Scholar]
- Cassimeris L, Morabito J (2004) TOGp, the human homolog of XMAP215/Dis1, is required for centrosome integrity, spindle pole organization, and bipolar spindle assembly. Mol Biol Cell 15: 1580–1590 [DOI] [PMC free article] [PubMed] [Google Scholar]
- Chakraborty M, Tarasovetc EV, Zaytsev AV, Godzi M, Figueiredo AC, Ataullakhanov FI, Grishchuk EL (2019) Microtubule end conversion mediated by motors and diffusing proteins with no intrinsic microtubule end‐binding activity. Nat Commun 10: 1673 [DOI] [PMC free article] [PubMed] [Google Scholar]
- Cheeseman IM, Chappie JS, Wilson‐Kubalek EM, Desai A (2006) The conserved KMN network constitutes the core microtubule‐binding site of the kinetochore. Cell 127: 983–997 [DOI] [PubMed] [Google Scholar]
- DeLuca JG, Moree B, Hickey JM, Kilmartin JV, Salmon ED (2002) hNuf2 inhibition blocks stable kinetochore‐microtubule attachment and induces mitotic cell death in HeLa cells. J Cell Biol 159: 549–555 [DOI] [PMC free article] [PubMed] [Google Scholar]
- DeLuca JG (2010) Kinetochore‐microtubule dynamics and attachment stability. Methods Cell Biol 97: 53–79 [DOI] [PubMed] [Google Scholar]
- Desai A, Verma S, Mitchison TJ, Walczak CE (1999) Kin I kinesins are microtubule‐destabilizing enzymes. Cell 96: 69–78 [DOI] [PubMed] [Google Scholar]
- Dong Z, Zhu C, Zhan Q, Jiang W (2018) Cdk phosphorylation licenses Kif4A chromosome localization required for early mitotic progression. J Mol Cell Biol 10: 358–370 [DOI] [PubMed] [Google Scholar]
- Drechsler H, McHugh T, Singleton MR, Carter NJ, McAinsh AD (2014) The Kinesin‐12 Kif15 is a processive track‐switching tetramer. Elife 3: e01724 [DOI] [PMC free article] [PubMed] [Google Scholar]
- Dumont S, Mitchison TJ (2009) Compression regulates mitotic spindle length by a mechanochemical switch at the poles. Curr Biol 19: 1086–1095 [DOI] [PMC free article] [PubMed] [Google Scholar]
- Ems‐McClung SC, Walczak CE (2010) Kinesin‐13s in mitosis: key players in the spatial and temporal organization of spindle microtubules. Semin Cell Dev Biol 21: 276–282 [DOI] [PMC free article] [PubMed] [Google Scholar]
- Forer A (1965) Local reduction of spindle fiber birefringence in living nephrotoma suturalis (Loew) spermatocytes induced by ultraviolet microbeam irradiation. J Cell Biol 25(SUPPL): 95–117 [DOI] [PMC free article] [PubMed] [Google Scholar]
- Fu J, Bian M, Xin G, Deng Z, Luo J, Guo X, Chen H, Wang Y, Jiang Q, Zhang C (2015) TPX2 phosphorylation maintains metaphase spindle length by regulating microtubule flux. J Cell Biol 210: 373–383 [DOI] [PMC free article] [PubMed] [Google Scholar]
- Funabiki H, Murray AW (2000) The Xenopus chromokinesin Xkid is essential for metaphase chromosome alignment and must be degraded to allow anaphase chromosome movement. Cell 102: 411–424 [DOI] [PubMed] [Google Scholar]
- Gaetz J, Kapoor TM (2004) Dynein/dynactin regulate metaphase spindle length by targeting depolymerizing activities to spindle poles. J Cell Biol 166: 465–471 [DOI] [PMC free article] [PubMed] [Google Scholar]
- Ganem NJ, Compton DA (2004) The KinI kinesin Kif2a is required for bipolar spindle assembly through a functional relationship with MCAK. J Cell Biol 166: 473–478 [DOI] [PMC free article] [PubMed] [Google Scholar]
- Ganem NJ, Upton K, Compton DA (2005) Efficient mitosis in human cells lacking poleward microtubule flux. Curr Biol 15: 1827–1832 [DOI] [PubMed] [Google Scholar]
- Girao H, Okada N, Rodrigues TA, Silva AO, Figueiredo AC, Garcia Z, Moutinho‐Santos T, Hayashi I, Azevedo JE, Macedo‐Ribeiro S et al (2020) CLASP2 binding to curved microtubule tips promotes flux and stabilizes kinetochore attachments. J Cell Biol 219: e201905080 [DOI] [PMC free article] [PubMed] [Google Scholar]
- Hamaguchi Y, Toriyama M, Sakai H, Hiramoto Y (1987) Redistribution of fluorescently labeled tubulin in the mitotic apparatus of sand dollar eggs and the effects of taxol. Cell Struct Funct 12: 43–52 [DOI] [PubMed] [Google Scholar]
- van Heesbeen RG, Tanenbaum ME, Medema RH (2014) Balanced activity of three mitotic motors is required for bipolar spindle assembly and chromosome segregation. Cell Rep 8: 948–956 [DOI] [PubMed] [Google Scholar]
- Hiramoto Y, Izutsu K (1977) Poleward movement of “markers” existing in mitotic spindles of grasshopper spermatocytes. Cell Struct Funct 2: 257–259 [Google Scholar]
- Howell BJ, McEwen BF, Canman JC, Hoffman DB, Farrar EM, Rieder CL, Salmon ED (2001) Cytoplasmic dynein/dynactin drives kinetochore protein transport to the spindle poles and has a role in mitotic spindle checkpoint inactivation. J Cell Biol 155: 1159–1172 [DOI] [PMC free article] [PubMed] [Google Scholar]
- Hu CK, Ozlu N, Coughlin M, Steen JJ, Mitchison TJ (2012) Plk1 negatively regulates PRC1 to prevent premature midzone formation before cytokinesis. Mol Biol Cell 23: 2702–2711 [DOI] [PMC free article] [PubMed] [Google Scholar]
- Hueschen CL, Kenny SJ, Xu K, Dumont S (2017) NuMA recruits dynein activity to microtubule minus‐ends at mitosis. Elife 6: e29328 [DOI] [PMC free article] [PubMed] [Google Scholar]
- Itoh G, Ikeda M, Iemura K, Amin MA, Kuriyama S, Tanaka M, Mizuno N, Osakada H, Haraguchi T, Tanaka K (2018) Lateral attachment of kinetochores to microtubules is enriched in prometaphase rosette and facilitates chromosome alignment and bi‐orientation establishment. Sci Rep 8: 3888 [DOI] [PMC free article] [PubMed] [Google Scholar]
- Jiang K, Rezabkova L, Hua S, Liu Q, Capitani G, Altelaar AFM, Heck AJR, Kammerer RA, Steinmetz MO, Akhmanova A (2017) Microtubule minus‐end regulation at spindle poles by an ASPM‐katanin complex. Nat Cell Biol 19: 480–492 [DOI] [PMC free article] [PubMed] [Google Scholar]
- Kajtez J, Solomatina A, Novak M, Polak B, Vukusic K, Rudiger J, Cojoc G, Milas A, Sumanovac Sestak I, Risteski P et al (2016) Overlap microtubules link sister k‐fibres and balance the forces on bi‐oriented kinetochores. Nat Commun 7: 10298 [DOI] [PMC free article] [PubMed] [Google Scholar]
- Kapoor TM, Mayer TU, Coughlin ML, Mitchison TJ (2000) Probing spindle assembly mechanisms with monastrol, a small molecule inhibitor of the mitotic kinesin, Eg5. J Cell Biol 150: 975–988 [DOI] [PMC free article] [PubMed] [Google Scholar]
- Kapoor TM, Lampson MA, Hergert P, Cameron L, Cimini D, Salmon ED, McEwen BF, Khodjakov A (2006) Chromosomes can congress to the metaphase plate before biorientation. Science 311: 388–391 [DOI] [PMC free article] [PubMed] [Google Scholar]
- Kotak S, Busso C, Gonczy P (2012) Cortical dynein is critical for proper spindle positioning in human cells. J Cell Biol 199: 97–110 [DOI] [PMC free article] [PubMed] [Google Scholar]
- Kurasawa Y, Earnshaw WC, Mochizuki Y, Dohmae N, Todokoro K (2004) Essential roles of KIF4 and its binding partner PRC1 in organized central spindle midzone formation. EMBO J 23: 3237–3248 [DOI] [PMC free article] [PubMed] [Google Scholar]
- LaFountain JR Jr, Cohan CS, Siegel AJ, LaFountain DJ (2004) Direct visualization of microtubule flux during metaphase and anaphase in crane‐fly spermatocytes. Mol Biol Cell 15: 5724–5732 [DOI] [PMC free article] [PubMed] [Google Scholar]
- Lecland N, Luders J (2014) The dynamics of microtubule minus ends in the human mitotic spindle. Nat Cell Biol 16: 770–778 [DOI] [PubMed] [Google Scholar]
- Levesque AA, Compton DA (2001) The chromokinesin Kid is necessary for chromosome arm orientation and oscillation, but not congression, on mitotic spindles. J Cell Biol 154: 1135–1146 [DOI] [PMC free article] [PubMed] [Google Scholar]
- Liao S, Rajendraprasad G, Wang N, Eibes S, Gao J, Yu H, Wu G, Tu X, Huang H, Barisic M et al (2019) Molecular basis of vasohibins‐mediated detyrosination and its impact on spindle function and mitosis. Cell Res 29: 533–547 [DOI] [PMC free article] [PubMed] [Google Scholar]
- Logarinho E, Maffini S, Barisic M, Marques A, Toso A, Meraldi P, Maiato H (2012) CLASPs prevent irreversible multipolarity by ensuring spindle‐pole resistance to traction forces during chromosome alignment. Nat Cell Biol 14: 295–303 [DOI] [PubMed] [Google Scholar]
- Long AF, Suresh P, Dumont S (2020) Individual kinetochore‐fibers locally dissipate force to maintain robust mammalian spindle structure. J Cell Biol 219: e201911090 [DOI] [PMC free article] [PubMed] [Google Scholar]
- Maddox P, Straight A, Coughlin P, Mitchison TJ, Salmon ED (2003) Direct observation of microtubule dynamics at kinetochores in Xenopus extract spindles: implications for spindle mechanics. J Cell Biol 162: 377–382 [DOI] [PMC free article] [PubMed] [Google Scholar]
- Maffini S, Maia AR, Manning AL, Maliga Z, Pereira AL, Junqueira M, Shevchenko A, Hyman A, Yates JR 3rd, Galjart N et al (2009) Motor‐independent targeting of CLASPs to kinetochores by CENP‐E promotes microtubule turnover and poleward flux. Curr Biol 19: 1566–1572 [DOI] [PMC free article] [PubMed] [Google Scholar]
- Maiato H, Rieder CL, Khodjakov A (2004) Kinetochore‐driven formation of kinetochore fibers contributes to spindle assembly during animal mitosis. J Cell Biol 167: 831–840 [DOI] [PMC free article] [PubMed] [Google Scholar]
- Maiato H, Khodjakov A, Rieder CL (2005) Drosophila CLASP is required for the incorporation of microtubule subunits into fluxing kinetochore fibres. Nat Cell Biol 7: 42–47 [DOI] [PMC free article] [PubMed] [Google Scholar]
- Matos I, Pereira AJ, Lince‐Faria M, Cameron LA, Salmon ED, Maiato H (2009) Synchronizing chromosome segregation by flux‐dependent force equalization at kinetochores. J Cell Biol 186: 11–26 [DOI] [PMC free article] [PubMed] [Google Scholar]
- Mazumdar M, Sundareshan S, Misteli T (2004) Human chromokinesin KIF4A functions in chromosome condensation and segregation. J Cell Biol 166: 613–620 [DOI] [PMC free article] [PubMed] [Google Scholar]
- McCleland ML, Gardner RD, Kallio MJ, Daum JR, Gorbsky GJ, Burke DJ, Stukenberg PT (2003) The highly conserved Ndc80 complex is required for kinetochore assembly, chromosome congression, and spindle checkpoint activity. Genes Dev 17: 101–114 [DOI] [PMC free article] [PubMed] [Google Scholar]
- Merdes A, Ramyar K, Vechio JD, Cleveland DW (1996) A complex of NuMA and cytoplasmic dynein is essential for mitotic spindle assembly. Cell 87: 447–458 [DOI] [PubMed] [Google Scholar]
- Mimori‐Kiyosue Y, Grigoriev I, Sasaki H, Matsui C, Akhmanova A, Tsukita S, Vorobjev I (2006) Mammalian CLASPs are required for mitotic spindle organization and kinetochore alignment. Genes Cells 11: 845–857 [DOI] [PubMed] [Google Scholar]
- Mitchison TJ (1989) Polewards microtubule flux in the mitotic spindle: evidence from photoactivation of fluorescence. J Cell Biol 109: 637–652 [DOI] [PMC free article] [PubMed] [Google Scholar]
- Mitchison TJ, Maddox P, Groen A, Cameron L, Perlman Z, Ohi R, Desai A, Salmon ED, Kapoor TM (2004) Bipolarization and poleward flux correlate during Xenopus extract spindle assembly. Mol Biol Cell 15: 5603–5615 [DOI] [PMC free article] [PubMed] [Google Scholar]
- Miyamoto DT, Perlman ZE, Burbank KS, Groen AC, Mitchison TJ (2004) The kinesin Eg5 drives poleward microtubule flux in Xenopus laevis egg extract spindles. J Cell Biol 167: 813–818 [DOI] [PMC free article] [PubMed] [Google Scholar]
- Mollinari C, Kleman JP, Jiang W, Schoehn G, Hunter T, Margolis RL (2002) PRC1 is a microtubule binding and bundling protein essential to maintain the mitotic spindle midzone. J Cell Biol 157: 1175–1186 [DOI] [PMC free article] [PubMed] [Google Scholar]
- Mountain V, Simerly C, Howard L, Ando A, Schatten G, Compton DA (1999) The kinesin‐related protein, HSET, opposes the activity of Eg5 and cross‐links microtubules in the mammalian mitotic spindle. J Cell Biol 147: 351–366 [DOI] [PMC free article] [PubMed] [Google Scholar]
- Nguyen PA, Field CM, Mitchison TJ (2018) Prc1E and Kif4A control microtubule organization within and between large Xenopus egg asters. Mol Biol Cell 29: 304–316 [DOI] [PMC free article] [PubMed] [Google Scholar]
- O'Connell CB, Loncarek J, Hergert P, Kourtidis A, Conklin DS, Khodjakov A (2008) The spindle assembly checkpoint is satisfied in the absence of interkinetochore tension during mitosis with unreplicated genomes. J Cell Biol 183: 29–36 [DOI] [PMC free article] [PubMed] [Google Scholar]
- Pereira A, Sousa M, Almeida AC, Ferreira LT, Costa AR, Novais‐Cruz M, Ferras C, Sousa MM, Sampaio P, Belsley M et al (2019) Coherent‐hybrid STED: high contrast sub‐diffraction imaging using a bi‐vortex depletion beam. Opt Express 27: 8092–8111 [DOI] [PMC free article] [PubMed] [Google Scholar]
- Pereira AJ, Maiato H (2010) Improved kymography tools and its applications to mitosis. Methods 51: 214–219 [DOI] [PubMed] [Google Scholar]
- Pereira AJ, Maiato H (2012) Maturation of the kinetochore‐microtubule interface and the meaning of metaphase. Chromosome Res 20: 563–577 [DOI] [PubMed] [Google Scholar]
- Pfeiffenberger E, Sigl R, Geley S (2016) Conditional RNAi Using the Lentiviral GLTR System. Methods Mol Biol 1448: 121–138 [DOI] [PubMed] [Google Scholar]
- Polak B, Risteski P, Lesjak S, Tolic IM (2017) PRC1‐labeled microtubule bundles and kinetochore pairs show one‐to‐one association in metaphase. EMBO Rep 18: 217–230 [DOI] [PMC free article] [PubMed] [Google Scholar]
- Poser I, Sarov M, Hutchins JR, Heriche JK, Toyoda Y, Pozniakovsky A, Weigl D, Nitzsche A, Hegemann B, Bird AW et al (2008) BAC TransgeneOmics: a high‐throughput method for exploration of protein function in mammals. Nat Methods 5: 409–415 [DOI] [PMC free article] [PubMed] [Google Scholar]
- Radulescu AE, Cleveland DW (2010) NuMA after 30 years: the matrix revisited. Trends Cell Biol 20: 214–222 [DOI] [PMC free article] [PubMed] [Google Scholar]
- Renda F, Pellacani C, Strunov A, Bucciarelli E, Naim V, Bosso G, Kiseleva E, Bonaccorsi S, Sharp DJ, Khodjakov A et al (2017) The Drosophila orthologue of the INT6 onco‐protein regulates mitotic microtubule growth and kinetochore structure. PLoS Genet 13: e1006784 [DOI] [PMC free article] [PubMed] [Google Scholar]
- Rieder CL, Davison EA, Jensen LC, Cassimeris L, Salmon ED (1986) Oscillatory movements of monooriented chromosomes and their position relative to the spindle pole result from the ejection properties of the aster and half‐spindle. J Cell Biol 103: 581–591 [DOI] [PMC free article] [PubMed] [Google Scholar]
- Rieder CL, Salmon ED (1994) Motile kinetochores and polar ejection forces dictate chromosome position on the vertebrate mitotic spindle. J Cell Biol 124: 223–233 [DOI] [PMC free article] [PubMed] [Google Scholar]
- Rogers GC, Rogers SL, Schwimmer TA, Ems‐McClung SC, Walczak CE, Vale RD, Scholey JM, Sharp DJ (2004) Two mitotic kinesins cooperate to drive sister chromatid separation during anaphase. Nature 427: 364–370 [DOI] [PubMed] [Google Scholar]
- Sawin KE, Mitchison TJ (1991) Poleward microtubule flux mitotic spindles assembled in vitro . J Cell Biol 112: 941–954 [DOI] [PMC free article] [PubMed] [Google Scholar]
- Sawin KE, Mitchison TJ (1994) Microtubule flux in mitosis is independent of chromosomes, centrosomes, and antiparallel microtubules. Mol Biol Cell 5: 217–226 [DOI] [PMC free article] [PubMed] [Google Scholar]
- Schaar BT, Chan GK, Maddox P, Salmon ED, Yen TJ (1997) CENP‐E function at kinetochores is essential for chromosome alignment. J Cell Biol 139: 1373–1382 [DOI] [PMC free article] [PubMed] [Google Scholar]
- >Schlegel R, Pardee AB (1986) Caffeine‐induced uncoupling of mitosis from the completion of DNA replication in mammalian cells. Science 232: 1264–1266 [DOI] [PubMed] [Google Scholar]
- Shimamoto Y, Maeda YT, Ishiwata S, Libchaber AJ, Kapoor TM (2011) Insights into the micromechanical properties of the metaphase spindle. Cell 145: 1062–1074 [DOI] [PMC free article] [PubMed] [Google Scholar]
- Shrestha RL, Draviam VM (2013) Lateral to end‐on conversion of chromosome‐microtubule attachment requires kinesins CENP‐E and MCAK. Curr Biol 23: 1514–1526 [DOI] [PMC free article] [PubMed] [Google Scholar]
- Sigl R, Ploner C, Shivalingaiah G, Kofler R, Geley S (2014) Development of a multipurpose GATEWAY‐based lentiviral tetracycline‐regulated conditional RNAi system (GLTR). PLoS ONE 9: e97764 [DOI] [PMC free article] [PubMed] [Google Scholar]
- Sikirzhytski V, Renda F, Tikhonenko I, Magidson V, McEwen BF, Khodjakov A (2018) Microtubules assemble near most kinetochores during early prometaphase in human cells. J Cell Biol 217: 2647–2659 [DOI] [PMC free article] [PubMed] [Google Scholar]
- Suresh P, Long AF, Dumont S (2020) Microneedle manipulation of the mammalian spindle reveals specialized, short‐lived reinforcement near chromosomes. Elife 9: e53807 [DOI] [PMC free article] [PubMed] [Google Scholar]
- Tanenbaum ME, Macurek L, Janssen A, Geers EF, Alvarez‐Fernandez M, Medema RH (2009) Kif15 cooperates with eg5 to promote bipolar spindle assembly. Curr Biol 19: 1703–1711 [DOI] [PubMed] [Google Scholar]
- Tipton AR, Wren JD, Daum JR, Siefert JC, Gorbsky GJ (2017) GTSE1 regulates spindle microtubule dynamics to control Aurora B kinase and Kif4A chromokinesin on chromosome arms. J Cell Biol 216: 3117–3132 [DOI] [PMC free article] [PubMed] [Google Scholar]
- Vernos I, Raats J, Hirano T, Heasman J, Karsenti E, Wylie C (1995) Xklp1, a chromosomal Xenopus kinesin‐like protein essential for spindle organization and chromosome positioning. Cell 81: 117–127 [DOI] [PubMed] [Google Scholar]
- Vladimirou E, McHedlishvili N, Gasic I, Armond JW, Samora CP, Meraldi P, McAinsh AD (2013) Nonautonomous movement of chromosomes in mitosis. Dev Cell 27: 60–71 [DOI] [PubMed] [Google Scholar]
- Vukusic K, Buda R, Bosilj A, Milas A, Pavin N, Tolic IM (2017) Microtubule sliding within the bridging fiber pushes kinetochore fibers apart to segregate chromosomes. Dev Cell 43: 11–23.e16 [DOI] [PMC free article] [PubMed] [Google Scholar]
- Vukušić K, Buđa R, Ponjavić I, Risteski P, Tolić IM (2019) Chromosome segregation is driven by joint microtubule sliding action of kinesins KIF4A and EG5. bioRxiv, 863381 10.1101/863381 [PREPRINT] [DOI] [Google Scholar]
- Wandke C, Geley S (2006) Generation and characterization of an hKid‐specific monoclonal antibody. Hybridoma (Larchmt) 25: 41–43 [DOI] [PubMed] [Google Scholar]
- Wandke C, Barisic M, Sigl R, Rauch V, Wolf F, Amaro AC, Tan CH, Pereira AJ, Kutay U, Maiato H et al (2012) Human chromokinesins promote chromosome congression and spindle microtubule dynamics during mitosis. J Cell Biol 198: 847–863 [DOI] [PMC free article] [PubMed] [Google Scholar]
- Waterman‐Storer CM, Desai A, Bulinski JC, Salmon ED (1998) Fluorescent speckle microscopy, a method to visualize the dynamics of protein assemblies in living cells. Curr Biol 8: 1227–1230 [DOI] [PubMed] [Google Scholar]
- Wei RR, Al‐Bassam J, Harrison SC (2007) The Ndc80/HEC1 complex is a contact point for kinetochore‐microtubule attachment. Nat Struct Mol Biol 14: 54–59 [DOI] [PubMed] [Google Scholar]
- Wigge PA, Kilmartin JV (2001) The Ndc80p complex from Saccharomyces cerevisiae contains conserved centromere components and has a function in chromosome segregation. J Cell Biol 152: 349–360 [DOI] [PMC free article] [PubMed] [Google Scholar]
- Wise DA, Brinkley BR (1997) Mitosis in cells with unreplicated genomes (MUGs): spindle assembly and behavior of centromere fragments. Cell Motil Cytoskelet 36: 291–302 [DOI] [PubMed] [Google Scholar]
- Wolf F, Wandke C, Isenberg N, Geley S (2006) Dose‐dependent effects of stable cyclin B1 on progression through mitosis in human cells. EMBO J 25: 2802–2813 [DOI] [PMC free article] [PubMed] [Google Scholar]
- Wood KW, Sakowicz R, Goldstein LS, Cleveland DW (1997) CENP‐E is a plus end‐directed kinetochore motor required for metaphase chromosome alignment. Cell 91: 357–366 [DOI] [PubMed] [Google Scholar]
- Wordeman L, Wagenbach M, von Dassow G (2007) MCAK facilitates chromosome movement by promoting kinetochore microtubule turnover. J Cell Biol 179: 869–879 [DOI] [PMC free article] [PubMed] [Google Scholar]
- Wu G, Chen PL (2008) Structural requirements of chromokinesin Kif4A for its proper function in mitosis. Biochem Biophys Res Commun 372: 454–458 [DOI] [PubMed] [Google Scholar]
- Yen TJ, Compton DA, Wise D, Zinkowski RP, Brinkley BR, Earnshaw WC, Cleveland DW (1991) CENP‐E, a novel human centromere‐associated protein required for progression from metaphase to anaphase. EMBO J 10: 1245–1254 [DOI] [PMC free article] [PubMed] [Google Scholar]
- Zhang D, Rogers GC, Buster DW, Sharp DJ (2007) Three microtubule severing enzymes contribute to the “Pacman‐flux” machinery that moves chromosomes. J Cell Biol 177: 231–242 [DOI] [PMC free article] [PubMed] [Google Scholar]
- Zhu C, Jiang W (2005) Cell cycle‐dependent translocation of PRC1 on the spindle by Kif4 is essential for midzone formation and cytokinesis. Proc Natl Acad Sci USA 102: 343–348 [DOI] [PMC free article] [PubMed] [Google Scholar]
- Zhu C, Lau E, Schwarzenbacher R, Bossy‐Wetzel E, Jiang W (2006) Spatiotemporal control of spindle midzone formation by PRC1 in human cells. Proc Natl Acad Sci USA 103: 6196–6201 [DOI] [PMC free article] [PubMed] [Google Scholar]
Associated Data
This section collects any data citations, data availability statements, or supplementary materials included in this article.
Supplementary Materials
Expanded View Figures PDF
Table EV1
Movie EV1
Movie EV2
Movie EV3
Movie EV4
Movie EV5
Movie EV6
Movie EV7
Movie EV8
Movie EV9
Review Process File
Data Availability Statement
This study includes no data deposited in external repositories.