

Abstract
Introduction
Glycemic variability may predict poor outcomes in type 2 diabetes. We evaluated the associations of long-term variability in glycosylated hemoglobin (HbA1C) and fasting plasma glucose (FPG) with cardiovascular disease (CVD) and death among individuals with type 2 diabetes.
Research design and methods
We conducted a secondary, prospective cohort analysis of the Look AHEAD (Action for Health in Diabetes) data, including 3560 participants who attended four visits (baseline, 12 months, 24 months, and 36 months) at the outset. Variability of HbA1C and FPG was assessed using four indices across measurements from four study visits. Participants without CVD during the first 36 months were followed for incident outcomes including a CVD composite (myocardial infarction, stroke, hospitalization for angina, and CVD-related deaths), heart failure (HF), and deaths.
Results
Over a median follow-up of 6.8 years, there were 164 deaths from any cause, 33 CVD-related deaths, 91 HF events, and 340 participants experienced the CVD composite. Adjusted HRs comparing the highest to lowest quartile of SD of HbA1C were 2.10 (95% CI 1.26 to 3.51), 3.43 (95% CI 0.95 to 12.38), 1.01 (95% CI 0.69 to 1.46), and 1.71 (95% CI 0.69 to 4.24) for all-cause mortality, CVD mortality, CVD composite and HF, respectively. The equivalent HRs for highest versus lowest quartile of SD of FPG were 1.66 (95% CI 0.96 to 2.85), 2.20 (95% CI 0.67 to 7.25), 0.94 (95% CI 0.65 to 1.35), and 2.05 (95% CI 0.80 to 5.31), respectively.
Conclusions
A greater variability in HbA1C was associated with elevated risk of mortality. Our findings underscore the need to achieve normal and consistent glycemic control to improve clinical outcomes among individuals with type 2 diabetes.
Keywords: diabetes mellitus, type 2, mortality, cardiovascular system
Significance of this study.
What is already known about this subject?
Glycemic variability may predict poor outcomes in type 2 diabetes.
In assessing the adverse effects of long-term variability of glycemic measures in type 2 diabetes, previous studies have only focused on a single glycemic marker and have seldom evaluated several glycemic measures concomitantly.
What are the new findings?
Participants in the highest quartile of SD of glycosylated hemoglobin (HbA1C) had a 2.10-fold higher risk of all-cause mortality compared with those in the lowest quartile.
Participants in the top quartile of SD of fasting plasma glucose had a 1.66-fold higher risk of all-cause mortality compared with those in the bottom quartile.
Long-term glucose variability as assessed by HbA1C was more strongly associated with all-cause mortality.
How might these results change the focus of research or clinical practice?
Our findings indicate that higher glycemic variability predicts a greater mortality risk and underscore the need to achieve normal and consistent glycemic control to improve clinical outcomes among individuals with type 2 diabetes.
Introduction
Type 2 diabetes is highly prevalent in the USA and is responsible for significant morbidity and mortality, primarily from cardiovascular disease (CVD).1 2 Several clinical trials of intensive glucose control have not shown a significant reduction in rates of cardiovascular outcomes.3–6 This lack of effect of glucose-lowering strategies on CVD outcomes among individuals with diabetes has partially been attributed to the ‘metabolic memory’ effect.7–9 In the aforementioned trials and numerous observational studies, hyperglycemia has traditionally been assessed by punctual measurements of fasting plasma glucose (FPG) or glycosylated hemoglobin (HbA1C). Glycemic indices that reflect long-term trends in FPG or HbA1C may allow a more robust assessment of the risks associated with diabetes,6 10 as it may reflect metabolic memory.11 Accruing evidence suggests that glycemic variability is a potential predictor of the excess risk of CVD and death linked to hyperglycemia.6 10 12–14 Extant reports exploring the link between glycemic variability and cardiovascular outcomes in type 2 diabetes have mainly evaluated the variability of a single glycemic marker only,12–14 included a small sample size,12 and lacked racially/ethnically diversity in their samples.15–19 A limited number of studies have concomitantly assessed the long-term glycemic variability of multiple glycemic markers using a wide range of variability indices in a racially diverse sample of individuals with type 2 diabetes.
The Look AHEAD (Action for Health in Diabetes) study, a multicenter trial of intensive lifestyle intervention, included a large and diverse sample of adults with type 2 diabetes who had serial annual measurements of HbA1C and FPG. We conducted a cohort analysis of the Look AHEAD study to evaluate the associations of long-term variability in HbA1C and FPG with incident cardiovascular outcomes and mortality. We hypothesized that higher glycemic variability would be associated with higher risks of cardiovascular outcomes and deaths.
Methods
Study design
The Look AHEAD study was a multicenter, randomized clinical trial designed to evaluate effects on cardiovascular outcomes of Intensive Lifestyle Intervention versus Diabetes Support and Education in individuals with type 2 diabetes (ClinicalTrials.gov number: NCT00017953).20 A total of 5145 overweight or obese adults with type 2 diabetes aged 45 to 76 years were recruited between August 2001 and April 2004 across 16 sites in the USA in the trial, which ended on September 14 2012.
For the current investigation, we included participants with complete data on HbA1C and FPG at the baseline, 12-month, 24-month, and 36-month visits. We excluded participants who had CVD, HF events or died before the 36-month visit (n=650), those with consent restrictions (n=244), or prevalent CVD at baseline (n=691). Following these exclusions, 3560 participants were included in our analyses. Participants were followed for events from their 36-month visit until the occurrence of an outcome or the end of study.
The research protocol was approved by the institutional review board at each participating site and each participant gave an informed consent.20 We were granted access by the NIH to the publicly available datasets in the NHLBI Biorepository (BioLINCC).
Assessment of variability of glycemic markers
At each visit, participant provided venous blood samples after 12 hours of fasting. Blood assays were performed at the Look AHEAD Central Biochemistry Laboratory. HbA1C was assayed using a dedicated ion exchange high-performance liquid chromatography method (Bio-Rad Variant II). FPG was measured using the glucokinase method.20
For each glycemic marker (HbA1C or FPG), long-term variability was defined using four metrics: (1) the intraindividual standard deviation (SD) across the four visits, (2) the coefficient of variation (CV), (3) the average successive variability (ASV) defined as the average absolute difference between consecutive values, and (4) the variability independent of the mean (VIM) computed as 100*SD/meanα, where α is the regression coefficient based on the natural logarithm of SD on the natural logarithm of the glycemic measure’s mean.13
As there is no consensus on the gold standard measure of variability, we included multiple indices, which allow the capture of various aspects of glycemic variability.21
Ascertainment of clinical outcomes
We assessed four outcomes: (1) all-cause mortality, (2) cardiovascular mortality, (3) a CVD composite (composite of myocardial infarction, hospitalization for angina, stroke, and death from cardiovascular causes), and (4) incident heart failure (HF). The ascertainment process of cardiovascular events in Look AHEAD has been described previously, including the adjudication process.22
Covariates
The covariates were selected a priori based on their role as potential confounders. The baseline characteristics included age, sex, race/ethnicity, randomization arm, cigarette smoking status, alcohol consumption, body mass index (BMI), use of antihypertensive medication, duration of diabetes, and estimated glomerular filtration rate (eGFR) calculated using the Chronic Kidney Disease Epidemiology Collaboration equation.23 Additionally, data obtained from baseline through the fourth visit were used to compute average systolic and diastolic blood pressures (BP), average ratio of total to high-density lipoprotein (HDL) cholesterol, average FPG, and average HbA1C.22
Statistical analyses
For each glycemic marker, participants were categorized into quartiles of the intraindividual SD. The characteristics of participants were reported across these quartiles as proportions for categorical variables and mean (SD) or median (interquartile range (IQR)) for continuous variables. Categorical variables were compared using the χ2 test, and continuous variables were compared using the analysis of variance or Kruskal-Wallis test as relevant.
Kaplan-Meier curves were used to assess the time-to-event distributions and were compared using the log-rank test. Cox proportional hazards regression models were used to model each outcome and to compute adjusted HRs and 95% CIs. For both HbA1C and FPG, each measure of variability (SD, CV, ASV, and VIM) was modeled as a continuous variable and quartiles (with the lowest quartile serving as the reference group). Regression models were built in a sequential manner. The first model adjusted for age, sex, race/ethnicity, and randomization arm (model 1). The second model included covariates in model 1 plus BMI, current smoking, alcohol drinking, use of BP-lowering medication, average total-to-HDL cholesterol ratio, eGFR, duration of diabetes, and average systolic BP (model 2). To explore the effect of glycemic variability independent of glycemic level, we constructed an additional model (model 3), further accounting for average HbA1C (when assessing variability of HbA1C) or average FPG (when assessing FPG variability), except for the VIM metric which already accounts for the mean of HbA1C or FPG.
All analyses were conducted using STATA 14.2 (Stata, College Station, Texas, USA). A two-sided p-value of <0.05 was considered statistically significant.
Results
Characteristics of study participants
A total of 3560 participants were included in our analyses. Table 1 displays the characteristics of participants by quartiles of SD of HbA1C. Compared with those in the lowest quartile, participants in the highest quartile were younger and more frequently Black or Hispanic. Additionally, they had higher BMI, BP values, ratios of total-to-HDL cholesterol, HbA1C, FPG as well as a longer duration of diabetes. Participants in the lowest quartile were more likely to be women or Caucasians.
Table 1.
Characteristics of participants by quartiles of SD of hemoglobin A1C in the Look AHEAD study
| Entire sample, N=3560 |
Quartiles of SD of hemoglobin A1C, % | P value | ||||
| Q1 (<0.259), n=900 |
Q2 (0.259–0.430), n=884 |
Q3 (0.430–0.697), n=887 |
Q4 (>0.697), n=889 |
|||
| At baseline | ||||||
| Age, years | 58.4 (6.7) | 59.5 (6.7) | 59.2 (6.6) | 58.3 (6.6) | 56.6 (6.4) | <0.001 |
| Women, % | 62.1 | 66.3 | 60.3 | 59.0 | 62.7 | 0.008 |
| Randomization arm, % | 0.632 | |||||
| Diabetes support and education | 48.9 | 49.8 | 49.3 | 49.5 | 47.0 | |
| Intensive lifestyle intervention | 51.1 | 50.2 | 50.7 | 50.5 | 53.0 | |
| Race/ethnicity, % | 0.001 | |||||
| Caucasian | 67.0 | 70.2 | 69.1 | 66.4 | 62.2 | |
| Non-Hispanic black | 17.1 | 16.0 | 16.2 | 17.3 | 18.8 | |
| Hispanic | 12.6 | 10.4 | 10.4 | 13.1 | 16.3 | |
| Body mass index, kg/m2 | 36.0 (5.9) | 35.2 (5.9) | 35.6 (6.0) | 36.3 (5.7) | 36.9 (6.0) | <0.001 |
| Current smoking, % | 3.7 | 3.2 | 2.7 | 4.0 | 4.7 | 0.122 |
| Alcohol drinking, % | 33.4 | 34.9 | 33.4 | 33.6 | 31.6 | 0.533 |
| Use of antihypertensive medication, % | 70.9 | 70.9 | 70.4 | 71.7 | 70.8 | 0.938 |
| Duration of diabetes, years | 5.0 (2.0–9.0) | 4.0 (1.0–7.0) | 4.0 (2.0–8.0) | 5.0 (2.0–10.0) | 6.0 (3.0–10.0) | <0.001 |
| eGFR, mL/min/1.73 m2 | 90.9 (15.7) | 89.2 (15.6) | 89.5 (15.5) | 91.0 (15.8) | 93.9 (15.6) | <0.001 |
| During follow-up | ||||||
| Average systolic blood pressure, mm Hg | 125.6 (13.9) | 123.9 (13.7) | 124.7 (12.8) | 126.3 (14.2) | 127.5 (14.5) | <0.001 |
| Average diastolic blood pressure, mm Hg | 68.4 (8.0) | 67.2 (7.8) | 68.5 (7.8) | 68.5 (8.2) | 69.5 (8.0) | <0.001 |
| Average total-to-HDL cholesterol ratio | 4.2 (1.2) | 4.1 (1.2) | 4.1 (1.1) | 4.3 (1.2) | 4.5 (1.2) | <0.001 |
| Fasting plasma glucose, mg/dL | ||||||
| Baseline fasting plasma glucose, mg/dL | 151.4 (44.5) | 127.8 (26.1) | 140.0 (32.4) | 156.6 (39.4) | 181.5 (55.0) | <0.001 |
| 12-month fasting plasma glucose, mg/dL | 136.4 (41.7) | 122.3 (26.7) | 128.4 (32.0) | 139.7 (39.9) | 155.2 (54.8) | <0.001 |
| 24-month fasting plasma glucose, mg/dL | 140.0 (45.0) | 122.8 (25.5) | 131.0 (32.8) | 142.4 (41.6) | 164.0 (60.9) | <0.001 |
| 36-month fasting plasma glucose, mg/dL | 142.3 (45.6) | 124.7 (25.7) | 133.9 (32.6) | 144.7 (40.4) | 166.0 (63.4) | <0.001 |
| Average fasting plasma glucose, mg/dL | 142.5 (33.9) | 124.4 (21.8) | 133.4 (26.1) | 145.8 (31.2) | 166.6 (38.3) | <0.001 |
| Hemoglobin A1C, % | ||||||
| Baseline hemoglobin A1C, % | 7.2 (1.1) | 6.4 (0.7) | 6.8 (0.7) | 7.4 (0.9) | 8.2 (1.3) | <0.001 |
| 12-month hemoglobin A1C, % | 6.8 (1.1) | 6.3 (0.7) | 6.5 (0.8) | 6.9 (1.0) | 7.5 (1.5) | <0.001 |
| 24-month hemoglobin A1C, % | 6.9 (1.3) | 6.4 (0.7) | 6.6 (0.8) | 7.0 (1.1) | 7.8 (1.7) | <0.001 |
| 36-month hemoglobin A1C, % | 7.0 (1.3) | 6.4 (0.7) | 6.7 (0.8) | 7.1 (1.1) | 7.9 (1.8) | <0.001 |
| Average hemoglobin A1C, % | 7.0 (1.0) | 6.4 (0.7) | 6.7 (0.7) | 7.1 (0.9) | 7.8 (1.1) | <0.001 |
Data are mean (SD), median (IQR), or proportion as appropriate.
AHEAD, Action for Health in Diabetes; eGFR, estimated glomerular filtration rate; HDL, high-density lipoprotein; hemoglobin A1C, glycosylated hemoglobin; Q, quartile.
The distribution of study participants by quartiles of SD of FPG was generally comparable to that by quartiles of SD of HbA1C (online supplemental table S1).
bmjdrc-2020-001753supp001.pdf (249.2KB, pdf)
Over a median follow-up period of 6.8 years (IQR 6.0–7.4), there were a total of 164 deaths from any cause, 33 cardiovascular deaths, 91 HF events, and 340 participants were categorized as having the CVD composite.
Kaplan-Meier curves for all-cause mortality, cardiovascular mortality, CVD composite and incident HF by quartiles of SD of HbA1C are displayed in figure 1. In unadjusted comparisons, higher HbA1C variability was significantly associated with greater risks of all-cause mortality, cardiovascular mortality, and HF, but not the CVD composite (figure 1 and online supplemental figure S1). After multivariable adjustment, these associations remained significant only for all-cause mortality and cardiovascular mortality (table 2).
Figure 1.
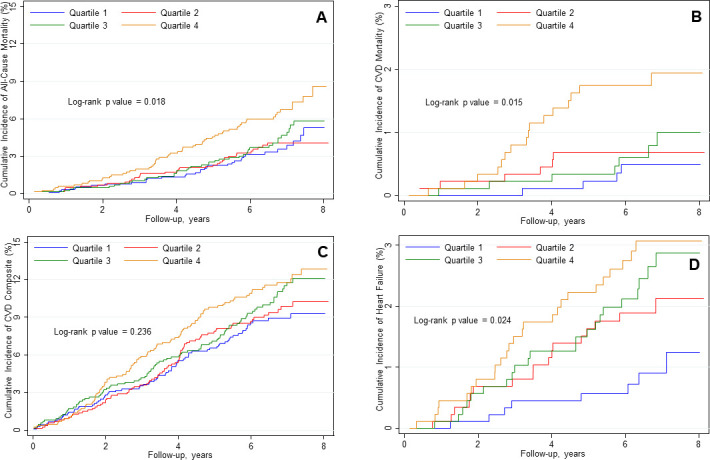
Cumulative hazard of all-cause mortality (A), cardiovascular mortality (B), cardiovascular disease (CVD) composite (C), and incident heart failure (D) by quartile of SD of hemoglobin A1C. CVD composite was a composite of myocardial infarction, stroke, hospitalization for angina, and death for cardiovascular causes. hemoglobin A1C, glycosylated hemoglobin.
Table 2.
HRs for clinical outcomes by intraindividual SD of HbA1C in the Look AHEAD study
| Outcome | Quartiles of SD of hemoglobin A1C, % | Ptrend | Per SD | |||
| Q1 (<0.259) | Q2 (0.259–0.430) | Q3 (0.430–0.697) | Q4 (>0.697) | |||
| All-cause mortality | ||||||
| Model 1 | Reference | 1.04 (0.64 to 1.69) | 1.35 (0.85 to 2.15) | 2.47 (1.60 to 3.83)*** | <0.001 | 1.38 (1.22 to 1.56)*** |
| Model 2 | Reference | 1.04 (0.64 to 1.70) | 1.24 (0.77 to 1.99) | 2.19 (1.39 to 3.44)** | <0.001 | 1.34 (1.17 to 1.52)*** |
| Model 3 | Reference | 1.03 (0.63 to 1.69) | 1.22 (0.75 to 1.98) | 2.10 (1.26 to 3.51)** | 0.005 | 1.34 (1.14 to 1.57)*** |
| Cardiovascular mortality | ||||||
| Model 1 | Reference | 1.49 (0.42 to 5.30) | 1.86 (0.54 to 6.37) | 5.25 (1.73 to 15.97)** | 0.001 | 1.53 (1.20 to 1.96)** |
| Model 2 | Reference | 1.38 (0.38 to 4.99) | 1.64 (0.47 to 5.72) | 3.64 (1.14 to 11.66)* | 0.018 | 1.46 (1.10 to 1.93)** |
| Model 3 | Reference | 1.36 (0.37 to 4.95) | 1.60 (0.45 to 5.70) | 3.43 (0.95 to 12.38) | 0.050 | 1.44 (1.01 to 2.05)* |
| CVD composite† | ||||||
| Model 1 | Reference | 1.07 (0.78 to 1.47) | 1.27 (0.93 to 1.73) | 1.55 (1.14 to 2.11)** | 0.003 | 1.14 (1.03 to 1.26)* |
| Model 2 | Reference | 1.10 (0.80 to 1.52) | 1.15 (0.84 to 1.58) | 1.29 (0.94 to 1.78) | 0.119 | 1.06 (0.95 to 1.18) |
| Model 3 | Reference | 1.05 (0.76 to 1.45) | 1.02 (0.73 to 1.42) | 1.01 (0.69 to 1.46) | 0.994 | 0.95 (0.83 to 1.08) |
| Heart failureevent | ||||||
| Model 1 | Reference | 2.20 (0.95 to 5.11) | 2.96 (1.31 to 6.66)** | 3.87 (1.73 to 8.66)** | <0.001 | 1.33 (1.11 to 1.60)** |
| Model 2 | Reference | 2.17 (0.93 to 5.04) | 2.29 (1.00 to 5.23)* | 2.64 (1.16 to 6.01)* | 0.030 | 1.21 (1.00 to 1.47) |
| Model 3 | Reference | 2.00 (0.86 to 4.66) | 1.90 (0.82 to 4.40) | 1.71 (0.69 to 4.24) | 0.372 | 1.03 (0.80 to 1.31) |
Data are HRs (95% CIs) unless otherwise indicated.
Model 1 adjusted for age, sex, race/ethnicity, and randomization arm. Model 2 includes variables in model 1 with further adjustment for body mass index, current smoking, alcohol drinking, use of antihypertensive medications, average ratio of total to high-density lipoprotein cholesterol, estimated glomerular filtration rate, duration of diabetes, and average systolic blood pressure. Model 3 includes model 2 plus further adjustment for average HbA1C.
*P<0.05, **p<0.01, ***p<0.001.
†CVD composite was a composite of myocardial infarction, hospitalization for angina, stroke, and death for cardiovascular causes.
AHEAD, Action for Health in Diabetes; CVD, cardiovascular disease; HbA1C, glycosylated hemoglobin; Q, quartile.
Long-term variability of HbA1C and clinical outcomes
The adjusted HRs per SD increment in intraindividual SD of HbA1C are displayed in table 2. After full adjustment, each SD increase in the intraindividual SD of HbA1C was associated with HRs of 1.34 (95% CI 1.14 to 1.57, p<0.001) for all-cause mortality, 1.44 (95% CI 1.01 to 2.05, p=0.045) for cardiovascular mortality, 0.95 (95% CI 0.83 to 1.08, p=0.416) for CVD composite and 1.03 (95% CI 0.80 to 1.31, p=0.842) for incident HF (table 2). Similarly, the HRs per SD increase in the VIM of HbA1C were 1.31 (95% CI 1.14 to 1.50, p<0.001), 1.30 (95% CI 0.94 to 1.81, p=0.115), 0.98 (95% CI 0.87 to 1.10, p=0.718), and 1.01 (95% CI 0.80 to 1.29, p=0.911) for all-cause mortality, cardiovascular mortality, CVD composite and incident HF, respectively (online supplemental table S2). The adjusted HRs per SD increment in the CV and ASV of HbA1C are shown in online supplemental tables S3 and S4).
When compared with the lowest quartile, the adjusted HRs associated with the highest quartile of SD of HbA1C were 2.10 (95% CI 1.26 to 3.51), 3.43 (95% CI 0.95 to 12.38), 1.01 (95% CI 0.69 to 1.46), and 1.71 (95% CI 0.69 to 4.24) for all-cause mortality, cardiovascular mortality, CVD composite and incident HF, respectively (table 2). Likewise, the HRs for the highest quartile (vs lowest quartile) of the VIM of HbA1C were 1.59 (95% CI 1.02 to 2.46), 4.54 (95% CI 0.97 to 21.29), 0.90 (95% CI 0.66 to 1.25), and 1.30 (95% CI 0.61 to 2.75) for all-cause mortality, cardiovascular mortality, CVD composite and incident HF, respectively (online supplemental table S2). Similar results were obtained for the CV of HbA1C (online supplemental table S3).
Long-term variability of FPG and clinical outcomes
After multivariable adjustment, the HRs per SD increase in the intraindividual SD of FPG were 1.29 (95% CI 1.08 to 1.53, p=0.005), 1.25 (95% CI 0.84 to 1.86, p=0.272), 1.03 (95% CI 0.91 to 1.18, p=0.609), and 1.17 (95% CI 0.91 to 1.50, p=0.231) for all-cause deaths, cardiovascular deaths, CVD composite and incident HF, respectively (table 3). The equivalent HRs per SD increase in the VIM of FPG were 1.13 (95% CI 0.99 to 1.29, p=0.073), 1.28 (95% CI 0.99 to 1.66, p=0.059), 1.00 (95% CI 0.89 to 1.11, p=0.940), and 1.10 (95% CI 0.89 to 1.37, p=0.386 (online supplemental table S5). The multivariable-adjusted HRs per SD increment in the CV and ASV are shown in online supplemental tables S6 and S7).
Table 3.
HRs for clinical outcomes by intraindividual SD of fasting plasma glucose in the Look AHEAD study
| Outcome | Quartiles of SD of fasting plasma glucose, mg/dL | Ptrend | Per SD | |||
| Q1 (<10.15) | Q2 (10.15–17.53) | Q3 (17.53–29.80) | Q4 (>29.80) | |||
| All-cause mortality | ||||||
| Model 1 | Reference | 1.37 (0.84 to 2.23) | 1.94 (1.22 to 3.10)** | 2.18 (1.37 to 3.48)** | <0.001 | 1.36 (1.19 to 1.55)*** |
| Model 2 | Reference | 1.27 (0.78 to 2.08) | 1.72 (1.07 to 2.78)* | 1.83 (1.12 to 2.98)* | 0.007 | 1.29 (1.12 to 1.48)*** |
| Model 3 | Reference | 1.25 (0.76 to 2.05) | 1.65 (1.02 to 2.69)* | 1.66 (0.96 to 2.85) | 0.039 | 1.29 (1.08 to 1.53)** |
| Cardiovascular mortality | ||||||
| Model 1 | Reference | 0.98 (0.32 to 3.05) | 1.28 (0.43 to 3.82) | 2.78 (1.06 to 7.29)* | 0.021 | 1.44 (1.10 to 1.90)** |
| Model 2 | Reference | 0.99 (0.31 to 3.15) | 0.90 (0.26 to 3.06) | 2.27 (0.79 to 6.51) | 0.104 | 1.30 (0.95 to 1.78) |
| Model 3 | Reference | 0.98 (0.31 to 3.15) | 0.89 (0.26 to 3.08) | 2.20 (0.67 to 7.25) | 0.210 | 1.25 (0.84 to 1.86) |
| CVD composite† | ||||||
| Model 1 | Reference | 0.96 (0.70 to 1.31) | 1.06 (0.78 to 1.45) | 1.41 (1.05 to 1.89)* | 0.018 | 1.20 (1.09 to 1.32)*** |
| Model 2 | Reference | 0.93 (0.68 to 1.28) | 0.90 (0.65 to 1.25) | 1.16 (0.85 to 1.58) | 0.384 | 1.11 (1.01 to 1.24)* |
| Model 3 | Reference | 0.89 (0.65 to 1.23) | 0.83 (0.60 to 1.16) | 0.94 (0.65 to 1.35) | 0.620 | 1.03 (0.91 to 1.18) |
| Heart failureevent | ||||||
| Model 1 | Reference | 2.89 (1.22 to 6.84)* | 2.92 (1.23 to 6.96)* | 4.23 (1.83 to 9.77)** | 0.001 | 1.42 (1.19 to 1.69)*** |
| Model 2 | Reference | 2.45 (1.03 to 5.85)* | 2.44 (1.02 to 5.85)* | 2.79 (1.17 to 6.63)* | 0.039 | 1.28 (1.04 to 1.56)* |
| Model 3 | Reference | 2.33 (0.98 to 5.58) | 2.17 (0.89 to 5.26) | 2.05 (0.80 to 5.31) | 0.256 | 1.17 (0.91 to 1.50) |
Data are HRs (95% CIs) unless otherwise indicated.
Model 1 adjusted for age, sex, race/ethnicity, and randomization arm. Model 2 includes variables in model 1 with further adjustment for body mass index, current smoking, alcohol drinking, use of antihypertensive medications, average ratio of total to high-density lipoprotein cholesterol, estimated glomerular filtration rate, duration of diabetes, and average systolic blood pressure. Model 3 includes model 2 plus further adjustment for average fasting plasma glucose.
*P<0.05, **p<0.01, ***p<0.001.
†CVD composite was a composite of myocardial infarction, hospitalization for angina, stroke, and death for cardiovascular causes.
AHEAD, Action for Health in Diabetes; CVD, cardiovascular disease; Q, quartile.
The adjusted HRs of the highest (vs lowest) quartile of SD of FPG were 1.66 (95% CI 0.96 to 2.85), 2.20 (95% CI 0.67 to 7.25), 0.94 (95% CI 0.65 to 1.35), and 2.05 (95% CI 0.80 to 5.31) for all-cause mortality, cardiovascular mortality, CVD composite and incident HF, respectively (table 3). The HRs for the highest quartile (vs lowest quartile) of VIM of FPG were 1.53 (95% CI 0.96 to 2.43), 1.25 (95% CI 0.52 to 2.99), 1.02 (95% CI 0.75 to 1.39), and 1.61 (95% CI 0.81 to 3.23) for all-cause mortality, cardiovascular mortality, CVD composite and incident HF, respectively (online supplemental table S5). The HRs by quartiles of CV and ASV of FPG are displayed in online supplemental tables S6 and 7).
Discussion
We evaluated the associations of visit-to-visit variability of two glycemic markers (HbA1C and FPG) with clinical outcomes in a large sample of individuals with type 2 diabetes. We observed that higher variability of HbA1C was associated with increased mortality independently of the key relevant CVD risk factors and the average of HbA1C over follow-up. The associations between measures of HbA1C variability and outcomes tended to be stronger than those with FPG variability. The lack of homogeneity in the magnitude and significance of the associations with outcomes across variability indices suggest that they possibly represent different aspects of variability.
Our findings underscore the need of a consistent and less variable glycemic control over time and indicate that HbA1C variability is potentially a better marker of long-term glycemic variability than FPG variability. Our results also suggest that long-term glycemic variability, especially that measured by HbA1C may capture the metabolic memory effect, which has been shown to be detrimental in terms of outcomes in diabetes.7–9
To our knowledge, our study is unique in its kind to include in its assessment of long-term glycemic variability of two glycemic markers, as well as the assessment of incident HF as a separate outcome.12–19 24 A prior systematic review of adverse events associated with glycemic variability in people with diabetes showed that prior studies limited by their retrospective design, a small sample size, the lack of racially diverse samples, and the focus on single glycemic markers.12–19 24 Nonetheless, our findings corroborate previous reports that have shown a positive relation between glycemic variability and mortality rates.13 14 The positive association will all-cause mortality (but not CVD events) supports the previously reported links between glycemic variability and other drivers of mortality in type 2 diabetes including microvascular complications,25–27 as well as malignancies.28 The lack of association between glycemic variability and CVD events is consistent with data from previous studies of patients with type 2 diabetes.13 29 30 As type 2 diabetes is independently associated with an excess risk of HF, we evaluated the association of glycemic variability with incident HF as a separate outcome. Indeed, it has been suggested that mechanisms through which diabetes increase atherosclerotic CVD (including oxidative stress, non-enzymatic glycation, endothelial dysfunction) likely extend to the myocardium and contribute to myocardial fibrosis is remodeling.31 The absence of association with HF in observed our study suggests that the increased risk of HF in people with diabetes may be related to other mechanisms including cardiac autonomic neuropathy.31
The mechanisms relating glycemic variability to adverse outcomes are incompletely understood, but a few hypotheses have been suggested. Blood glucose fluctuations may worsen oxidative stress, which induces endothelial dysfunction and ultimately atherosclerosis.32–34 Glycemic fluctuations could foster the release of inflammatory cytokines, the adhesion of monocytes to endothelial cells, and endothelial cell apoptosis, which all drive diabetes-related complications.34 35 Additionally, glycemic alterations significantly attenuate the response to oxidative stress by decreasing the induction of superoxidase dismutase activity.36 Hyperglycemia has been proven to downregulate the genes involved in detoxication and free radical scavenging, further worsening the effects of oxidative stress.37 Additionally, glycemic fluctuations have been associated to epigenetic changes in endothelial and mononuclear cells that contribute to endothelial dysfunction and inflammation.32 Moreover, oscillating blood glucose has been shown in mechanistic studies to have stronger effects than constant hyperglycemia at inducing a metabolic memory.11 Finally, fluctuating blood glucose has cytotoxic effects in the pancreas, leading to a significant reduction of glucose-mediated insulin secretion, beta cells’ apoptosis, and mitochondrial alterations,38 perpetuating the vicious cycle of worsening glycemic control and complications of diabetes.39
Our findings have potential implications, as these add to the growing body of evidence on the prognostic value of glycemic variability.12–19 24
A few limitations to this study should be acknowledged. First, although we evaluated two glycemic markers, we did not have data on the 2-hour post oral load glucose level. Second, our study was observational and there is a possibility of unmeasured, residual confounding.
Third, given that we excluded participants who died during the first 36 months of follow-up, it is likely that subjects at the high extreme of variability were not included in our analytical sample. This would suggest that the effects of glycemic variability on mortality are actually higher than those observed in this study. Finally, our estimation of variability relied on glycemic measures assessed at only four time points, which may be a limitation, as a higher number of visits may more reliably capture variability, as suggested by data from the BP literature.40 This latter phenomenon may have affected the magnitude and significance of our effect estimates. Despite these limitations, our study has multiple strengths. First, we used a large multiracial/ethnic sample of participants. Second, our study is one of a few that evaluated variability of two glycemic markers, as opposed to prior studies which measured a single glycemic index.12–17 19 Third, the outcomes (including HF, which had seldom been evaluated previously) were ascertained following a standardized process, and relevant confounders including the average of HbA1C and FPG over the follow-up period were accounted for in the analyses.
In conclusion, in a large sample of adults with type 2 diabetes, a higher long-term variability of glycemic measures is associated with greater risks of mortality, above and beyond the degree of glycemic control. Further research is needed to elucidate the mechanisms underlying these associations and to evaluate the potential benefit of lowering glycemic variability in curbing the excess mortality in individuals with type 2 diabetes.
Acknowledgments
The authors wish to thank the staff and participants of the Look AHEAD Study for their valuable contributions.
Footnotes
Correction notice: This article has been corrected since it was published. Author notes have been added.
Contributors: ADK performed the statistical analyses, interpreted the results, participated in the discussion, wrote the first draft of the manuscript, and revised the manuscript. PS, SE, RSA interpreted the results, participated in the discussion, and revised the manuscript. JBE-T conceived the idea for the study, designed the study, interpreted the results, participated in the discussion, and revised the manuscript. JBE-T is the guarantor of this work and, as such, had full access to all the data in the study and takes responsibility for the integrity of the data and the accuracy of the data analysis. All authors gave final approval of the version to be published.
Funding: JBE-T received funding from the Department of Medicine, Division of Endocrinology, Johns Hopkins School of Medicine. JBE-T was also supported by the Johns Hopkins School of Medicine Dean’s Diversity Award. SE is supported by funding from the Department of Veterans Affairs, Veterans Health Administration, VISN 1 Career Development Award. SE also received funding from Center for AIDS Research, The Rhode Island Foundation, and Lifespan Cardiovascular Institute.
Competing interests: None declared.
Patient consent for publication: Not required.
Provenance and peer review: Not commissioned; externally peer reviewed.
Data availability statement: Data are available on reasonable request.
Author note: (1) The Look AHEAD study was conducted by the Look AHEAD Investigators and supported by the National Institute of Diabetes and Digestive and Kidney Diseases (NIDDK). The data from the Look AHEAD reported here were supplied by the NIDDK Central Repositories. This manuscript was not prepared in collaboration with Investigators of the Look AHEAD study and does not necessarily reflect the opinions or views of the Look Ahead Study, the NIDDK Central Repositories, or the NIDDK. (2) Look AHEAD was conducted by the Look AHEAD Research Group and supported by the National Institute of Diabetes and Digestive and Kidney Diseases (NIDDK); the National Heart, Lung, and Blood Institute (NHLBI); the National Institute of Nursing Research (NINR); the National Institute of Minority Health and Health Disparities (NIMHD); the Office of Research on Women's Health (ORWH); and the Centers for Disease Control and Prevention (CDC). The data (and samples) from Look AHEAD were supplied by the NIDDK Central Repositories. This manuscript was not prepared under the auspices of the Look AHEAD and does not represent analyses or conclusions of the Look AHEAD Research Group, the NIDDK Central Repositories, or the NIH.
Supplemental material: This content has been supplied by the author(s). It has not been vetted by BMJ Publishing Group Limited (BMJ) and may not have been peer-reviewed. Any opinions or recommendations discussed are solely those of the author(s) and are not endorsed by BMJ. BMJ disclaims all liability and responsibility arising from any reliance placed on the content. Where the content includes any translated material, BMJ does not warrant the accuracy and reliability of the translations (including but not limited to local regulations, clinical guidelines, terminology, drug names and drug dosages), and is not responsible for any error and/or omissions arising from translation and adaptation or otherwise.
References
- 1.Menke A, Casagrande S, Geiss L, et al. Prevalence of and trends in diabetes among adults in the United States, 1988-2012. JAMA 2015;314:1021–9. 10.1001/jama.2015.10029 [DOI] [PubMed] [Google Scholar]
- 2.Virani SS, Alonso A, Benjamin EJ, et al. Heart disease and stroke Statistics-2020 update: a report from the American heart association. Circulation 2020;141:e139–596. 10.1161/CIR.0000000000000757 [DOI] [PubMed] [Google Scholar]
- 3.ADVANCE Collaborative Group, Patel A, MacMahon S, et al. Intensive blood glucose control and vascular outcomes in patients with type 2 diabetes. N Engl J Med 2008;358:2560–72. 10.1056/NEJMoa0802987 [DOI] [PubMed] [Google Scholar]
- 4.Duckworth W, Abraira C, Moritz T, et al. Glucose control and vascular complications in veterans with type 2 diabetes. N Engl J Med 2009;360:129–39. 10.1056/NEJMoa0808431 [DOI] [PubMed] [Google Scholar]
- 5.Action to Control Cardiovascular Risk in Diabetes Study Group, Gerstein HC, Miller ME, et al. Effects of intensive glucose lowering in type 2 diabetes. N Engl J Med 2008;358:2545–59. 10.1056/NEJMoa0802743 [DOI] [PMC free article] [PubMed] [Google Scholar]
- 6.Ceriello A, Monnier L, Owens D. Glycaemic variability in diabetes: clinical and therapeutic implications. Lancet Diabetes Endocrinol 2019;7:221–30. 10.1016/S2213-8587(18)30136-0 [DOI] [PubMed] [Google Scholar]
- 7.Cooper ME, El-Osta A, Allen TJ, et al. Metabolic Karma-The atherogenic legacy of diabetes: the 2017 Edwin Bierman Award Lecture. Diabetes 2018;67:785–90. 10.2337/dbi18-0010 [DOI] [PubMed] [Google Scholar]
- 8.Misra A, Bloomgarden Z. Metabolic memory: evolving concepts. J Diabetes 2018;10:186–7. 10.1111/1753-0407.12622 [DOI] [PubMed] [Google Scholar]
- 9.Testa R, Bonfigli AR, Prattichizzo F, et al. The "metabolic memory" theory and the early treatment of hyperglycemia in prevention of diabetic complications. Nutrients 2017;9. 10.3390/nu9050437. [Epub ahead of print: 28 Apr 2017]. [DOI] [PMC free article] [PubMed] [Google Scholar]
- 10.Hirsch IB. Glycemic variability and diabetes complications: does it matter? of course it does! Diabetes Care 2015;38:1610–4. 10.2337/dc14-2898 [DOI] [PubMed] [Google Scholar]
- 11.Schisano B, Tripathi G, McGee K, et al. Glucose oscillations, more than constant high glucose, induce p53 activation and a metabolic memory in human endothelial cells. Diabetologia 2011;54:1219–26. 10.1007/s00125-011-2049-0 [DOI] [PubMed] [Google Scholar]
- 12.Takao T, Matsuyama Y, Yanagisawa H, et al. Association between HbA1c variability and mortality in patients with type 2 diabetes. J Diabetes Complications 2014;28:494–9. 10.1016/j.jdiacomp.2014.02.006 [DOI] [PubMed] [Google Scholar]
- 13.Echouffo-Tcheugui JB, Zhao S, Brock G, et al. Visit-to-visit glycemic variability and risks of cardiovascular events and all-cause mortality: the ALLHAT study. Diabetes Care 2019;42:486–93. 10.2337/dc18-1430 [DOI] [PMC free article] [PubMed] [Google Scholar]
- 14.Sheng C-S, Tian J, Miao Y, et al. Prognostic significance of long-term HbA1c variability for all-cause mortality in the ACCORD Trial. Diabetes Care 2020;43:1185–90. 10.2337/dc19-2589 [DOI] [PubMed] [Google Scholar]
- 15.Luk AOY, Ma RCW, Lau ESH, et al. Risk association of HbA1c variability with chronic kidney disease and cardiovascular disease in type 2 diabetes: prospective analysis of the Hong Kong diabetes registry. Diabetes Metab Res Rev 2013;29:384–90. 10.1002/dmrr.2404 [DOI] [PubMed] [Google Scholar]
- 16.Penno G, Solini A, Bonora E, et al. Hba1C variability as an independent correlate of nephropathy, but not retinopathy, in patients with type 2 diabetes: the renal insufficiency and cardiovascular events (RIACE) Italian multicenter study. Diabetes Care 2013;36:2301–10. 10.2337/dc12-2264 [DOI] [PMC free article] [PubMed] [Google Scholar]
- 17.Skriver MV, Sandbæk A, Kristensen JK, et al. Relationship of HbA1c variability, absolute changes in HbA1c, and all-cause mortality in type 2 diabetes: a Danish population-based prospective observational study. BMJ Open Diabetes Res Care 2015;3:e000060. 10.1136/bmjdrc-2014-000060 [DOI] [PMC free article] [PubMed] [Google Scholar]
- 18.Critchley JA, Carey IM, Harris T, et al. Variability in glycated hemoglobin and risk of poor outcomes among people with type 2 diabetes in a large primary care cohort study. Diabetes Care 2019;42:2237–46. 10.2337/dc19-0848 [DOI] [PubMed] [Google Scholar]
- 19.Wan EYF, Yu EYT, Chin WY, et al. Age-specific associations of glycated haemoglobin variability with cardiovascular disease and mortality in patients with type 2 diabetes mellitus: a 10- year cohort study. Diabetes Obes Metab 2020;22:1316–27. 10.1111/dom.14034 [DOI] [PubMed] [Google Scholar]
- 20.Look Ahead Research Group, Bray G, Gregg E, et al. Baseline characteristics of the randomised cohort from the look ahead (action for health in diabetes) study. Diab Vasc Dis Res 2006;3:202–15. 10.3132/dvdr.2006.031 [DOI] [PMC free article] [PubMed] [Google Scholar]
- 21.Monnier L, Colette C, Owens DR. The application of simple metrics in the assessment of glycaemic variability. Diabetes Metab 2018;44:313–9. 10.1016/j.diabet.2018.02.008 [DOI] [PubMed] [Google Scholar]
- 22.Ryan DH, Espeland MA, Foster GD, et al. Look ahead (action for health in diabetes): design and methods for a clinical trial of weight loss for the prevention of cardiovascular disease in type 2 diabetes. Control Clin Trials 2003;24:610–28. 10.1016/s0197-2456(03)00064-3 [DOI] [PubMed] [Google Scholar]
- 23.Levey AS, Stevens LA, Schmid CH, et al. A new equation to estimate glomerular filtration rate. Ann Intern Med 2009;150:604–12. 10.7326/0003-4819-150-9-200905050-00006 [DOI] [PMC free article] [PubMed] [Google Scholar]
- 24.Gorst C, Kwok CS, Aslam S, et al. Long-term glycemic variability and risk of adverse outcomes: a systematic review and meta-analysis. Diabetes Care 2015;38:2354–69. 10.2337/dc15-1188 [DOI] [PubMed] [Google Scholar]
- 25.Lee C-L, Chen C-H, Wu M-J, et al. The variability of glycated hemoglobin is associated with renal function decline in patients with type 2 diabetes. Ther Adv Chronic Dis 2020;11:2040622319898370. 10.1177/2040622319898370 [DOI] [PMC free article] [PubMed] [Google Scholar]
- 26.Lee M-Y, Huang J-C, Chen S-C, et al. Association of HbA1c variability and renal progression in patients with type 2 diabetes with chronic kidney disease stages 3–4. Int J Mol Sci 2018;19:4116 10.3390/ijms19124116 [DOI] [PMC free article] [PubMed] [Google Scholar]
- 27.Takenouchi A, Tsuboi A, Kurata M, et al. Carotid intima-media thickness and Visit-to-Visit HbA1c variability predict progression of chronic kidney disease in type 2 diabetic patients with preserved kidney function. J Diabetes Res 2016;2016:3295747. 10.1155/2016/3295747 [DOI] [PMC free article] [PubMed] [Google Scholar]
- 28.Saito Y, Noto H, Takahashi O, et al. Visit-to-Visit hemoglobin A1c variability is associated with later cancer development in patients with diabetes mellitus. Cancer J 2019;25:237–40. 10.1097/PPO.0000000000000387 [DOI] [PubMed] [Google Scholar]
- 29.Hirakawa Y, Arima H, Zoungas S, et al. Impact of visit-to-visit glycemic variability on the risks of macrovascular and microvascular events and all-cause mortality in type 2 diabetes: the advance trial. Diabetes Care 2014;37:2359–65. 10.2337/dc14-0199 [DOI] [PubMed] [Google Scholar]
- 30.Zhou JJ, Schwenke DC, Bahn G, et al. Glycemic variation and cardiovascular risk in the Veterans Affairs diabetes trial. Diabetes Care 2018;41:2187–94. 10.2337/dc18-0548 [DOI] [PMC free article] [PubMed] [Google Scholar]
- 31.Low Wang CC, Hess CN, Hiatt WR, et al. Clinical update: cardiovascular disease in diabetes mellitus: atherosclerotic cardiovascular disease and heart failure in type 2 diabetes mellitus - mechanisms, management, and clinical considerations. Circulation 2016;133:2459–502. 10.1161/CIRCULATIONAHA.116.022194 [DOI] [PMC free article] [PubMed] [Google Scholar]
- 32.Costantino S, Paneni F, Battista R, et al. Impact of glycemic variability on chromatin remodeling, oxidative stress, and endothelial dysfunction in patients with type 2 diabetes and with target HbA1c levels. Diabetes 2017;66:2472–82. 10.2337/db17-0294 [DOI] [PubMed] [Google Scholar]
- 33.Monnier L, Mas E, Ginet C, et al. Activation of oxidative stress by acute glucose fluctuations compared with sustained chronic hyperglycemia in patients with type 2 diabetes. JAMA 2006;295:1681–7. 10.1001/jama.295.14.1681 [DOI] [PubMed] [Google Scholar]
- 34.Ceriello A, Esposito K, Piconi L, et al. Oscillating glucose is more deleterious to endothelial function and oxidative stress than mean glucose in normal and type 2 diabetic patients. Diabetes 2008;57:1349–54. 10.2337/db08-0063 [DOI] [PubMed] [Google Scholar]
- 35.Esposito K, Nappo F, Marfella R, et al. Inflammatory cytokine concentrations are acutely increased by hyperglycemia in humans: role of oxidative stress. Circulation 2002;106:2067–72. 10.1161/01.cir.0000034509.14906.ae [DOI] [PubMed] [Google Scholar]
- 36.Ihnat MA, Kaltreider RC, Thorpe JE, et al. Attenuated superoxide dismutase induction in retinal cells in response to intermittent high versus continuous high glucose. Am J Biochem Biotechnol 2007;3:16–23. 10.3844/ajbbsp.2007.16.23 [DOI] [Google Scholar]
- 37.Meugnier E, Faraj M, Rome S, et al. Acute hyperglycemia induces a global downregulation of gene expression in adipose tissue and skeletal muscle of healthy subjects. Diabetes 2007;56:992–9. 10.2337/db06-1242 [DOI] [PubMed] [Google Scholar]
- 38.Del Guerra S, Grupillo M, Masini M, et al. Gliclazide protects human islet beta-cells from apoptosis induced by intermittent high glucose. Diabetes Metab Res Rev 2007;23:234–8. 10.1002/dmrr.680 [DOI] [PubMed] [Google Scholar]
- 39.U.K. prospective diabetes study 16. overview of 6 years' therapy of type II diabetes: a progressive disease. U.K. prospective diabetes Study Group. Diabetes 1995;44:1249–58. [PubMed] [Google Scholar]
- 40.Levitan EB, Kaciroti N, Oparil S, et al. Blood pressure measurement device, number and timing of visits, and intra-individual visit-to-visit variability of blood pressure. J Clin Hypertens 2012;14:744–50. 10.1111/jch.12005 [DOI] [PMC free article] [PubMed] [Google Scholar]
Associated Data
This section collects any data citations, data availability statements, or supplementary materials included in this article.
Supplementary Materials
bmjdrc-2020-001753supp001.pdf (249.2KB, pdf)