Background
Early diagnosis improves the prognosis for non‐small cell lung cancer (NSCLC); therefore, there is a pressing need for effective diagnostic methods for NSCLC. Increasing evidence indicates that serum exosomal micro RNAs (miRNAs) represent promising diagnostic and prognostic markers for multiple cancers. Here, we explored a panel of miRNAs for NSCLC diagnosis and functionally characterized miR‐1269a in the pathogenesis of NSCLC.
Methods: First, we analyzed high‐throughput data from The Cancer Genome Atlas (TCGA) to identify differentially expressed miRNAs between NSCLC patients and healthy controls. We examined the expression profiles of the identified miRNAs using qRT‐PCR.
Results: We found that four micro‐RNAs (hsa‐miR‐9‐3p, hsa‐miR‐205‐5p, hsa‐miR‐210‐5p, and hsa‐miR‐1269a) were more abundant in serum exosomes from NSCLC patients. A logistic regression model validated the diagnostic efficacy of the four‐microRNA panel, allowing us to distinguish NSCLC patients from healthy controls with AUCs of 0.915 and 0.878 for the training and validation sets, respectively. Functionally, NSCLC cell proliferation, migration, and invasion were affected by the aberrant expression of hsa‐miR‐1269a in culture. Reduced expression of miR‐1269a resulted in reduced proliferation, migration, and invasion through targeting the forkhead box O1 gene (FOXO1).
Conclusions: Taken together, our study identified a panel of four serum exosomal miRNAs as a potential noninvasive diagnostic biomarker for NSCLC. The interactions between FOXO1 and miR‐1269a represent novel potential targets for NSCLC therapy.
Keywords: Diagnostic marker, FOXO1, mir‐1269a, NSCLC, serum exosomes
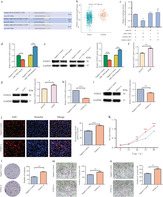
Four serum exosomal miRNA panel as a potential non‐invasive diagnostic biomarker for NSCLC. The interactions of FOXO1 and miR‐1269a may represent novel potential targets for NSCLC therapy.
Introduction
Lung cancer is the most frequent malignancy among both males and females; it is a major cause of cancer deaths globally. 1 , 2 It accounts for approximately 12% of new cancer cases and 18% of cancer‐related deaths annually. 3 Lung cancers are broadly classified into two main subtypes: non‐small cell lung cancer (NSCLC) and small cell lung cancer (SCLC). 4 NSCLC is the more common form, accounting for 80%–85% of all lung cancer cases. 5 Despite considerable research, the etiology of NSCLC is not fully understood and efficient diagnostic techniques remain to be identified. Early diagnosis offers significantly improved prognosis for NSCLC patients. Patients are often diagnosed at an advanced stage owing to the lack of visible signs of the disease and have no option for surgical resection, which leads to a significantly reduced overall five‐year survival rate. 6 , 7 In light of this, there is an urgent need to identify robust biomarkers for NSCLC diagnosis that will enable early intervention and decrease mortality.
Liquid biopsy, a blood test used to identify biological materials that have been excreted from tumors, is being increasingly used in cancer diagnostics. 8 Tumor cells, cell‐free DNA, and extracellular vesicles, specifically exosomes, constitute the major components of interest. 9 , 10 Exosomes are membrane‐enclosed extracellular vesicles with diameters of 30–150 nm that are released by all cell types. 11 They are found in blood, ascites, urine, and saliva, 12 and are quite stable due to their lipid bilayer structures. 13 They influence tumor initiation, growth, progression, and metastasis, 14 , 15 and contain a diverse combination of biomolecules, including lipids, proteins, and nucleic acids, which are potential biomarkers. 16 , 17 , 18 An upregulation of exosome levels in body fluids has been reported in lung cancer patients, indicating a key role for exosomes in lung cancer development and progression. 19 Exosomes are secreted by most types of cancer cells, including melanoma, colorectal, breast, lung, and prostate. A notable feature of cancer cells is that they produce exosomes in greater amounts than normal cells. 20 These data suggest that exosomes represent promising biomarkers for diagnosis in clinical oncology.
MicroRNAs (miRNAs) are a class of endogenous noncoding RNAs of 21–25 nucleotides in length. 21 Substantial evidence indicates that they are actively engaged in several biological processes in cancers, including lung cancer. 22 In breast cancer, miR‐5188 was identified as a novel onco‐miRNA; it induces breast cancer stemness, proliferation, and metastasis. 23 In lung cancer, miR‐31 initiates tumorigenesis through targeting and reducing the expression of proteins in the RAS/MAPK signaling pathway. 24 In addition, several miRNAs, including miR371, miR‐182, and miR‐605‐5p, appear to have tissue‐specific functions and serve as biomarkers for early diagnosis of several kinds of cancer. 25 The miRNAs contained in exosomes remain secure, and are the main small RNA constituents in them. 26 For these reasons, exosomal miRNAs are recommended as excellent biomarker candidates for the diagnosis of cancer. 27 However, limited data is currently available on the significance of exosomes in NSCLC. The biological roles of most miRNAs in NSCLC also remain unclear.
In this study, we identified four potential miRNA markers (hsa‐miR‐9‐3p, hsa‐miR‐205‐5p, hsa‐miR‐210‐5p, and hsa‐miR‐1269a) that were significantly upregulated in NSCLC serum exosomes. A panel consisting of these four miRNAs was established and its NSCLC diagnostic performance was assessed. The molecular mechanisms and precise roles of these miRNAs in NSCLC have not been fully elucidated. We determined the effect of one of the miRNAs, miR‐1269a, on the proliferation, migration, and invasion of NSCLC cells. Finally, we identified forkhead box O1 (FOXO1) as the potential target of miR‐1269a, which may provide a newly therapeutic target for NSCLC.
Methods
Peripheral blood samples used in this study were obtained from patients registered at the Qilu Hospital of Shandong University between January 2017 and October 2019. The samples included those obtained from 147 patients with NSCLC collected prior to pharmacological interventions or surgical resections, as well as from 149 healthy individuals who were attending routine health examinations in the same hospital. Clinical details for the subjects are listed in Table S1. Classification of tumor stage was based on the eighth Tumor Node Metastasis staging system developed by the American Joint Committee on Cancer. In compliance with the Declaration of Helsinki, written informed consent was obtained from each participant. This study was approved by the institutional ethics committee of the Qilu Hospital of Shandong University.
Isolation and identification of serum exosomes
ExoQuick (ExoQuick, SBI, USA) was used for the extraction of exosomes according to the manufacturer's protocol. ExoQuick (63 μL) was added to 250 μL of serum sample and incubated for 30 minutes at 4°C to precipitate exosomes. Subsequently, the mixture was centrifuged at 1500 g for five minutes at 4°C, followed by another centrifugation at 1500 g for five minutes at 4°C, to eliminate contaminating apoptotic bodies and cellular debris. The precipitates were collected, resuspended in 50 μL of phosphate‐buffered saline (PBS), and stored at −80°C until further use.
Transmission electron microscopy (TEM) was used to analyze the concentration and size distribution of exosomes using nanoparticle tracking analysis (NTA). Exosomal suspensions in PBS were analyzed using ZetaView software (Particle Metrix, Germany) according to the manufacturer's instructions. Filtered PBS was used as the control. Total proteins were extracted from serum exosomes and exosome‐depleted supernatants (EDS); western blotting was performed according to the manufacturer's instructions. Antibodies against exosome‐specific proteins including anti‐CD9 antibody (#13403, Cell Signaling Technology, ) and TSG101 (#ab125011, Abcam) were used to detect the exosome‐specific proteins.
RNA isolation and quantitation
The miRNeasy Micro kit (Qiagen, Hilden, Germany) and TRIzol Reagent (Invitrogen, Carlsbad, CA, USA) were used for total RNA extraction from the exosomes and cells, respectively. Specific primers for reverse transcription and PCR, including miRNA (TaKara, Dalian, China), and FOXO1 and GAPDH primers (BioSune, Shanghai, China) were used for target amplification. Expression levels of miRNAs were evaluated based on the fluorescence intensity of TB Green (TaKaRa, Dalian, China). Melting curve analysis was used to confirm the specificities of the PCR products. Hsa‐let‐7a‐5p 28 and GAPDH were used as reference genes. All the primer sequences used in this study are listed in Table S2. Relative quantification of gene expression was performed using the 2−ΔΔCt method.
Western blotting
Cells and exosomes were lysed with western/IP lysis buffer (Beyotime, Haimen, China) on ice for 30 minutes and centrifuged at 12 000 g/minute for 30 minutes at 4°C. The extracted proteins were separated using 8% sodium dodecyl sulfate‐polyacrylamide gel electrophoresis (SDS‐PAGE) and transferred onto 0.22 mm polyvinylidene fluoride membranes (Merck‐Millipore, Darmstadt, Germany). The membranes were blocked using 5% nonfat milk in TBST buffer (1% Tween 20 in Tris‐buffered saline) for two hours and then incubated with primary antibodies against: GAPDH (#5174, CST), CD9 (#13403, CST), TSG101 (#ab125011, Abcam), or FOXO1 (#66457‐1‐Ig, Proteintech) overnight. The membranes were washed with TBST and incubated with the appropriate secondary antibody (#7074 or #7076, CST). Quantitative analysis of protein expression was performed using ImageJ and normalized to GAPDH intensity.
Cell culture and transfection
Two human NSCLC cell lines, A549 and H1975, were purchased from the Institute of Basic Medical Sciences, Chinese Academy of Medical Sciences (Beijing, China). H1975 was cultured in Roswell Park Memorial Institute 1640 medium (Sagecreation, South America) and A549 was cultured in McCoy's 5A medium (both supplemented with 10% FBS) in a 5% CO2 humidified incubator at 37°C.
For transfection, cells were plated in six‐well plates at a density of 20 × 104 cells/well. After 24 hours of incubation, transient transfection with miR‐1269a agomir (RiboBio, China), miR‐1269a antagomir (RiboBio, China), negative control (RiboBio, China), or FOXO1 siRNA (RiboBio, China) was performed using Lipofectamine 2000 (Invitrogen) in Opti‐MEM I reduced serum medium (Life Technologies) following the manufacturer's instructions. After 48 hours of transfection, the cells were used for further analysis. The sequences of FOXO1 siRNA used were as follows: 5′‐GGAUCUCAGCAUAAGGAGU‐3′ (sense) and 5′‐ACUCCUUAUGCUGAGAUCC‐3′ (antisense).
Cell counting kit‐8 (CCK‐8) assay
H1975 and A549 cells were plated in 96‐well plates at densities of 2000 or 1500 cells/well, respectively. After culturing for 0, 24, 48, 72 and 96 hours, 10 μL of CCK8 reagent (BestBio, Shanghai, China) was added to each well, followed by incubation for 1.5 hours at 37°C in the dark. The optical density of each well was measured at 450 nm using a microplate reader.
Colony formation assay
H1975 and A549 cells were plated in six‐well plates at a density of 500 cells/well and cultured in complete medium for 10 days until colonies were visible. Colonies were washed three times with PBS and fixed with methanol for 30 minutes. After staining with crystal violet, of colonies with cell of more than 50 cells were counted.
EdU proliferation assay
Following 48 hours of transfection, the cells were plated in 96‐well plates and incubated in complete medium for 24 hours under standard conditions. Proliferation was analyzed using the EdU Cell Proliferation Assay Kit (RiboBio, China) according to the manufacturer's instructions. Hoechst stain (RiboBio, China) was used to stain nuclei. The proportions of nucleated cells containing EdU were measured using fluorescence microscopy.
Transwell assays
Transwell chambers (BD Biosciences, San Jose, CA, USA) were used for cell migration and invasion assays. After 48 hours of transfection, the cells were trypsinized and suspended in serum‐free medium. For the migration assay, aliquots of 200 μL of suspension containing 5.0 × 10⁴ cells were added to the upper chamber. For the invasion assay, equal volumes of cell suspension containing 1.0 × 10⁵ cells were added to the upper chamber with Matrigel (BD Biosciences, Franklin Lakes, NJ, USA). The lower chamber was filled with 700 μL medium containing 20% FBS in both cases. The chambers were placed in 24‐well plates and cultured for 24 or 48 hours at 37°C, then stained.
Dual‐luciferase assay
The cDNA fragments from the mutant or wild‐type miR‐1269a and FOXO1 were cloned into the pmirGLO vector (GenePharma, Shanghai, China) to create dual‐luciferase reporter vectors of the mutant or wild‐type groups. We then cotransfected mutant or wild‐type luciferase reporter vectors with miR‐1269a agomir or negative control into H293T cells. After 48 hours of culture, the relative luciferase activities were detected using Dual‐Luciferase Reporter Assay Kit (Promega, Shanghai, China).
Statistical analysis
All statistical analyses were performed using GraphPad Prism 6.0 and SPSS 13.0. Differences between groups were assessed using either Student's t‐test or the Mann–Whitney U test. Differences in miRNA expression between healthy controls and NSCLC patients were assessed using the nonparametric Mann–Whitney U test. Scatter diagrams were generated using GraphPad Prism 6. MATLAB software was used for logistic regression analysis and to validate the diagnostic panel. Receiver operating characteristic (ROC) curves were generated using Medcalc 15.2.2 and areas under the curve (AUC) were used to calculate the diagnostic performance of the miRNA markers in distinguishing between controls and patients. P < 0.05 was considered to be statistically significant. All results are expressed as means ± standard deviation (SD) from three independent experiments.
Results
Identification of aberrantly expressed miRNAs in NSCLC using TCGA database
The TCGA database (https://cancergenome.nih.gov/) is an open‐access tumor database that provides detailed and comprehensive genomic datasets. We examined this database to identify differentially expressed miRNAs in NSCLC. There were 522 NSCLC samples in the dataset of 661 samples. Using the screening criteria (P < 0.05 and |log2FC| > 2.0), 95 miRNAs were identified to be differentially expressed between NSCLC tumor samples and normal samples, including 76 upregulated and 19 downregulated miRNAs (Fig 1a). We profiled expression levels in the 76 upregulated specimens, of which 10 candidates qualified for subsequent analyses (Fig 1b). Principal component analysis was used to identify significant differences (Fig 1c). The differences in expression of the 10 selected miRNAs were statistically significant.
Figure 1.

Identification of differentially expressed miRNAs in NSCLC (a) Volcano plot of differentially expressed miRNAs. The red dot represents 76 upregulated miRNAs, and green dot represents 19 downregulated miRNAs  , UP;
, UP;  , NOT;
  , DOWN. (b) The expression heatmap of 10 candidate miRNAs
  , Normal;
  , Tumor. (c) Principal component analysis plots for normal samples and cancer specimens
  , Tumor;
  , Normal.
Characterization of serum exosomes
TEM revealed that isolated exosomes were spherical vesicles of 30–150 nm in diameter with double layered membranes (Fig 2a). NTA verified that the size distribution of exosomes was distributed around 94 nm in diameter, which corresponded with the size distribution of exosomal particles (Fig 2c). Higher concentrations of the exosomal protein markers, CD9 and TSG101, were observed in the samples containing exosomes compared to the EDS (Fig 2b). Taken together, these results revealed that intact exosomes were successfully isolated from serum.
Figure 2.
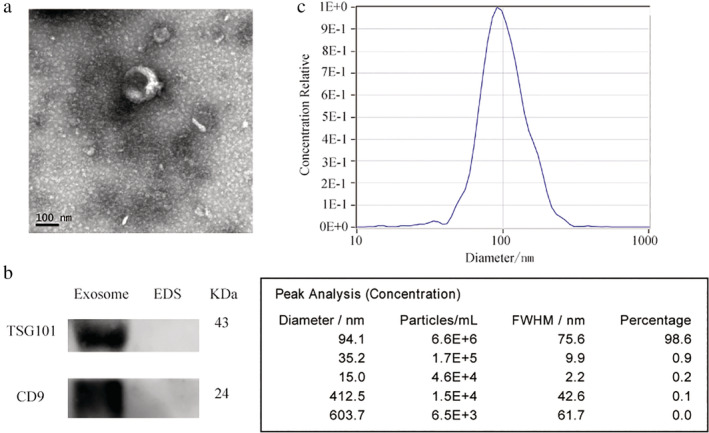
Identification of serum exosomes. (a) Representative TEM images of serum exosomes as indicated by the arrows. Scale bar, 200 and 500 nm. (b) Western blotting analysis of TSG101 and CD9 in exosomes and exosome‐depleted supernatants (EDS). (c) NTA of the size distribution and number of exosomes.
Identification miRNAs in serum exosomes
Of the 10 candidate miRNAs, only the differentially expressed mature miRNAs were selected for further analysis. We quantified their abundance in serum exosomes from 74 NSCLC patients and 74 controls using qRT‐PCR. We found that the levels of four (hsa‐miR‐9‐3p, hsa‐miR‐205‐5p, hsa‐miR‐210‐5p and hsa‐miR‐1269a) were significantly different between patients and controls (P < 0.05) (Fig 3a–d, Table 1). We defined these 74 patients and 74 controls as the training set. To further evaluate the miRNAs identified in the training set, their expression was assessed in a validation set consisting of another 73 NSCLC patients and 75 healthy controls. We found that expression in the validation set was consistent with that of the training set (Fig S1a–d, Table S3). To determine whether the four miRNAs could distinguish NSCLC patients from healthy controls, we calculated AUC for the ROC curves. The AUC values were 0.827, 0.806, 0.839, and 0.852 (Fig 3e–h) in the training set, and 0.741, 0.742, 0.788, and 0.793 in the validation set (Fig S1e–h).
Figure 3.
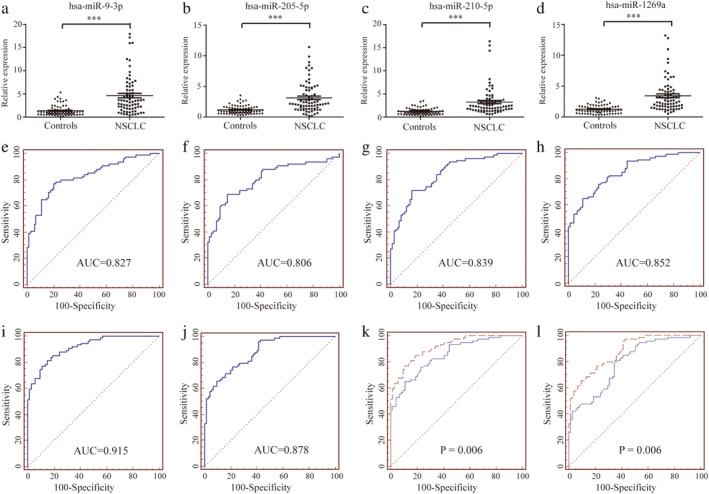
Relative expression and ROC curves analysis of four selected miRNAs in serum exosomes. (a–d) Relative expressions of four selected serum exosomes miRNAs in patients with NSCLC (n = 74) and control individuals (n = 74) using qRT‐PCR assay in training set, P < 0.001. ROC curve analysis for NSCLC detection using hsa‐miR‐9‐3p (e), hsa‐miR‐205‐5p (f), hsa‐miR‐210‐5p (g) and hsa‐miR‐1269a (h) in the training set. ROC curves analysis for the prediction of NSCLC using four‐miRNA panel in training set (i) and validation set (j). Comparison of diagnostic performance between four‐miRNA panel and hsa‐miR‐1269a for NSCLC detection in training set (k)  , Four‐miRNA panel;
  , hsa‐miR‐1269a and additional validation set (l)
  , Four‐miRNA panel;
  , hsa‐miR‐1269a.
Table 1.
Expression of four serum exosome‐derived miRNAs in NSCLC patients and healthy controls in training set (median [interquartile range])
| Training set | |||
|---|---|---|---|
| miRNA | Controls (n = 74) | NSCLCs (n = 74) | P‐value |
| hsa‐miR‐9‐3p | 1.050 (0.6256–1.552) | 3.541(1.860–6.057) | <0.0001 |
| hsa‐miR‐205‐5p | 0.9346 (0.6232–1.561) | 2.219 (1.331–4.714) | <0.0001 |
| hsa‐miR‐210‐5p | 1.083 (0.6880–1.559) | 2.333(1.467–3.574) | <0.0001 |
| hsa‐miR‐1269a | 1.149 (0.7067–1.675) | 2.585 (1.708–4.233) | <0.0001 |
Establishment of a diagnostic miRNA panel
From the training set, a stepwise logistic regression model was constructed to predict the risk of being diagnosed with NSCLC. The predicted probability from the logit model based on the four‐miRNA panel, logit (P = NSCLC) = 0.7237‐hsa‐miR‐9‐3p × 0.0854‐hsa‐miR‐205‐5p × 0.0041‐hsa‐miR‐210‐5p × 0.1082‐hsa‐miR‐1269a × 0.0935, was used to construct a ROC curve. The diagnostic efficacy of the established miRNA panel was evaluated by ROC analysis. The combined AUC of the established miRNA panel was 0.915 with a sensitivity of 0.77 and a specificity of 0.89.
Validation of the miRNA panel
The panel obtained from the training set was used to predict the possibility of NSCLC in the validation set. The AUC of the four‐miRNA panel in the validation set was 0.878 (sensitivity 0.66, specificity 0.90, Fig 3j). Interestingly, the four‐miRNA panel outperformed the individual miRNAs in all sets (all P < 0.05, Fig 3k,l), showing the high sensitivity and specificity of our panel for diagnosing NSCLC.
Upregulation of miR‐1269a promotes proliferation, migration, and invasiveness of NSCLC cells
H1975 cells were transfected with miR‐1269a agomir to achieve miR‐1269a overexpression. CCK‐8 and EdU assays demonstrated that cells with miR‐1269a grew more rapidly than those transfected with negative controls (Fig 4a,b). Meanwhile, more colonies were formed in H1975‐overexpressing group compared to negative controls (Fig 4c). The effects of miR‐1269a on the migratory and invasive abilities of cells were evaluated using transwell assays. Both abilities were significantly enhanced compared to the negative controls (Fig 4d,e).
Figure 4.
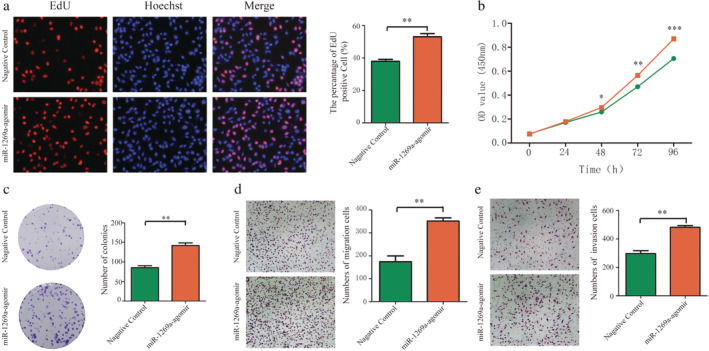
Overexpression of miR‐1269a promoted proliferation, migration and invasion of H1975 cells. (a) The EdU assay was performed to determine the proliferation of miR‐1269a agomir‐transfected or negative controls‐transfected H1975 cells. (b) CCK8 viability assays were performed 0, 24, 48, 72 and 96 hours after transfection with miR‐1269a agomir or negative controls  , Negative control;
  , miR‐1269a‐agomir. (c) Representative images and quantitative results of colony formation were obtained after transfection. (d and e) Representative images and quantitative results of the transwell assay were obtained after the transfection of miR‐1269a agomir or negative controls. All experiments were repeated at least three times, and representative data are shown. Data are means ± SEM. *P < 0.05, **P < 0.01, ***P < 0.001.
Downregulation of miR‐1269a inhibits proliferation, migration, and invasiveness of NSCLC cells
CCK‐8 and EdU assays revealed that transfection with the miR‐1269a antagomir significantly suppressed the proliferation of A549 cells relative to negative controls (Fig 5a,b). Moreover, the formation of colonies was markedly reduced by miR‐1269a downregulation (Fig 5c). Transwell assays indicated that decreased expression of miR‐1269a decreased migration and invasiveness of A549 cells relative to the negative controls (Fig 5d,e).
Figure 5.
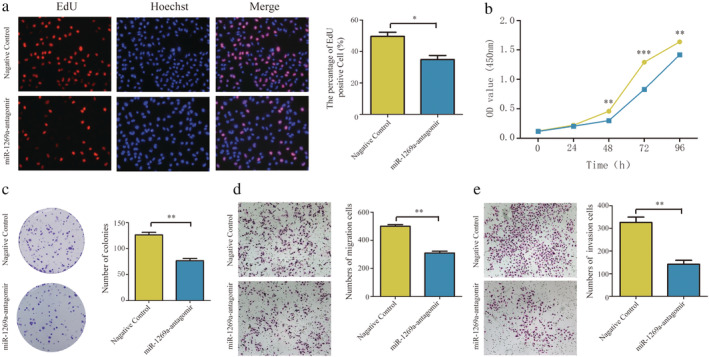
Downregulation of miR‐1269a inhibited proliferation, migration and invasion of A549 cells. (a) The EdU assay was performed to determine the proliferation of miR‐1269a antagomir‐transfected or negative controls‐transfected A549 cells. (b) CCK8 viability assays were performed 0, 24, 48, 72 and 96 hours after transfection with miR‐1269a antagomir or negative controls  , Negative control;
  , miR‐1269a‐antagomir. (c) Representative images and quantitative results of colony formation were obtained after transfection. (d and e) Representative images and quantitative results of the transwell assay were obtained after the transfection of miR‐1269a antagomir or negative controls. All experiments were repeated at least three times, and representative data are shown. Data are means ± SEM. *P < 0.05, **P < 0.01, ***P < 0.001.
FOXO1 is a direct target of miR‐1269a in NSCLC
To understand the mechanism of miR‐1269a in NSCLC, we identified potential targets of miR‐1269a regulation using multiple bioinformatics tools, including mirDIP (http://ophid.utoronto.ca/mirDIP/), miRDB (http://www.mirdb.org/), and TargetScan (http://www.targetscan.org/vert_72/). We identified FOXO1 as a potential target (Fig 6a). Analysis of RNA sequencing data from TCGA revealed that FOXO1 was downregulated in NSCLC tissues relative to normal tissues (Fig 6b). Luciferase activity was significantly decreased by wild‐type miR‐1269a relative to that in the mutant vector (Fig 6c). To verify whether FOXO1 is directly targeted by miR‐1269a, we transfected miR‐1269a agomir into cells and found that both the FOXO1 mRNA and protein levels were markedly lower in H1975 cells compared to the negative controls. In contrast, when we transfected cells with miR‐1269a antagomir, FOXO1 mRNA and protein levels were significantly higher in A549 cells compared to the negative controls (Fig 6d,e). These results suggest that FOXO1 is a direct target of miR‐1269a in NSCLC.
Figure 6.
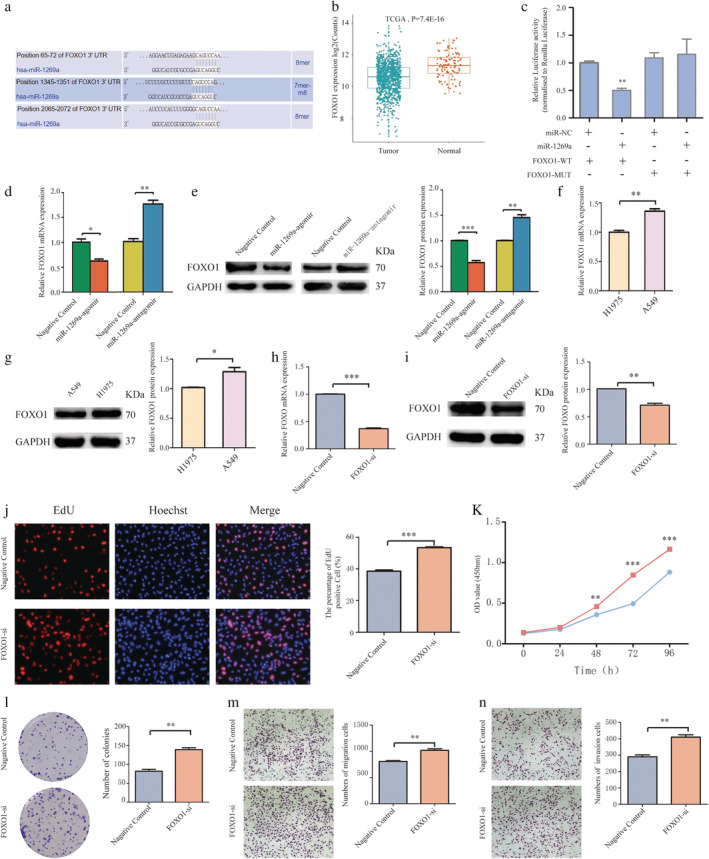
FOXO1 was the direct target of miR‐1269a in NSCLC (a) Bioinformatics analysis showed that there were three regulatory sites on FOXO1 3'‐UTR for miR‐1269a. (b) Relative expression of FOXO1 in NSCLC compared with normal tissue was analyzed by using TCGA database. (c) The luciferase reporter plasmid containing WT‐ and Mut‐FOXO1 was cotransfected into HEK293T cells with miR‐1269a in parallel with negative controls. (d and e) Relative mRNA and protein levels of FOXO1 in NSCLC cells transfected with miR‐1269a agomir, miR‐1269a antagomir or negative controls. (f and g) FOXO1 expression was measured in H1975 and A549 cells using qRT‐PCR and western blot analyses. (h and i) qRT‐PCR and western blot analyses were used to detect the effect of si‐FOXO1 in A459 cells. (j) Representative images and quantitative results of the EdU assay were obtained after the transfection of si‐FOXO1 or negative controls. (k) CCK8 viability assays were performed 0, 24, 48, 72 and 96 hours after transfection  , Negative control;
  , FOXO1‐si. (l) Representative images and quantitative results of colony formation were obtained after transfection. (m and n) Transwell assay was performed to determine the migration and invasion of si‐FOXO1‐transfected or negative controls‐transfected A549 cells. All experiments were repeated at least three times, and representative data are shown. Data are means ± SEM. *P < 0.05, **P < 0.01, ***P < 0.001.
Next, we investigated whether FOXO1 affects NSCLC cell function. We found that FOXO1 mRNA and protein levels were decreased in H1975 cells compared to A549 cells (Fig 6f,g). Western blotting and qRT‐PCR were used to determine the effect of RNA interference in A459 cells (Fig 6h,i). As expected, transfection with FOXO1 siRNA significantly increased viability, percentage of EdU‐positive cells, and colony formation relative to the cells transfected with the negative control siRNA (Fig 6j,l). Furthermore, transfection with FOXO1 siRNA markedly increased the migratory and invasive abilities of A549 cells (Fig 6m,n).
MiR‐1269a regulates NSCLC cell function by inhibiting FOXO1
To confirm that miR‐1269a regulation is mediated by FOXO1, we performed rescue experiments. Western blotting was used to determine the effects of cotransfection of miR‐1269a antagomir and FOXO1 siRNA in A459 cells (Fig 7a). Cotransfected cells exhibited significantly higher proliferation, migration, and invasiveness relative to control cells transfected with miR‐1269a antagomir alone or miR‐1269a antagomir and negative control siRNA. Finally, CCK‐8, EdU, colony formation, and Transwell assays showed that FOXO1 knockdown partially abolished the inhibitory action of miR‐1269a antagomir on A549 cell proliferation, migration, and invasion (Fig 7b–f).
Figure 7.
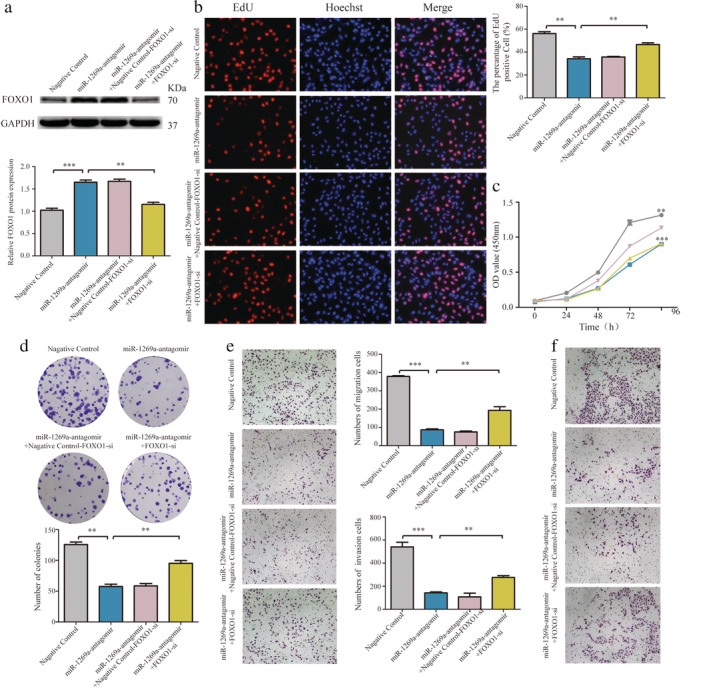
MiR‐1269a regulated NSCLC cell function via inhibiting FOXO1. (a) The FOXO1 protein levels were determined by western blotting in A549 cells. (b) EdU assay of the proliferation of A549 cells transfected with negative controls, miR‐1269a antagomir, miR‐1269a antagomir plus negative controls‐FOXO1‐siRNA, miR‐1269a antagomir plus FOXO1‐siRNA. (c) Cell proliferation ability in A549 cells treated with negative controls, miR‐1269a antagomir, miR‐1269a antagomir plus negative controls‐FOXO1‐siRNA, miR‐1269a antagomir plus FOXO1‐siRNA were measured by the CCK8 assay  , Negative control;
  , miR‐1269a‐antagomir + Negative control‐FOXO1‐si;
  , miR‐1269a‐antagomir;
  , miR‐1269a‐antagomir+FOXO1‐si. (d) Cell growth ability was measured by colony formation assay after transfection. (e and f) Representative images and quantitative results of transwell assay were obtained after transfection. All experiments were repeated at least three times, and representative data are shown. Data are means ± SEM. *P < 0.05, **P < 0.01, ***P < 0.001.
Discussion
Four essential characteristics of a good biomarker, fulfilled by exosomes, are sensitivity, specificity, stability, and availability through minimal or noninvasive sampling. 29 Caradec et al. found polymeric precipitation (ExoQuick) to be an optimal method for exosome isolation because of its high extraction efficiency. 30 Because exosomal miRNAs are highly stable and exhibit good specificity and sensitivity, the detection of miRNAs in serum exosomes is considered to have immense clinical potential in the diagnosis of lung cancer, and when used in combination with tumor markers can improve diagnostic efficacy. 31 , 32 There are currently no specific and effective diagnostic biomarkers for clinical application in NSCLC. In this study, we identified four miRNAs that were significantly upregulated in NSCLC. We established a four‐miRNA diagnostic panel with superior diagnostic efficiency to distinguish patients with NSCLC from healthy controls, as shown by a multivariate logistic regression model. This diagnostic panel could clinically serve as a novel diagnostic biomarker for NSCLC.
Of the four miRNAs identified in our study, hsa‐miR‐1269a showed the highest AUC values in both the training and validation sets. This suggested that it offers better diagnostic potential, with higher specificity and sensitivity. Therefore, we focused on it in subsequent functional studies. According to Min et al. a single‐nucleotide variation in hsa‐miR‐1269a contributes to the occurrence of hepatocellular carcinoma. 33 Another study reported that hsa‐miR‐1269a expression was increased in late‐stage colorectal cancer (CRC), was correlated with recurrence and metastasis in disease‐free stage II CRC patients, promoted epithelial–mesenchymal transition (EMT), and promoted metastasis of CRC in vivo. 34 However, the molecular mechanisms by which hsa‐miR‐1269a functions in carcinogenesis are not fully understood, and the regulatory effects of hsa‐miR‐1269a on metastasis and invasion in NSCLC are yet to be confirmed. Using functional experiments, including CCK8, EdU proliferation, and colony formation assays, we demonstrated that upregulation of miR‐1269a promoted cell growth in H1975 cells transfected with miR‐1269a agomir. Conversely, knockdown of miR‐1269a inhibited the proliferation of A549 cells transfected with miR‐1269a antagomir. These results suggest that ectopic miR‐1269a expression regulates cell proliferation and affects NSCLC initiation and progression. We found that that transfection with miR‐1269a agomir promoted cell migration and invasion, while transfection with miR‐1269a antagomir had the opposite effects showing that upregulation of miR‐1269a promotes migration and invasion in vivo.
To determine the specific mechanism involved in miR‐1269a‐mediated effects, we identified FOXO1 as a target gene. The FOXO family of transcription factors integrate multiple signals to affect patterns of gene expression that impact multiple physiological and pathological processes, including cancer and aging. 35 Aberrant expression of FOXO1 has been reported in several cancers. It affects tumor immunity, control of the cell cycle, DNA damage repair, carcinogenesis, metabolism of glucose, and apoptosis. 36 , 37 For these reasons, we sought to investigate whether the expression of FOXO1 was regulated by miR‐1269a in NSCLC cells. We found that both the mRNA and protein levels of FOXO1 were significantly decreased in cells with high expression of miR‐1269a, while their expressions were significantly increased in cells with low expression of miR‐1269a. Interestingly, in our study, based on the data from TCGA database, the expression level of FOXO1 was also significantly lower in NSCLC tissues than in normal tissues. Luciferase reporter assay results further validated FOXO1 as a target of miR‐1269a. Functionally, inhibition of FOXO1 suppressed A549 cell proliferation, migration, and invasion. CCK‐8, EdU proliferation, and colony formation assays showed that proliferation was upregulated when FOXO1 and miR‐1269a were decreased simultaneously. We found that migration and invasiveness were also significantly increased following knockdown of FOXO1 and miR‐1269a. Hence, miR‐1269a antagomir significantly rescued the suppressive effect of FOXO1 on proliferation, migration, and invasion.
The limitations of this study are as follows: first, the sample selection may be biased, but there was no significant difference and did not affect our conclusions. Second, the prognostic value of miR‐1269a needs to be confirmed. We are currently following‐up the patients and will present the outcomes in our future studies. In conclusion, miR‐1269a is an onco‐miRNA whose role is the negative regulation of FOXO1 in NSCLC. The interactions between FOXO1 and miR‐1269a may represent targets for future NSCLC therapy.
Disclosure
The authors declare no conflicts of interest.
Supporting information
Supplementary Figure S1: Relative expression and ROC curves analysis of four selected miRNAs in serum exosomes. (a–d) Relative expressions of four selected serum miRNAs in patients with NSCLC (n = 73) and control individuals (n = 75) using qRT‐PCR assay in validation set, P < 0.001. ROC curve analysis for NSCLC detection using hsa‐miR‐9‐3p (e), hsa‐miR‐205‐5p (f), hsa‐miR‐210‐5p (g) and hsa‐miR‐1269a (h) in the validation set. Comparison of diagnostic performance between four‐miRNA panel and hsa‐miR‐9‐3p (i), hsa‐miR‐205‐5p (j) or hsa‐miR‐210‐5p (k) for NSCLC detection in training set. Comparison of diagnostic performance between four‐miRNA panel and hsa‐miR‐9‐3p (l), hsa‐miR‐205‐5p (m) or hsa‐miR‐210‐5p (n) for NSCLC detection in validation set.
Supplementary Figure S2: Schematic representation of WT‐ and Mut‐FOXO1 sequences. Blue fonts represented the mutant bases.
Supplementary Table S1 Clinicopathological characteristics of patients and demographic information of controls in training set and validation set.
Supplementary Table S2: Sequences of primers used for qRT‐PCR in this study.
Supplementary Table S3: Expression of four serum exosome‐derived miRNAs in NSCLC patients and healthy controls in validation set (median [interquartile range]).
Supplementary Table S4: Correlations between serum exosomal miRNA concentrations and clinicopathological characteristics of patients with NSCLC in training set (median [interquartile range]).
Supplementary Table S5: Correlations between serum exosomal miRNA concentrations and clinicopathological characteristics of patients with NSCLC in validation set (median [interquartile range]).
Acknowledgments
This work was supported in part by the National Natural Science Foundation of China grant 81400029.
References
- 1. Dela Cruz CS, Tanoue LT, Matthay RA. Lung cancer: Epidemiology, etiology, and prevention. Clin Chest Med 2011; 32 (4): 605–44. [DOI] [PMC free article] [PubMed] [Google Scholar]
- 2. Ytterstad E, Moe PC, Hjalmarsen A. COPD in primary lung cancer patients: Prevalence and mortality. Int J Chron Obstruct Pulmon Dis 2016; 11: 625–36. [DOI] [PMC free article] [PubMed] [Google Scholar]
- 3. Bray F, Ferlay J, Soerjomataram I, Siegel RL, Torre LA, Jemal A. Global cancer statistics 2018: GLOBOCAN estimates of incidence and mortality worldwide for 36 cancers in 185 countries. CA Cancer J Clin 2018; 68 (6): 394–424. [DOI] [PubMed] [Google Scholar]
- 4. Oser MG, Niederst MJ, Sequist LV, Engelman JA. Transformation from non‐small‐cell lung cancer to small‐cell lung cancer: Molecular drivers and cells of origin. Lancet Oncol 2015; 16 (4): e165–72. [DOI] [PMC free article] [PubMed] [Google Scholar]
- 5. Fenchel K, Sellmann L, Dempke WC. Overall survival in non‐small cell lung cancer‐what is clinically meaningful? Transl Lung Cancer Res 2016; 5 (1): 115–9. [DOI] [PMC free article] [PubMed] [Google Scholar]
- 6. Siegel RL, Miller KD, Jemal A. Cancer statistics, 2019. CA Cancer J Clin 2019; 69 (1): 7–34. [DOI] [PubMed] [Google Scholar]
- 7. Cronin KA, Lake AJ, Scott S et al Annual report to the nation on the status of cancer, part I: National cancer statistics. Cancer 2018; 124 (13): 2785–800. [DOI] [PMC free article] [PubMed] [Google Scholar]
- 8. Alimirzaie S, Bagherzadeh M, Akbari MR. Liquid biopsy in breast cancer: A comprehensive review. Clin Genet 2019; 95 (6): 643–60. [DOI] [PubMed] [Google Scholar]
- 9. Caivano A, La Rocca F, Laurenzana I et al Extracellular vesicles in hematological malignancies: From biology to therapy. Int J Mol Sci 2017; 18 (6): 1183. [DOI] [PMC free article] [PubMed] [Google Scholar]
- 10. Neumann MH, Schneck H, Decker Y et al Isolation and characterization of circulating tumor cells using a novel workflow combining the CellSearch ® system and the CellCelector ™. Biotechnol Prog 2017; 33 (1): 125–32. [DOI] [PubMed] [Google Scholar]
- 11. McAndrews KM, Kalluri R. Mechanisms associated with biogenesis of exosomes in cancer. Mol Cancer 2019; 18 (1): 52. [DOI] [PMC free article] [PubMed] [Google Scholar]
- 12. Keller S, Ridinger J, Rupp AK, Janssen JW, Altevogt P. Body fluid derived exosomes as a novel template for clinical diagnostics. J Transl Med 2011; 9: 86. [DOI] [PMC free article] [PubMed] [Google Scholar]
- 13. Boukouris S, Mathivanan S. Exosomes in bodily fluids are a highly stable resource of disease biomarkers. Proteomics Clin Appl 2015; 9 (3–4): 358–67. [DOI] [PMC free article] [PubMed] [Google Scholar]
- 14. Azmi AS, Bao B, Sarkar FH. Exosomes in cancer development, metastasis, and drug resistance: A comprehensive review. Cancer Metastasis Rev 2013; 32 (3–4): 623–42. [DOI] [PMC free article] [PubMed] [Google Scholar]
- 15. Zhang X, Yuan X, Shi H, Wu L, Qian H, Xu W. Exosomes in cancer: Small particle, big player. J Hematol Oncol 2015; 8: 83. [DOI] [PMC free article] [PubMed] [Google Scholar]
- 16. Srivastava A, Filant J, Moxley KM, Sood A, McMeekin S, Ramesh R. Exosomes: A role for naturally occurring nanovesicles in cancer growth, diagnosis and treatment. Curr Gene Ther 2015; 15 (2): 182–92. [DOI] [PubMed] [Google Scholar]
- 17. Thakur BK, Zhang H, Becker A et al Double‐stranded DNA in exosomes: A novel biomarker in cancer detection. Cell Res 2014; 24 (6): 766–9. [DOI] [PMC free article] [PubMed] [Google Scholar]
- 18. Samanta S, Rajasingh S, Drosos N, Zhou Z, Dawn B, Rajasingh J. Exosomes: New molecular targets of diseases. Acta Pharmacol Sin 2018; 39 (4): 501–13. [DOI] [PMC free article] [PubMed] [Google Scholar]
- 19. Cui S, Cheng Z, Qin W, Jiang L. Exosomes as a liquid biopsy for lung cancer. Lung Cancer 2018; 116: 46–54. [DOI] [PubMed] [Google Scholar]
- 20. Frydrychowicz M, Kolecka‐Bednarczyk A, Madejczyk M, Yasar S, Dworacki G. Exosomes—Structure, biogenesis and biological role in non small cell lung cancer. Scand J Immunol 2015; 81 (1): 2–10. [DOI] [PubMed] [Google Scholar]
- 21. Mishra PJ. MicroRNAs as promising biomarkers in cancer diagnostics. Biomark Res 2014; 2: 19. [DOI] [PMC free article] [PubMed] [Google Scholar]
- 22. Zhang Y, Zhang Y, Yin Y, Li S. Detection of circulating exosomal miR‐17‐5p serves as a novel non‐invasive diagnostic marker for non‐small cell lung cancer patients. Pathol Res Pract 2019; 215 (8): 152466. [DOI] [PubMed] [Google Scholar]
- 23. Zou Y, Lin X, Bu J et al Timeless‐stimulated miR‐5188‐FOXO1/beta‐catenin‐c‐Jun feedback loop promotes stemness via ubiquitination of beta‐catenin in breast cancer. Mol Ther 2020; 28 (1): 313–27. [DOI] [PMC free article] [PubMed] [Google Scholar]
- 24. Edmonds MD, Boyd KL, Moyo T et al MicroRNA‐31 initiates lung tumorigenesis and promotes mutant KRAS‐driven lung cancer. J Clin Invest 2016; 126 (1): 349–64. [DOI] [PMC free article] [PubMed] [Google Scholar]
- 25. Liu H, Du L, Wen Z et al Up‐regulation of miR‐182 expression in colorectal cancer tissues and its prognostic value. Int J Colorectal Dis 2013; 28 (5): 697–703. [DOI] [PubMed] [Google Scholar]
- 26. Sun W, Luo JD, Jiang H, Duan DD. Tumor exosomes: A double‐edged sword in cancer therapy. Acta Pharmacol Sin 2018; 39 (4): 534–41. [DOI] [PMC free article] [PubMed] [Google Scholar]
- 27. Dinh TK, Fendler W, Chalubinska‐Fendler J et al Circulating miR‐29a and miR‐150 correlate with delivered dose during thoracic radiation therapy for non‐small cell lung cancer. Radiat Oncol 2016; 11: 61. [DOI] [PMC free article] [PubMed] [Google Scholar]
- 28. Cazzoli R, Buttitta F, Di Nicola M et al microRNAs derived from circulating exosomes as noninvasive biomarkers for screening and diagnosing lung cancer. J Thorac Oncol 2013; 8 (9): 1156–62. [DOI] [PMC free article] [PubMed] [Google Scholar]
- 29. Mori MA, Ludwig RG, Garcia‐Martin R, Brandao BB, Kahn CR. Extracellular miRNAs: From biomarkers to mediators of physiology and disease. Cell Metab 2019; 30 (4): 656–73. [DOI] [PMC free article] [PubMed] [Google Scholar]
- 30. Tang YT, Huang YY, Zheng L et al Comparison of isolation methods of exosomes and exosomal RNA from cell culture medium and serum. Int J Mol Med 2017; 40 (3): 834–44. [DOI] [PMC free article] [PubMed] [Google Scholar]
- 31. Gyoba J, Shan S, Roa W, Bedard EL. Diagnosing lung cancers through examination of micro‐RNA biomarkers in blood, plasma, serum and sputum: A review and summary of current literature. Int J Mol Sci 2016; 17 (4): 494. [DOI] [PMC free article] [PubMed] [Google Scholar]
- 32. Barger JF, Nana‐Sinkam SP. MicroRNA as tools and therapeutics in lung cancer. Respir Med 2015; 109 (7): 803–12. [DOI] [PMC free article] [PubMed] [Google Scholar]
- 33. Min P, Li W, Zeng D et al A single nucleotide variant in microRNA‐1269a promotes the occurrence and process of hepatocellular carcinoma by targeting to oncogenes SPATS2L and LRP6. Bull Cancer 2017; 104 (4): 311–20. [DOI] [PubMed] [Google Scholar]
- 34. Bu P, Wang L, Chen KY et al miR‐1269 promotes metastasis and forms a positive feedback loop with TGF‐beta. Nat Commun 2015; 6: 6879. [DOI] [PMC free article] [PubMed] [Google Scholar]
- 35. Webb AE, Brunet A. FOXO transcription factors: Key regulators of cellular quality control. Trends Biochem Sci 2014; 39 (4): 159–69. [DOI] [PMC free article] [PubMed] [Google Scholar]
- 36. Huang H, Tindall DJ. Dynamic FoxO transcription factors. J Cell Sci 2007; 120 (Pt 15): 2479–87. [DOI] [PubMed] [Google Scholar]
- 37. Luo CT, Liao W, Dadi S, Toure A, Li MO. Graded Foxo1 activity in Treg cells differentiates tumour immunity from spontaneous autoimmunity. Nature 2016; 529 (7587): 532–6. [DOI] [PMC free article] [PubMed] [Google Scholar]
Associated Data
This section collects any data citations, data availability statements, or supplementary materials included in this article.
Supplementary Materials
Supplementary Figure S1: Relative expression and ROC curves analysis of four selected miRNAs in serum exosomes. (a–d) Relative expressions of four selected serum miRNAs in patients with NSCLC (n = 73) and control individuals (n = 75) using qRT‐PCR assay in validation set, P < 0.001. ROC curve analysis for NSCLC detection using hsa‐miR‐9‐3p (e), hsa‐miR‐205‐5p (f), hsa‐miR‐210‐5p (g) and hsa‐miR‐1269a (h) in the validation set. Comparison of diagnostic performance between four‐miRNA panel and hsa‐miR‐9‐3p (i), hsa‐miR‐205‐5p (j) or hsa‐miR‐210‐5p (k) for NSCLC detection in training set. Comparison of diagnostic performance between four‐miRNA panel and hsa‐miR‐9‐3p (l), hsa‐miR‐205‐5p (m) or hsa‐miR‐210‐5p (n) for NSCLC detection in validation set.
Supplementary Figure S2: Schematic representation of WT‐ and Mut‐FOXO1 sequences. Blue fonts represented the mutant bases.
Supplementary Table S1 Clinicopathological characteristics of patients and demographic information of controls in training set and validation set.
Supplementary Table S2: Sequences of primers used for qRT‐PCR in this study.
Supplementary Table S3: Expression of four serum exosome‐derived miRNAs in NSCLC patients and healthy controls in validation set (median [interquartile range]).
Supplementary Table S4: Correlations between serum exosomal miRNA concentrations and clinicopathological characteristics of patients with NSCLC in training set (median [interquartile range]).
Supplementary Table S5: Correlations between serum exosomal miRNA concentrations and clinicopathological characteristics of patients with NSCLC in validation set (median [interquartile range]).


