

Abstract
This article describes the modified arterial reservoir in detail. The modified arterial reservoir makes explicit the wave nature of both reservoir (Pres) and excess pressure (Pxs). The mathematical derivation and methods for estimating Pres in the absence of flow velocity data are described. There is also discussion of zero-flow pressure (Pzf), the pressure at which flow through the circulation ceases; its relationship to asymptotic pressure (P∞) estimated by the reservoir model; and the physiological interpretation of Pzf . A systematic review and meta-analysis provides evidence that Pzf differs from mean circulatory filling pressure.
Keywords: Geometrical imperfection, Hemodynamics, blood pressure, circulation
Introduction
The concept of an arterial reservoir dates back to Borelli1 and Hales; 2 it was developed further by Weber 3 (from whom the term Windkessel is derived in Salisbury et al. 4 ) and by Frank, 5 who provided a mathematical framework for it. More recently, in the early 2000s, a revised form of the arterial reservoir was proposed by Parker 6 and the results using this approach were first published by Wang et al. 7 According to this model, the pressure waveform was envisaged as the sum of a Windkessel pressure and (mainly forward) travelling waves. 7 While this proposal elicited interest, it also received criticism,8–11 with criticisms related to the assumption of a uniform Windkessel pressure being particularly pertinent. More recently, the model was revised to address this problem. 12 In the revised model, the Windkessel pressure was replaced by a reservoir pressure, which was made up from waves and was delayed by the time taken for waves to travel from the aortic root to the location of measurement. 12 This modification makes explicit the wave nature of reservoir pressure, and this modified definition has achieved some degree of acceptance. 13 The aim of this review is to describe the modified arterial reservoir in more detail and to provide more information regarding the asymptotic pressure, P∞, its relationship to zero-flow pressure (Pzf), the arterial pressure at which flow through the circulation ceases, also termed critical closing pressure, 14 and the physiological interpretation of Pzf.
Wave travel in arteries and its relation to the reservoir
The existence of wave travel in arteries is undisputed. 13 A number of studies have envisaged the arterial system as a single or a T-tube; however, this approach to arterial hemodynamics is too simplistic, and a more sophisticated model of wave propagation in arteries is necessary. 15 More realistic one-dimensional models show that the branching pattern of the arterial circulation gives rise to myriad reflected waves, which are themselves re-reflected and re-re-reflected before returning to the aortic root.16,17 Tapering of the arterial system may also make an important contribution to wave reflection patterns, 18 and inclusion of visco-elastic behaviour may also be important in intermediate size vessels. 19 The reservoir pressure can be understood as the pressure due to the cumulative effect of these reflected and re-reflected waves, which decrease in magnitude but increase in number as they travel. Another implication of the branching nature of the arterial tree is that the reflection coefficient at a bifurcation depends on the direction of travel of the wave. At bifurcations in large arteries, the combined admittance of the offspring arteries is similar to that of the parent artery (i.e. most bifurcations are well-matched for forward travelling waves); however, this also means that they are poorly matched for backward travelling waves.17,20 Thus, large reflections from peripheral reflection sites are dispersed by the re-reflections they undergo, while travelling back to the aortic root. These considerations account for a ‘horizon effect’ where the apparent time of reflection of the initial compression wave, as indicated by a peak in the backward wave intensity, is independent of the site where the measurements are made. 16
A modified definition of reservoir pressure
The modified definition of the reservoir pressure (Pres) assumes that the reservoir is made up of a network of N arteries. It is also assumed that the root artery (the aorta), A0, is connected to the left ventricle and receives the stroke volume, Qin, and that there are K terminal vessels – these are assumed to be connected to the microcirculation which is not considered part of the reservoir. A time-varying average pressure in each vessel P(t, n) is defined as the integral of pressure over the length of each arterial segment. A simplified version of this scheme is illustrated in Figure 1.
Figure 1.
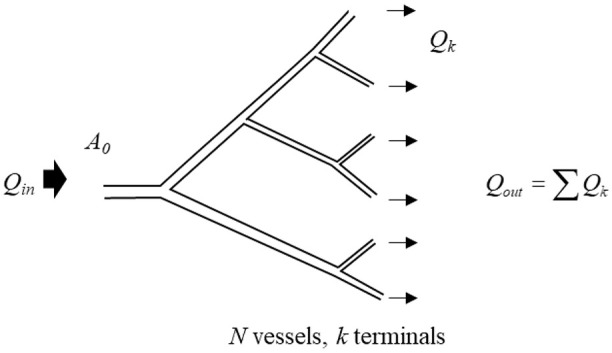
A simplified schematic showing a network of branching arteries corresponding to an arterial reservoir (where N = 11 and K = 6). The inlet Qin to the network is labelled as A0 and the flow into the reservoir is indicated by the large arrow directed into the system. The termini linking to the microcirculation are the smallest vessels and the outflow Qout is indicated by arrows going out of the system. The microcirculation (through which the reservoir discharges) and venous system are not shown as they are not considered part of the arterial reservoir.
The conservation of mass for the arterial network constrains the rate of change in the total volume, V, of the system to be equal to the difference between volume flow rate into the root, Qin, and the sum of the flow out of the terminal vessels, Qout
| (1) |
We assume that the end of each terminal vessel is coupled to a resistance, Rk, which is assumed to be constant (i.e. independent of pressure). Under these conditions, the flow out of the kth terminal vessel is given by
| (2) |
where Pzf (zero-flow pressure/critical closing pressure) is the pressure at which flow through the microcirculation ceases. As will be discussed later, Pzf can be greater than zero (or venous pressure), and for the purpose of this model, it is assumed that it is the same for all termini. We also assume that the compliance of the nth vessel is Cn, where and Ln, An and vn are the length, cross-sectional area and wave speed, respectively, of the nth vessel. The mass conservation equation can now be written in terms of the properties of the individual vessels
| (3) |
where is the sum over all of the vessels and is the sum over the terminal vessels.
Windkessel pressure
Frank’s two-element Windkessel model has similarities and differences from reservoir pressure. The Windkessel pressure Pwk is assumed to be uniform. 5 With this assumption, the pressure, Pwk, can be taken outside of the summations and the mass conservation equation reduces to
| (4) |
where is the total arterial compliance and is the total peripheral resistance, using the usual formula for resistances in parallel.
This is, in essence, the approach originally used by Frank to solve for the Windkessel pressure, although Frank assumed that Pzf = 0.
Pwk takes account of the compliant nature of the large arteries but the assumption of a uniform pressure implies an infinite wave speed, which is physiologically implausible. The modified reservoir pressure does not share this defect.
Reservoir pressure and excess pressure
The modified reservoir pressure is defined as a pressure that is similar in form throughout the extent of the arterial reservoir, but which is delayed by the time it takes for waves to travel from the root to that location; hence, the reservoir pressure in the nth vessel is
| (5) |
where t is time, and τ(n) is the wave transit time, the time it takes for waves to travel from the root to vessel n. With this assumption, the mass conservation equation takes the form
| (6) |
This equation involves only one pressure, Pres, instead of involving N different pressures, P(n). This equation is a first-order time-delay differential equation with constant coefficients. These have been studied extensively in the context of control theory and there are existence and uniqueness theorems that ensure that a solution of this equation exists, with suitable boundary conditions, and that it is unique. Unfortunately, there is no established way to find the solution for a particular case, and most solutions are found by iterative methods. Solving the equation would require knowledge of all of the individual compliances and resistances of all of the arteries – knowledge that is impossible to obtain in practice, since there are too many vessels.
The excess pressure (Pxs) in the nth vessel is defined as the difference between the measured pressure and the reservoir pressure
| (7) |
with these definitions Pres and Pxs can be calculated as shown below.
Calculation of reservoir pressure
All of the methods of estimating the reservoir pressure are based on the assumption that the wave transit times are small in comparison with the cardiac cycle (τ(n) ≪ 1 cardiac period – assumed to be ∼1 s in human). This is supported by in vivo measurements of the aorto-iliac transit time in humans (i.e. the time taken for the initial compression wave to traverse the whole of the aorta from aortic root to iliac bifurcation) which is <80 ms, 21 while the time from foot to peak pressure is approximately 2.5-fold longer (∼200 ms 22 ).
So, using a Taylor expansion for Pres(t −τ(n))
| (8) |
where stands for the terms of order, . Substituting into the mass conservation equation, the terms involving Pres can be taken out of the summations and we obtain the ordinary differential equation (ODE)
| (9) |
where, as in the derivation of the Windkessel pressure, , and . This shows that to , the equation for Pres is identical to the equation for Pwk, but without the need to assume a uniform pressure throughout the reservoir. This also makes clear that the reservoir pressure travels as waves and is the basis of the method of estimation of Pres.
Calculating Pres when pressure and aortic flow are known
If the aortic inflow, Qin(t), is measured simultaneously with the pressure, P0(t), then the calculation of Pres(t) is relatively straightforward. The solution of the ODE is easily found by quadrature
| (10) |
where s is time from the start of systole. During diastole, when the valve is closed, Qin = 0, and the solution becomes
| (11) |
where Pes is the pressure at end-systole. This is a mono-exponentially falling function of time with a time constant, τ = RC. This is one of several well-established ways to estimate total arterial compliance, 23 although it should be noted that inclusion (or not) of Pzf has a substantial effect on estimates of the time constant or arterial compliance using this method.24–26 We use maximum negative rate of pressure change (max −dP/dt) as the indicator of end-systole to determine Pes, since the timing of this event has been shown to agree very closely (mean error < 0.4 ms) with the time of cessation of aortic flow at the end of systole in invasive studies in dogs 27 and is easy to identify in recorded pressure waveforms.
Frequently reservoir pressure calculations are performed using flow velocity rather than volumetric flow rate (Q); under these circumstances, it should be remembered that while estimates of Pres, Pzf, and τ are unaffected, the values of R and C are equal to resistance × area and compliance/area, where the area refers to the cross-sectional area of the aorta.
This method of calculating Pres can be used in experiments, where both pressure and flow rate (or velocity) are measured in the aorta. Clinically, however, it can be difficult to obtain simultaneous measurements of pressure and flow and so another more approximate method has been devised for calculating Pres that requires only the pressure to be measured.
Calculating Pres when only pressure is known
The method for calculating Pres using only pressure measurement is based on an observation made by Wang et al. 7 in dogs, who reported that the excess pressure, Pxs, was directly proportional to the flow into the aortic root, Qin. Subsequent studies in humans employing invasive measurements of pressure and flow velocity in the aorta 28 and non-invasive measurements of carotid artery pressure and aortic flow29,30 have made similar observations. On this assumption, we can substitute Qin = ζPxs = ζ(P − Pres) into the mass conservation equation, where ζ is a constant of proportionality. If this relationship is viewed as analogous to a three-element Windkessel model, 31 then ζ will be related to the characteristic admittance, or 1/Zc (i.e. the inverse of the characteristic impedance). 29 Indeed, Westerhof and Westerhof 15 have proposed that if the analogy with the three-element Windkessel model holds, then Pres will be equal to twice the backward pressure (Pb). (This relationship can be shown to be true in diastole when aortic flow (Q) = 0, but the derivation relies on the assumption that Q = Qin which may be questionable.)
If we define ks = ζ/C and kd = 1/RC, then equation (9) can be written as
| (12) |
This equation is similar in form to the previous ODE, but the right-hand side depends on P(t) rather than Qin.
This first-order linear differential equation can be solved as
| (13) |
This equation can be solved by iterative non-linear regression based on a three-element Windkessel model 32 or alternatively the diastolic parameters kd and Pzf can be estimated by fitting an exponential curve to the pressure during diastole
| (14) |
where the offset of the fit (P∞) is assumed to be equal to Pzf (NB the validity of this assumption is examined below). Then, ks is estimated by minimising the square error between P and Pres obtained over diastole in equation (12).
This formulation of reservoir and excess pressure makes the difference between Windkessel and reservoir pressures clear as previously noted by Alastruey 33 (Figure 2).
Figure 2.

Circuit diagrams illustrating the comparison between a two-element Windkessel and reservoir pressures conceptualised as a three-element Windkessel model. (a) Two-element Windkessel model; here, Pin is equal to Windkessel pressure (Pwk). (b) Three-element Windkessel model of reservoir pressure (Pres). In the three-element model, Pres still corresponds to the pressure across the capacitance, C, but Pres is smaller than Pin due to the pressure drop across the characteristic impedance, Zc. Modified from Alastruey. 33
In principle, the approach described here should only be valid if Qin = ζPxs, which implies the absence of reflections. As discussed, reflections are always present in the circulation, but this assumption may hold within reasonable limits in the proximal aorta of healthy individuals.7,34,35 It is less likely to be true in more peripheral locations where prominent wave reflections are observed in early systole.36,37 The assumption of proportionality between Qin and Pxs may also not apply when there is pathology giving rise to marked wave reflections in the proximal aorta.38,39 Despite these provisos, estimates of Pres made at various locations in the aorta (the transverse aortic arch, the diaphragmatic aorta, the aorta at the level of the renal arteries, and the aortic bifurcation) 40 and in the brachial and radial artery using invasive methods 41 are very similar to estimates in the proximal aorta (within 5%). Estimates of Pres made using non-invasive methods also show acceptable concordance with aortic measures (intra-class correlation coefficient of 0.77), although they are less accurate, probably due to errors in the estimation of systolic and diastolic pressure by cuff methods. 42 In contrast, as expected, estimates of Pxs differ substantially between the proximal aorta and more peripheral locations,40–42 with Pxs being larger in more proximal locations. Alastruey 33 proposed an alternative definition of Pxs, where it would be redefined as proportional to flow at any location; however, such a proposal would also result in a redefinition of Pres and so far the value of this approach seems not to have been explored.
Currently, there appear to be no publications where estimates of Pres based on pressure and flow velocity have been compared with estimates derived from pressure alone, although unpublished data from our group indicate excellent agreement between the approaches (correlation coefficient > 0.9; mean difference in peak Pres = 2 ± 1 mmHg, p < 0.002) based on invasive measurements of pressure and flow velocity in the aorta.
The relation of Pzf to P∞ and the physiological interpretation of Pzf
The presence of positive pressure in the arterial circulation following cessation of flow, Pzf, has been recognised for many years. 43 In the context of the arterial reservoir, some authors have assumed that Pzf corresponds to venous pressure (or zero as a rough approximation to venous pressure)29,44 or else that it should represent mean circulatory filling pressure (MCFP).32,45 MCFP, as defined by Guyton, is ‘the pressure that would be measured at all points in the entire circulatory system if the heart were stopped suddenly and the blood were redistributed instantaneously in such a manner that all pressures were equal’ (quoted in 46). 46 Previous work in several species47,48 including some necessarily limited work in man 49 has shown that Pzf differs from venous pressure and that in most cases47,48,50,51 (but not all cases 52 ), there is no equalisation of arterial pressure with venous or right atrial pressure, even after prolonged cessation of flow. Whether Pzf corresponds to MCFP has not been formally examined previously as far as we can tell, so in order to address this question, we undertook a systematic review of the literature; some of these data have been published previously in abstract form. 53
A literature search was performed using PubMed and was limited to full articles in English using the search terms ‘MCFP’ OR ‘Mean systemic filling pressure’ OR ‘critical closing’ OR ‘zero-flow’ in publications prior to 01/09/2019. Only data relating to measurements of pressure following cessation of systemic flow were included; other exclusions were individual case reports, pregnancy, non-adult animals, not mammalian, post-mortem, or any non-human models of disease. Meta-analysis was performed using a random effects model, since it was anticipated that there would be heterogeneity between studies. Analyses were conducted in Stata 15.1. Data are shown as means (95% confidence intervals (CIs)).
A total of 1255 unique publications were identified after removal of duplicates; 1235 were excluded during screening. The remaining 20 studies48–51,54–69 with Pzf data were included in a meta-analysis (Figure 3); these included data from dog, rat, pig and human; eight of these articles also provided data on MCFP from the same studies. Some further details of these studies are shown in Supplementary Table S1. From this analysis, Pzf = 26.5 (23.4, 29.5) mmHg (Figure 4; 20 studies; mean (95% CI); n = 311; I2 = 97%; p < 0.001) and MCFP = 10.6 (9.3, 12.0) mmHg (eight studies; n = 178; I2 = 96%; p < 0.001). The difference between Pzf and MCFP was 15.1 (12.0, 18.3) mmHg (eight studies; n = 178; I2 = 97%; p < 0.001). The comparison between Pzf and MCFP is shown graphically in Figure 5. There was no evidence of small sample bias based on an Egger test for either analysis (p > 0.05 for both). Further analyses provided no convincing evidence that the duration of cessation of flow was related to the estimate of Pzf based on meta-regression (p = 0.1) although the small sample size precluded firm conclusions. Similarly, the extent of heterogeneity within sub-groups (e.g. species, method of calculation) prevented any reliable conclusions on the importance of these factors in the observed heterogeneity in Pzf between studies. Nevertheless, it seems plausible that methodological differences between studies contribute to variability in the estimates of Pzf . There was evidence that MCFP differed between species (test for heterogeneity between sub-groups, p = 0.007) but there was insufficient data to examine whether reported differences between studies contributed to heterogeneity in MCFP (data not shown).
Figure 3.

A preferred reporting items for systematic reviews and meta-analyses (PRISMA) flow diagram for zero-flow pressure (Pzf).
Figure 4.

Forest plot of meta-analysis of zero-flow pressure (Pzf). Data categorised by species.
Figure 5.

Forest plot of meta-analysis of differences between zero-flow pressure (Pzf) and mean circulation filling pressure (MCFP) in studies in which both were measured.
Based on these findings, it seems clear that despite considerable heterogeneity Pzf does not equal MCFP. It is noteworthy that this is consistent with the standard practice in many experiments designed to estimate MCFP which either routinely transfer blood from the arterial to the venous circulation to achieve equilibration of pressure57,70 or else apply a correction factor to take account of the ‘trapped’ volume of blood in the arterial circulation after cessation of flow. 57 We note that this finding does not necessarily imply that arterial and venous pressures cannot equilibrate after extremely prolonged cessation of flow. 71 The duration of cessation of inflow in the studies identified in the systematic review was between 3 and 30 s (median 12.5 s), which is longer than the time constant of the decline in pressure (typically ∼2 to 3 s) but short enough to at least partially limit the secondary rises in MCFP due to reflex changes in vasomotor tone, and decreased venous compliance that tend to reduce differences between MCFP and Pzf through elevated MCFP. 71 It is also unlikely that substantial oedema or hemodilution would occur over this time span and affect estimates of MCFP and Pzf. Most studies did not measure flow as well as pressure, but those that did reported that cessation of flow occurred between 3 and 20 s after cardiac arrest or switching off the perfusion pump.56,58,62 This suggests that the duration of cessation of inflow was probably sufficient to obtain a reliable estimate of Pzf.
Values of Pzf that exceed MCFP are consistent with previous suggestions that Pzf represents a pressure due to a Starling resistor effect, sometimes termed (although some argue inappropriately72,73) a ‘vascular waterfall’. 74 Pzf is also often termed critical closing pressure after Burton, 75 although it is now generally accepted that vessel closure does not account for Pzf.76–78Pzf is not a fixed parameter and varies between species, 14 individuals, 79 physiological (or pathophysiological) conditions, 79 tissues58,61,80 or even within tissues. 81 Given the reported between-tissue differences in Pzf, it is likely that systemic Pzf is a weighted average of multiple Pzf. This may relate to differences in vascular resistance between tissues, since there is evidence that vasoconstriction and vasodilation increase and decrease Pzf quite markedly, respectively.14,54,82 Indeed, in the rabbit ear, vasoconstriction has been reported to increase Pzf to ∼130 mmHg – in excess of mean arterial pressure in the rabbit! 14 Increased tissue interstitial pressure also influences Pzf, as would be expected from a Starling resistor. 83 Another factor that influences Pzf is blood rheology; estimates of Pzf are lower following hemodilution, 48 although since positive Pzf has been observed using physiological saline,43,84 it seems unlikely blood-related factors such as red cell aggregation, 85 the complex viscous behaviour of blood at low flow 86 or leukocyte plugging 87 fully account for Pzf.
The duration of cessation of flow has been reported to affect the estimated Pzf. 88 Short duration cessation of flow may result in over-estimates due to the effects of capacitive discharge from downstream vessels as suggested by Spaan 89 and Magder. 90 This effect, which assumes that a simple RC compartment model increases ‘apparent Pzf’ by an amount equal to −¢RdP/dt (where ¢ is the downstream microvascular compliance) 91 will introduce a difference between P∞ and Pzf that depends on the rate of pressure decline in diastole. Estimates of the effect of capacitive discharge have been made in the coronary circulation and show that this effect could easily account for a ∼10 mmHg difference between P∞ and Pzf. 91 Alternatively, longer periods of flow cessation may lead to changes in vascular properties due to the lack of flow or ischaemia or alterations in rheology or tissue interstitial pressure. Braakman et al. 82 presented evidence for two Pzf (instantaneous (arteriolar) and steady-state (venous)) in skeletal muscle, with the ‘instantaneous’Pzf being dependent on vasoconstrictor tone, whereas the ‘steady-state’Pzf was not. It seems likely that the different techniques used to estimate Pzf will be differentially influenced by the factors that influence Pzf and that this will contribute to variation in estimates of Pzf.
Despite these considerations, evidence presented here suggests that Pzf is substantially lower than estimates of P∞ (based on fitting diastolic pressure to equation (14)). P∞ in the human aorta has been reported to be between 54 and 75 mmHg,26,40 while the upper limit of the predictive interval of Pzf in humans in our meta-analysis was 51 mmHg. This is consistent with a previous report in humans where P∞ calculated from normal beats was ∼29 mmHg greater than Pzf calculated during arrest. 49 Estimates of P∞ will include uncertainties associated with fitting only short durations of diastole, particularly if the fit includes the perturbation in pressure that accompanies the onset of isovolumic contraction prior to the foot of the next pressure cycle. 92 However, this seems insufficient to account for such a large difference and it may indicate that one or more assumptions in the present approach to fitting reservoir pressure is not valid.
The assumption of a mono-exponential decline in diastolic pressure has been examined experimentally by a few authors. From seven patients in whom aortic pressure was measured invasively, Liu et al. 24 looked at whether estimates of the slope of the semi-log regression of pressure and time gave consistent estimates of, and whether regression of dP/dt versus P was linear during diastole; they found that results using either method were inconsistent with a mono-exponential decline. Kottenberg-Assenmacher et al. 49 reported that the goodness of fit (by χ2) of the time-dependent decline in invasive aortic pressure following circulatory arrest in humans was slightly better using a two-exponential model or using a model including a pressure-dependent coefficient, although the effect on the estimates of these more complex models on the estimates of P∞ was small (<2 mmHg). Schipke et al. 51 reported that the correlation coefficients (presumably to the linearized semi-log transformation of the mono-exponential function) were 0.92 ± 0.05, and that data were less well fitted by linear and quadratic functions, but other functions seem not to have been examined. Brunner et al. 48 reported that after stopped flow the relationship between the natural logarithm of the declining pressure with time was linear in seven out of 13 dogs (consistent with a mono-exponential decline) but in the remaining six dogs, the data were not consistent with a mono-exponential decline. Sylvester et al. 50 reported that the decline in pressure following stopped flow was ‘well-described’ by a mono-exponential function with standard deviations on average <2 mmHg but provided no other quantification of fits.
On the basis of theoretical considerations regarding small artery compliance,89,90 the pressure dependence of large artery compliance24,93 and resistance,89,94 it seems unlikely that the assumption of a mono-exponential decline should be valid.89,90 Still, in view of the well-recognised difficulty in fitting multiple exponentials to complex data,95,96 we believe that the fitting of multi-exponential functions to diastolic pressure is unlikely to yield much advantage, although it may be worth exploring.
Conclusion
The arterial Windkessel model is undoubtedly a simple and widely used conceptual model of the circulation. In its modified form, the arterial reservoir can be viewed as analogous to the Windkessel but comprising multiple reflected (and re-reflected) waves that arise due to the different forward and backward impedance properties of a branching network,20,97,98 which give rise to a ‘horizon effect’. 16 The waves that make up the reservoir are indiscernible by wave intensity analysis as their individual magnitudes are very small, 37 but together they make up a large store of energy. This energy, which is effectively trapped within the large elastic (conduit) arteries due to reflection and re-reflection, provides the motive force for tissue perfusion during diastole. This wave entrapment 45 equates to the volume storage of a classic Windkessel and accounts for the apparent similarities between these models. The waves that make up the reservoir persist across several cardiac cycles and account for most of the energy present in any particular cycle at quasi-steady state. 35 We have previously proposed that mean arterial pressure should be viewed as largely a product of these waves rather than the equilibrium state of the circulation as envisaged by Fourier-based impedance analysis. 99
Following cessation of ejection, pressure declines in a quasi-exponential manner towards a value, Pzf, which is the pressure at which outflow through the microcirculation ceases. A review of the experimental evidence suggests not only that Pzf exceeds venous pressure or MCFP but also that estimates of the offset (Pinf) derived from fitting a mono-exponential function to the decline in pressure during diastole of a normal cardiac cycle are substantially greater than Pzf, possibly as a consequence of the mono-exponential assumption. Further work is required to establish on how best to estimate Pzf from recordings of normal cardiac cycles.
Several features of the modified arterial reservoir model (and its underlying wave nature) contrast with interpretations that would be made if the circulation were viewed as analogous to a single tube, and the utility of the single tube model is questionable in our view and that of others. 100 While tangential to the content of this review, it is worth noting that the presence of multiple re-reflections also casts doubt on the utility of the ratio of forward to backward pressure, Pb/Pf (often termed reflection magnitude) as a measure of reflection, since a substantial part of forward pressure will arise from re-reflection of initially reflected (backward travelling) waves. This issue has also been alluded previously,45,100–102 but its implications for pulse wave analysis seem not to have been fully apprehended.
In summary, the modified arterial reservoir represents a useful, albeit reduced, model of the circulation. The ability of parameters derived from this model to predict future cardiovascular events independent of conventional cardiovascular risk factors103–111 suggests this model has clinical utility. No model of the circulation is perfect, however, and its limitations need to be recognised.
Supplemental Material
Supplemental material, Supplementary_data_1rev for The modified arterial reservoir: An update with consideration of asymptotic pressure (P∞) and zero-flow pressure (Pzf) by Alun D Hughes and Kim H Parker in Proceedings of the Institution of Mechanical Engineers, Part H: Journal of Engineering in Medicine
Footnotes
The author(s) declared no potential conflicts of interest with respect to the research, authorship and/or publication of this article.
Funding: The author(s) disclosed receipt of the following financial support for the research, authorship and/or publication of this article: A.H. receives the support from the British Heart Foundation (CS/13/1/30327, PG/13/6/29934, PG/15/75/31748, CS/15/6/31468, PG/17/90/33415 and IG/18/5/33958); the National Institute for Health Research, University College London Hospitals, Biomedical Research Centre; the UK Medical Research Council (MR/P023444/1); and works in a unit that receives support from the UK Medical Research Council (MC_UU_12019/1).
ORCID iDs: Alun D Hughes  https://orcid.org/0000-0001-5432-5271
Kim H Parker
https://orcid.org/0000-0001-6971-0682
Supplemental material: Supplemental material for this article is available online.
References
- 1. Borelli GA. On the movement of animals. Berlin; New York: Springer, 1989. [Google Scholar]
- 2. Hales S. Statical essays: containing haemastaticks. New York: Hafner, 1964. [Google Scholar]
- 3. Weber EH. Annotationes Anatomicae et Physiologicae. Programmata collecta. De utilitate parietis elastici arteriarum. Leipzig: C.F. Koehler, 1834. [Google Scholar]
- 4. Salisbury PF, Cross CE, Rieben PA. Ventricular performance modified by elastic properties of outflow system. Circ Res 1962; 11: 319–328. [PubMed] [Google Scholar]
- 5. Frank O. The basic shape of the arterial pulse. First treatise: mathematical analysis. 1899. J Mol Cell Cardiol 1990; 22(3): 255–277. [DOI] [PubMed] [Google Scholar]
- 6. Parker KH. The history of reservoir/excess pressure, http://www.bg.ic.ac.uk/research/k.parker/res_press_web/rp_history.html
- 7. Wang JJ, O’Brien AB, Shrive NG, et al. Time-domain representation of ventricular-arterial coupling as a Windkessel and wave system. Am J Physiol Heart Circ Physiol 2003; 284(4): H1358–H1368. [DOI] [PubMed] [Google Scholar]
- 8. Segers P, Swillens A, Vermeersch S. Reservations on the reservoir. J Hypertens 2012; 30(4): 676–678. [DOI] [PubMed] [Google Scholar]
- 9. Mynard JP. Assessment of conceptual inconsistencies in the hybrid reservoir-wave model. In: Annual international conference of the IEEE engineering in medicine and biology society, Osaka, Japan, 3–7 July 2013, pp.213–216. New York: IEEE. [DOI] [PubMed] [Google Scholar]
- 10. Mynard JP, Smolich JJ, Avolio A. The ebbing tide of the reservoir-wave model. J Hypertens 2015; 33(3): 461–464. [DOI] [PubMed] [Google Scholar]
- 11. Westerhof N, Westerhof BE. The reservoir wave paradigm discussion. J Hypertens 2015; 33(3): 458–460. [DOI] [PubMed] [Google Scholar]
- 12. Parker KH. Arterial reservoir pressure, subservient to the McDonald lecture, Artery 13. Artery Res 2013; 7(3–4): 171–185. [Google Scholar]
- 13. Segers P, O’Rourke MF, Parker K, et al. Towards a consensus on the understanding and analysis of the pulse waveform: results from the 2016 workshop on arterial hemodynamics – past, present and future. Artery Res 2017; 18: 75–80. [DOI] [PMC free article] [PubMed] [Google Scholar]
- 14. Nichol J, Girling F, Jerrard W, et al. Fundamental instability of the small blood vessels and critical closing pressures in vascular beds. Am J Physiol 1951; 164(2): 330–344. [DOI] [PubMed] [Google Scholar]
- 15. Westerhof N, Westerhof BE. Waves and Windkessels reviewed. Artery Res 2017; 18: 102–111. [Google Scholar]
- 16. Davies JE, Alastruey J, Francis DP, et al. Attenuation of wave reflection by wave entrapment creates a ‘horizon effect’ in the human aorta. Hypertension 2012; 60(3): 778–785. [DOI] [PubMed] [Google Scholar]
- 17. Alastruey J, Parker KH, Peiro J, et al. Analysing the pattern of pulse waves in arterial networks: a time-domain study. J Eng Math 2009; 64(4): 331–351. [Google Scholar]
- 18. Segers P, Verdonck P. Role of tapering in aortic wave reflection: hydraulic and mathematical model study. J Biomech 2000; 33(3): 299–306. [DOI] [PubMed] [Google Scholar]
- 19. Bessems D, Giannopapa CG, Rutten MC, et al. Experimental validation of a time-domain-based wave propagation model of blood flow in viscoelastic vessels. J Biomech 2008; 41(2): 284–291. [DOI] [PubMed] [Google Scholar]
- 20. Baksi AJ, Davies JE, Hadjiloizou N, et al. Attenuation of reflected waves in man during retrograde propagation from femoral artery to proximal aorta. Int J Cardiol 2016; 202: 441–445. [DOI] [PMC free article] [PubMed] [Google Scholar]
- 21. Rezai MR, Cowan BR, Sherratt N, et al. A magnetic resonance perspective of the pulse wave transit time by the Arteriograph device and potential for improving aortic length estimation for central pulse wave velocity. Blood Press Monit 2013; 18(2): 111–118. [DOI] [PubMed] [Google Scholar]
- 22. Mitchell GF, Parise H, Benjamin EJ, et al. Changes in arterial stiffness and wave reflection with advancing age in healthy men and women: the Framingham Heart Study. Hypertension 2004; 43(6): 1239–1245. [DOI] [PubMed] [Google Scholar]
- 23. Stergiopulos N, Meister JJ, Westerhof N. Evaluation of methods for estimation of total arterial compliance. Am J Physiol 1995; 268(4 Pt. 2): H1540–H1548. [DOI] [PubMed] [Google Scholar]
- 24. Liu Z, Brin KP, Yin FC. Estimation of total arterial compliance: an improved method and evaluation of current methods. Am J Physiol 1986; 251(3 Pt. 2): H588–H600. [DOI] [PubMed] [Google Scholar]
- 25. Parragh S, Hametner B, Wassertheurer S. Influence of an asymptotic pressure level on the Windkessel models of the arterial system. IFAC Papers Online 2015; 48(1): 17–22. [Google Scholar]
- 26. Chemla D, Lau EMT, Herve P, et al. Influence of critical closing pressure on systemic vascular resistance and total arterial compliance: a clinical invasive study. Arch Cardiovasc Dis 2017; 110(12): 659–666. [DOI] [PubMed] [Google Scholar]
- 27. Abel FL. Maximal negative dP/dt as an indicator of end of systole. Am J Physiol 1981; 240(4): H676–H679. [DOI] [PubMed] [Google Scholar]
- 28. Davies JE, Hadjiloizou N, Leibovich D, et al. Importance of the aortic reservoir in determining the shape of the arterial pressure waveform – the forgotten lessons of Frank. Artery Res 2007; 1(2): 40–45. [Google Scholar]
- 29. Vermeersch SJ, Rietzschel ER, De Buyzere ML, et al. The reservoir pressure concept: the 3-element Windkessel model revisited? Application to the Asklepios Population Study. J Eng Math 2009; 64(4): 417–428. [Google Scholar]
- 30. Michail M, Narayan O, Parker KH, et al. Relationship of aortic excess pressure obtained using pressure-only reservoir pressure analysis to directly measured aortic flow in humans. Physiol Meas 2018; 39(6): 064006. [DOI] [PubMed] [Google Scholar]
- 31. Westerhof N, Stergiopulos N, Noble MIM. Snapshots of hemodynamics: an aid for clinical research and graduate education. New York: Springer, 2005. [Google Scholar]
- 32. Kamoi S, Pretty C, Docherty P, et al. Continuous stroke volume estimation from aortic pressure using zero dimensional cardiovascular model: proof of concept study from porcine experiments. PLoS ONE 2014; 9(7): e102476. [DOI] [PMC free article] [PubMed] [Google Scholar]
- 33. Alastruey J. On the mechanics underlying the reservoir-excess separation in systemic arteries and their implications for pulse wave analysis. Cardiovasc Eng 2010; 10(4): 176–189. [DOI] [PMC free article] [PubMed] [Google Scholar]
- 34. Davies JE, Baksi J, Francis DP, et al. The arterial reservoir pressure increases with aging and is the major determinant of the aortic augmentation index. Am J Physiol Heart Circ Physiol 2010; 298(2): H580–H586. [DOI] [PMC free article] [PubMed] [Google Scholar]
- 35. Willemet M, Alastruey J. Arterial pressure and flow wave analysis using time-domain 1-D hemodynamics. Ann Biomed Eng 2015; 43(1): 190–206. [DOI] [PMC free article] [PubMed] [Google Scholar]
- 36. Zambanini A, Cunningham SL, Parker KH, et al. Wave-energy patterns in carotid, brachial, and radial arteries: a noninvasive approach using wave-intensity analysis. Am J Physiol Heart Circ Physiol 2005; 289(1): H270–H276. [DOI] [PubMed] [Google Scholar]
- 37. Alastruey J, Hunt AA, Weinberg PD. Novel wave intensity analysis of arterial pulse wave propagation accounting for peripheral reflections. Int J Numer Method Biomed Eng 2014; 30(2): 249–279. [DOI] [PMC free article] [PubMed] [Google Scholar]
- 38. Quail MA, Short R, Pandya B, et al. Abnormal wave reflections and left ventricular hypertrophy late after coarctation of the aorta repair. Hypertension 2017; 69(3): 501–509. [DOI] [PMC free article] [PubMed] [Google Scholar]
- 39. Segers P, Taelman L, Degroote J, et al. The aortic reservoir-wave as a paradigm for arterial haemodynamics: insights from three-dimensional fluid-structure interaction simulations in a model of aortic coarctation. J Hypertens 2015; 33(3): 554–563; discussion 563. [DOI] [PubMed] [Google Scholar]
- 40. Narayan O, Parker KH, Davies JE, et al. Reservoir pressure analysis of aortic blood pressure: an in-vivo study at five locations in humans. J Hypertens 2017; 35(10): 2025–2033. [DOI] [PMC free article] [PubMed] [Google Scholar]
- 41. Peng X, Schultz MG, Picone DS, et al. Arterial reservoir characteristics and central-to-peripheral blood pressure amplification in the human upper limb. J Hypertens 2017; 35(9): 1825–1831. [DOI] [PubMed] [Google Scholar]
- 42. Peng X, Schultz MG, Picone DS, et al. Non-invasive measurement of reservoir pressure parameters from brachial-cuff blood pressure waveforms. J Clin Hypertens (Greenwich) 2018; 20(12): 1703–1711. [DOI] [PMC free article] [PubMed] [Google Scholar]
- 43. Whittaker SR, Winton FR. The apparent viscosity of blood flowing in the isolated hindlimb of the dog, and its variation with corpuscular concentration. J Physiol 1933; 78(4): 339–369. [DOI] [PMC free article] [PubMed] [Google Scholar]
- 44. Aguado-Sierra J, Alastruey J, Wang JJ, et al. Separation of the reservoir and wave pressure and velocity from measurements at an arbitrary location in arteries. Proc IMechE, Part H: J Engineering in Medicine 2008; 222(H4): 403–416. [DOI] [PubMed] [Google Scholar]
- 45. Mynard JP, Smolich JJ. Wave potential and the one-dimensional Windkessel as a wave-based paradigm of diastolic arterial hemodynamics. Am J Physiol Heart Circ Physiol 2014; 307(3): H307–H318. [DOI] [PubMed] [Google Scholar]
- 46. Rothe CF. Mean circulatory filling pressure: its meaning and measurement. J Appl Physiol(1985) 1993; 74(2): 499–509. [DOI] [PubMed] [Google Scholar]
- 47. Girling F. Critical closing pressure and venous pressure. Am J Physiol 1952; 171(1): 204–207. [DOI] [PubMed] [Google Scholar]
- 48. Brunner MJ, Greene AS, Sagawa K, et al. Determinants of systemic zero-flow arterial pressure. Am J Physiol 1983; 245(3): H453. [DOI] [PubMed] [Google Scholar]
- 49. Kottenberg-Assenmacher E, Aleksic I, Eckholt M, et al. Critical closing pressure as the arterial downstream pressure with the heart beating and during circulatory arrest. Anesthesiology 2009; 110(2): 370–379. [DOI] [PubMed] [Google Scholar]
- 50. Sylvester JT, Gilbert RD, Traystman RJ, et al. Effects of hypoxia on the closing pressure of the canine systemic arterial circulation. Circ Res 1981; 49(4): 980. [DOI] [PubMed] [Google Scholar]
- 51. Schipke JD, Heusch G, Sanii AP, et al. Static filling pressure in patients during induced ventricular fibrillation. Am J Physiol Heart Circ Physiol 2003; 285(6): H2510–H2515. [DOI] [PubMed] [Google Scholar]
- 52. Lanari A, Bromberger-Barnea B, Attinger E. Asystolic gradient, intrinsic blood pressure and critical closing pressure in the human forearm. J Appl Physiol 1956; 9(1): 69–74. [DOI] [PubMed] [Google Scholar]
- 53. Hughes A, Parker K, Khir A. Zero flow pressure (Pinfinity) is larger than mean circulatory filling pressure: a systematic review and meta-analysis. Artery Res 2018; 24: 94. [Google Scholar]
- 54. Sagawa K, Eisner A. Static pressure-flow relation in the total systemic vascular bed of the dog and its modification by the baroreceptor reflex. Circ Res 1975; 36(3): 406–413. [DOI] [PubMed] [Google Scholar]
- 55. Bottomley MG, Mainwood GW. A square-pulse flow method for measuring characteristics of the arterial bed. J Appl Physiol 1976; 40(3): 425–433. [DOI] [PubMed] [Google Scholar]
- 56. Jackman AP, Green JF. Arterial pressure-flow relationships in the anesthetized dog. Ann Biomed Eng 1977; 5(4): 384–394. [DOI] [PubMed] [Google Scholar]
- 57. Samar RE, Coleman TG. Measurement of mean circulatory filling pressure and vascular capacitance in the rat. Am J Physiol 1978; 234(1): H94–H100. [DOI] [PubMed] [Google Scholar]
- 58. Ehrlich W, Baer RW, Bellamy RF, et al. Instantaneous femoral artery pressure-flow relations in supine anesthetized dogs and the effect of unilateral elevation of femoral venous pressure. Circ Res 1980; 47(1): 88–98. [DOI] [PubMed] [Google Scholar]
- 59. Yamamoto J, Trippodo NC, Ishise S, et al. Total vascular pressure-volume relationship in the conscious rat. Am J Physiol 1980; 238(6): H823–H828. [DOI] [PubMed] [Google Scholar]
- 60. Braakman R, Sipkema P, Westerhof N. Steady state and instantaneous pressure-flow relationships: characterisation of the canine abdominal periphery. Cardiovasc Res 1983; 17(10): 577–588. [DOI] [PubMed] [Google Scholar]
- 61. Ehrlich W, Baer RW, Paidipaty BB, et al. Instantaneous renal arterial pressure-flow relations in anesthetized dogs. Am J Physiol 1984; 246(5 Pt. 2): H702–H709. [DOI] [PubMed] [Google Scholar]
- 62. Shoukas AA, Brunner MJ, Frankle AE, et al. Carotid sinus baroreceptor reflex control and the role of autoregulation in the systemic and pulmonary arterial pressure-flow relationships of the dog. Circ Res 1984; 54(6): 674–682. [DOI] [PubMed] [Google Scholar]
- 63. Ogilvie RI, Zborowska-Sluis D, Tenaschuk B. Measurement of mean circulatory filling pressure and vascular compliance in domestic pigs. Am J Physiol 1990; 258(6 Pt. 2): H1925–H1932. [DOI] [PubMed] [Google Scholar]
- 64. Hiesmayr M, Jellinek H, Perger P, et al. Is there a systemic waterfall in humans? Evidence from haemodynamic measurements during artificial circulatory arrest. J Cardiothorac Vasc Anesth 1992; 6(1): 2. [Google Scholar]
- 65. Brunner MJ, Bishop GG, Shigemi K, et al. Arterial pressure-flow relationships in hypertensive dogs: effect of carotid sinus baroreflex. Am J Physiol 1993; 265(3Pt2): H986–H992. [DOI] [PubMed] [Google Scholar]
- 66. Urzua J, Meneses G, Fajardo C, et al. Arterial pressure-flow relationship in patients undergoing cardiopulmonary bypass. Anesth Analg 1997; 84(5): 958–963. [DOI] [PubMed] [Google Scholar]
- 67. Urzua J, Nunez G, Meneses G, et al. Hemodilution decreases critical closing pressure but does not increase the aortic to distal pressure gradient in dogs. IJA 1998; 3: 1. [Google Scholar]
- 68. Jellinek H, Krenn H, Oczenski W, et al. Influence of positive airway pressure on the pressure gradient for venous return in humans. J Appl Physiol 2000; 88(3): 926–932. [DOI] [PubMed] [Google Scholar]
- 69. Maas JJ, Pinsky MR, Geerts BF, et al. Estimation of mean systemic filling pressure in postoperative cardiac surgery patients with three methods. Intensive Care Med 2012; 38(9): 1452–1460. [DOI] [PMC free article] [PubMed] [Google Scholar]
- 70. Gaddis ML, Rothe CF, Tunin RS, et al. Mean circulatory filling pressure: potential problems with measurement. Am J Physiol 1986; 251(4 Pt. 2): H857–H862. [DOI] [PubMed] [Google Scholar]
- 71. Guyton AC, Polizo D, Armstrong GG. Mean circulatory filling pressure measured immediately after cessation of heart pumping. Am J Physiol 1954; 179(2): 261–267. [DOI] [PubMed] [Google Scholar]
- 72. Rodbard S, Hukushima Y. Letter: actual and non-waterfalls. Am J Physiol 1976; 230(3): 858–859. [DOI] [PubMed] [Google Scholar]
- 73. Badeer HS, Hicks JW. Hemodynamics of vascular ‘waterfall’: is the analogy justified? Respir Physiol 1992; 87(2): 205–217. [DOI] [PubMed] [Google Scholar]
- 74. Permutt S, Riley RL. Hemodynamics of collapsible vessels with tone: the vascular waterfall. J Appl Physiol 1963; 18: 924–932. [DOI] [PubMed] [Google Scholar]
- 75. Burton AC. On the physical equilibrium of small blood vessels. Am J Physiol 1951; 164(2): 319–329. [DOI] [PubMed] [Google Scholar]
- 76. Van Citters RL. Occlusion of lumina in small arterioles during vasoconstriction. Circ Res 1966; 18: 199–204. [Google Scholar]
- 77. Azuma T, Oka S. Mechanical equilibrium of blood vessel walls. Am J Physiol 1971; 221(5): 1310–1318. [DOI] [PubMed] [Google Scholar]
- 78. Alexander RS. Critical closure reexamined. Circ Res 1977; 40(6): 531–535. [DOI] [PubMed] [Google Scholar]
- 79. Burton AC, Yamada S. Relation between blood pressure and flow in the human forearm. J Appl Physiol 1951; 4(5): 329–339. [DOI] [PubMed] [Google Scholar]
- 80. Downey JM, Kirk ES. Inhibition of coronary blood flow by a vascular waterfall mechanism. Circ Res 1975; 36(6): 753–760. [DOI] [PubMed] [Google Scholar]
- 81. Olson RM. Instantaneous peripheral vascular resistance changes rendered by critical closing phenomenon. J Appl Physiol 1969; 26(5): 600–605. [DOI] [PubMed] [Google Scholar]
- 82. Braakman R, Sipkema P, Westerhof N. Two zero-flow pressure intercepts exist in autoregulating isolated skeletal muscle. Am J Physiol 1990; 258(6 Pt. 2): H1806–H1814. [DOI] [PubMed] [Google Scholar]
- 83. Permutt S, Bromberger-Barnea B, Bane HN. Alveolar pressure, pulmonary venous pressure, and the vascular waterfall. Med Thorac 1962; 19: 239–260. [DOI] [PubMed] [Google Scholar]
- 84. Van Dijk LC, Krams R, Sipkema P, et al. Changes in coronary pressure-flow relation after transition from blood to Tyrode perfusion. Am J Physiol 1988; 255(3 Pt. 2): H476–H482. [DOI] [PubMed] [Google Scholar]
- 85. Sutton DW, Schmid-Schonbein GW. Hemodynamics at low flow in resting vasodilated rat skeletal muscle. Am J Physiol 1989; 257(5 Pt. 2): H1419–H1427. [DOI] [PubMed] [Google Scholar]
- 86. Pribush A, Meiselman HJ, Meyerstein D, et al. Irregular changes in the structure of flowing blood at low flow conditions. Ann Biomed Eng 2009; 37(12): 2488. [DOI] [PubMed] [Google Scholar]
- 87. Eppihimer MJ, Lipowsky HH. Effects of leukocyte-capillary plugging on the resistance to flow in the microvasculature of cremaster muscle for normal and activated leukocytes. Microvasc Res 1996; 51(2): 187. [DOI] [PubMed] [Google Scholar]
- 88. Green HD, Lewis RN, Nickerson ND, et al. Blood flow, peripheral resistance and vascular tonus, with observations on the relationship between blood flow and cutaneous temperature. Am J Physiol 1944; 141(4): 518–536. [Google Scholar]
- 89. Spaan JA. Coronary diastolic pressure-flow relation and zero flow pressure explained on the basis of intramyocardial compliance. Circ Res 1985; 56(3): 293–309. [DOI] [PubMed] [Google Scholar]
- 90. Magder S. Starling resistor versus compliance: which explains the zero-flow pressure of a dynamic arterial pressure-flow relation? Circ Res 1990; 67(1): 209. [DOI] [PubMed] [Google Scholar]
- 91. Kirkeeide R, Puschmann S, Schaper W. Diastolic coronary pressure-flow relationships investigated by induced long-wave pressure oscillations. Basic Res Cardiol 1981; 76(5): 564–569. [DOI] [PubMed] [Google Scholar]
- 92. Van Houwelingen MJ, Barenbrug PJ, Hoeberigs MC, et al. The onset of ventricular isovolumic contraction as reflected in the carotid artery distension waveform. Ultrasound Med Biol 2007; 33(3): 371–378. [DOI] [PubMed] [Google Scholar]
- 93. Langewouters GJ, Wesseling KH, Goedhard WJ. The static elastic properties of 45 human thoracic and 20 abdominal aortas in vitro and the parameters of a new model. J Biomech 1984; 17(6): 425–435. [DOI] [PubMed] [Google Scholar]
- 94. Metting PJ, Kostrzewski KA, Stein PM, et al. Quantitative contribution of systemic vascular autoregulation in acute hypertension in conscious dogs. J Clin Invest 1989; 84(6): 1900–1905. [DOI] [PMC free article] [PubMed] [Google Scholar]
- 95. Transtrum MK, Machta BB, Brown KS, et al. Perspective: sloppiness and emergent theories in physics, biology, and beyond. J Chem Phys 2015; 143(1): 010901. [DOI] [PubMed] [Google Scholar]
- 96. Ruhe A. Fitting Empirical-Data by Positive Sums of Exponentials. Siam Journal on Scientific and Statistical Computing 1980; 1(4): 481–498. [Google Scholar]
- 97. Hughes AD, Davies JE, Parker KH. The importance of wave reflection: a comparison of wave intensity analysis and separation of pressure into forward and backward components. In: Annual international conference of the IEEE engineering in medicine and biology society, Osaka, Japan, 3–7 July 2013, pp.229–232. New York: IEEE. [DOI] [PMC free article] [PubMed] [Google Scholar]
- 98. Taylor MG. The input impedance of an assembly of randomly branching elastic tubes. Biophys J 1966; 6(1): 29–51. [DOI] [PMC free article] [PubMed] [Google Scholar]
- 99. Westerhof N, Westerhof BE. Wave transmission and reflection of waves ‘the myth is in their use’. Artery Res 2012; 6(1): 1–6. [Google Scholar]
- 100. Westerhof N, Westerhof BE. CrossTalk proposal: forward and backward pressure waves in the arterial system do represent reality. J Physiol 2013; 591(Pt. 5): 1167–1169; discussion 1177. [DOI] [PMC free article] [PubMed] [Google Scholar]
- 101. Sharman JE, Avolio AP, Baulmann J, et al. Validation of non-invasive central blood pressure devices: ARTERY Society task force consensus statement on protocol standardization. Eur Heart J 2017; 38(37): 2805–2812. [DOI] [PMC free article] [PubMed] [Google Scholar]
- 102. Phan TS, Li JK, Segers P, et al. Misinterpretation of the determinants of elevated forward wave amplitude inflates the role of the proximal aorta. J Am Heart Assoc 2016; 5(2): e003069. [DOI] [PMC free article] [PubMed] [Google Scholar]
- 103. Narayan O, Davies JE, Hughes AD, et al. Central aortic reservoir-wave analysis improves prediction of cardiovascular events in elderly hypertensives. Hypertension 2015; 65(3): 629–635. [DOI] [PMC free article] [PubMed] [Google Scholar]
- 104. Hametner B, Wassertheurer S, Hughes AD, et al. Reservoir and excess pressures predict cardiovascular events in high-risk patients. Int J Cardiol 2014; 171(1): 31–36. [DOI] [PubMed] [Google Scholar]
- 105. Davies JE, Lacy P, Tillin T, et al. Excess pressure integral predicts cardiovascular events independent of other risk factors in the conduit artery functional evaluation substudy of Anglo-Scandinavian cardiac outcomes trial. Hypertension 2014; 64(1): 60–68. [DOI] [PMC free article] [PubMed] [Google Scholar]
- 106. Behnam V, Rong J, Larson MG, et al. Windkessel measures derived from pressure waveforms only: the Framingham Heart Study. J Am Heart Assoc 2019; 8(14): e012300. [DOI] [PMC free article] [PubMed] [Google Scholar]
- 107. Huang JT, Cheng HM, Yu WC, et al. Value of excess pressure integral for predicting 15-year all-cause and cardiovascular mortalities in end-stage renal disease patients. J Am Heart Assoc 2017; 6(12): e006701. [DOI] [PMC free article] [PubMed] [Google Scholar]
- 108. Schneider A, Krauze T, Minczykowski A, et al. Arterial excess reservoir pressure integral as a predictor of cardiovascular complications in patients with acute coronary syndrome. Pol Arch Intern Med 2018; 128(4): 228–234. [DOI] [PubMed] [Google Scholar]
- 109. Fortier C, Cote G, Mac-Way F, et al. Prognostic value of carotid and radial artery reservoir-wave parameters in end-stage renal disease. J Am Heart Assoc 2019; 8(13): e012314. [DOI] [PMC free article] [PubMed] [Google Scholar]
- 110. Wang WT, Sung SH, Wang JJ, et al. Excess pressure integral predicts long-term all-cause mortality in stable heart failure patients. Am J Hypertens 2017; 30(3): 271–278. [DOI] [PubMed] [Google Scholar]
- 111. Cheng HM, Chuang SY, Wang JJ, et al. Prognostic significance of mechanical biomarkers derived from pulse wave analysis for predicting long-term cardiovascular mortality in two population-based cohorts. Int J Cardiol 2016; 215: 388–395. [DOI] [PMC free article] [PubMed] [Google Scholar]
Associated Data
This section collects any data citations, data availability statements, or supplementary materials included in this article.
Supplementary Materials
Supplemental material, Supplementary_data_1rev for The modified arterial reservoir: An update with consideration of asymptotic pressure (P∞) and zero-flow pressure (Pzf) by Alun D Hughes and Kim H Parker in Proceedings of the Institution of Mechanical Engineers, Part H: Journal of Engineering in Medicine