

Abstract

Despite a growing understanding of factors that drive monomer self-assembly to form supramolecular polymers, the effects of aromaticity gain have been largely ignored. Herein, we document the aromaticity gain in two different self-assembly modes of squaramide-based bolaamphiphiles. Importantly, O → S substitution in squaramide synthons resulted in supramolecular polymers with increased fiber flexibility and lower degrees of polymerization. Computations and spectroscopic experiments suggest that the oxo- and thiosquaramide bolaamphiphiles self-assemble into “head-to-tail” versus “stacked” arrangements, respectively. Computed energetic and magnetic criteria of aromaticity reveal that both modes of self-assembly increase the aromatic character of the squaramide synthons, giving rise to stronger intermolecular interactions in the resultant supramolecular polymer structures. These examples suggest that both hydrogen-bonding and stacking interactions can result in increased aromaticity upon self-assembly, highlighting its relevance in monomer design.
Introduction
Supramolecular polymers are endowed with unique properties, such as responsiveness and self-healing,1−3 due to the inherent dynamic nature of the noncovalent interactions they are based on, leading to numerous potential applications as biomedical materials, adhesives, inks, or personal care products.4−6 Noncovalent interactions, including hydrogen-bonding,7−12 π-stacking, solvophobicity, and van der Waals, are responsible for their self-assembly into hierarchical architectures through stacking or molecular recognition of polymeric precursors.13−20 Over the past years, the growing number of synthesized monomers has contributed significantly to the development of general design rules to facilitate monomer self-assembly in organic solvents and water. However, to further guide their rational design, it is necessary to understand factors that influence the strengths of competing noncovalent interactions either within a monomer or between them. Here, we demonstrate the impact of the combination of hydrogen bonding and stacking interactions with aromaticity gain on the mode of monomer self-assembly in a supramolecular polymer.
Recent works from Wu and Jackson and their co-workers demonstrated computationally21−23 and experimentally24 that aromaticity gain can significantly influence the intermolecular hydrogen-bonding abilities of heterocyclic, π-conjugated monomers. Hydrogen-bonding interactions are stronger than expected if they increase cyclic (4n + 2)π-electron delocalization (i.e., increase aromaticity) in the hydrogen-bonded heterocycles but are weaker if they reduce cyclic (4n + 2)π-electron delocalization (decrease aromaticity) in heterocycles.21,22,24 Such effects are especially pronounced when hydrogen-bonded assemblies of cyclic π-conjugated motifs are considered, as the effects of aromaticity gain in each of the synthon rings can add up to an astonishing overall aromatization of the self-assembled system.23 Concurrently, the Kieltyka group reported the self-assembly of a novel squaramide-based bolaamphiphile that takes advantage of an aromaticity gain to form robust supramolecular polymers in water.25 Squaramides26−29 are ditopic hydrogen-bonding synthons that can self-associate through two hydrogen-bond acceptors (C=O groups) and two hydrogen-bond donors (N–H groups) directly opposite one another on a cyclobutenedione ring. Upon hydrogen bonding at both ends simultaneously, the two C=O π-bonds and the two N lone pairs become polarized to give increased cyclic 2π-electron delocalization (4n + 2, n = 0) in the four-membered ring (Figure 1a). Evidence based on experiment and computations revealed that the reciprocal effects of hydrogen bonding and aromaticity intensify with the head-to-tail polymerization of squaramide-based bolaamphiphiles, further reinforcing these interactions.25
Figure 1.

(a) Hydrogen bonding increases the aromatic character in oxosquaramide; the resonance form on the right shows increased cyclic 2π-electron delocalization in the four-membered ring. (b) Carbonyls (C=O) typically form hydrogen bonds with small deviations from the lone-pair (xy) plane, but thiocarbonyls (C=S) can engage in hydrogen bonds with C=S···H angles of close to 90°. As a result, C=O- and C=S-containing synthons are expected to promote drastically different self-assembly modes. (c) Structures of the oxosquaramide (1a and 1b) and thiosquaramide (2a and 2b) bolaamphiphiles under study. Compounds 1a and 1b self-assemble into rigid fibers (top), while 2a and 2b self-assemble into short flexible rodlike structures (bottom). This disparity is attributed to the “head-to-tail” self-assembly of the oxosquaramides 1′ versus the “stacked” self-assembly of the thiosquaramides 2′.
Inspired by these results, we performed an O → S exchange of the carbonyl moieties to compare the effects of aromatic gain in monomers on the self-assembly of oxosquaramide-based bolaamphiphiles relative to their thiosquaramide counterparts. Thiosquaramides, with their enhanced acidity and lipophilicity compared to oxosquaramides,30 can potentially self-assemble in very different ways due to the unique supramolecular interactions enabled by their two thiocarbonyls. Thiocarbonyls are typically considered to be weaker hydrogen-bond acceptors compared to carbonyls,31 but they can engage in effective S···π interactions as well as less-directional hydrogen-bond interactions due to the more polarizable nature of the S lone pairs.32,33 Studies based on a survey of carbonyl- and thiocarbonyl-containing structures in the Cambridge Structural Database (CSD),34 for example, have shown that C=O···H hydrogen bonds generally exhibit small deviations (0° to 20°) from the lone-pair plane (i.e., the plane defined by the two sets of O lone pairs; see the xy plane in Figure 1b, top), while C=S···H interactions can deviate significantly from the lone-pair plane, displaying close to 90° lone-pair plane···H angles (see Figure 1b, bottom) because of the belt distribution of electrons on sulfur. Thus, C=S-containing synthons may give rise to drastically different self-assembled polymers compared to analogous C=O-containing synthons due to the oblique modes of contact they enable.35−37 Here, we show indeed that, upon O → S exchange, monomers of 1 and 2 self-assemble into supramolecular polymers with surprisingly different morphologies as a consequence of the self-assembly modes of the monomers: oxosquaramides 1 self-assemble “head-to-tail”, while thiosquaramides 2 “stack” on top of each other due to the wider range of angles permitted by sulfur to engage in C=S···H interactions (see the illustration of self-assembled N-methyloxosquaramides 1′ and N-methylthiosquaramides 2′ in Figure 1c).
In this study, we report computations and experiments to document the effects of aromaticity gain in the self-assembly of oxo- and thiosquaramide bolaamphiphiles. Despite the different three-dimensional arrangements of self-assembled oxo- versus thiosquaramide synthons, computations suggest that both modes of assembly enhance the aromatic character of the respective squaramide monomers, leading to stronger intermolecular interactions between them and resulting in distinct self-assemblies into their respective supramolecular polymers.
Results
Synthesis and Characterization of Squaramide-Based Bolaamphiphiles
The molecular design of the squaramide-based bolaamphiphiles 1 and 2 consists of two squaramide synthons embedded within a hydrophobic core of alkyl chains, surrounded by oligo(ethylene glycol)s to drive their nanophase segregation and one-dimensional self-assembly in water (see Figure 1c). In the original design of 1a,25 activation of the poly(ethylene glycol) by 1,1-carbonyldiimidazole was used to couple to the hydrophobic spacer because of its synthetic facility, but to eliminate any effects imparted by the formed carbamate on the self-assembly, an identical molecule bearing an ether between these domains was also synthesized and compared. The oxo-derivative lacking the carbamate moieties (1b) was prepared by an alternate synthetic protocol (Figure S1 and Materials and Methods, Supporting Information (SI)], resulting in moderate yields after reverse-phase column chromatography. Subsequently, thio-analogues 2a and 2b were prepared by reacting 1a and 1b, respectively, with a ∼30-fold excess of pentathiodiphosphorus(V) acid-P,P′-bis(pyridinium betaine) in acetonitrile at room temperature. Liquid chromatography/mass spectrometry (LC–MS) was used to determine the end point of the reaction, as extended reaction times resulted in decomposition of the amphiphiles. Notably, under these conditions selective thionation of the carbonyl groups of the squaramide moieties (Figure S2, SI) was achieved. This result is analogous to the selective conversion of different types of carbonyls achieved with Lawesson’s reagent at room temperature.38 Purification by preparative high-performance reverse-phase column chromatography (HPLC) required absence of acid in the mobile phase due to sensitivity of the thiosquaramide moiety, giving rise to the compounds in moderate yields (40% 2a, 47% 2b). Carbon-13 nuclear magnetic resonance (13C-NMR) showed a downfield shift of Δδ ≈ 20 ppm of the C=S of the thiosquaramide compared to the C=O signal, and a Δδ ≈ 2–4 ppm of the C=C within the cyclobutenedione ring (Figure S3, SI). The identity and purity of the synthesized compounds were confirmed by a combination of several characterization techniques, including 1H-NMR, 13C-NMR, LC–MS, HR-MS, and ATR-FTIR (see the Supporting Information).
Monomer 2 Forms Shorter and More Flexible Supramolecular Polymers Than 1 in Water
Cryogenic transmission electron microscopy (cryo-TEM) and small-angle X-ray scattering (SAXS) experiments probed the morphology and internal structure of the squaramide-based supramolecular polymers in water. These techniques revealed surprisingly different aggregate morphologies, suggestive of a dissimilar mode of self-assembly for oxosquaramides and thiosquaramides in their respective fibers. Both 1a and 1b resulted in high-aspect-ratio fibers with lengths of 235 ± 118 and 246 ± 176 nm, respectively [Figures 2a,b and S4 and S5 (SI)]. In contrast, the thionated 2a and 2b were 5–10 times shorter, displaying rodlike structures with lengths of 41 ± 18 and 24 ± 27 nm, respectively [Figures 2a,b and S4 and S5 (SI)], but showing a comparable critical aggregation concentration (1.41 × 10⁻⁵ M) (Figure S6, SI). The oxosquaramide supramolecular polymers (1a, 5.8 ± 1.2 nm; 1b, 5.7 ± 1.2 nm) were also slightly thicker than the thiosquaramide derivatives (2a, 4.8 ± 1.3 nm; 2b, 3.9 ± 1.1 nm) [Figures 2c and S5 (SI)]. Overall, by comparison of the molecules with and without the peripheral carbamates by cryo-TEM, these results suggest that the squaramide synthons are largely responsible for the observed self-assembled structures.
Figure 2.

(a) Cryo-TEM images of 1a (left) and 2a (right) in aqueous solution (580 μM) after overnight equilibration. Scale bar: 100 nm. (b) Histograms of length distributions of 1a (left) and 2a (right) (N = 50, with average lengths of 235 ± 118 nm for 1a and 41 ± 18 nm for 2a). (c) Histograms of width distributions of 1a (left) and 2a (right) (N = 50, with average widths of 5.8 ± 1.2 nm for 1a and 4.8 ± 1.3 nm for 2a). (d) End-to-end distance plots (⟨R2⟩) as a function of contour length for 1a (left) and 2a (right), respectively, determined by cryo-TEM (blue open circles). Least-square fits are shown as red lines. (e) Fiber contours of 1a (left) and 2a (right) analyzed from cryo-TEM images, where initial tangents were aligned (contour lengths of 252 ± 116 nm for 1a and 77 ± 17 nm for 2a).
Statistical analyses of the cryo-TEM images with respect to the shape fluctuations of the supramolecular polymer structures suggest that 1a forms long, rigid, high-aspect ratio fibers, while 2a forms short, semiflexible, rodlike structures. Tracking of the contour lengths of the fibrillar assemblies using Easyworm software39 provided values of 252 ± 116 nm for 1a and 77 ± 17 nm for 2a (Figure 2d,e). Figure 2d displays the mean square end-to-end distance ⟨R2⟩ plots as a function of the contour length for the fiber (1a) and rodlike (2a) structures, respectively. The persistence length (Pl), which quantifies the stiffness of a semiflexible polymer, was determined from the ⟨R2⟩ value by applying the wormlike chain model (WLC) (see the Supporting Information).39 Supramolecular polymers of 1a displayed much larger Pl values (581 ± 76 nm)39 compared to those of 2a (47 ± 4 nm), indicating different mechanical properties for the oxo- versus thiosquaramide analogues. From Pl, the bending rigidity of the assembly of 1a [(2.4 ± 0.3) × 10–27 N m2] was determined to be around 10-fold greater relative to that of 2a [(1.9 ± 0.2) × 10–28 N m2].
Light-scattering experiments provided further insight into the aggregates of the oxo- versus thiosquaramide-based monomers in solution. Static light scattering (SLS) measurements of monomers 1a and 2a (Figure S7, SI) were performed to compare their polymerization in water and their depolymerization with the addition of a “good” solvent such as CH3CN to water, using a H2O–CH3CN (6:4) solution. Scattered light intensities of supramolecular polymers of 1a and 2a indicated the presence of large objects in H2O. When 1a and 2a were dissolved in H2O–CH3CN (6:4), a large decrease in scattering intensity was recorded, consistent with the depolymerization of the squaramide-based supramolecular polymers through solvation of the bolaamphiphiles; this effect was less pronounced for 2a.
Small-angle X-ray scattering (SAXS) was performed to understand the morphology of the self-assembled aggregates. We previously found that self-assemblies of 1a display I ∝ q-1 scaling in the low-q regime (Figure 3a, blue line), which is characteristic of fiberlike objects.25 The data were modeled with a form factor for homogeneous cylinders, yielding a cross-sectional radius (rcs) of ∼3.4 nm. From this data, the cross-sectional mass per unit length (ML) of 1a was determined (Table S1, SI), yielding a comparable number of bolaamphiphiles within the cross-section as reported earlier by our group.25 Supramolecular polymers of 2a exhibit this characteristic I ∝ q-1 scaling at small q values (Figure 3a, green line), but they were better modeled with a form factor for semiflexible homogeneous cylinders, resulting in an rcs (∼2.3 nm) on par with cryo-TEM images. From the ML of 2a, approximately 10–14 bolaamphiphiles per nm (see Supporting Information) were determined to be within the fiber cross-section. SAXS measurements of 1b (once again I ∝ q-1) showed similar scattering profiles to 1a with the carbamate moiety, whereas 2b displayed a significantly reduced q-slope, indicating the coexistence of fiberlike and spherical morphologies (Figures S8 and S9, SI). Consequently, the morphological differences and monomer packing found within the cross-section of 1 versus 2 clearly suggest that the mode of monomer self-assembly is different for the oxo- and thiosquaramide analogues.
Figure 3.

(a) Experimental SAXS profiles of 1a and 2a (5 mg mL–1). The curves are modeled with a form factor for homogeneous and flexible homogeneous cylinders for 1a and 2a, respectively. The blue curve is shifted vertically by multiplying by a factor of 10 to enable comparison of the two profiles. (b) UV–vis spectra of 1a and 2a (c = 30 μM) in H2O (solid line) and H2O–CH3CN (6:4) (dotted line).
Self-Assembled Monomers 1 and 2 Show Dissimilar Spectroscopic Signatures in Water
Two absorption maxima at 257 and 330 nm were recorded for 1a in water, corresponding to its self-assembly into supramolecular polymers (Figure 3b, solid blue line). When a good solvent was added to 1a, the two maxima coalesce with an increase in absorbance at 293 nm (Figure 3b, dotted blue line). Conversely, the UV–vis spectrum of thiosquaramide analog 2a in water showed bands with maxima at 360 and 271 nm and a small shoulder around 420 nm (Figure 3b, solid green line). Moreover, irrespective of the concentration of 2a (c = 0.58–58.0 μM), the spectral profile was retained in water (Figure S10, SI). The effect of different solvents on the self-assembly of 2a was also examined (Figure S11, SI). Upon the addition of a good solvent, the band of 2a at 360 nm split into two, with a peak at 384 nm and a shoulder at 356 nm, while the band at 271 nm shifted slightly to 273 nm (Figure 3b, green dotted line). Similar trends were recorded in the UV–vis spectra of 2b. Hence, stark differences in the absorbance profiles observed for monomers 1a and 2a in the aggregated state point to a difference in their organization within the polymers.
Time-dependent density functional theory (TD-DFT) computations were performed to rationalize the spectral differences of the oxo- versus thio-monomers in water and in organic solvents. Two monomer models, N-methyloxosquaramide (1′) and N-methylthiosquaramide (2′), in both the head-to-tail and stacked arrangements were examined. UV absorption peaks for the isolated monomers and self-assembled hexamers of 1′ and 2′ in both arrangements were simulated in the 250 to 400 nm region and computed in implicit solvation with a low dielectric constant (ε < 20; see the Supporting Information) at the IEF-PCM-M06-2X/6-311+G(d,p) level, to model 1 and 2 in their polymerized and depolymerized states (see Table 1).
Table 1. Computed UV–Vis Absorptions (λmax, in nm) for the Monomers, Head-to-Tail Hexamers, and Stacked Hexamers of 1′ and 2′ in Implicit Solvation in a Low-Dielectric Solvent at IEF-PCM-M06-2X/6-311+G(d,p)a.
| 1′ (oxo) | 2′ (thio) | |
|---|---|---|
| monomer | 263.3 (0.53) | 350.4 (0.45) |
| 263.1 (0.36) | 339.1 (0.36) | |
| head-to-tail (n = 6) | 278.9 (3.05) | 351.9 (3.42) |
| 258.2 (2.47) | 337.8 (1.96) | |
| stacked (n = 6) | 258.0 (1.16) | 344.6 (0.94) |
| 251.5 (1.43) | 342.3 (0.98) |
Only transitions with oscillator strengths >0.35 are listed (actual value in parentheses).
Computed UV spectra of the monomer, head-to-tail hexamer, and stacked hexamer of 1′ suggest that oxosquaramide synthons self-assemble through a head-to-tail mode in water and depolymerize in low-dielectric solvents. The computed UV spectrum of the head-to-tail 1′ hexamer shows two largely separated peaks at 258.2 and 278.9 nm, corresponding to the HOMO → LUMO+1 and HOMO → LUMO transitions of neighboring monomers. In the computed spectrum of the monomer, these peaks coalesce and appear at 263.3 and 263.1 nm, respectively. In sharp contrast, the computed UV spectra of the monomer, head-to-tail hexamer, and stacked hexamer of 2′ suggest that thiosquaramide synthons self-assemble in water through a stacked mode. The computed UV spectrum of the stacked hexamer shows two closely separated peaks at 342.3 and 344.6 nm, corresponding to the HOMO → LUMO+1 and HOMO → LUMO transitions of neighboring monomers. In the computed spectrum of the monomer, these peaks respectively split to 339.1 and 350.4 nm. These computed results are consistent with the experimentally obtained UV–vis spectra for 1a and 2a in water and H2O–CH3CN (6:4) (Figure 3b). For comparison, the computed UV results of the alternate self-assembly modes, i.e., stacked for 1′ and head-to-tail for 2′, did not correlate with the experimentally observed trends (see the data in Table 1). Hence, the distinct UV–vis spectra recorded experimentally for 1a and 2a correlate well with head-to-tail and stacked modes, respectively, as computed by TD-DFT.
The observed spectral shifts of 1a and 2a in the polymerized and depolymerized forms can be further rationalized by the exciton theory of Kasha et al.40 Computed transition dipole moments for the HOMO–LUMO and HOMO–LUMO+1 transitions in 1′ and 2′ revealed one to be parallel and the other perpendicular to the C2 symmetry axis of the (thio)squaramide ring (Figure 4). In the computed (1′) and experimental (1a) UV–vis spectra, the simultaneous blue- and red-shifting of the squaramide bands upon its polymerization is consistent with the in-line and parallel alignment of the transition dipole moments within the squaramide units, giving rise to the concomitant formation of H- and J-bands. In the case of 2′ and 2a, supramolecular polymerization results in a blue-shift of the monomer absorbance spectra that can be ascribed to the formation of an H-type aggregate with a parallel arrangement of transition dipole moments, suggesting a cofacial orientation of the thiosquaramide units. Moreover, the weak red-shifted shoulder observed experimentally at 420 nm is consistent with other supramolecular polymers involving stacked chromophores that exhibit a rotational offset in the aggregated state.41
Figure 4.

Orbital interactions of neighboring monomers in HOMO–LUMO and HOMO–LUMO+1 transitions for (a) head-to-tail (for 1′) and (b) stacked (for 2′) arrangements. The direction and magnitude of the computed transition dipole moments for each transition are indicated.
An alternative explanation for the observed shifts in the absorbance spectra results from analyzing the symmetry of the π-orbitals involved in the UV transitions. In the head-to-tail hexamer of 1′, the HOMO and LUMO orbitals of neighboring monomers are out-of-phase, and thus, disrupting this disfavored interaction leads to a red-shifted HOMO → LUMO transition (the peak at 258.2 nm shifts to 263.3 nm) upon disassembly. The HOMO and LUMO+1 orbitals of neighboring monomers are in-phase, and thus, disrupting this bonding interaction leads to a blue-shifted HOMO → LUMO+1 transition (the peak at 278.9 nm shifts to 263.1 nm) upon disassembly (Figure 4a). Overall, the net effect is the coalescing of two peaks upon depolymerization of an oxo-polymer.
In the stacked hexamer of 2′, the HOMO and LUMO orbitals of neighboring monomers are out-of-phase, and thus, disrupting this disfavored interaction leads to a dominant red-shifted HOMO → LUMO transition (the peak at 344.6 nm shifts to 350.3 nm) on disassembly. The HOMO and LUMO+1 orbitals of neighboring monomers have mixed in-phase and out-of-phase interactions, so the absorption shows a negligible shift upon disassembly (the peak at 342.3 nm shifts to 339.1 nm) (Figure 4b). Overall, the net effect is the splitting of two coalescing peaks upon depolymerization of the thio-polymer.
To unravel the supramolecular polymerization mechanism, a cosolvent approach was taken to denature the self-assemblies of 1a and 2a. Changes in the absorption spectra of 1a and 2a (c = 15–40 μM) (Figures 5, S12) in water were monitored by titrating the respective monomers at the same concentration in CH3CN. The degree of aggregation (αagg) was plotted as a function of the solvent volume fraction for each monomer to determine thermodynamic parameters when fit with the solvent denaturation model as reported by de Greef, Meijer and co-workers.42 The depolymerization of 1a and 2a was observed at different solvent compositions: while the disappearance of the band at 330 nm for 1a required less CH3CN (24.5 vol %), the appearance of the band at 384 nm for 2a required more (33.3 vol %).
Figure 5.
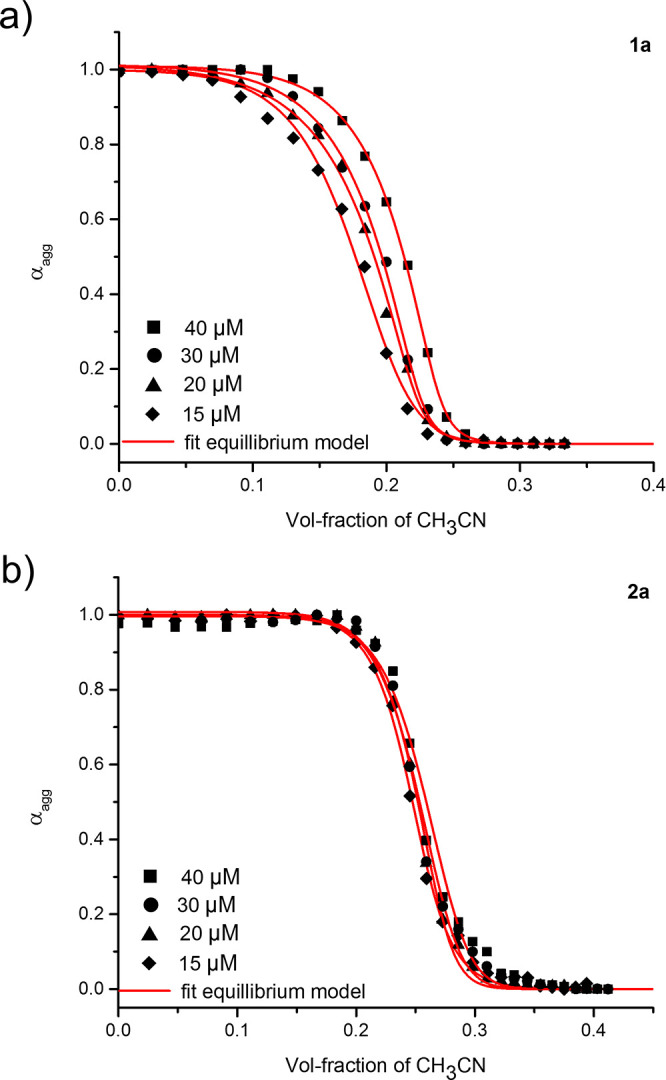
The degree of aggregation (αagg) plotted as a function of the volume fraction of CH3CN as determined from UV–vis denaturation experiments for 1a (a) at λ = 330 nm and 2a (b) at λ = 384 nm. Data for the various monomer concentrations (c = 15–40 μM) were fit with the equilibrium model. Spectral data can be found in the Supporting Information.
Furthermore, titrations of 1a revealed a cooperative process (cooperativity parameter σ = 0.013) with a nonsigmoidal profile, whereas a greater than an order of magnitude larger cooperativity parameter (σ = 0.610) was determined for 2a, indicating a substantially less cooperative supramolecular polymerization (Table S2, SI). In line with the relative amounts of CH3CN to denature the assemblies, a more-negative ΔG° was obtained for 2a (−57.9 kJ mol–1) in comparison to 1a (−40.2 kJ mol–1). Hence, the supramolecular polymers formed from 2a are more stable than those of 1a, likely due to their increased hydrophobicity and stacking tendency; however, the lesser degree of cooperativity of their polymerization points to a difference in the noncovalent interactions responsible for their formation. The less-directional and weaker hydrogen-bonding interaction afforded by the thiosquaramide and its stacking preference promote the self-assembly of 2a in a less cooperative manner, forming shorter fibers with a decreased persistence length. This result is in contrast to 1a, for which head-to-tail hydrogen bonding is key to its cooperative aggregation that enables the formation of long and rigid fibers.
Fourier transform infrared (FTIR) spectra were obtained for 1a and 2a in D2O and D2O–CD3CN (6:4) to probe the role of hydrogen-bonding interactions in the self-assembly of the oxo- and thiosquaramide monomers. In D2O, 1a showed C=O stretches from the squaramide (1645 cm–1) and carbamate (1693 cm–1) moieties, a small broad ring breathing band (1799 cm–1), and an N–H stretch from the squaramide (3158 cm–1) (Figure 6, blue). When 1a was dissolved in D2O–CD3CN (6:4), the C=O bands were shifted to lower (1641 cm–1) and higher (1698 cm–1) wavenumbers, respectively, while the ring breathing band appeared at a lower wavenumber (1794 cm–1). The N–H stretch was shifted to higher wavenumbers (3166 cm–1), consistent with a decrease in hydrogen bonding between the monomers (Figure S13, SI). In D2O, 2a showed a C=O stretch for the carbamate moiety (1687 cm–1) and an intense ring breathing band (1727 cm–1) (Figure 6, green). Additionally, the N–H stretch of 2a was red-shifted (3140 cm–1) and higher in intensity in comparison to that of 1a, congruent with hydrogen bonding of the N–H groups of thiosquaramide. When 2a was dissolved in D2O–CD3CN (6:4), the C=O band of the carbamate group shifted to a higher wavenumber (1698 cm–1), whereas the intense ring breathing band appeared at a lower wavenumber (1720 cm–1) than in the D2O spectra. The N–H stretch moved to a lower wavenumber (3136 cm–1) and the intensity of the peak intensity was maintained (Figure S14, SI).
Figure 6.

IR spectrum recorded in the N–H region (inset) and amide I and amide II regions in D2O for both 1a and 2a (5.8 mM).
These results suggest that hydrogen bonds are retained with the addition of a good solvent and is consistent with LS data showing less depolymerization of 2a compared to 1a. Similar trends were also observed for 1b and 2b (as well as 1a and 2a) in the solid state (Figures S15 and S16, SI), with removal of the carbamate moiety resulting in the loss of the NH stretch in the range of 3300 cm–1 for both monomers. Notably, the relatively narrow N–H stretch band of 2a would suggest the symmetrical participation of both thiosquaramide NH groups in hydrogen bond interactions on self-assembly. Collectively, the solution-phase IR results suggest that both 1 and 2 engage in hydrogen bond interactions upon self-assembly through the squaramide moiety.
Solid-State NMR Studies Support a Distinct Packing Mode of Monomers 1 and 2 in Their Aggregated States
To provide a more comprehensive molecular picture of the self-assembly of both monomers 1a and 2a, solid-state NMR experiments in their aggregated and depolymerized states were performed. Monomers dried from H2O were used to probe their aggregated structures, whereas samples dried from H2O–CH3CN (6:4) were used to examine the depolymerized state as in the aforementioned experiments. 1D 13C–CPMAS experiments of 1a in both states showed nearly the same set of NMR peaks (Figures S17 and S18, SI), with the quaternary carbons of the C=O bond of squaramide at 181 ppm, the C=C bond of the squaramide at 166 ppm, and the C=O of the carbamate at 157 ppm. Signals between 70 and 75 ppm were ascribed to the carbons within the oligo(ethylene glycol) chain, and those between 29 and 69 ppm were assigned to the aliphatic chains on both sides of the squaramide. In the case of 2a, similar 1D spectra were obtained for the two states. Signals for oligo(ethylene glycols), aliphatic chains, and carbamate C=O were found at similar chemical shift ranges; however, distinct signals were observed for carbons in the thiosquaramide ring (Figures S19 and S20, SI). The C=C bond of squaramide was assigned to the peak at 170 ppm, and a broad signal was found for the C=S bonds at 199 ppm, significantly deshielded in comparison to that of the C=O bond on squaramide.
To further deconvolute the self-assembly modes of 1a and 2a, 2D 1H–13C heteronuclear correlation (HETCOR) experiments were collected in both states [Figures 7 and S21 (SI)]. Contact times between 250 μs and 5 ms (Figures S21 and S22, SI) were examined to probe the magnetization transfer intra- and intermolecularly. At longer contact times, above 2 ms, signals from the carbons of the squaramide and carbamate became apparent. Extensive aggregation of 1a in the solid state resulted in several cross-peaks between the squaramide carbons and flanking protons on the nearby aliphatic chains not observed in the depolymerized sample [Figure 7a, boxed areas, and Figure S21a (SI)] or at shorter contact times (250 μs), pointing to interactions between monomers. Importantly, a cross-peak was observed between the NH protons and C=O and C=C carbons, confirming the head-to-tail hydrogen-bonding mode between oxosquaramide monomers (Figure 7a, red and blue circles). In sharp contrast, for 2a with the same contact time (2 ms), C=S carbon and NH proton cross-peaks were absent for polymers in both conditions (Figure 7b), and cross-peaks with protons flanking squaramide were not detected. The lack of the C=S and NH cross-peaks is in contrast to FTIR data that suggest a hydrogen bond interaction in the thiosquaramide moiety; however, such interactions were previously undetected by the HETCOR technique in hydrogen-bonded thiobarbituric acids.43 Moreover, the absence of cross-peaks of the C=C carbons of thiosquaramide with other parts of the monomer as observed for oxosquaramide can also point to a less regular aggregate structure. This interpretation would be in line with the low persistence length of the fibers of 2a and the lesser degree of cooperativity in their supramolecular polymerization, as determined from solvent denaturation experiments. Cumulatively, the differences in the 2D 1H–13C HETCOR solid-state NMR spectra point to a distinctive internal organization of the monomers within the fibers having an impact on the polymer morphology, as observed by cryo-EM and scattering methods.
Figure 7.

1H–13C HETCOR experiments performed at a contact time of 2048 μs on 1a (a) and 2a (b) in their polymerized (H2O) form. Highlighted areas are described in the text.
Computational Studies of Head-to-Tail versus Stacked Arrangements of Self-Assembled Oxo- and Thiosquaramides
Density functional theory (DFT) computations of the head-to-tail and stacked hexamers of 1′ and 2′ were carried out to examine the competition between the different self-assembly modes. Single-point energy calculations at the IEF-PCM-M06-2X/6-311+G(d,p) level (see Materials and Methods, SI) reveal a more-negative averaged interaction energy (ΔEint) for the head-to-tail 1′ hexamer (−37.5 kJ/mol) compared to that of the stacked 1′ hexamer (−32.5 kJ/mol), indicating that the head-to-tail mode is favored for 1′. Conversely, the computed averaged ΔEint for the head-to-tail 2′ hexamer (−32.0 kJ/mol) was significantly lower relative to that of the stacked 2′ hexamer (−47.6 kJ/mol), suggesting a dominant stacking mode for 2′. Computed interaction energies in the gas phase corrected for basis set superimposition error (BSSE) show the same trend and are included in Table S3 (SI).
Accordingly, computed electron density difference (EDD) maps for the head-to-tail vs stacked dimers of 1′ and 2′ show that C=O’s form effective hydrogen-bonding interactions with N–H’s in the O lone-pair plane, but C=S’s form stronger interactions with the N–H’s at roughly 90° angles to the S lone-pair plane. As shown in Figure 8a (top), EDD maps for the head-to-tail 1′ and 2′ dimers show increased electron density at the O/S’s (indicated in red, electron density gain) and decreased electron density at the amine H’s (indicated in blue, electron density loss); as expected by the stronger hydrogen-bond-acceptor ability of C=O, the head-to-tail 1′ dimer displays greater electron density change. In Figure 8a (bottom), EDD maps of the stacked 1′ and 2′ dimers also show increased electron density at the O/S’s (in red) and decreased electron density at the general N–H region (in blue), suggestive of attractive noncovalent interactions between the stacks. The much greater electron density change for the stacked 2′ dimer is consistent with the ability of C=S to engage in less directional hydrogen bond interactions.32,33 These findings further support that differences in the physical properties and spectroscopic features of the supramolecular polymers of oxosquaramide versus thiosquaramide bolaamphiphiles likely arise from their preferred self-assembly modes.
Figure 8.

(a) Computed electron density difference (EDD) maps for the head-to-tail 1′ and 2′ dimers (note the larger lobes on 1′), as well as stacked 1′ and 2′ dimers (note the larger lobes on 2′). (b) Electrostatic potential maps (MEP) of 1′ and 2′ monomers (blue indicates electron density loss and positively charged; red indicates electron density gain and negatively charged).
Even though monomers of thiosquaramides can also assemble through a head-to-tail mode, the stacked mode is much preferred, because the electron distribution on the S atom is anisotropic. As shown in Figure 8b, the computed electrostatic potential map (MEP) of the 2′ monomer reveals positively charged regions at the back end of the two C–S bonds, indicating the presence of a σ-hole (note the electron-rich periphery above and below the σ-hole). For this reason, a bonding interaction at a near 90° angle to the C–S bond is preferred, supporting a dominant stacked arrangement of self-assembled thiosquaramides. Moreover, computed NBO E2PERT analyses at the B3LYP-D3/6-31+G(d) level reveal minimal S lp (lone pair) → NH σ* (0.25 kJ/mol) and N lp → C=S σ* (0.29 kJ/mol) interaction energies, suggesting negligible orbital interactions between the N–H and C=S groups of neighboring stacked thiosquaramides. These results, along with the computed MEP map for the stacked thiosquaramide dimer, suggest that the stacking interactions between thiosquaramide monomers are mostly electrostatic (i.e., between the positively charged H’s of the N–H groups and the negative region of the S atoms).
Computational Studies of Aromaticity Gain in Oxo- and Thiosquaramide Supramolecular Polymers
Computed geometries for the monomers and hexamers of 1′ and 2′ at the IEF-PCM-B3LYP-D3/6-31+G(d) level (Figures S23–S26 and Table S8, SI) show that the ring bonds of 1′ [Figures 9 and S23, left, values in bold font (SI)] become more bond length equalized (i.e., increased aromatic character) upon self-assembly in the head-to-tail 1′ hexamer (values in italic font); all of the single bonds shorten (by 0.005–0.018 Å) and the double bonds lengthen (by 0.009–0.013 Å). In contrast, the ring bonds of 2′ [Figures 9 and S23, right, values in bold font (SI)] are altered to a lesser degree upon self-assembly in the stacked 2′ hexamer (values in italic font); the two C–N bonds shorten (by 0.004 Å) and the ring C=C bond lengthens (by 0.004 Å), but the C–C and C=S bonds exhibit little to no change (a 0–0.003 Å change).
Figure 9.

Computed geometries in implicit solvation for the isolated monomers of 1′ and 2′ (bond distances in angstroms, values in bold font), the head-to-tail hexamer of 1′ (left, averaged bond distances for each of the monomeric units, values in italic font), and the stacked hexamer of 2′ (right, averaged bond distances for each of the monomeric units, values in italic font).
Harmonic oscillator model of electron delocalization (HOMED) analyses44 confirm these observations, showing increased HOMED values when 1′ (0.329, HOMED value for isolated monomer) self-assembles into the head-to-tail 1′ hexamer (0.383, averaged HOMED values for six monomer units), while those of 2′ (0.447, isolated monomer) and the stacked 2′ hexamer (0.445, average for six monomer units) stay close. HOMED values range from 0 (nonaromatic) to 1 (fully aromatic compounds) and measure the degree of ring bond equalization in molecules as a criterion for aromaticity (see Tables S4 and S5, SI). These computed parameters suggest that the geometries of oxo- and thiosquaramides change in distinct ways upon monomer self-assembly.
Computations based on the magnetic and energetic criteria of aromaticity revealed a significant aromaticity gain in both the head-to-tail self-assembled monomers of 1′ and the stacked monomers of 2′. Isotropic nucleus independent chemical shifts (NICS)45,46 were computed at 0.6 Å above each of the head-to-tail 1′ ring centers and at 0.8 Å above each of the stacked 2′ ring centers (due to the more diffuse orbitals of the S atoms) to quantify the magnetic effects of the aromaticity gain. As shown in the Table S6 (SI), the computed isotropic NICS for both 1′ [NICS(0.6) = −7.0 ppm] and 2′ [NICS(0.8) = −3.7 ppm] become more negative in the head-to-tail 1′ hexamer [NICS(0.6) = −6.7 to −7.3 ppm] and stacked 2′ hexamer [NICS(0.8) = −3.2 to −4.6 ppm], documenting the aromaticity gain in both monomers upon self-assembly.
Block-localized wave function (BLW) analyses47 quantified the energetic effects of the aromaticity gain in the head-to-tail hexamer of 1′ and the stacked hexamer of 2′ (see Table S7, SI). The BLW method, the simplest variant of valence bond calculations, measures π-electron delocalization energies (DEπ) in molecules by comparing the energy of the fully delocalized wave function (Ψdeloc) of a molecule to that of its hypothetical π-electron localized wave function (Ψloc) in which all π-electron delocalization effects are “turned off”: DEπ = Ψdeloc – Ψloc (i.e., a more negative DEπ value indicates more π-electron delocalization in a molecule). The computed DEπ difference between the isolated monomers (e.g., 1′ and 2′) versus head-to-tail or stacked monomers provides a measure of the extra gain in π-electron delocalization in monomers upon self-assembly; ΔDEπ = DEπ(head-to-tail or stacked monomer) – DEπ(monomer) (i.e., a more negative ΔDEπ value indicates more π-conjugation gain upon head-to-tail or stacked assembly of the monomer). Large negative ΔDEπ values suggest enhanced aromatic character in the self-assembled monomer (see the Supporting Information).
Remarkably, the computed ΔDEπ values for each of the monomers in the head-to-tail 1′ hexamer (averaged ΔDEπ = −115.0 kJ/mol) and the stacked 2′ hexamer (averaged ΔDEπ = −86.2 kJ/mol) are large and negative, suggesting significant aromaticity gain upon self-assembly (see Table S3 of the SI for more details). These computations suggest that in low-dielectric environments, such as in the hydrophobic core of a supramolecular polymer, the aromaticity gain can be considered as an important driving force when combined with noncovalent bonding to direct the self-assembly of supramolecular polymers.
Discussion and Conclusion
In this report, we demonstrate that oxosquaramide and thiosquaramide monomers self-assemble into surprisingly different fibrillar morphologies in water: oxosquaramide-based bolaamphiphiles form long, rigid, fibrillar architectures, while the thio-analogues form short, flexible, rodlike structures. Evidence based on spectroscopic measurements and computational analyses revealed that oxosquaramides self-assemble into a head-to-tail arrangement by aligning their hydrogen-bond donors (N–H’s) and acceptors (C=O’s) along the squaramide ring plane. On the other hand, thiosquaramides prefer antiparallel stacked configurations, in which the N–H’s of each unit are stacked above and below the C=S’s of adjacent layers, resulting in interactions at a C=S···H angle close to 90°. The head-to-tail hydrogen bonding in oxosquaramides facilitates supramolecular polymerization by a cooperative mechanism to form long and rigid polymers, while the stacked interaction of the thiosquaramides results in a decrease of the length and stiffness of the aggregates, on par with their polymerization in a less cooperative fashion. IR measurements of the self-assembled oxo- and thiosquaramides show peaks consistent with the hydrogen bonding of the squaramide moieties, with the head-to-tail hydrogen-bonding mode being supported by solid-state NMR studies for oxosquaramide. Moreover, computations revealed that polarization of monomers in both the head-to-tail and stacked self-assembly modes can increase the aromatic character of squaramide synthons. These findings further suggest that changes in the aromatic characters of synthons22 can be used to “fine-tune” the intermolecular interactions between monomers, with potent effects on their mode of supramolecular polymerization. We emphasize that, beside the often-used checklist for controlling noncovalent interactions relevant for self-assembly, aromaticity gain should also be considered in the molecular design of monomers, as well as more broadly in supramolecular chemistry.
Acknowledgments
We would like to thank T. Sharp, R. I. Koning, and B. Koster for assistance with cryo-TEM experiments; L. C. Gascoigne for SLS measurements; G. Fernández, K. Kartha, W. E. M. Noteborn, and A. Kros for fruitful discussions; and R. Das for computing the electron density difference maps. I.K.V. (NWO ECHO-STIP Grant 717.013.005, NWO VIDI Grant 723.014.006) and R.E.K. (NWO-ECHO-STIP Grant 717.014.005, NWO-VENI Grant 722.012.011) acknowledge The Netherlands Organization for Scientific Research (NWO) for funding. J.I.W. thanks the National Science Foundation (NSF) (CHE-1751370) and the National Institute of General Medical Sciences (NIGMS) of the National Institute of Health (R35GM133548) for grant support, as well as computational resources provided by the uHPC cluster, managed by the University of Houston and acquired through support from the NSF (MRI-1531814).
Supporting Information Available
The Supporting Information is available free of charge at https://pubs.acs.org/doi/10.1021/jacs.0c02081.
Materials and Methods, synthetic procedures, solution and solid-state NMR spectra, cryoTEM imaging, light scattering experiments, UV-Vis spectroscopy, solution and solid-state IR spectroscopy, DFT-computed geometries, NICS analysis, BLW computation, Cartesian coordinates of optimized geometries (Figures S1–S26 and Tables S1–S8) (PDF)
Author Present Address
# Triskelion B.V., P.O. Box 844, 3700 AV Zeist, The Netherlands
The authors declare no competing financial interest.
Supplementary Material
References
- Aida T.; Meijer E. W.; Stupp S. I. Science 2012, 335 (6070), 813–817. 10.1126/science.1205962. [DOI] [PMC free article] [PubMed] [Google Scholar]
- Appel E. A.; del Barrio J.; Loh X. J.; Scherman O. A. Chem. Soc. Rev. 2012, 41 (18), 6195–6214. 10.1039/c2cs35264h. [DOI] [PubMed] [Google Scholar]
- Krieg E.; Bastings M. M. C.; Besenius P.; Rybtchinski B. Chem. Rev. 2016, 116 (4), 2414–2477. 10.1021/acs.chemrev.5b00369. [DOI] [PubMed] [Google Scholar]
- De Greef T. F. A.; Meijer E. W. Nature 2008, 453 (May), 7192. 10.1038/453171a. [DOI] [PubMed] [Google Scholar]
- Goor O. J. G. M.; Hendrikse S. I. S.; Dankers P. Y. W.; Meijer E. W. Chem. Soc. Rev. 2017, 46 (21), 6621–6637. 10.1039/C7CS00564D. [DOI] [PubMed] [Google Scholar]
- Webber M. J.; Appel E. A.; Meijer E. W.; Langer R. Nat. Mater. 2016, 15 (1), 13–26. 10.1038/nmat4474. [DOI] [PubMed] [Google Scholar]
- Endo M.; Fukui T.; Jung S. H.; Yagai S.; Takeuchi M.; Sugiyasu K. J. Am. Chem. Soc. 2016, 138 (43), 14347–14353. 10.1021/jacs.6b08145. [DOI] [PubMed] [Google Scholar]
- Philips D. S.; Kartha K. K.; Politi A. T.; Krüger T.; Albuquerque R. Q.; Fernández G. Angew. Chem., Int. Ed. 2019, 58 (14), 4732–4736. 10.1002/anie.201813955. [DOI] [PMC free article] [PubMed] [Google Scholar]
- Aratsu K.; Takeya R.; Pauw B. R.; Hollamby M. J.; Kitamoto Y.; Shimizu N.; Takagi H.; Haruki R.; Adachi S.; Yagai S. Nat. Commun. 2020, 11 (1), 1623. 10.1038/s41467-020-15422-6. [DOI] [PMC free article] [PubMed] [Google Scholar]
- Sikder A.; Ghosh S. Mater. Chem. Front. 2019, 3 (12), 2602–2616. 10.1039/C9QM00473D. [DOI] [Google Scholar]
- Han S.; Pensec S.; Yilmaz D.; Lorthioir C.; Jestin J.; Guigner J.-M.; Niepceron F.; Rieger J.; Stoffelbach F.; Nicol E.; Colombani O.; Bouteiller L. Nat. Commun. 2020, 11 (1), 4760. 10.1038/s41467-020-18587-2. [DOI] [PMC free article] [PubMed] [Google Scholar]
- Sikder A.; Ray D.; Aswal V. K.; Ghosh S. Angew. Chem., Int. Ed. 2019, 58 (6), 1606–1611. 10.1002/anie.201812217. [DOI] [PubMed] [Google Scholar]
- Das G.; Thirumalai R.; Vedhanarayanan B.; Praveen V. K.; Ajayaghosh A. Adv. Opt. Mater. 2020, 8 (14), 2000173. 10.1002/adom.202000173. [DOI] [Google Scholar]
- Jalani K.; Dhiman S.; Jain A.; George S. J. Chem. Sci. 2017, 8 (9), 6030–6036. 10.1039/C7SC01730H. [DOI] [PMC free article] [PubMed] [Google Scholar]
- Markiewicz G.; Smulders M. M. J.; Stefankiewicz A. R. Adv. Sci. 2019, 6 (16), 1900577. 10.1002/advs.201900577. [DOI] [PMC free article] [PubMed] [Google Scholar]
- Pramanik P.; Ray D.; Aswal V. K.; Ghosh S. Angew. Chem., Int. Ed. 2017, 56 (13), 3516–3520. 10.1002/anie.201611715. [DOI] [PubMed] [Google Scholar]
- VandenBerg M. A.; Sahoo J. K.; Zou L.; McCarthy W.; Webber M. J. ACS Nano 2020, 14 (5), 5491–5505. 10.1021/acsnano.9b09610. [DOI] [PubMed] [Google Scholar]
- Helmers I.; Shen B.; Kartha K. K.; Albuquerque R. Q.; Lee M.; Fernández G. Angew. Chem., Int. Ed. 2020, 59 (14), 5675–5682. 10.1002/anie.201911531. [DOI] [PMC free article] [PubMed] [Google Scholar]
- Vantomme G.; ter Huurne G. M.; Kulkarni C.; ten Eikelder H. M. M.; Markvoort A. J.; Palmans A. R. A.; Meijer E. W. J. Am. Chem. Soc. 2019, 141 (45), 18278–18285. 10.1021/jacs.9b09443. [DOI] [PMC free article] [PubMed] [Google Scholar]
- Krieg E.; Weissman H.; Shimoni E.; Bar On (Ustinov) A.; Rybtchinski B. J. Am. Chem. Soc. 2014, 136 (26), 9443–9452. 10.1021/ja503906p. [DOI] [PubMed] [Google Scholar]
- Wu J. I.; Jackson J. E.; Schleyer P. V. R. J. Am. Chem. Soc. 2014, 136 (39), 13526–13529. 10.1021/ja507202f. [DOI] [PubMed] [Google Scholar]
- Kakeshpour T.; Wu J. I.; Jackson J. E. J. Am. Chem. Soc. 2016, 138 (10), 3427–3432. 10.1021/jacs.5b12703. [DOI] [PubMed] [Google Scholar]
- Anand M.; Fernández I.; Schaefer H. F.; Wu J. I. C. J. Comput. Chem. 2016, 37 (1), 59–63. 10.1002/jcc.23976. [DOI] [PubMed] [Google Scholar]
- Kakeshpour T.; Bailey J. P.; Jenner M. R.; Howell D. E.; Staples R. J.; Holmes D.; Wu J. I.; Jackson J. E. Angew. Chem., Int. Ed. 2017, 56 (33), 9842–9846. 10.1002/anie.201705023. [DOI] [PubMed] [Google Scholar]
- Saez Talens V.; Englebienne P.; Trinh T. T.; Noteborn W. E. M.; Voets I. K.; Kieltyka R. E. Angew. Chem., Int. Ed. 2015, 54 (36), 10502–10506. 10.1002/anie.201503905. [DOI] [PubMed] [Google Scholar]
- Soberats B.; Martínez L.; Sanna E.; Sampedro A.; Rotger C.; Costa A. Chem. - Eur. J. 2012, 18 (24), 7533–7542. 10.1002/chem.201103345. [DOI] [PubMed] [Google Scholar]
- Marchetti L. A.; Kumawat L.; Mao N.; Stephens J. C.; Elmes R. Chem. 2019, 5, 1398–1485. 10.1016/j.chempr.2019.02.027. [DOI] [Google Scholar]
- Quiñonero D.; Prohens R.; Garau C.; Frontera A.; Ballester P.; Costa A.; Deyà P. M. Chem. Phys. Lett. 2002, 351 (1–2), 115–120. 10.1016/S0009-2614(01)01295-7. [DOI] [Google Scholar]
- Bujosa S.; Castellanos E.; Frontera A.; Rotger C.; Costa A.; Soberats B. Org. Biomol. Chem. 2020, 18 (5), 888–894. 10.1039/C9OB02085C. [DOI] [PubMed] [Google Scholar]
- Busschaert N.; Elmes R. B. P.; Czech D. D.; Wu X.; Kirby I. L.; Peck E. M.; Hendzel K. D.; Shaw S. K.; Chan B.; Smith B. D.; Jolliffe K. A.; Gale P. A. Chem. Sci. 2014, 5 (9), 3617–3626. 10.1039/C4SC01629G. [DOI] [PMC free article] [PubMed] [Google Scholar]
- Lee H. J.; Choi Y. S.; Lee K. B.; Park J.; Yoon C. J. J. Phys. Chem. A 2002, 106 (30), 7010–7017. 10.1021/jp025516e. [DOI] [Google Scholar]
- Lenthall J. T.; Foster J. A.; Anderson K. M.; Probert M. R.; Howard J. A. K.; Steed J. W. CrystEngComm 2011, 13 (9), 3202–3212. 10.1039/c0ce00680g. [DOI] [Google Scholar]
- Custelcean R.; Engle N. L.; Bonnesen P. V. CrystEngComm 2007, 9 (6), 452–455. 10.1039/b701570d. [DOI] [Google Scholar]
- Allen F. H.; Bird C. M.; Rowland R. S.; Raithby P. R. Acta Crystallogr., Sect. B: Struct. Sci. 1997, 53 (4), 680–695. 10.1107/S0108768197002656. [DOI] [Google Scholar]
- De Windt L. N. J.; Kulkarni C.; Ten Eikelder H. M. M.; Markvoort A. J.; Meijer E. W.; Palmans A. R. A. Macromolecules 2019, 52 (19), 7430–7438. 10.1021/acs.macromol.9b01502. [DOI] [PMC free article] [PubMed] [Google Scholar]
- Yanagisawa Y.; Nan Y.; Okuro K.; Aida T. Science 2018, 359 (6371), 72–76. 10.1126/science.aam7588. [DOI] [PubMed] [Google Scholar]
- Mes T.; Cantekin S.; Balkenende D. W. R.; Frissen M. M. M.; Gillissen M. A. J.; De Waal B. F. M.; Voets I. K.; Meijer E. W.; Palmans A. R. A. Chem. - Eur. J. 2013, 19 (26), 8642–8649. 10.1002/chem.201204273. [DOI] [PubMed] [Google Scholar]
- Wang L.; Phanstiel J. Org. Chem. 2000, 65 (5), 1442–1447. 10.1021/jo991589r. [DOI] [PubMed] [Google Scholar]
- Lamour G.; Kirkegaard J. B.; Li H.; Knowles T. P. J.; Gsponer J. Source Code Biol. Med. 2014, 9 (1), 16. 10.1186/1751-0473-9-16. [DOI] [PMC free article] [PubMed] [Google Scholar]
- Kasha M.; Rawls H. R.; Ashraf El-Bayoumi M. Pure Appl. Chem. 1965, 11 (3–4), 371–392. 10.1351/pac196511030371. [DOI] [Google Scholar]
- Kartha K. K.; Wendler F.; Rudolph T.; Biehl P.; Fernández G.; Schacher F. H. Chem. - Eur. J. 2020, 26 (3), 606–610. 10.1002/chem.201904284. [DOI] [PMC free article] [PubMed] [Google Scholar]
- Korevaar P. A.; Schaefer C.; de Greef T. F. A.; Meijer E. W. J. Am. Chem. Soc. 2012, 134 (32), 13482–13491. 10.1021/ja305512g. [DOI] [PubMed] [Google Scholar]
- Chierotti M. R.; Ferrero L.; Garino N.; Gobetto R.; Pellegrino L.; Braga D.; Grepioni F.; Maini L. Chem. - Eur. J. 2010, 16 (14), 4347–4358. 10.1002/chem.200902485. [DOI] [PubMed] [Google Scholar]
- Raczyńska E. D.; Hallman M.; Kolczyńska K.; Stępniewski T. M. Symmetry 2010, 2, 1485–1509. 10.3390/sym2031485. [DOI] [Google Scholar]
- Chen Z.; Wannere C. S.; Corminboeuf C.; Puchta R.; Schleyer P. V. R. Chem. Rev. 2005, 105 (10), 3842–3888. 10.1021/cr030088+. [DOI] [PubMed] [Google Scholar]
- Schleyer P. V. R.; Maerker C.; Dransfeld A.; Jiao H.; Van Eikema Hommes N. J. R. J. Am. Chem. Soc. 1996, 118 (26), 6317–6318. 10.1021/ja960582d. [DOI] [PubMed] [Google Scholar]
- Mo Y.; Song L.; Lin Y. J. Phys. Chem. A 2007, 111 (34), 8291–8301. 10.1021/jp0724065. [DOI] [PubMed] [Google Scholar]
Associated Data
This section collects any data citations, data availability statements, or supplementary materials included in this article.