

Abstract

This is the first comprehensive review on methods and materials for use in optical sensing of pH values and on applications of such sensors. The Review starts with an introduction that contains subsections on the definition of the pH value, a brief look back on optical methods for sensing of pH, on the effects of ionic strength on pH values and pKa values, on the selectivity, sensitivity, precision, dynamic ranges, and temperature dependence of such sensors. Commonly used optical sensing schemes are covered in a next main chapter, with subsections on methods based on absorptiometry, reflectometry, luminescence, refractive index, surface plasmon resonance, photonic crystals, turbidity, mechanical displacement, interferometry, and solvatochromism. This is followed by sections on absorptiometric and luminescent molecular probes for use pH in sensors. Further large sections cover polymeric hosts and supports, and methods for immobilization of indicator dyes. Further and more specific sections summarize the state of the art in materials with dual functionality (indicator and host), nanomaterials, sensors based on upconversion and 2-photon absorption, multiparameter sensors, imaging, and sensors for extreme pH values. A chapter on the many sensing formats has subsections on planar, fiber optic, evanescent wave, refractive index, surface plasmon resonance and holography based sensor designs, and on distributed sensing. Another section summarizes selected applications in areas, such as medicine, biology, oceanography, bioprocess monitoring, corrosion studies, on the use of pH sensors as transducers in biosensors and chemical sensors, and their integration into flow-injection analyzers, microfluidic devices, and lab-on-a-chip systems. An extra section is devoted to current challenges, with subsections on challenges of general nature and those of specific nature. A concluding section gives an outlook on potential future trends and perspectives.
1. Introduction, Definition of the pH Value, and General Considerations
The pH value is the chemical parameter most often determined in this world. The glass pH electrode is the gold standard and by far the most widely used tool.1 It is reliable, precise, covers a wide pH range and is fairly fast (with exceptions). On the other hand, the glass electrode is rather large (>1 mm i.d. even if miniaturized), has a rigid design, and is sensitive to extraneous electrical and microwave fields. Local electrical potentials also can adversely affect the performance of pH electrodes. pH electrodes hardly work in solutions through which an electrical current is flowing, for instance in electrolysis cells and batteries, and they are supposed to present a risk to patients with heart pace makers. Glass electrodes obviously cannot be applied to sense pH values on a nanometer scale, such as inside cells, and not to fast imaging of the distribution of pH values over a certain area.
Many of these problems can be overcome by optically measuring pH values. As will be outlined in section 1.1, the technique dates back to the time when litmus was used to optically indicate the acidity of solutions. Eventually, pH indicator stripe tests (with paper-immobilized pH indicators) have become popular and still are in widespread use. Over the years, optical sensing of pH has become precise enough to be of practical utility not only for visual estimation of pH values but also to perform precise measurements (down to ±0.01 pH units) so to become competitive to glass electrodes.
It comes as a surprise that there is not a single comprehensive review available on the variety of optical sensors for measurement of pH values, probably a result of the wealth of literature on the subject. Reviews are available that cover specific aspects of the subject. An early book on fiber optic chemical sensors and biosensors, published in 1991, contains a section on pH sensors that also includes the fundamentals of indicator-based pH sensors.2 The 16-page review of Wencel et al.3 covers many essentials but obviously cannot reflect the wealth of data and knowledge that does exist in the field. A topical review on fluorescent probes and nanoparticles for use in intracellular sensing of pH values has been presented in 2014 by Shi et al.,4 and another one was published in 2019 by the Wang group.5 A most informative review was presented by Shamsipur et al.6 on fluorometric nanosensors for pH values. While limited to fluorometry and nanoparticles (NPs), it gives a complete account on the various kinds of NPs that have been used in the past, from quantum dots, nanoclusters, carbonaceous dots, upconversion NPs, frameworks, metal, silica and polymer NPs to proteinic NPs. Other reviews cover optical pH sensors based on swellable polymers on thin film composite optical waveguides for sensor applications (pH sensing included),7 and the book series edited by Dakin and Culshaw (mainly on sensors for physical parameters) also contains a section on chemical sensors, pH included.8 A rather specific review was presented9 on the use of benzimidazole derivatives in various kind of optical detection schemes for various analytes and parameters, such as pH values. Both molecular benzimidazole probes and respective nanomaterial-based detection schemes are covered. A review on optoelectronic noses describes how arrays of chemoresponsive colorants provide high-dimensional data from the color or fluorescence changes of the dyes. It also describes how spot arrays prepared from pH sensitive indicator dyes can be used to identify both acidic and basic gases via changes in reflectance or emission as the spots are exposed to such analytes.10 Hence, a review that covers the complete subject and discusses the specific features of each of the numerous approaches will certainly be useful for those entering or being working in the field.
It is an unfortunate situation that the rapid progress made in optical sensor technologies has been accompanied by a rather sloppy use of terminology, mainly by organic chemists, who often refer to optical indicators and probes as sensors even though their “sensor” may be a simple dye, for example. The Cambridge definition11 of a chemical sensor is quite clear in that respect: Chemical sensors are miniaturized devices that can deliver real-time and online information on the presence of specific compounds or ions in complex samples. Table 1 gives an overview on the typical features of labels versus probes versus sensors.
Table 1. Overview of the Characteristic Features of Optical Labels, Probes, and Sensors12.
| term | features | examples |
|---|---|---|
| label (including reagents for derivatization) | supposed not to respond to its environment; | electrochemical labels; |
| acts as a tag to make an analyte detectable | radioactive labels; | |
| usually a conjugatable molecule or particle | optical (fluorescent) labels, such as FITC or quantum dots; | |
| Raman labels; | ||
| fluorescent proteins; | ||
| derivatization reagents (for use in separation sciences), enzymes (for use in ELISAs); | ||
| fluorescent aptamers; | ||
| labels for immunoassays, immunostaining, FISH), etc. | ||
| probe (indicator) | supposed to respond to a parameter; | indicators for pH values, probes for calcium(II) and various other ions; |
| usually a molecule; | intercalating probes for ds-DNA; | |
| mostly of the optical type (absorptiometric or fluorescent or Raman) | probes for solvent polarity or lipophilicity; | |
| probes for temperature; quenchable indicator dyes | ||
| sensor | supposed to enable continuous monitoring; | electrochemical or optical solid-phase sensors for pH values, oxygen, nitrite, glucose, methane gas; |
| supposed to work over hours if not weeks and years (in patients or cars, for example); | SO2, NOx, and others | |
| not just a single molecule, not just a probe or a label; | ||
| usually solid state |
Research in optical sensor technology (pH sensors included) may be divided into three subdisciplines:
-
(1)
Material sciences: Its main aim consists in the identification of a material that has a strong, selective, and reversible response to the analyte or other parameter of interest. Such materials may consist of indicator dyes in a polymer matrix, of new polymers with intrinsic sensing capabilities, all in the form of coatings, nanoparticles, thin films, and the like.
-
(2)
Spectroscopy: Its aim consists in the design of optical methods (that can range from refraction and reflection to fluorescence, from plasmon resonance to Raman spectroscopy, from lifetime-based sensing to FRET-based sensing, from 2-photon effects to upconversion spectroscopies, and from time-resolved and time-of-flight measurements to sensing schemes based on the (de)polarization of light or diffraction.
-
(3)
Optical Engineering: This involves smart optical designs that go far beyond classical instrumental arrangements. Examples include the design of detection cells for gases (such as the multireflective White cell for use in IR spectroscopies), evanescent wave sensors, fiber optic distributed sensors, new arrangements in surface plasmon resonance sensors, multiplexed or remote sensors, various kinds of interferometric sensors, and the like.
1.1. A Look Back on Optical Sensing of pH Values
The definition of the pH value by Sørensen (as a parameter for the acidity or basicity of an aqueous solution) may be rather “new”, but it has been recognized in early times that certain solutions taste acidic (Latin: acidus; and acetum for vinegar), while others taste burning or exert an aggressive action on certain stones (such as carbonates) and metals. Rather than tasting such fluids (which was soon recognized to imply a certain risk to those testing such fluids), it was found, first around the year 1300, that litmus (a fermented extract of lichens such as Rocella tinctoria) responds to acidity by giving a color change from blue to red. The effect is due to the acid–base chemistry of a hydroxyoxazine dye called cudbear or orcein, and it is fully reversible. To prevent addition of the extract to a sample, pH test stripes were designed by soaking paper or cotton with alcoholic solutions of litmus and subsequently gently drying them. These devices (known for some 400 years) were the first optical tests for sensing pH values. Obviously, the dyes were not covalently (but rather electrostatically) immobilized and, therefore, readily leached out. Such tests later were named dry reagent chemistries,13 and even later they were referred to as optical sensors.
The 1970s saw test stripes for pH to become commercially available where the pH indicator dye was covalently immobilized on cellulose, usually via vinylsulfonyl chemistry. This early work is difficult to trace because it was mainly performed in industry. An early article by Free et al.14 describes a triple test stripe for urinary glucose, protein, and pH. In 1975, the immobilization of pH indicator dyes on glass was reported by Harper.15 Azo dyes were linked to the surface of silicate glass (said to be more stable than cellulosic supports) that was made surface-reactive by treatment with a silane reagent so that the indicator dyes could be covalently immobilized. However, glass-immobilized pH-probes have not had a large success. Two later papers16,17 describe fairly well how to chemically immobilize vinylsulfonyl pH indicators on cellulose which still is the method of choice. The resulting nonbleeding test stripes allow for distinctly improved and continuous pH measurement, initially by visual inspection. In the late 1980s, instruments became available that enabled the color (more precisely reflectance) of such sensor stripes to be quantified and related to the actual pH value. They are based on the use of LED light sources and small enough to be used in field tests. In addition, microtiter plates with pH sensor layers on the bottom of the wells have become available and allow pH changes (for example as a result of metabolic action) to be monitored over time.
All early tests were read visually. Often the color was (and is) compared with a color chart. Results can be surprisingly precise (±0.05 pH units at around the turning point). Instrumental quantitation of test strips, dry reagent chemistries, and sensor stripes usually is performed by reflectometry, hardly by fluorescence or absorption, simply because fluorescence cannot be easily quantified visually and because practically all sensor stripes are nontransparent.
The absorption (and reflectance) spectra of the most common pH paper stripe typically displays absorption bands at about 460 nm (orange color; acid form) and 580 nm (blue color; base form), respectively. The acid form can be interrogated by a blue LED, and the base form by a yellow LED, thus enabling 2-wavelength ratiometric measurements. However, in the commercial readers, a reference signal obtained with an LED operated at about 670 nm (i.e., beyond the range of dye absorption) is used to compensate for geometrical and scattering effects. This simple and low cost detection system is still superior to many of the complicated, if not expensive pH sensors that have been described in the past years. The law of diffuse reflectance was established by Kubelka and Munk18 in 1931. It forms the basis for data processing in most instrumental readers.
As the potential of optical sensors (as an alternative to the glass electrode for sensing pH values) was rapidly recognized, several other articles appeared within a few years.19−23 Most sensors were reflectance-based, but fluorescent pH sensors were also described rather early.24−26 The article by Janata27 on whether pH optical sensors can really measure pH is a “must” in the early literature since it points to aspects hardly addressed in pH sensor work. These issues are still of high significance in terms of precision and accuracy of optical sensors for pH. The dependence on ionic strength is an intrinsic limitation of pH sensors using indicator dyes. It is also noted in this paper that the local environment of an immobilized pH indicator is not purely aqueous (that is, 55 molar in water) so that the definition of pH does not strictly apply and pKa values may be changed. Limitations due to the adverse effect of ionic strength were overcome by Opitz and Lübbers28 and Offenbacher et al.29 who made use of two indicators whose dependency of their pKa on ionic strength is different, so that two independent signals are obtained from two dyes or sensors.
It also was recognized in early work that, in addition to classical indicators, new ones are needed to take advantages of diode lasers and if sensors are to be operated at wavelengths of >600 nm. This can reduce background optical effects and inner filter effects, for example by making use of longwave absorbing fluoresceins and rhodamines.30 The fundamental work on pH sensors before the year 2000 is summarized in Table 2.
Table 2. Selected Papers on Early Work on Optical Sensors for pH Values.
| authors | year | remarks | ref |
|---|---|---|---|
| N.N. | <1970 | cellulose-immobilized pH indicators (azo dyes); work performed in industry | |
| Harper | 1975 | reusable glass-bound indicators | (15) |
| Lübbers et al. | 1977 | nanoencapsulated fluorescent pH indicators | (31) |
| Peterson et al. | 1980 | first fiber optic pH sensor | (32) |
| Goldstein et al. | 1980 | miniature fiber optic reflectometric pH sensor for blood | (33) |
| Tait et al. | 1982 | fiber optic in vivo pH sensor | (34) |
| Saari and Seitz | 1982 | pH sensor based on immobilized fluorescein | (24) |
| Opitz and Lübbers | 1983 | fluorometric planar sensor for pH and ionic strength | (28) |
| Suidan et al. | 1983 | fiber optic reflectometric pH sensor for blood | (35) |
| Wolfbeis et al. | 1983 | evaluation of fluorescent pH indicator probes for use in optical sensors | (36) |
| Kirkbright et al. | 1984 | immobilization of reflectometric pH indicators on ion exchange polymers | (19) |
| Zhujun and Seitz | 1984 | fluorometric pH sensor using HPTS as an indicator | (37) |
| Goldfinch and Lowe | 1984 | solid-phase optoelectronic pH sensor | (38) |
| Offenbacher et al. | 1986 | fluorometric sensors for near-neutral pH values | (25) |
| Wolfbeis et al. | 1986 | fluorometric sensor for simultaneous monitoring of ionic strength and physiological pH values | (29) |
| Scheggi and Baldini | 1986 | comparison of pH sensing by absorption, reflection, and fluorescence | (39) |
| Woods et al. | 1986 | optical pH sensing at low buffering capacity | (40) |
| Gehrich et al. | 1986 | intravascular blood pH monitoring system (fluorescence based) | (41) |
| Janata | 1987 | assessment of the accuracy and precision of optical pH sensors | (27) |
| Grattan et al. | 1987 | 2-wavelength fiber optic pH sensor | (21) |
| Kawabata et al. | 1987 | fiber optic pH sensor with monolayer indicator | (42) |
| Boisdé and Pérez | 1987 | miniature pH sensor (1 mm) | (43) |
| Jordan et al. | 1987 | pH sensor exploiting FRET | (44) |
| Monici et al. | 1987 | pH sensor for seawater monitoring | (45) |
| Wolfbeis and Marhold | 1987 | pH indicators for an extended range | (46) |
| Attridge et al. | 1987 | pH sensing via refractive index | (47) |
| Jones and Porter | 1988 | immobilization of pH indicators on cellulose acetate | (23) |
| Knobbe et al. | 1988 | immobilization of pH probes in sol–gels | (48) |
| Posch et al. | 1989 | gastric pH sensor (pH 0–7) | (49) |
| Carey et al. | 1989 | sensor for high acidities | (50) |
| Carey and Jorgensen | 1991 | sensor for high acidities based on fluorescent polymers | (51) |
| Gabor and Walt | 1991 | pH sensing via inner filter effects | (52) |
| Tan et al. | 1992 | submicrometer intracellular pH sensor | (53) |
| Werner et al. | 1993 | optical sensor for pH 10–13; hydrolyzed cellulose acetate | (54) |
| Ge et al. | 1993 | fiber optic evanescent wave pH sensor | (55) |
| Werner et al. | 1993 | first use of a partially hydrolyzed thin cellulose triacetate film on a polyester support; now widely used in optical pH sensors | (54) |
| Parker et al. | 1993 | pH sensor using the self-referencing dye SNARF | (56) |
| Mohr et al. | 1994 | azo indicators immobilized via vinylsulfonyl groups on cellulose films (on polyester support) | (16, 17) |
| McCurley | 1994 | optical sensing of pH values based on the use of swelling hydrophilic polymers | (57) |
| Bronk and Walt | 1994 | pH sensor array using fiber bundles | (58) |
| Michie et al. | 1995 | distributed pH sensor using fiber optics and swellable polymers | (59) |
| Koncki et al. | 1995 | pH sensor using near-infrared dye in PVC | (60) |
| Schulman et al. | 1995 | wide-range pH sensor based on photodissociation | (61) |
| Zhang et al. | 1995 | pH sensor based on reflectance of swelling polymers | (62) |
| Taib et al. | 1996 | pH sensor range extended via artificial neural network | (63) |
| de Marcos et al. | 1996 | polypyrrole films as a pH sensor material | (64) |
| Draxler and Lippitsch, Werner et al. | 1996 | first PET-based pH sensing schemes | (65−67) |
| Pringsheim et al. | 1997 | various polyanilines as a sensor material for absorptiometric sensing of pH | (68) |
| Papkovsky et al. | 1997 | PVC sensor membranes containing porphyrins | (69) |
| Safavi and Abdollahi | 1998 | first optical sensor for very high pH values | (70) |
Conventional electrochemical sensors do not work well at pH values of 11 and higher. It was soon recognized that optical sensors do not suffer from this disadvantage.54,70 On the other hand, potentiometric pH sensors cover a large range of pH values, while optical sensor typically cover a range of maximally 3 pH units with adequate accuracy. However, wide range pH sensors are needed in cases, such as measurement of gastric pH values. This is usually overcome by making use of up to 3 indicator dyes,49,71 but single indicators with intrinsically wide range (due to the presence of more than one dissociable group) also have been described.46 Sensor stripes that cover narrow pH ranges (typically 3 units) or the full pH range (1–14) are commercially available.
A major leap forward was accomplished when fiber optics were coupled to optical sensors for pH because fiber optics enable measurements to be performed at hardly accessible sites (such as in vivo), in harsh environment (such as radioactive areas or in polar regions), and in strong electromagnetic fields. In essence, the sensor chemistry for pH is placed near (or at) the tip of an optical fiber and interrogated remotely. Instruments are now available from various sources. Fiber optic sensors for pH values in nuclear power stations were described in the 1970s by Boisdè and co-workers.72,73 The fiber optic pH sensor described by Peterson et al.32 in 1980 was a milestone in optical fiber sensor technology in medicine. The system comprised plastic fibers, a pH chemistry at their ends (composed of a cellulosic dialysis tubing filled with a mixture of polystyrene particles and polyacrylamide beads dyed with phenol red), LED light sources, and photodiode detectors. Surprisingly enough, even multipoint quasi-distributed optical fiber sensing of pH values was reported already back in 1997.74 A 2-volume book that appeared in 1991 gives an account of the early work on fiber optic chemical sensors and biosensors.2
In 1984, a fiber optic triple sensor instrument (“GasStat”) became commercially available that can monitor pH values, pCO2, and pO2 during cardiopulmonary bypass operations.41,75 It contains 3 fluorescent spots in contact with blood or calibrant, each sensitive for one parameter. Fluorescence intensity is measured at two wavelengths and the signals are then submitted to internal referencing and data processing. The instrument is still in widespread use (www.terumo.com). A triple sensor was also described for use in bioreactors.76 Walt’s group77 wrote the milestone paper on the use of fiber arrays for genomic screening which, in turn, became a large commercial success. Microsensors, with diameters of <50 μm, were first reported in 199578 and enabled submillimeter resolution studies in marine microbiology.
In terms of materials, cellulose is a preferred matrix, but other hydrophilic materials also were introduced including the polyurethane hydrogels,79 polyacrylonitrile-co-polyacrylamide,80 chitosan, agarose, poly(vinyl alcohols),81 sol–gels,48,82,83 and zeolites.84 Langmuir–Blodgett films are materials useful for making sensor layers of nanometer dimensions.85 Others have used rather hydrophobic polystyrene based ion exchange beads to immobilize negatively or positively charged indicator dyes.19
Other novel materials for use in optical sensors or probes consist of polymers that have an optical response by themselves, and these were introduced by 1992 and thereafter. These include polypyrroles64 and polyanilines.68 Their absorption spectra extend far into the near-infrared. Poly(vinyl chloride) is not proton permeable but protons can be carried into a plasticized PVC membrane via carriers. This was used to design ion sensors for ammonium, sodium, potassium and calcium ions.86,87 They are based on the ion/proton exchange principle and the use of lipophilic pH indicator dyes. At about the same time, the first infrared based pH sensor that makes use of (de)protonable polymers, and the first refractive index-based sensors that make use of swellable polymers were described.
Optical sensors, unlike potentiometric sensors, do not principally require a reference element. However, optical signals can drift and can be interfered by foreign light. Early methods that have been designed (and still are powerful methods) to overcome such limitations include 2-wavelength referencing21 (also by using FRET),44 dually emitting dyes,88 or lifetime-based sensing.89
Aside from measurement of pH values, such sensors also were used as transducers in three major kinds of assays. In the first, sensors for acidic or basis gases have been designed that are based on the changes induced by these gases in an internal buffer system. Typical examples include sensing of carbon dioxide90 or ammonia91 via changes in the pH of a buffer solution entrapped in a gas-permeable but proton impermeable polymer such as silicone. In the second, pH optical pH sensors are used as transducers in enzymatic reactions during which protons are produced or consumed, for example on oxidation of glucose by glucose oxidase92 or hydrolysis of urea by urease.60 In the third, a pH sensor is used to monitor bacterial growth via the products of bacterial metabolism that cause pH values to drop or to increase.93
The Lübbers group probably was the first to describe nanosensors.31 They immobilized indicators for oxygen and pH in nanocapsules, which retain the probes but are permeable to the analyte. Liebsch et al.94 imaged pH, oxygen, and temperature using sensor membranes placed in microtiterplates and by employing decay time-based data acquisition. Kopelmans group was the first to use subμm-sized fibers to determine pH values in cells.95 A review on optical chemical sensor technology until the year 2000 was presented.96 In conclusion, it can be stated that many fundamental ideas for sensing pH values by optical means already have been created in the years before 2000.
1.2. Optical Sensing of pH Values: Specific Features
Most known optical sensors for pH (and all commercially available optical pH sensors) are based on the use of indicator dyes incorporated in some way into a solid support or matrix. However, pH sensors also have been reported that rely on the pH induced (and fully reversible) swelling of certain polymers (which can be detected optically for instance by measuring refractive index), or by making use of photonic crystals which have a structural color (very much like butterflies or chameleons) that is affected by the local pH value. Certain polymers (such as polyanilines and polypyrroles) have an intrinsic color that also depends on pH over a rather wide range. Optical sensors based on the use of immobilized pH indicators, in contrast, cover a small dynamic range only (compared to glass electrode), typically 3 pH units unless more than one indicator, or an indicator with more than one pH-transition are being used. Calibration plots have the typical sigmoidal shape of a pH titration plot as shown in Figure 1A (unless the indicator dye has several close-lying pKa values in immobilized form, for example due to a strongly varying local microenvironment). Other pH-sensitive materials (for example swelling polymers or organic conductive polymers) mostly do not display such a behavior. Rather, these have titration plots that cover a wide range (Figure 1B, C). The limitation of a small analytical range is compensated for by the capability of such sensors to measure pH values with high resolution (defined as optical signal change per pH change; ΔS/ΔpH). On the other hand and unlike glass electrodes, optical sensors can measure extreme pH values (such as alkaline pH values between 12 and 14 or Hammett acidities of −1 and lower).
Figure 1.

(a) Typical pH titration plot of a pH indicator (HPTS) with a single pH transition (and pKa value). Reprinted by permission of Springer Nature from ref (36). Copyright Springer Nature 1983. Note that the shape of titration plots depends on the analytical wavelengths in absorption, emission, or excitation: At the isosbestic point (here at 415 nm), the signal is independent of the pH value. (b) Typical titration plot of a pH-dependent conductive polymer (polyaniline) with several overlapping transitions due to the presence of many protonable nitrogen atoms in different microenvironments. This results in a much wider detection range. Reprinted from ref (68) with permission from Elsevier. Copyright Elsevier Science B.V. 1997. (c) Titration plot for a typical nanomaterial (graphite oxide) with two fairly wide transitions that have been attributed to the dissociation of carboxy groups and phenolic hydroxy groups. Reprinted by permission of Springer Nature from ref (98). Copyright Springer Nature 2012.
All optical chemical sensors rely on the formation of chemical equilibria between a sensor material and the local pH value of the sample. This makes the approach different from the establishment of a potential at the surface of an electrode. Equilibration requires prior diffusion. Hence, thin sensor layers are preferred to reduce response times if fast responding sensors are required. Most sensors are expected to give a reading within less than 3 min, but sensors that are supposed to work over long periods of time can be slower. Most sensors have response times that are faster in the forward direction than in the back direction. A mathematical model was presented97 that explains the nonsymmetrical response times depending on whether an increase or a decrease in pH values is to be measured. The influence of the pKa of the indicator, ionic strength, diffusion coefficients, and thickness of the membrane was also investigated.
One may differentiate between three fundamental types of optical sensors for pH. The first is of the planar type, usually a kind of foil that has a coating whose color or fluorescence responds to changes in the pH value of solutions the foil is in contact with. The second is the fiber optic type where the pH-responsive chemistry is placed on or in an optical waveguide. Nanosized particles form the third kind of sensors and have attracted much attention in the past years because they enable pH values to be determined (usually via microscopy) on a microscale, in particular in cells and tissues. It is reminded at this stage that molecular probes (indicators; nowadays sometimes also referred to as “sensors”) are not included in this Review and are described elsewhere.4,99
Optical sensors for pH have several attractive features:
-
(a)
Planar sensors (i.e., sensor films) can be placed inside vessels, bioreactors, microtiter plates, or microfluidic systems and then be interrogated from outside without direct contact. Planar sensors also have been used to image pH values over certain areas. Planar sensors are readily mass-produced and at low costs by methods known from the film industry and therefore often are of the disposable type.
-
(b)
Fiber optic devices have tip diameters between 1 mm and <50 μm, and this is distinctly smaller than the size of glass electrodes. They have the additional advantage of being flexible, which offers an attractive possibility for invasive analysis of all kinds of tissues. Possibly more complicated in production, such sensors also can be produced at fair costs without sacrificing accuracy, and hence, they also can be of the disposable type which is important if used in medicine. An additional attractive feature results from the fact that the optical signal can be carried over large distances. This is particularly advantageous if the sample to be measured is inaccessible, for instance in case of remote sensing over hundreds of meters. Other fields include distributed sensing along a fiber optic cable and invasive sensing. Predictably, planar pH sensors and fiber optic pH sensors will replace the use of the glass pH electrodes in many areas.
-
(c)
The third group of sensors (i.e., nanoparticles with pH-sensing capability) have found particular interest because they allow pH values to be determined inside cells, something that would be impossible even when using the smallest pH electrodes known. This technique also is often combined with (fluorescent) imaging. If incorporated into a nanomaterial, the indicator dye is hardly affected by proteins and other biomolecules. Therefore, nanoparticle-based sensing of pH values is potentially more reliable than using molecular probes for pH which often are bound by proteins upon which their pKa value can change. Notwithstanding the substantial research going on in nanosensors for pH, such sensors still are, to a wide extent, a research tool. Currently, molecular probes are in much wider use than nanoparticle-based probes, which still have to demonstrate superiority in certain situations. Issues of intracellular delivery, distribution in cells, selectivity, toxicity, and in vivo calibration have to be addressed in each single case.
Given their quite different operating principle (as compared to pH electrodes), pH optical sensors offer quite new possibilities and at the same time are subject to some limitations that are not encountered with electrodes. The fundamental difference between optical techniques and potentiometric measurements of pH is that the optical technique measures the concentration of a dye species (that is related to pH), while pH is defined in terms of activity, which is what potentiometric measurements are based on. Janata27 has shown the compromises that have to be made in case of optical pH measurements. In essence, it is (a) the discrepancy between activity and concentration of protons and (b) the fact that local pH values in sensor layers may be different from sample pH values because sensor layers do not consist of pure water (for which the definition of pH only is valid). This is discussed further below. A careful comparative study on the performance of optical pH sensors with electrochemical sensors100 revealed, however, that the agreement between the two kinds of sensors was excellent, the average difference in pH readings in two cell media being 0.04 pH units only.
Because the indicator dye and the sample are in different phases, there is necessarily a mass transfer step required before constant response is reached. This leads to delayed response to pH. Hence, optical sensors for pH usually have a slower response than the glass electrode. Photobleaching, leaching, and interferences by ambient light are further limitations. It is also noted here that pH indicator dyes are weak acids, which can act as buffers, and this may compromise the precise determination of pH values of weakly or unbuffered solutions. And yet: The intrinsic characteristics of small sensor size, electrical isolation, chemical inertness and corrosion resistance offer definite advantages over electrochemical sensors. Figure 2 shows a commercially available optical pH sensor. Such sensors are single-use because they can be fabricated in large quantities at relatively low costs.
Figure 2.
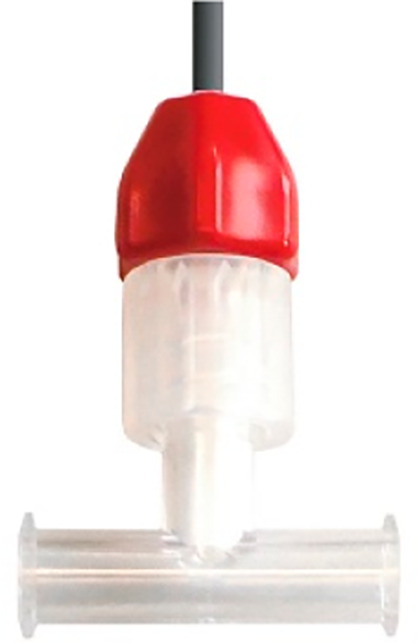
Commercially available disposable optical pH sensor attached to a single-use flow-through T-cell (from PreSens). It is connected to the pH meter (not shown) via a polymer optical fiber (top). The sensor spot (diameter = 3 mm) is placed in such a way that it is in contact with the sample solution passing the T-cell. These sensors typically cover the pH range of 5.5–8.5 and are precalibrated. Major applications are in perfusion systems and in process monitoring. Reprinted from https://www.presens.de/de/produkte/detail/ph-einweg-durchflusszelle-ftc-su-hp5-s with permission of Presens GmbH (Regensburg, Germany).
1.3. Definition of the pH Value
In simple terms, the pH value is a measure of the degree to which a solution is acidic or alkaline. The pH scale extends from less than 0 to above 14, but values inside this range are most common. Plain water is said to be neutral and to have a pH value of 7 (see below). On addition of an acid, the pH value will drop, while on addition of a base it will rise. The pH value is most often determined, for example in clinical sciences (blood, cells, stomach), environmental sciences (soil, surface waters, acid rain), in food science and oceanography, in engineering and in chemical and biotechnological plants. Blood pH values range between 7.35 and 7.45, and values above 7.8 or below 6.8 are fatal. Urine, gastric fluid, and cancerous cells are acidic, and normal seawater is slightly alkaline (>8).
According to the mathematical definition given by Sørensen in 1909, the pH value is the negative logarithm of the hydrogen ion concentration [H+]:
| 1 |
In other words, the concentration of hydrogen ions in plain water is 0.1 μM. The hydrogen ion (also referred to as proton) is not present as such in aqueous solution. Rather, it is bound to a water molecule to form the hydronium ion [H3O+], which is important to keep in mind when considering the rate of diffusion of a “proton” through a sensor material.
One liter of water contains around 1.9 μg of hydronium ions because only 2 out of one billion of water molecules dissociate to form H3O+ and OH– ions. Obviously, this is not much and pH values therefore are easily affected by external and environmental factors. For comparison: air-saturated water contains around 8 mg/L of oxygen. The pH value of water is strongly temperature dependent. At the temperature of the human body (37 °C) it is 6.80. One should also keep in mind that the pH scale is logarithmic: Compared to a solution of pH 7, one of pH 6 contains 10-times the number of hydronium ions.
The pH value can be derived from the equilibrium constant of water, which is defined as
| 2 |
In pure water solution, the concentration of water is constant (55.5 M), so that it can be multiplied with K to obtain the dissociation constant (or autoprotolysis constant) (Kw)
| 3 |
whose numerical value is 10–14 at 25 °C. At neutral pH values, the concentrations of [H+] and [OH–] are identical, so that both [H+] and [OH–] have the numerical value of 10–7. The negative decadic logarithm (that is, the pH and pOH value, respectively), therefore is 7. For purely aqueous solutions, the sum of pH and pOH always is 14.
However, the above assumption of a constant water concentration (55.5 M) is not always warranted, for example:
-
(a)
If solutions contain organic solvents in fractions of >20%; both the fraction and kind of organic cosolvent exert a large effect on the activity of protons in a solution, and on pKa values.101
-
(b)
If solutions contain large fractions of proteins, such as albumin, or polymers, such as poly(ethylene glycol). Both proteins and hydrophilic polymers can bind large fractions of water. Blood, for example, has an apparent water concentration of around 40 molar only, not 55.5 M, which is assumed when deriving the pH value from the dissociation equilibrium of water. Hence, the definition of blood pH is based on a wrong assumption. In fact, the true pH value (in terms of proton activity) of blood is unknown.
The pH scale is but one example of an acidity function. Other acidity functions have been defined, for example the Hammett acidity (H0) that has been developed for very strong acids.
1.4. Proton Activity versus Concentration
The actual acidity of a solution, however, is not governed by the concentration of hydronium ions ([H3O+]) but rather by their activity. Therefore, the initial definition was modified by Sørensen and Linderstrøm-Lang by introducing an activity factor a:
| 4 |
It accounts for the fact that the activity of the hydronium ions is compromised by other species that are present in solution, in particular by other inorganic and organic electrolytes, such as salts, charged proteins, or nucleic acids.
1.5. Dissociation Constants of Indicators and of Polymers with pH-Dependent Charge
The applicability of a classical pH probe (indicator or polymers with pH-dependent charge) is best described by its acid dissociation constant, Ka (also known as acidity constant) or its negative logarithm (pKa). In simple terms, the pKa value gives the pH value (±1.5 pH units) over which an indicator (or polymer) changes its optical properties (or charge) and, hence, is useful in terms of sensing. Most conventional probes can be considered as acids (HInd). Their properties can be described in the context of acid–base reactions. In aqueous solution, the equilibrium reaction can be described as
| 5 |
and the respective equilibrium constant Keq is
| 6 |
By inserting 55.5 for [H2O], one obtains
| 7 |
The negative decadic logarithm of Ka is the widely used pKa value of a probe (and this definition, of course, also holds for any other acid).
Again, it is important to keep in mind that pKa values usually are given for pure (= 55.5 M) aqueous solutions at low ionic strength. In optical sensors, the indicator dye usually is contained in a polymer, and the microenvironment of such indicators may contain only minute quantities of free (available) water. In this case, the assumption made above (that [H2O] = 55.5 M) is not valid. This is one major reason pKa values of pH indicators can be quite different depending on whether they are dissolved in an ideal aqueous solution or in a polymer. The apparent (nonthermodynamic) pKa value of a sensor is termed pKa´ in this Review.
Other reasons for shifts in apparent pKa values of indicators include (a) effects of ionic strength (see below), (b) binding of indicators to proteins and other charged species, (c) changes in the hydration number, and (d) dye–polymer interactions of the van der Waals type.
Binding to proteins is a major reason the determination of pH values in protein-containing samples (such as in intracellular fluids) by using plain molecular indicators should be interpreted with caution. Indicators immobilized on (and in) hydrophobic matrices have been found to exhibit acid–base properties that are quite different from those in aqueous solution.19,22,102
Most authors are making use of the Henderson–Hasselbalch equation by using pKa values determined by measurement of the activity of protons (via pH electrodes), and these values are then applied in processing data of optical sensors that measure proton concentrations.
The pKa value of an (immobilized) indicator can be determined by various methods103 but is best determined by photometry or fluorometry by making use of the Eistert equation104
| 8 |
where Ax is the absorbance of the indicator at a certain wavelength at a given pH value, Ab is the absorbance (at the same wavelength) of the base form of the dye (i.e., in a solution with a pH value that is much higher than the pKa value), and Aa is the absorbance (at the same wavelength) of the acid form of the dye (i.e., in a solution with a pH value that is much lower than the pKa value).
It is often ignored that many indicators also have an excited state pKa value and, therefore, a second pH transition (in fluorometric titrations only). This is due to excited state (adiabatic) photodissociation because phenols are much stronger acids in the first excited singlet state (S1 state) than in the ground state (S0). Inversely, amines (like pyridine-derived indicators) are much stronger bases in the first excited singlet state (S1 state) than in the ground state (S0). The Förster cycle may be used to calculate excited state pKa values. In simplified form, it reads like this for calculating pKa values
| 9 |
Here, T is the temperature and ṽHB and ṽB are the wavenumbers (in cm–1 units) of the absorption peaks of the acidic form and of the dissociated form of an indicator dye, respectively. The effect was used61 to largely extend the response pH range of an optical pH sensor based on the use of 1-hydroxypyrene-3,6,8-trisulfonate.
pKa values are thermodynamic parameters and are, therefore, more or less temperature-dependent. This temperature dependency is determined by the structure of the indicator and change in the free enthalpy upon dissociation. For instance, indicators based on phenols typically show dpKa/dT values between −0.007 and −0.012105 whereas for those bearing secondary and tertiary amines dpKa/dT vary from −0.013 to −0.020 units/K.106
1.6. Effect of Ionic Strength on pH Values and pKa Values
According to Lewis and Randall, the ionic strength I of a solution is defined as
| 10 |
where ci is the concentration of each ion present (in mole per liter) and zi2 its charge. Ionic strength (IS) affects the activity a of any electrolyte in solution (the proton included) so that its true concentration c has to be multiplied by a correction factor γ to obtain the actual activity via
| 11 |
Debye and Hückel have related the activity coefficient γ of a z-valent ion to I by
| 12 |
While there is good correlation between theoretical and experimental data for IS-corrected pH values in case of singly charged electrolytes, the situation is more complex in cases of multiple charges and unsymmetrical ions.107
The activity coefficient depends on the ionic strength of the solution and approaches unity for infinitely dilute solutions. In very dilute solution, pH can be related directly to the concentration of the hydrogen ions.
Ionic strength also affects the dissociation constant of pH indicators.103 The following relation is valid between the pKa value at a given ionic strength I, and the true thermodynamic value (pKath)
| 13 |
where zHB and zB are the charges of the acidic form and of the dissociated form of an indicator dye, respectively.
In general, optical sensors for pH values perform much better than electrodes in case of unbuffered solutions.108 This effect is of particular significance in case of samples with a high variation in ionic strength, for example in case of estuary waters. The effect of ionic strength has to be taken care of when sensing the pH value of seawater or estuaries with their high or varying ionic strength. Edmonds et al.109 have shown that an increase in ionic strength from 0.01 to 3 M can shift the pKa by as much as 1.2 units. Ionic strength (IS) calculators are available on the Internet. However, data on the effects of IS are conflicting in that both increases and decreases in the pKa values with increasing IS have been reported.
Most pKa values are determined in buffer solutions with low electrolyte concentrations, typically between 10 and 20 mM, and few authors have studied the effects of IS in detail. An example where the pKa of fluorescein-based indicator dyes decreases with increasing IS110 is shown in Figure 3 that reflects, exemplarily, the effect of IS (salinity) on the pKa value. Edmonds et al.109 have shown that an increase in IS from 0.01 to 3 M can result in strong increase of the pKa value (bromophenol blue; +0.57 units) and decrease of the pKa value (phenol red; −1.02 units), whereas for some dyes (bromocresol green, methyl red), the effect was comparably small (see Table 3). Interestingly, phenol red, bromophenol blue, and bromocresol green have rather similar chemical structures.
Figure 3.

Calibration plots of hydrogel-immobilized fluorescein indicators at different ionic strengths, demonstrating the decrease in the pKa value with increasing ionic strength of the solution. Reprinted with permission of The Royal Society of Chemistry from ref (110). Copyright Royal Society of Chemistry 2005. Permission conveyed through Copyright Clearance Center, Inc.
Table 3. Variation of pKa Values with Changing Ionic Strength at 25 °Ca.
| ionic strength [M] | 0.01 | 0.1 | 0.5 | 1 | 1.5 | 2 | 3 |
| bromophenol blue | 3.94 | 4.41 | 4.37 | 4.40 | 4.42 | 4.45 | 4.51 |
| bromocresol green | 4.57 | 4.65 | 4.65 | 4.68 | 4.71 | 4.75 | 4.82 |
| bromocresol purple | 6.26 | 5.67 | 5.67 | 5.71 | 5.74 | 5.75 | 5.76 |
| methyl red | 4.90 | 5.04 | 5.08 | 5.13 | 5.31 | 5.07 | 5.01 |
| phenol red | 7.46 | 6.96 | 6.52 | 6.37 | 6.39 | 6.55 | 6.44 |
From ref (109).
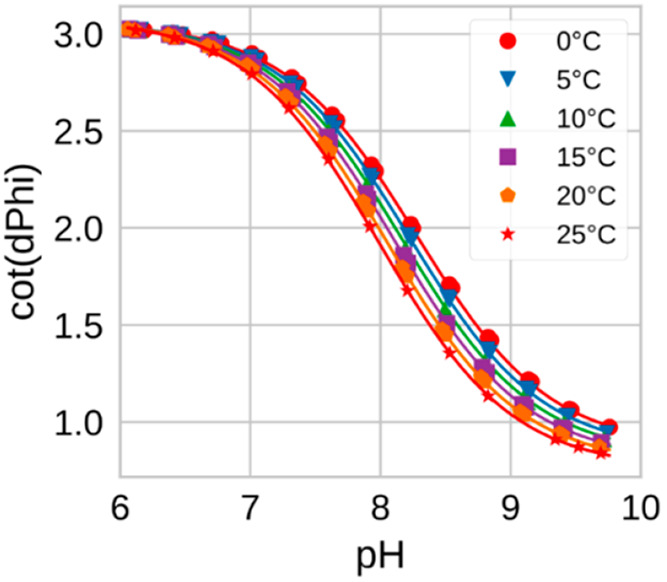
Azo dye based pH sensors and test strips are in widespread use. The effect of IS (on going from 0 to 0.1 M NaCl solutions) on a reflectometric azo dye based cellulosic pH sensor (made from the dye that is used in many commercial pH test papers) was also found to be strong, but upon further increase of IS it is less expressed.111 Obviously, the concentration of the phosphate buffer only (i.e., in the complete absence of any other electrolyte) also has a remarkable effect on the calibration graph. Given the effects of buffer strength, varying IS and temperature, an accuracy of not better than ±0.05 pH units at pH values between 6 and 9 was said to be realistic.
Monici et al.45 also reported that the pKa value of the widely used indicator dye phenol red drops by 0.044 units for a 1‰ (1 PSU) increase in salinity. Similar results were found by Robert-Baldo et al.112 who have studied the dependence of the dissociation constant (Ka) of phenol red in seawater at temperatures between 5 and 30 °C.113,114 In respect to highly accurate spectrophotometric measurements with aqueous indicators solutions, m-cresol purple proved to be the best suitable dye for oceanographic applications (pKa = 8.006 at 25 °C and at 35 PSU).115−117 The cross-talk to salinity is already measurable at high salinity (∼0.00125 pKa units/PSU at Salinity 35) and dramatically higher at lower salinities (Figure 4).116,117
Figure 4.

Salinity (in PSU) dependency of the apparent pKa´ of m-cresol purple in water. Reprinted from ref (116) with permission from Elsevier. Copyright Elsevier B.V. 2004.
The effect of IS increases with the charge of the indicator dye, and it does not come as a surprise that the widely used indicator 1-hydroxypyrene-3,5,8-trisulfonate (HPTS) with its 3–4 negative charges is particularly sensitive to IS. It usually is covalently immobilized via one sulfonamido group on hydrophilic support. The pKa of the such-immobilized dye drops by as much as 0.4 units if IS increases from 100 to 200 mM. Such a drop is intolerable in case of blood pH sensing, and therefore the effect of IS is compensated for by an algorithm that uses data obtained by ion-selective optodes for sodium118 and potassium119 which cause >90% of the IS of whole blood. Similar material has been evaluated for potential application in oceanography showing 0.2 units change of the pKa between salinity 15 and 35 PSU.120
3-Carboxy-7-hydroxycoumarin (having a single negative charge only in the dissociated form) was conjugated to the amino groups of glass beads and found to have pKa values that are virtually independent of IS as long as it is surrounded by excess protonated amino groups on the glass surface, which warrant fairly constant local IS. However, if the surface −NH3+ groups are acetylated (and thus disappear), the pKa decreases with increasing IS, typically from 7.3 to 7.1 on going from a 0.1 M to a 0.2 M IS. Equations (derived from the Debye–Hückel law) have been presented that allow the effect of IS on the pKa to be calculated.29
Reducing the charge of the indicator dye (transition between uncharged indicator and a form with charge +1 or −1) has been recognized as an efficient strategy to decrease cross-talk of the sensors to ionic strength. Weidgans et al.121 and Schröder et al.110 described fluorescein derivatives modified with a long (hydrophobic) alkyl chain and entrapped in an uncharged polyurethane hydrogel showing the transition between the neutral acid form and negatively charged base form of the dye. These dyes show very small cross-talk to ionic strength (Figure 3). In contrast, the cross-talk is much stronger for structurally very similar indicators showing transition between the forms with charges −2 and 0 (Figure 3). The same concept proved to be efficient for indicators of other classes such as perylene dyes122,123 and aza-BODIPYs both embedded into uncharged hydrogels.124 The perylene dyes bearing amine receptors (showing transition between forms with the charge 0 and +1) showed only slight increase in the apparent pKa value upon 10-fold increase of the ionic strength (Figure 5, left), and the pKa´ of the aza-BODIPY (transition between 0 and −1) was virtually independent of salinity (Figure 5, right).
Figure 5.

Salinity cross-talk of the pH sensors based on 1-aminoperylene (left) and aza-BODIPY-based indicators (right, salinity in PSU) both embedded into uncharged cross-linked poly(acryloylmorpholine) hydrogel (T = 25 °C). Reprinted with permission of The Royal Society of Chemistry from ref (123). Copyright the Royal Society of Chemistry 2013. Permission conveyed through Copyright Clearance Center, Inc. Reprinted from ref (124) with permission from Elsevier. Copyright Elsevier B.V. 2019.
1.7. Selectivity and Interferences
These are issues that are often ignored in papers on sensors for pH values but that decide on whether a sensor is applicable in practice (such as sensing the pH value of blood of the critically ill patients, of bioreactor broths, or of seawater) or not. Unless a sensor is adequately selective, it will have limited scope.
There are several kinds of potential interferents that can compromise the accuracy of optical sensors for pH values. As discussed in section 1, the performance of indicator-based or (de)protonable polymer-based sensors is biased whenever the pKa value of a pH indicator is compromised by parameters other than the concentration of the hydronium ion, for example by ionic strength, temperature, large fractions of organic solvents, quenchers of fluorescence, such as iodide, by proteins that bind to an indicator, or by polymer–dye interaction in a (solid) sensor matrix.
Temperature and ionic strength also affect polymer swelling (as exploited in all refractive index-based sensors, SPR included). For instance, a typical systematic error would occur if a pH sensor is calibrated with 10 mM phosphate buffer and then applied to the determination the pH value of seawater with its high ionic strength. Temperature and ionic strength also affect (a) the pKa value of IR-active groups, such as R–NH3+ (in case of IR sensors), (b) the diffraction of light in photonic crystals if hydrophilic polymers are involved, and (c) the refractive index and swelling of polymer coatings on the gold film of an SPR sensor.
A further major source of error is due to quenching of the fluorescence of pH indicator probes. Bromide, iodide, and sulfide are notorious quenchers that can quench the fluorescence of indicators if they can enter the sensor layer. Fortunately, the above quenchers (unlike chloride) do not occur in substantial concentrations in most biological matrices. Heavy metal ions, such as Fe(III), Pb(II), Hg(II), and Ag(I), also are typical quenchers. It is a misperception that ferric ion does not occur in blood. In fact, it is readily formed in blood by decomposition of heme and subsequent oxidation. It is also present in most surface waters and ground waters.
No (or negligible) interference by quenching has been found for rather inert gases, such noble gases, hydrogen, nitrogen, alkanes (gaseous and fluidic), alcohols (at low level), and most other organic solvents. Chlorine and other strong oxidants may react with (and decolorize) an indicator. Gaseous CO2 and ammonia may become dissolved in the sample and may change local pH values. All alkali and alkaline earth ions remain inert except for their effect on ionic strength. The anions sulfate, nitrate, nitrite, bicarbonate, carbonate, chlorate, acetate and the like also have virtually never been reported to interfere. Bioorganic species, such as saccharides and lipids (as they occur in blood or bioreactor broths), do not interfere. Proteins (such as traces of albumin) bind most charged indicator probes upon which their pKa value is changed. This is a major source of error and best prevented by selecting a permeation-selective matrix material for the sensor, examples being hydrogels, such as polyacrylamides and pHEMA, polymacon (pHEMA cross-linked with ethylene glycol dimethacrylate), polyurethanes, chitosan, carrageenan, poly(vinylpyrrolidone), or agarose, in the form of films, coatings or water-insoluble beads. If high mechanical strength is mandatory, (modified) sol–gels may be applied.
Fluorosensors based on the use of UV absorbing indicators can suffer from interferences by inner filter effects in that they screen off excitation light or even fluorescence. Obviously, colored species such as hemoglobin and chlorophyll can cause the same effect unless excluded via permeation selectivity or by using optical isolations (see section 9.3). Sensors without optical isolations are limited to applications in fairly clear samples such as various kinds of waters. Even seawater may become a problematic matrix because it has a fairly strong intrinsic absorption at wavelengths of below 300 nm.
1.8. Sensitivity, Precision, and Dynamic Range
The term sensitivity is ambiguously used in the scientific literature. Sensitivity is defined by IUPAC as follows: “The sensitivity of an analytical method is the capability of the method to discriminate small differences in concentration of the test analyte.” In plain language, sensitivity is defined as the slope of a plot of signal (signal response) against analyte concentration. Hence, sensitivity is defined as the change in any analytical signal (ΔS) with the change in concentration (Δc). Unfortunately, many authors confuse sensitivity with the limit of detection (the smallest amount of analyte that can be determined with confidence, typically at a signal-to-noise ratio of 3), not so often in case of sensors for pH, but in many others, biosensors included.
The variation in sensitivity (slope; ΔS/ΔpH) is best demonstrated by looking at the two pH titration plots shown in Figure 3 where pH values are plotted against the optical signal. It should be kept in mind that a pH value by definition is a logarithmic parameter, and hence, such plots—while reflecting concentrations—are logarithmic plots. The sensitivity of all such sensors is highest at the turning point of a plot of pH value versus optical signal (S). At pH values of more than 1.5 units away (+ or −) from the turning point, the slope is approaching zero. This also makes it obvious that even minute changes in the pKa of an indicator dye or a polymer with pH-dependent IR absorption result in large errors in the optical determination of pH values. The same is true, of course, for calibrations.
A commonly encountered systematic error in the determination of intracellular pH values results from the fact that calibration plots are established with standard buffers that ignore the presence of intracellular proteins. Besides proteins, intracellular pKa values can also be affected by interaction of indicators with DNA, RNA, lipid structures, and lipoproteins, macromolecular assemblies and even organelles. These can bind indicator dyes and shift their pKa values so that data for intracellular pH values are heavily biased. In fact, the albumin-induced shift of the pKa value of an indicator, and thus the change in color at a constant pH value, is used in some tests for albuminuria. In situ calibration is the most efficient strategy, but it is not always feasible.
1.9. Effects of Temperature
Any sensor in this world measures temperature (T) and—ideally quite specifically—another species too. Unless T itself is to be sensed, its effects are not truly welcome. Remarkably, there are relatively few reports on the T dependence of pH sensors. This may be due to the fact that T exerts rather complex effects on fraction of water in hydrophilic polymers used as sensor matrix, and on dissociation constants of indicators and of protonable swellable polymers used in IR based pH sensors, and—in case of fluorescent probes—additionally on fluorescence quantum yields and decay times. As a result, mathematical modeling of its effects is complicated. Temperature is probably the single biggest source of error in such sensors. Ratiometric (2-wavelength) sensing can reduce some effects of T (mainly on fluorescence quantum yield) but not all.
In respect to the temperature dependency of the pKa value, inorganic, and carboxylic acids show temperature coefficients close to 0.105 These groups, however, are rarely involved in modulation of fluorescence intensity of the indicators. The secondary and tertiary amines, which are common receptors in indicators based on photoinduced electron transfer, show temperature coefficients dpKa/dT between −0.013 and −0.020 units/K. Temperature coefficients for the primary amines are higher (−0.012 to −0.028 units/K).106 Phenols, which represent other important receptors in the fluorescent sensors, typically show the dpKa/dT values between −0.007 and −0.012 units/K.105 As an example Figure 6 shows the temperature dependence for the response of a fluorometric pH sensor. The sensor is based on a pH-indicator of the aza-BODIPY class (bearing a phenol receptor) covalently embedded into an uncharged poly(morpholinoacrylamide) hydrogel with an additional phosphorescent reference material.124 As can be seen, the temperature mainly affects the pKa´ value of the indicator, other effects (such as thermal quenching of the luminescence of indicator or reference) being either very minor or mostly compensated. The pKa decreases with temperature showing the coefficient dpKa/dT of −0.0114 units/K, which is very close to the values reported for phenols.105
Figure 6.
Temperature dependency for the sensor based on aza-BODIPY pH indicator bearing a phenol receptor. Reprinted from ref (124) with permission from Elsevier. Copyright 2019 Elsevier B.V.
Evidently, the temperature cross-talk can be compensated for providing that the temperature measurement is sufficiently accurate. In practice, it can be not always straightforward since the dynamic response of the optical pH sensor and the temperature probe (e.g., a conventional resistance thermometer) is likely not to be identical. This problem can be particularly pronounced in applications requiring fast measurements in environments showing high temperature and pH gradients (e.g., profiling in seawater). Fortunately, it can be addressed with help of dual sensors based on optical temperature probes125 incorporated into the same sensing layer. These dual sensors that can optically detect both pH values and T in the same place.126,127
2. Commonly Used Optical Sensing Schemes
The following section covers the most common detection schemes that have been described in the past. Despite the variety in terms of spectroscopies, reflectometry and fluorometry are most widespread. They are most often used in planar sensors, in fiber optic sensors, and in imaging of pH values. It may be stated that fluorometry is expensive (given the price for research fluorometers), but in fact present day sensor instruments can have the size of a USB stick and can be rather affordable (hand-held imagers included).
2.1. Absorptiometry and Reflectometry
Absorptiometry128 is a very established and popular optical method. And yet, absorptiometric continuous sensing of pH values is not common. If the sensor is to be operated in the absorptiometric (transmission) mode, it requires both the sensor layer and the sample to be optically clear (nonscattering and transparent) and free of colored species to warrant lack of light scattering and that no species other than the pH responsive dye are causing absorption. If scattering particles are present in the sensor layer, their concentration must be such that they do not cause scattering to an extent that would make measurement of absorbance impossible. The stipulations of (a) an optically clear sensor material and (b) an optically clear sample are hardly fulfilled in practice. The problem can be circumvented, in part, by making use of evanescent wave absorptiometry (also referred to as ATR; for attenuated total reflection; see section 14.3) where a thin film (typically <2 μm) of a pH sensitive material is placed on an optical waveguide. In this configuration, the interrogating beam is totally reflected at the interface between waveguide and pH-sensitive coating, and the attenuation of the light beam is governed by the local pH value in contact with the sensor film on the waveguide.
Reflectometry, in contrast, is quite popular. Most pH sensor stripes are not transparent but based on the use of a fibrous sensor material that is virtually impermeable to visible light. In fact, many sensors are rendered strongly scattering by adding scattering white particles including cellulose, TiO2, BaSO4, or polystyrene. The relation between the concentration of the indicator and the intensity of diffusely reflected light at the wavelength of absorption follows the law of Kubelka and Munk:
| 14 |
where c is the concentration of either the acidic form or the conjugated base form of the indicator, S is a constant that is specific for the support (such as cellulose or a TiO2-doped hydrogel), Rdiff is the intensity of light reflected via diffuse reflection; its numerical value can range from 1 (if all light is reflected) to 0 (if no light is reflected), and ε is the molar absorbance of the absorbing material at the analytical wavelength. This law forms the basis for all reflectometric read-out schemes using test stripes (not only for pH but also for parameters such as nitrate or glucose) as used in commercially available instrumentation and point-of-care tests. A good review with an updated theory on reflectometry along with representative applications is available.129
Most reflectometric sensors are based on ratiometric measurements. Two LEDs are employed, one emitting at a wavelength absorbed by the indicator in its acidic or conjugate base form, the other at a wavelength that is not absorbed or is absorbed by the conjugate base form or acidic form, respectively, of the indicator. Figure 7 gives a schematic of an arrangement as frequently used in industry.
Figure 7.
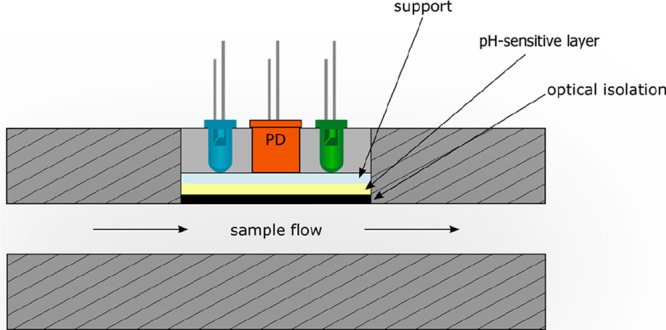
Schematic of an optoelectronic module for continuous sensing of pH values in a flow tube, usually a bypass of a bioreactor fluid, such as in fermenters (beer, wine or production of penicillin). The pH sensitive layer typically is covered with a black optical isolation to prevent sample fluorescence to interfere or to cause inner filter effects. Two LEDs are employed, one serving as a reference. The two LEDs are alternatingly turned on, and the signals of the sensor layer are acquired by a photodiode (PD).
Many sensors now are read-out by making use of RGB imaging. In essence, each present-day camera and each flat-bled color scanner is a 3-color photometer with three channels, one each for red, green and blue (RGB) light. Data are stored in jpg format and channels can be ratioed. This holds for both absorption and fluorescence. Methods for referenced luminescent sensing and imaging with digital color cameras have been critically compared.130
2.2. Measurement of Luminescence
Fluorometry and phosphorimetry probably are the second most often used methods after reflectometry. Fluorescence commonly originates from the lowest excited singlet state (S1), while phosphorescence originates from a triplet state (T1). Both terms are summarized under the general term luminescence, along with other kinds of luminescence, which, however, have not yet been applied to pH sensing so far. Luminescence spectroscopy knows more methods of measurement than absorptiometry or reflectometry. This has resulted in quite a number of read-out schemes that shall be discussed in the following.131
2.2.1. Luminescence Intensity
This is the parameter most often used in research but it is not a robust one as can be shown easily. The ratio between luminescence intensity (F) and the concentration of a fluorophore (which in the case of pH is the concentration of either the base form of the acid form of the indicator probe) is described by Parker’s law. In its simplified version—that is valid for absorbances of <0.05 only—it is stating that F is directly related to the intensity of the light source (I), the molar absorbance of the acid form or base form of the indicator (ε), its concentration (c), the penetration length (l), and the quantum yield (QY) of the probe (also sometimes referred to as Φ):
| 15 |
The geometrical factor k accounts for effects caused by the instrumental arrangement. On can easily see that F not only is affected by the concentration of the pH indicator (in its acidic or conjugate base form). Rather, it is also affected by changes (a) in the geometry of the optical arrangement, (b) of penetration depths (that may change due to swelling), (c) the intensity of the light source, (d) a change in the sensitivity of the photodiode, and (e) a drop in the concentration of the indicator as a result of leaching or photobleaching. There are two main methods that can fully or partially compensate for such potential pitfalls, namely, ratiometric (2-wavelength) measurement of intensity or dual-lifetime referencing (DLR; see below), where intensity is converted into a phase shift or a time shift. In addition to the above sources of error, fluorescence intensity may also be biased by background fluorescence. It can stem from (a) the fluorescence of samples, such as blood (which can be minimized or completely eliminated by using so-called optical isolations), and (b) the intrinsic fluorescence of optical and other components because most of them are usually made from plastic materials, which display intrinsic (usually blue to green) fluorescence. This background can hardly be compensated for, except by making used of gated fluorescence (see below). However, since the background is mostly constant, it can sometimes be subtracted by performing the measurement without the sensing material (e.g., with attached bare fiber).
Fluorescence intensity (F) can be readily measured with fluorometers and therefore is the preferred parameter in sensor research. The product of ε and QY is sometimes termed brightness (Bs) and represents an important and practical parameter as it indicates how much of the incident light is absorbed and then converted into luminescence. Fluorescent indicators and materials with high Bs are highly desirable. It is remembered here that the Stern–Volmer relationship (SVR) is not applicable to indicator-based pH sensing because acid–base equilibria are ground state equilibria. The SVR is applicable only to dynamic (collisional) quenching that occurs in an excited state.
Fluorometers may be expensive, but dedicated sensor modules are not. Main components include an LED, a photodiode, a data logger and a port, all of minute size. Main applications of optical pH sensors are in blood pH measurements, online pH monitoring of bioprocesses, in online monitoring of pH values in perfusion systems, and in pH profiling in semisolid (food) samples. Commercial systems do exist for all of these applications.
2.2.1.1. Time-Resolved Measurement of Luminescence Intensity
Measurement of luminescence intensity may be combined with time-resolution if the pH-sensitive materials possess comparably long decay times, typically >1 μs. Time-resolved (gated) fluorometry enables background fluorescence (with decay times of less than 1/10 of the decay time of the pH probe) to be suppressed. In this scheme, luminescence is excited with a short pulse of light and detected only after some delay during which any short-lived background fluorescence has disappeared. Figure 8 shows a schematic of sensing based on time-resolved fluorometry.
Figure 8.
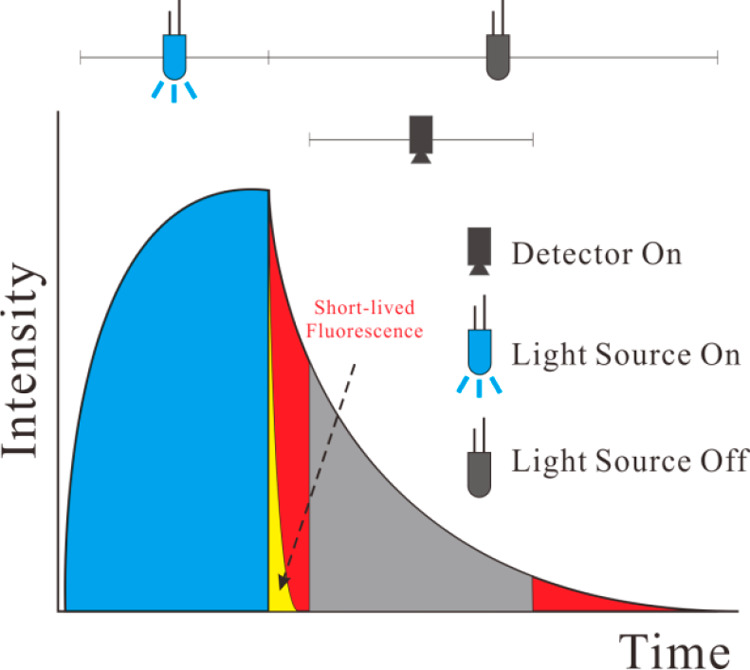
Time-resolved sensing. Following an excitation pulse (during which luminescence rises to a maximum; blue area), the photodetector is opened only after a certain delay time during which background luminescence (yellow) is allowed to decay. The luminescence of the pH-sensitive probe, in contrast, decays much slower (mainly red area) and can be detected after the delay time and with virtually zero background. The method does not compensate, however, for constant levels of ambient light or long-lived background luminescence. Reprinted from ref (132) with public license. Published by The Royal Society of Chemistry.
2.2.2. Luminescence Decay Time
Decay time is often also referred to as lifetime within this context, but this is not a good term because it may also refer to the storage lifetime or operational lifetime of a sensor. The decay profile of a fluorophore affects the temporal course of fluorescence (F) in the following way:
| 16 |
Here, F is the intensity of fluorescence at a certain time (t), F0 is the intensity at time zero after the light pulse has been terminated, and k is the time constant that is specific for each fluorophore in a given microenvironment. Optical sensors for pH values that are based on the measurement of decay time usually make use of the differences in the decay times of the acidic and conjugate base form of pH indicators, preferably those with long decay times. Both phase fluorometry and pulsed fluorometry are used to measure decay times, each method having its merit.
2.2.3. Förster Resonance Energy Transfer
Förster resonance energy transfer (FRET), often also referred to as “fluorescence” resonance energy transfer (even though no fluorescence is transferred), is based on classical dipole–dipole interactions between the transition dipoles of a donor dye and an acceptor dye. FRET efficiency inversely depends on the sixth power of the donor–acceptor distance. In case of pH sensors, two dyes are used, one (the “donor” or “acceptor”) being pH-responsive, the other (the “acceptor” or “donor”) usually not (even though it may be so). If in close proximity (typically 7 nm), photonic energy can be transferred from the first to the second dye. In other words, a first fluorophore is photoexcited, and because its emission band overlaps with the absorption band of a second fluorophore, emission occurs from the second fluorophore. A typical example is the fluorescein/rhodamine B pair of dyes: fluorescein has a pH-dependent fluorescence, while rhodamine B is inert to changes in pH. At an excitation wavelength of 488 nm, for example by using the popular argon ion laser, the ratio of green (512 nm) to yellow (550 nm) fluorescence is a parameter for the actual pH value. Molecules are typically kept in close proximity by incorporating them into nanosized hydrophilic polymer particles. It is mandatory, though, that the distance between donor and acceptor remains constant (or is not affected by parameters other than the pH value). FRET is also possible in case of using nanoparticles. The FRET effect has to be clearly differentiated from the inner filter effect. It should be mentioned that some nanosensors that make use of the fluorescein-rhodamine pair do not utilize FRET since these dyes are immobilized into the shell and the core of the nanoparticle, respectively.
2.2.4. Inner Filter Effect
In such sensors, a fluorescent particle (or a dye) is added that displays strong and pH-independent fluorescence, examples being rhodamine B or upconversion nanoparticles. On photoexcitation, these dyes emit fluorescence that is absorbed via an inner filter effect (IFE) by an added pH indicator whose acid form or conjugate base form overlaps the emission of the inert fluorophore (particle).133 Obviously, the inert dye or particle acts as a light source while the pH indicator acts as an absorber of emitted light. Unlike in FRET, there is no need for the inert fluorophore and pH indicator to be in close proximity, but concentrations usually have to be higher to generate significant pH dependent signal changes. The IFE does not affect the decay time of a fluorophore.
2.2.5. Quenching of Fluorescence
The term quenching is often used but not always in proper form. Many authors refer to quenching whenever fluorescence intensity is reduced. For instance, if the absorbance of a pH indicator dye drops at the wavelength of absorption, fluorescence will also drop, but this is not quenching. Rather, brightness (Bs) is reduced because absorbance (ε) drops. Remember that Bs is the product of ε and quantum yield. Decrease of luminescence intensity also may occur due to variation in absorption or scattering of the sample. A notorious example is a several-fold decrease in luminescence intensity of a fiber optic sensor (containing no scattering particles, see section 9 for more details) upon going from air into an aqueous solution. According to the IUPAC Gold Book (https://goldbook.iupac.org) luminescence quenching can be defined as “Radiationless redistribution of excitation energy via interaction (electronic energy or charge transfer) between an emitting species and the quencher” so that decrease of the luminescence intensity due to change in absorption of the indicator, properties of the probe or hardware (e.g., bending of fibers in fiber-optic sensors) cannot be considered as being quenching.
In classical quenching,131 a quencher, such as iodide, a metal ion, a nitro compound, or even the hydronium ion (H3O+), quenches the fluorescence of a fluorophore or a particle. In other words, photonic energy is no longer emitted by the quencher. Quenching may be static or dynamic. In the former case, the decay time remains unaffected, while in the latter case, it is reduced.
Collisional quenching is best described by a Stern–Volmer plot
| 17 |
where F0 and F are the fluorescence intensities (or decay times) in the absence and presence, respectively, of the quencher being present in concentration [Q]. The Stern–Volmer constant (Ksv) is a quantitative parameter that characterizes quenching efficiency. Plots can be linear, upward curved, or downward curved. In many cases, dynamic and static quenching occur simultaneously.
In this case, a modified Stern–Volmer eq 18 applies
| 18 |
where Kd is the dynamic quenching constant and Ks is the static quenching constant.
Quenching also can be caused by photoinduced electron transfer (PET). PET is an excited state electron transfer process where a photoexcited electron is transferred from the donor (receptor group) to the fluorophore. With respect to sensing, the PET caused by the unpaired electrons of amino or phenolate groups has received most attention.134,135 A representative quenchable fluorophore (naphthalimide) and two typical PET quencher groups (that do not quench when protonated) are shown in the following figure (Figure 9).135 The free electron pair at the amino or phenolate group quenches the fluorescence of the fluorophore by PET. If, however, the electron pair binds to a proton, PET is no longer possible, and fluorescence is switched on.
Figure 9.
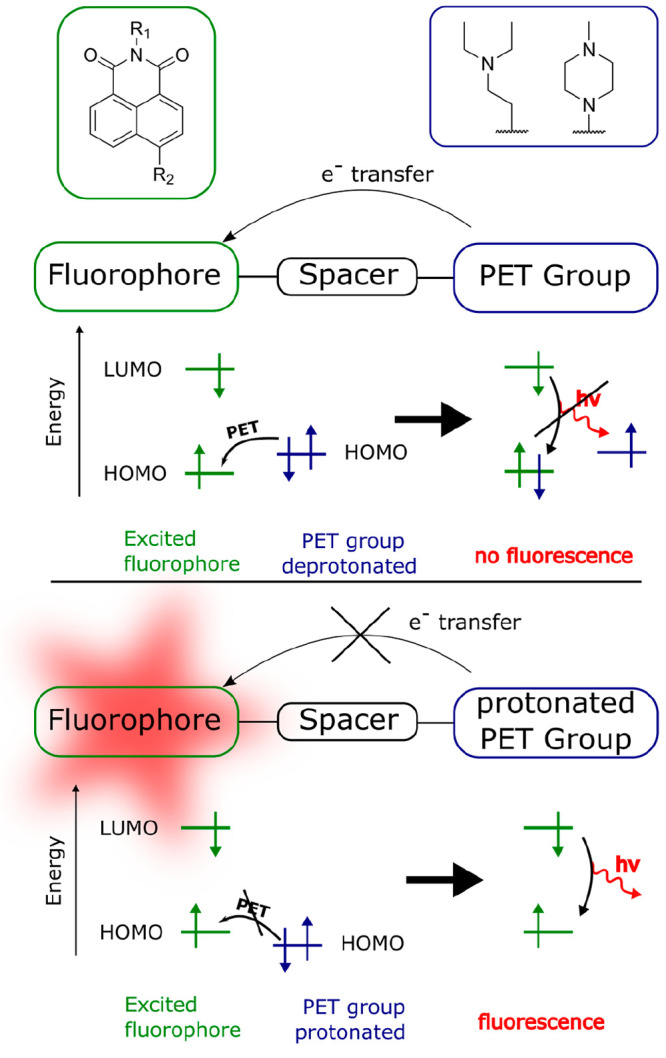
Structures of two PET-based fluorescent probes and illustration of PET-based pH sensing. The PET groups can be attached in R1 or R2 position.
The free enthalpy of the PET process ΔGPET can be estimated by the Weller equation136
| 19 |
where Eox(rec) is the first oxidation potential of the receptor group, Ered(fluor) is the first reduction potential of fluorophore, ΔEexc(fluor) is the singlet excitation energy of the fluorophore, and EIP the ion pairing energy. Therefore, PET efficiency is high if the PET group is easily oxidized (readily loses an electron in the excited state) and the fluorophore is easily reduced. Moreover, PET is more favorable for short-wavelength fluorophores and in polar solvents.137−140
2.2.6. Other Kinds of Energy Transfer
Dexter ET is another kind of energy transfer. It is a short-range phenomenon that involves electron transfer and whose efficiency drops exponentially with distance (proportional to e–kR where k is a constant that depends on the inverse of the radius of the atom. A further kind of quenching is referred to as surface energy transfer (SET). It is most often observed with (metal) nanoparticles and involves a metallic surface (such as that of gold nanoparticles) and a molecular (organic) dipole. The organic acceptor (quencher) usually does not fluoresce. In a typical example, localized pH measurements were demonstrated by using ratiometric SET.141 A last group of quenchers are called “dark quenchers”. They act very much like FRET pairs, except for the fact that the acceptor dye is nonfluorescent. Hence, ratiometric measurements (which usually are preferred) are not possible in this case. Many authors do not exactly differentiate between FRET, Dexter ET, SET, PET, dark quenching, collisional quenching and even inner filter effects.
2.2.7. Dual Lifetime Referencing (DLR)
DLR is a universally applicable scheme for converting fluorescence intensity into a ratiometric signal (Figure 10).142 Hence, the signal is hardly affected by many parameters except for leaching and bleaching (see Table 4). It is based on the addition of an inert luminescent reference dye/inorganic phosphor having strongly overlapping excitation and emission spectra, but a decay time that is much longer than that of the fluorescent indicator. In case of using a phosphorescent luminophore as the reference dye, the time domain typically is in the microsecond range, and modulation frequencies typically are in the lower kHz range. This enables the use of inexpensive optoelectronic devices and thus provides cost advantages. The method can be equally well applied to conventional sensing, fiber optic sensing and imaging. The scheme works in both the time-domain and the frequency-domain.
Figure 10.

Principle of the DLR referencing for read-out of fluorescent sensors in time domain (left) and in frequency domain (right). The upper and the lower rows reflect the situations with “switched on” and “switched off” pH indicator, respectively.
Table 4. Advantages and Disadvantages of the Various Optical Detection Schemes and How Well They Can Compensate for Various Kinds of Undesired Interferencesa.
| compensation of interferences by |
|||||||||||
|---|---|---|---|---|---|---|---|---|---|---|---|
| method | advantages | disadvantages | optical components (e.g., filters, optical gratings) | instrumental drift | optical misalignment | background fluorescence from samples | light scattered by sensor materials | intrinsic color of samples | dye leaching and bleaching | inhomogeneous dye loading | temperature |
| absorption; reflectance | simple instrumentation; low-cost; portable | moderate sensitivity; many interferents (such as ambient and background light) | – | – | – | – | – | – | – | – | – |
| luminescence intensity | sensitive; low-cost; portable devices; enables imaging | interfered by many parameters | – | – | – | – | – | – | – | – | – |
| luminescence decay time | sensitive; precise; self-referenced; enables imaging; 1-point calibration | relatively expensive; works best in case of OSPs with long lifetime showing oxygen cross-talk | ++ | ++ | ++ | ++b | ++ | ++ | ++ | ++ | – |
| two-wavelength referencing | good precision | two dyes needed; photodecomposition and leaching of the dyes may be different | – | + | ++ | – | + | – | – | – | +c |
| dual lifetime referencing (DLR) | sensitive; precise; enables imaging; simple calibration | two dyes needed with different excited-state lifetimes; more complex | ++d | ++ | ++ | – | ++ | ++ | – | ++ | +c |
| Förster resonance energy transfer | low-cost instrumentation | two dyes (donor and acceptor dye) needed that have to be in close proximity; and to spectrally overlap | – | + | + | – | + | – | – | n.a. | – |
++: Efficient compensation. +: Partial compensation. −: No compensation. 0: No effect. n.a.: Not applicable.
In the time domain only.
If both components are thermally quenched to a similar extent.
Provided there is excellent spectral overlap.
In time domain, measurements of luminescence intensity are performed in two windows: (i) during the excitation period in which both the emission of the fluorescent pH indicator and the phosphorescent reference is detected, and (ii) after the light source has been switched off and a certain delay has been applied. This allows complete decay of the short-lived fluorescence so that only the long-lived luminescence of the reference material is measured (Figure 10, left). Evidently, changing of pH will only affect the intensity in the first window, whereas the intensity in the second window is independent of pH. Good examples for time-domain DLR based sensing and imaging of pH values were described by Liebsch et al.143 and by Wang et al.126
In frequency domain (Figure 10, right), both fluorescence and phosphorescence contribute to overall phase shift. The overall phase shift (or rather its cotangent) reflects the change in the amplitude of the fluorescence and, therefore, the pH changes (eq 20).
| 20 |
Here, Am represents the overall signal intensity and Φm the measurable phase shift. Aind and Aref are the amplitudes of the fluorescence indicator and the reference standard, respectively, and Φref is the phase shift of the reference standard. It is mandatory that the decay time of the reference dye is >10 times longer than that of the pH indicator dye.
Ideally, excitation and emission spectra of the indicator and the reference should be almost identical, but it is rarely achieved in practice due to significantly larger Stokes shifts of phosphorescent compounds compared to fluorescent ones. Therefore, a variation of the excitation source or emission filter affects the calibration.
The materials used as references in DLR can be classified in two groups: metal–ligand complexes and inorganic phosphors. Metal–ligand complexes generally possess higher brightness but require immobilization in gas-blocking polymers such as polyacrylonitrile. This eliminates oxygen cross-talk and photodegradation promoted by photosensitized singlet oxygen. Polymeric micro- or nanoparticles with immobilized reference can be dispersed in the matrix used to embed the pH indicator. However, solvent resistance of the nanoparticles and migration of the reference dye into the matrix can cause difficulties. So far, ruthenium(II) polypyridyl complexes have been applied in most cases,110,126,143−148 but generally any phosphorescent dye with a decay time between 0.5 and 100 μs is suitable. Luminophores with longer decay times tend to show cross-talk to oxygen even in polymers having low gas permeability. As shown by Demas and co-workers, a combination of two phosphorescent dyes also can be used, providing that the phosphorescence lifetimes are significantly different.149 The scheme was shown to work both for the combination of an indicator with longer decay time and a reference dye with a shorter lifetime and vice versa for the combination of an indicator with a shorter lifetime and a reference dye with a longer one. Importantly, the phosphorescence decay times of all the dyes are >200 ns and thus complete elimination of background fluorescence is possible in a time-resolved measurement. Unfortunately, the set of potential candidates for such a scheme is limited to only a few dye representatives.
In contrast to luminophores, inorganic phosphors are inert in respect to dissolution in solvent, leaching, oxygen quenching and photobleaching. Generally, they can be prepared via solid state synthesis or using a combustion technique and can be further homogenized to give microcrystalline powders. The limitations include lower luminescence brightness and some dependency of the luminescence decay time on the size of phosphor particles (explained by accumulation of defects in crystal structure upon grinding), which results in lower batch-to-batch reproducibility. Some phosphor classes (e.g., Eu(II)-based oxynitride phosphors) show low hydrolytic stability in aqueous media, which disqualifies them for use as reference materials in pH sensors. Red and NIR-emitting phosphors used in DLR referenced sensors include Cr(III)-activated gadolinium aluminum borate,150,151 Cr(III)-activated aluminum oxide (Ruby)152 and calcium copper silicate (Egyptian blue)153 (Table S1).
Evidently, both time and frequency domain schemes cannot compensate for varying levels of background fluorescence. Autofluorescence would affect the ratio of intensities in the two windows in the time-domain scheme or the phase shift in the frequency domain and this can be erroneously interpreted as a change of the pH value. The same refers to inelastically scattered excitation light (Raman scattering). Whereas elastically scattered light can be eliminated by appropriate selection of the excitation wavelength and the emission filter, inelastically scattered light may overlap with the emission from the indicator or the reference. Additional optical isolation layer (see section 9.3 for details) shields the sensing material from the probe and thus makes the sensor immune to variations in background fluorescence and scattering. Unfortunately, this is not possible for certain sensor formats such as nanoparticles as used in cells or tissues.
Table 4 shows how efficient the various indicator based optical schemes treated in sections 2.1, 2.2, and 2.2.3 can eliminate potentially interfering optical effects. This summary is valid for indicator-based sensing only.
2.3. Refractive Index Based Sensing
Such sensors are not based on the use of indicator dyes. Rather, the signal is created by a pH-induced change in the refractive index (RI) of a suitable (mostly hydrophilic) material. The sensors are based on the use of a waveguide (fiber optics included) that is coated with a 0.5 to 5 μm thick layer of the pH-responsive material, usually a (de)protonable polymer.154 The angle of total reflection of light in a waveguide is affected by the ratio of the refractive indices (RIs) of core and cladding. If bent fibers are used, the change in RI may be so strong that light no longer is totally reflected and is lost via a so-called leaky (or lossy) mode. This is schematically shown in Figure 11. The intensity of light will strongly drop when approaching or exceeding a certain pH value.155 In a typical example, an optical fiber lossy mode pH sensor was generated156 that measures the differences between transversal (electric; TE) and transversal (magnetic; TM) polarized light. Alternating layers of poly(allylamine hydrochloride) and poly(acrylic acid) were placed on side-polished D-shaped fibers. Two devices were constructed to measure pH from 4.0 to 5.0 and from 7.0 to 8.0, respectively. The sensors based on TE and TM lossy modes show a maximum sensitivity of 69 nm/pH. Numerous other kinds of geometries for use in refractometry are known. By using a polymer whose RI changes with pH value, any refractometer can—in principle at least—be converted into an optical pH sensor.
Figure 11.
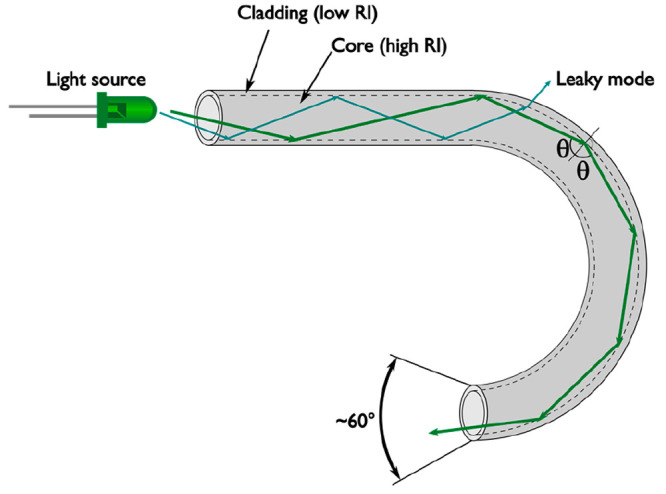
Schematic of a fiber optic pH sensor based on measurement of changes in refractive index (RI). If the RI of the cladding approaches or exceeds the RI of the core, light will not be completely reflected at the interface and get “lost”. This is referred to as a leaky mode.
Various kinds of pH sensors (optical and others) have been described. Most are based on the use of hydrogels, examples being poly(meth)acrylates, poly(meth)acrylamides, polyurethanes, cross-linked polyglycols, chitosan, poly(vinyl alcohols), and copolymers like poly(acrylonitrile-co-polyacrylamide) (such as HypanTM; with alternating hydrophilic and hydrophobic domains), to give representative examples only. Figure 12 shows the phase transition of polyelectrolyte hydrogels as a function of pH value. Acidic hydrogels such as poly(methacrylic acid) are dissociated at the carboxy group at pH values above 5 and then swell as a result of electrostatic repulsion. Basic hydrogels, such as polyallylamine, become protonated at the amino group at pH values below 9 and then swell, again as a result of electrostatic repulsion. In case of amphiphilic hydrogels or in case of mixtures (or alternating layers), both effects can be seen. A severe disadvantage of certain hydrogels may result from their hysteretic response. This has to be tested in each single case.157
Figure 12.
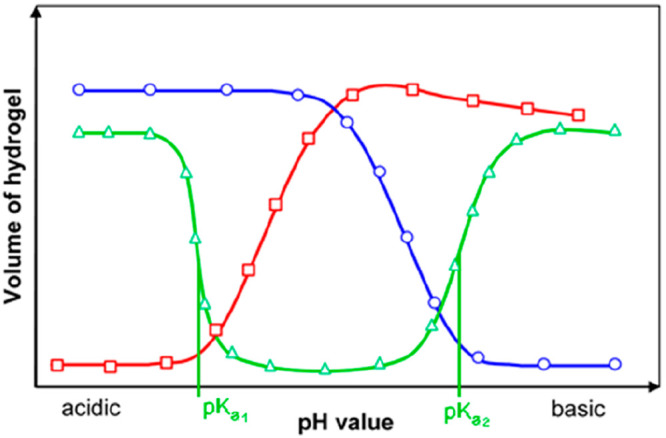
Phase transition behavior of polyelectrolyte hydrogels. Acidic hydrogels (red) swell in basic solution because of ionization by deprotonation; basic hydrogels (blue swell in acidic solutions and amphiphilic hydrogels (green) contain both acidic and basic groups and therefore show two phase transitions. Adapted from ref (158) with public license. Published by MDPI.
2.4. Surface Plasmon Resonance Based Sensing
This method also is based on measurement of RI but treated separately because detection is very different from other methods. It is based on an effect referred to as surface plasmon resonance (SPR). Here, the material is placed on a nm-thin film, typically consisting of gold. Two experimental configurations (the so-called Kretschmann and the Otto configuration, respectively; see Figure 13) are widely used. In SPR, the angle of resonance reflection depends on the refractive index (RI) of a swellable coating. If the pH value governs swelling, it also governs the angle of reflection.159 This method for measurement of changes in RI (unlike the first one) is independent of variations in light intensity as it measures the angle at which the strongest reflection occurs.
Figure 13.

Schematic of an SPR-based sensor. Incident (laser) light hits a gold film placed on a prism. Part of the light wave evanesces into the detection area that consists of a pH-dependently swelling polymer. The angle of reflection depends on the refractive index of the coating, and this is detected by plotting the intensity of reflected light versus the angle of incident light. Reprinted from ref (160) with public license. Published by MDPI.
A related SPR-based approach is based on the so-called localized plasmon resonance of (gold) nanoparticles (rather than of films). Gold nanoparticles and nanorods are known to strongly absorb visible light (and to display colors from red to blue). The color (and absorption maxima) change if such nanoparticles are covered with thin layers of a swellable hydrogel such as poly(methacrylic acid). Any pH-induced swelling or deswelling of the hydrogel will cause a shift of the longitudinal plasmonic absorption peak and, hence, of color.161 Another sensor of that kind was obtained162 by measurement of the electromagnetic resonances generated in a waveguide-nanocoating interface. The incorporation of gold nanoparticles (AuNPs) into swellable polymeric thin films leads to the generation of two different electromagnetic resonances, namely, localized surface plasmon resonance and lossy mode resonance. These phenomena can be simultaneously observed in the transmitted spectrum. The resulting device works in the pH range from 4.0 to 6.0 and has a fast response.
This special kind of absorptiometry may be extended to almost any combination of nanoparticles undergoing localized plasmonic resonance with any polymer possessing a pH sensitive RI to end up with a pH sensor. One must not forget, however, that this approach in essence is absorbance-based. It suffers from the typical limitations of absorptiometry (see section 2.1) including errors resulting from the presence of other colored absorbers and of light scattering particles, and of variations in the intensity of light sources and the sensitivity of detectors.
2.5. Photonic Crystal Based Sensing
Such sensing schemes have not been widely used but have a large potential because color changes can be readily seen with bare eyes. Their function also relies on changes in refractive index (RI), but in a way that is quite different from the sensors discussed in sections 2.4 and 2.5. Photonic crystals (PhCs) consist of a periodic arrangement (lattice) of regularly shaped transparent materials whose dielectric constants are different. Only light of a certain wavelength can pass the lattice. If the structure of the lattice is changed (for example due to swelling by varying the pH value of the water penetrating the lattice), the wavelength of light that can pass the structure is changed (Figure 14). This can be detected instrumentally or visually. Fundamentals and applications of PhCs for use in chemical sensing and biosensing have been reviewed by Fenzl et al.163
Figure 14.
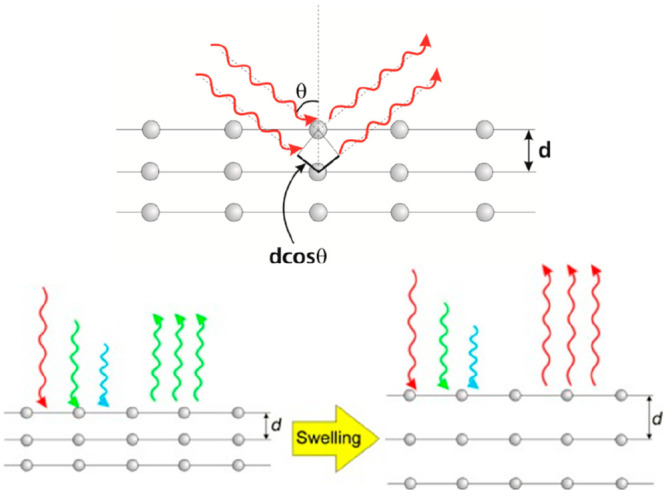
Simplified scheme of light reflection of ordered spheres in a photonic crystal illustrating how the distance in crystals of defined dimensionality (1D, 2D, or 3D) causes a change in the reflected wavelength. Adapted with permission from ref (163). Copyright Wiley-VCH Verlag GmbH & Co., KGaA, Weinheim 2014.
Depending on their dimensionality, PhCs can be subdivided into three groups. One-dimensional PhCs are the simplest variation where the periodicity exists in only one dimension. These are also known as Bragg reflectors or Bragg stacks which reflect one specific wavelength. Two-dimensional PhCs possess periodicity in two spatial directions. Three-dimensional PhCs are most common at present because methods for preparation are simple and cheap. Self-assembly of nanoscopic, monodisperse spheres into a photonic crystal host is most often used. The kinds of spheres include silica (SiO2), titania (TiO2), and polyacrylates.
A schematic of a photonic crystal array consisting of dielectric spheres within a dielectric medium (such as the solution whose pH value is to be determined) is shown in Figure 14. By combining the well-known laws of Bragg (diffraction) and Snell (refraction), the following equation is obtained:
| 21 |
where d is the distance between particle planes, neff is the mean effective refractive index (RI), θ is the angle of incident light, m is the order of reflection, and λ is the wavelength of the reflected light. To sense pH values, a material has to be found whose RI is strongly affected by pH, for instance as a result of swelling. RI can be resolved down to 0.001 units by using one-dimensional PhCs of the Bragg reflector (Bragg stack) type.
It is interesting to note that research on PhCs has almost exponentially grown in physical sciences, but not so far in chemistry. In terms of sensing, PhCs have a very large potential, not the least because sensing can be performed (a) over a wide range of wavelengths (from the UV to the IR), (b) in numerous formats that include fiber optics and fiber resonators, birefringence, polarization, plasmonic resonance, or interferometry, (c) in combination with numerous (bio)chemical receptors that range from enzymes to aptamers, (d) in combination with various kinds of materials including stimulus-responsive polymers and nanomaterials such as noble metal nanoparticles, and (e) by using techniques, such as multiplexing, pillar arrays, or logic gating. It must be stated, however, that selectivity remains a major challenge at least in chemical sensing because most host materials are of the hydrophilic type and therefore will be prone to interference due to changes in pH values and salinity. Temperature also has a strong effect on the distance d between particle planes.
2.6. Sensing of pH Values via the pH-Dependent Turbidity of Hydrogels
Hydrogel films often shrink and then become opaque due to phase separation. Many hydrogels also have a phase transition temperature that is pH-dependent.164 This can be used to sense pH values via measurement of turbidity.165 In an approach reported by the Seitz group,166 colored microspheres were incorporated into a hydrogel whose transmission for light increases if the hydrogel absorbs water which depends on the pH value. The changes of optical properties (absorbance, turbidity) can be monitored as a transmission measurement using a conventional spectrophotometer or a miniature fiber optic spectrometer. Rooney et al.167 describe another kind of pH sensors based on measurement of turbidity. A membrane was prepared by suspending aminated polystyrene microspheres (1 μm in size) in hydroxyethyl methacrylate, which was then polymerized to form a hydrogel. The resulting membranes are turbid because the RI of the microspheres is larger than the RI of the hydrogel. Turbidity is larger in basic medium and decreases with increasing wavelength. In acidic milieu, protonation of the amino group causes the polymer microspheres to swell. Swelling affects turbidity, both by increasing microsphere diameter and by reducing the microspheres’ RI so that it gets closer to the RI of the hydrogel. These membranes can be used for optical sensing in the visible and near-infrared regions, even at wavelengths beyond 1 μm as used for fiber optics telecommunications. They have excellent long-term stability, but response is slow because the required diffusion of protons into the interior of the polymer is rather slow.
2.7. Infrared and Raman Spectroscopic Sensing
Infrared (IR) and Raman spectroscopy are based on the absorption of light that leads to the stimulation of vibration of molecules. In Raman spectroscopy, absorbed light is emitted at a wavelength whose frequency is smaller by that of a typical vibrational band of the molecule, typically expressed in cm–1 units. IR sensors do not require the use of classical indicators. Some sensors for pH values are referred to as near-IR sensors because their analytical wavelength is below 1.5 μm, but in fact they are based on the use of indicators that have NIR electronic absorptions. Such sensors are not treated in this section. Fourier transform IR (FTIR) spectroscopy is a commonly used variant. Unlike in conventional IR spectroscopy, light is guided first through an interferometer and then passes the sample (or vice versa). The resulting “interferogram” represents light output as a function of mirror position. Data are then processed by a technique called Fourier transform, which converts them into the desired spectrum (a plot of transmittance versus wavenumber).
Specifically referring to IR based pH sensing, virtually any material may be used, at least in principle, as a coating, provided its IR absorption varies with pH values. IR-bands with strong transitions obviously are preferred, for example the bands of amino groups or of carboxy groups. Materials, such as amines (polyethylenimine), carboxylic acids (polyacrylates), and even mixtures (which enable ratiometric sensing) typically are used for sensing near-neutral pH values. Examples include ATR-FTIR based sensors168 and SERS-based sensors (by using the pH-sensitive SERS reporter molecule 4-mercaptopyridine deposited on the surface of single silver nanoparticles that act as plasmonic signal enhancers).169,170 More alkaline or more acidic pH values also may be covered by using hydrogels with functional groups that have pKa values within the pH range of interest. Such pH sensors often are used in combination with nanomaterials to enhance SERS activity. A core–shell nanocomposite consisting of polyaniline and gold nanoparticles (PANI@AuNPs) was shown171 to enable intracellular monitoring of pH values by SERS. The method exploits the pH-responsive property of PANI and the SERS-enhancing effect of AuNPs. The intensity of the PANI Raman peak at 1164 cm–1 decreases on increasing the pH value from 4.6 to 7.4. This is the pH range encountered in normal cells and in cancer cells. The NPs were incorporated into HeLa cancer cells and other cells for Raman based imaging of pH values. Generally spoken, the number of Raman spectroscopy based pH sensors remains small.
2.8. Sensing of pH Values via Mechanical Displacement
If a swellable material is coupled to a reflector, its expansion will cause the reflector to move. This can be measured by means of interferometry or by measurement of the intensity of light reflected by a reflector, both often by making use of optical fiber systems. Swelling of a polymer placed on one side of a waveguide also results in a physical stretch and slight bending of the (flexible) waveguide, and this enlarges the grating period, which can be measured by using a Bragg grating based detector. Fiber Bragg grating sensors are fairly simple and in wide use in methods other than chemical sensing. A swellable hydrogel was used in such a sensor172 to obtain an optical pH sensor based on the effect of pH on RI. On swelling, the hydrogel pushes the clamps fixed on the fiber grating to cause a physical stretch of the fiber, which expands the grating period. Such a sensor resembles the function of displacement sensors. In related work, a polymer was used whose volume reversibly increases and decreases as a function of pH. This causes a reflecting diaphragm to move, and this in turn, changes the intensity of light reflected back into the optical fiber.173 This is schematically shown in Figure 15. The scheme was also applied to microcantilevers coated with a swellable polymer. These can convert pH values into a mechanical displacement as shown in Figure 15. The groups of Zhang174 and Peppas175 used mechanical cantilever devices with an optical read-out system as transducer element to monitor changes in swelling of hydrogel coatings made from cross-linked 2-dimethylamino ethyl methacrylate or from poly(methacrylic acid)-co-poly(ethylene glycol) dimethacrylate, respectively. This causes a pH-induced mechanical displacement of the cantilever. Gerlach et al.176 have prepared hydrogel blends, such as poly(vinyl alcohol)/poly(acrylic acid) or poly(N-isopropylacrylamide), which are sensitive to pH values. They were placed on silicon micromachined sensors and used to electrochemically sense pH values. While not analyzed by an optical method, these materials may work well in various kinds of optical sensors.
Figure 15.
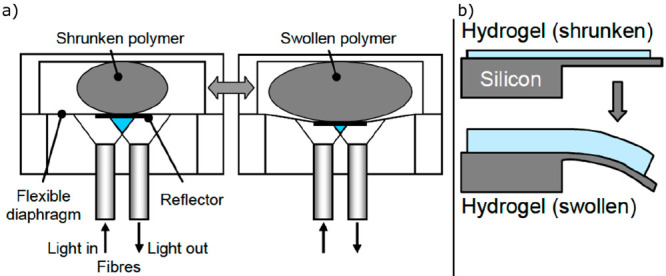
(a) Dual fiber sensor based on measurement of the displacement of a reflector. Changes in polymer volume cause the reflecting diaphragm to move, which in turn changes the intensity of light reflected back into the optical fiber. (b) Principle of a microcantilever-based pH sensor coated with a swellable hydrogel. Adapted from ref (158) with public license. Published by MDPI.
A reflection interference system based on displacement was introduced177 that uses metal island-coated pH-sensitive swelling polymers. Gold nanoparticles coated with a hydrogel layer were placed on top of a mirror to act as an optical thin-film resonance system with reflection properties depending on the thickness of the hydrogel layer. Changes in the thickness of the hydrogel layer can be monitored by the slope of the characteristic reflection minimum.
The Seitz group has studied the diffuse reflected light of swellable hydrogels and found a significant change of the reflection intensity after a change in volume. In one version,178 an optical reflective device was coupled to the swelling of an amino-modified polystyrene membrane. In another version,179 a single fiber-optic pH sensor is described based on changes in reflection accompanying polymer swelling. Diffuse reflection occurs at interfaces between regions with a different refractive index (RI), especially between the bulk polymer and the aqueous solution in the pores. During polymer swelling the bulk polymer dilutes with water causing its RI to decrease and become closer to the RI of the water in the pore space. This reduces the reflectance at the polymer–pore interface resulting in a decrease of the reflected intensity. The system includes a light emitting diode as a light source, a photodiode detector, and a fiber optic coupler, which serves as a beam splitter. Yet another chemo-mechanical-optical pH sensing mechanism relies on a Fiber Bragg Grating (FBG) coated with single and multilayers of a hydrogel.180 The device is based on the ionizable (protonable) chemical functions inside the hydrogel which reversibly dissociate as a function of the local pH value. Consequently, an osmotic pressure difference is generated between the gel and the solution. This pressure gradient causes the hydrogel to deform which in turn induces secondary strain on the FBG sensor and a shift in the Bragg wavelength.
2.9. Interferometric Sensing of pH Values
Numerous methods for interferometric sensing (IFS) are known. Examples include Mach–Zehnder, Michelson, Sagnac, Fabry–Perot, and other configurations). Interferometry can be combined with leaky mode sensing (section 2.3), photonic crystal sensing (see section 2.5), Bragg (fiber) gratings, directional couplers, grating couplers and fiber gratings, twin-core fibers, loop mirror sensors, Fresnel reflection, cascaded microfiber knot resonators, ring resonators and all-fiber ring lasers, and various others. This section differentiates between IFS using stimuli-responsive polymers and IFS using pH-indicators.
While intensity-modulation based IFS for pH are more easily manufactured, they suffer from fluctuations in the light source intensity. Wavelength-modulated sensors are not affected by intensity fluctuations but suffer from a more complex fabrication process.
2.9.1. Interferometric Sensing of pH Values Using Stimuli-Responsive Polymers, Composites, and Layers
These are most common but also least selective. Stimuli-responsive polymers only in very rare cases respond to pH only. This is because swelling and shrinking not only is affected by pH but also by (a) any salt (ion) contained in a sample, (b) by organic solvents, and (c) by proteins contained in a sample. It does not come as a surprise that many methods for IFS have been described in the scientific literature, but—unlike in case of indicator-based pH sensors—not a single IFS has been commercialized so far. Fiber Bragg grating (FBG) sensors are fairly simple and have been often used. Figure 16 shows a schematic presentation of a typical sensor (of which numerous modifications do exist). In essence, it consists of a white (multicolor) light source that passes the core of a fiber possessing a Bragg grating. Depending on the RI of core and fiber, most of the while light will be transmitted and spectrally separated. However, a small band will not be transmitted but reflected.
Figure 16.
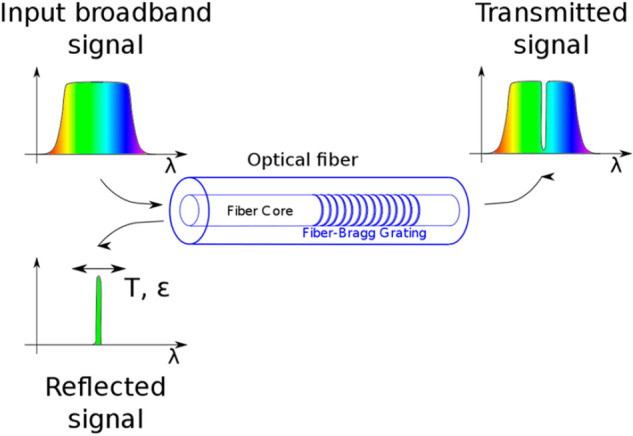
Fiber Bragg grating showing the optical fiber core with the grating, the input spectrum, and the transmitted spectrum, which lacks the fraction that can be found in the reflected signal. The wavelength of the reflected signal is strongly affected if pH (or any other parameter, such as temperature) expands the grating period. Reprinted from ref (181) with public license. Published by MDPI.
Interferometric sensing was accomplished,182 for example, by using a waist-enlarged bitaper modified with a tantalum pentoxide layer that displays high refractive index (RI). It was coated with a poly(vinyl alcohol)/poly(acrylic acid) composite hydrogel to induce sensitivity to pH in the pH 2.5–6.5 range. In another approach, a poly(vinyl alcohol)/poly(acrylic acid) coating was applied in a photonic crystal sensor with laser interrogation.183 Reflective diffraction gratings were coated with a pH-sensitive hydrogel to construct diffraction gratings that swell/shrink reversibly because of changes in pH.184 Interferometric analysis of the grating enabled detection of the hydrogel’s motions with nanoscale precision and resulted in a resolution of 6 × 10⁻⁴ pH units. The developed system is remarkably simple both to fabricate and operate and yet is extremely sensitive. Moreover, the concept of the reflective hydrogel grating is generic and can be applied to sense a wide range of other chemical stimuli. Wavelength-modulated pH sensors (that are superior to intensity based interferometric sensors) were described that use a pH-sensitive hydrogel with an optical fiber Bragg grating.185
Other work includes Fabry-interferometry using optical fibers with pH-sensitive polymeric ultrathin coatings and based on lossy-mode resonance155 or long-period fiber gratings.186 In a miniaturized Fabry–Perot pH sensor,187 an optical fiber was coated with poly(vinyl alcohol)- and poly(acrylic acid)-based hydrogel. A section of a hollow-core photonic crystal fiber was sandwiched between the lead-in single mode fiber and the sensing fiber. Swelling induces optical path modulation when exposed to varying pH solutions. The relative sensitivity is 11 nm per pH unit in the 4.1 to 6.9 pH range. The method was later extended to Mach–Zehnder interferometry using the same materials.188
Mach–Zehnder interferometric sensing of pH values by using a swellable/shrinkable hydrogel was demonstrated by Tou et al.189
A hydrogel consisting of poly[2-hydroxyethyl methacrylate-co-2-(dimethylamino)ethyl methacrylate)] is used that has basic (protonable) amino groups. These can be protonated/deprotonated, and this changes the interference pattern. The sensor covers the pH range from 6.5 to 8.5 and is claimed to have a pH 0.004 “limit of detection” (which probably should read precision or resolution). In-line Mach–Zehnder interferometry and fiber Bragg gratings in combination with swellable hydrogels was also reported by Lei et al.190 for simultaneous determination of pH values and temperature. Mohammed191 describes photonic crystal fibers (PhC-Fs) for pH sensing via Mach–Zehnder interferometry. Two PhC-Fs (2 and 4 cm long) were fusion spliced between multimode fibers. The air holes in the adhesive regions completely collapsed to result in a multimedia interference pattern. Response is said to occur between pH 4 and 12, but the reason for the effect of pH is not explained.
2.9.2. Interferometric Sensing (IFS) of pH Values Using pH-Indicators
IFS based on the use of colorimetric or fluorescent probes is more selective but devices are more difficult to make. In a typical experiment, an absorptiometric indicator is incorporated in a thin film coating, and changes in absorption or fluorescence are measured by combinations of methods such as evanescent wave sensing and interferometry. Examples include (a) a tapered single-mode optical fiber coated with cellulose and various indicator dyes192 that allows measurement of pH values from 3 to 7.4 or from 8 to 11, (b) interferometry via laterally adsorbed pH sensitive coatings containing the indicator neutral red,193 or (c) fibers coated with a mix of Liquicoat (a metal alkoxide colloidal solution for the deposition of antireflective coatings on surfaces and displays) and various pH indicators;194 the working range extends from pH 1 to 6. The work was later extended to fluorometric sensing.195
2.10. Sensing of pH-Values via Solvatochromic Fluorescent Probes
Many polymers swell and shrink dependent on the local pH values. This is associated with a change in the local polarity of the water-penetrated polymer, and this may be detected by using polarity-sensitive fluorescent probes. McCurley used a swelling material (a copolymer prepared from acrylamide and dimethylaminoethyl methacrylate) that undergoes pH-dependent swelling and shrinking.57 The detection principle is based on the protonation of the amino groups in the hydrogel. Electrostatic repulsion between like-charged groups causes the gel to expand. The polymer was doped with a fluorophore, which acts as the transducer that indicates swelling. While the amount of fluorophore remains constant, the gel volume changes in response to a change in the ionization of the hydrogel. This in turn, changes in response to pH. It must be emphasized that the fluorophore used by the authors does not have a pH-dependent fluorescence but is completely inert. Fluorescence increases from 0.37 to 0.74 units on going from pH 3 to 5 but then remains constant. The sensor was also applied to sense glucose via the enzyme glucose oxidase which catalyzes the oxidation of glucose. This is accompanied by a decrease in the local pH value.
2.11. Referenced (Ratiometric) Sensing
The terms referenced sensing and ratiometric sensing relate to techniques, where the analytical (pH-dependent) optical signal is related (referenced) to a second optical signal of the sensor that is differently or not at all affected by pH values. Referencing can eliminate many sources of error, including those resulting from drifts in light source intensity, detector sensitivity, leaching, bleaching, and swelling and from bending effects. Some methods are intrinsically self-referenced, for example refractive index based sensing, decay time based sensing, and the various dual lifetime referenced based sensing schemes. These are discussed in other sections. Also see Table 4.
Most methods for referenced sensing are based on ratioing signals obtained at two wavelengths. The term two-wavelength ratiometry (2λR) is used for such methods in the following. 2λR works in absorption, reflection, and emission. 2λR can be applied to indicator based sensing and to stimulus-responsive polymers possessing pH-dependent IR absorption bands. The main options are summarized in the following.
(A) When using UV/vis absorbing or reflecting indicator dyes:
(1) Measure the intensity of the indicator bands at 2 wavelengths, one going up in intensity with pH, the other going down.
(2) Measure the intensity of the indicator bands at 2 wavelengths, one going up in intensity with pH, the other remaining unaffected (at the so-called isosbestic point).
(3) Measure the intensity at 1 wavelength of the indicator dye, and intensity at 1 wavelength of an added pH-irresponsive reference dye; this is the method of choice if the indicator does not display two distinct absorption bands or an isosbestic point (as, for instance, in case of phenolphthalein).
(B) When using luminescent indicator dyes
(1) Measure the intensities of luminescence at a single emission wavelength at 2 different excitation wavelengths (one going up in intensity with pH, the other going down).
(2) Measure the intensities of luminescence at 2 emission wavelengths at a single excitation wavelength (one going up in intensity with pH, the other going down); this scheme also works in the FRET mode.
(3) Measure the intensities of luminescence at 2 different excitation wavelengths of the indicator dye at 2 emission wavelengths (one going up in intensity with pH, one going down); this method is rarely used because it makes the optical system complex.
(4) Measure the intensities of luminescence at 2 well separated emission wavelengths at a single excitation wavelength; one band is the pH-dependent signal of an indicator, the other is an inert signal caused by an added reference fluorophore.
Other (more complex) combinations also are possible but hardly used in practice.
(C) When using polymers that have pH-dependent absorptions in the infrared (IR)
(1) Measure the intensity of two IR absorption bands, one changing with pH (such as the bands for amino groups or carboxy groups), the other remaining inert (such as those for −CH2– groups)
(2) Measure the intensity of (a) any IR absorption band that varies with pH and (b) of IR light scattered by the polymer which is pH-independent.
Other (more complex) combinations also are possible but hardly used in practice.
(D) Less common methods for 2λR include
(1) The use of covalently linked pairs of dyes, one has pH-dependent colors, the other not. This is a modification of scheme A3. Alternatively, the pair of dyes may consist of an ion pair composed of a cationic and an anionic dye.
(2) The use of upconversion nanoparticles (UCNPs) coated with a pH-indicator; UCNPs under NIR excitation display 2 or more emission bands; if one emission band of the UCNPs is screened off by the indicator and the other is not, the ratio of the two signals is a direct parameter for pH.
(3) Measurement of the intensity of scattered light at 2 wavelengths of IR irradiation, one at a wavelength where absorbance varies with pH values (for example that of amino groups), and one at an inert wavelength where scattering is not affected by pH variations.
(4) Raman and SERS based methods for 2λR, with methods comparable to those used in IR absorptiometry.
2λR (and more complex methods of referencing) are widely used in optical sensing schemes. They can be found in this Review by searching for the terms referenced/referencing and ratiometric.
It should be noted that two-wavelength ratiometric techniques do not compensate for variations in the measured sample associated with coloration of the probe, autofluorescence or scattering providing that the sample is “visible” through the sensing material. In certain sensor formats (such as absorptiometric and luminescent-based planar optodes and fiber-optic sensors) application of additional optical isolation layer (see section 9.3 for details) represents an efficient way to eliminate these interferences. Evidently, such approach is not feasible for other sensor formats, such as nanoparticle-based sensing.
3. Overview of Commonly Used Absorptiometric pH Probes
The book by Bishop196 and other literature197−200 give a wealth of absorptiometric pH indicators (and also indicators for ions) for use at pH ranges that extend from 0 to 14. Only relatively few of them have been considered and applied for preparation of absorptiometric pH sensors (Table S2). Most of them were intended for application in aqueous solutions. The difficulties in finding suitable combinations of indicator and proper host chemistry are mainly due to the requirements and limitations of absorptiometric sensing. Disregarding complex sensing schemes, such as inner-filter effect based read-out (section 2.2.4), the spectral changes of absorptiometric probes upon pH variation can be detected using absorption or reflectance. To achieve sufficient modulation of the signal, high indicator concentrations are used, requiring the dye to be highly soluble in the immobilization matrix without aggregation. The thickness of the sensing layer can be increased which however increases the response time. Alternatively, the optical path through the sensor film can be increased by using different measurement geometries, such as evanescent wave-based read-out (section 14.3). As a trade-off, the size of the sensor is increased significantly.
To enable the best performance, absorptiometric pH probes ideally should not only display pronounced spectral changes upon pH variation but also should possess (a) high molar absorption coefficients, (b) high chemical and photochemical stability, (c) good solubility in immobilization matrices, or (d) have adequate functionality to be covalently coupled in order to prevent leaching (section 6). Similar to luminescent dyes, absorptiometric indicators should not be highly charged to reduce the cross-sensitivity to ionic strength (section 1.6). Depending on the desired application, spectral range and pKa are the most important selection criteria.
Most popular indicator dyes for application in absorptiometric sensors belong to the group of azo-dyes,15−17,23,70,76,194,201−239 phthalein,82,194,225,226,240−250 sulfophthalein (ref (19, 22, 32, 34, 35, 38, 43), (45, 63, 71, 102, 194, 213, 222, 226), (232−235, 241, 245−248, 251−321)), and other triphenylmethane dyes15,50,224,236,252,263,302,322−325 (Figure 17). Less common indicators belong to the groups of cyanines,326−329 porphyrins,69,330−339 and other classes (Figure 18; description below).60,76,111,340−350
Figure 17.

Overview of the most common absorptiometric indicators used in optical pH sensors.
Figure 18.

Overview of other absorptiometric indicators used in optical pH sensors.
3.1. Sulfophthalein Dyes
The group of sulfophthalein dyes is based on the chemical structure of phenol red (Figure 17). Prepared by Peterson and co-workers back in 1980,32 the first fiber optic pH sensors used phenol red as indicator embedded into polyacrylamide microspheres. Since then, numerous researchers utilized phenol red in optical pH sensors, which is by far the most commonly used pH probe (22, 32, 33, 43, 45, (222, 226, 232, 234), (241, 247, 284, 288, 306, 307, 309−311), (314, 321, 351, 352)). Such popularity can be explained by the response over the physiological pH range and its commercial availability. The properties of the sulfophthalein dyes are typically varied by the substitution pattern on the two phenol rings. In general, the pKa is increased by electron-rich substituents (such as alkyl) and is decreased by electron withdrawing substituents (such as halogens). Standard sulfophthalein dyes have two protonation equilibria (Figure 17), form I in highly acidic regions, form II in acidic to neutral regions, and form III under alkaline conditions. Contrary to related phthalein dyes, sulfophthaleins are much less inclined toward formation of colorless carbinols under highly alkaline conditions.353 In aqueous media, the pKa values of sulfophthaleins span from approximately 1.4 to 9.5. In alkaline media, the indicators exist in the sulfonate form and are, therefore, well water soluble. Because of the negative charge, the sulfonate groups enable strong electrostatic immobilization on ion exchange resins.265,273,299,300,317,318 This, however, increases the cross-talk to ionic strength due to high charge of the matrix and may introduce hysteresis and impaired diffusion due to Donnan potential. Leaching of positively or negatively charged indicators can be reduced by replacing the usually inorganic counterion (such as sodium ion or chloride) by an organic counterion.354,355 In case of cationic polar indicators (such as those carrying a quaternized pyridinium group or various metal–ligand complexes), the conventional counterion (such as chloride) is replaced by an organic counterion, such as dodecylsulfate or trimethylsilylpropylsulfate. In case of anionic polar indicators (such as those carrying sulfo groups), the conventional counterion (sodium) is replaced by an organic counterion such as methylpyridinium or trimethyldodecylammonium.356 This method also is an excellent method to render ionic dyes soluble in less polar polymer matrices such as polystyrene. In some cases, cationic ruthenium(II) based fluorophores have been ion paired with anionic pH indicator dyes to obtain smart pH indicating ion pairs.357
Sulfophthalein based sensors have been prepared using styrene-divinylbenzene copolymers (refs (19, 22, 43, 45, 102, 245, 253, 265, 273, 288−291, 298, and 306)), agarose,309 cellulose,38,213,232−234,263,276,302,351 nylon-6 fibers,241 PVA,310 PVC,232−234,296 PVI,287−289 sol–gel (refs (194, 226, 252, 254, 255, 257), (259−262, 267, 269, 272, 277, 279), (281−284, 286, 293, 294), (301, 311, 312, 314, 352)), SiO2–TiO2 composites,246,247,266,316 and ormosils254,256,258,264,268,270,271,280,321 as immobilization matrices.
Leaching of the dyes can be eliminated via covalent coupling to the immobilization matrix. For instance, carboxy- or glutathione-modified dyes can be coupled via amide linkage to amino TentaGel S, aminopropylated glasses, or aminohydroxypropylated cellophane.38,235,251 Azo dyes have been coupled to diazotized glasses,15,222 and to cellulose,16 certain dyes copolymerized with acrylamide,32 amino-modified dyes coupled to chlorosulfonated polystyrene to form sulfonamides320 and hydroxymethyl-modified dyes have been liked to poly(vinyl alcohol).310 Covalent coupling and other immobilization techniques are discussed in detail in section 6.
3.2. Phthalein Dyes
Phthaleins also belong to the triphenylmethane dyes and are structurally similar to sulfophthaleins (Figure 17). Compared to the latter, there is much less structural diversity among phthaleins; the dyes used for preparation of sensors are limited to phenolphthalein, α-naphtholphthalein, o-cresolphthalein, and thymolphthalein. Protonation equilibria are similar to the sulfophthaleins, apart from their tendency toward the formation of colorless carbinols under highly alkaline conditions. The analytical range is more in the alkaline pH region with pKa values from 8.5–10.0. Phthaleins are readily water-soluble in their alkaline form as carboxylates, in contrast to the hardly soluble acidic form. For covalent immobilization, the same procedures as for sulfophthaleins have been used. Additionally, phenolphthaleins were coupled to aminated PAN fibers via Mannich reaction.225,240−244 Phthaleins have also been immobilized in or on nylon-6,241 PVA,240 PAN/PA6.6 composites,243 styrene-divinylbenzene copolymers,245 cellulose materials,244 silica–titania sol–gel,246−248,250 and silica sol–gel.82,194,226,250
Apart from the phthalein and sulfophthalein dyes, only relatively few other triphenylmethane dyes have been used for the preparation of sensors. Limitations of triphenylmethane dyes include the formation of polyvalent ions introducing strong influence of ionic strength, poor stability in their acidic form, and poor photostability.196
3.3. Azo Dyes
Azo dyes contain an azo linkage between two sp2 carbons in their structure. Dyes used as pH indicators usually have hydroxyl or amino groups, building up the classes of hydroxyazo or aminoazo dyes, respectively (Figure 17). The protonation responsible for the color change can take place at the nitrogen of the azo-group or at peripheral nitrogens.358 Protonation of the azo group results in a bathochromic shift of the absorption peak.358 On the contrary, protonation of peripheral amino nitrogens gives rise to a hypsochromic shift, often into the UV part of the spectrum.358 Among the dyes used for sensors, a wide pKa range in solution is covered from 0.5 for a vinylsulfonyl azo dye17 to 13.5 for Solo chrome dark blue.196 Because of their origin as indicators for aqueous solutions, many azo dyes have additional polar groups such as carboxylic acid or sulfonic acids to increase solubility in aqueous media. Therefore, covalent immobilization of the dyes is particularly important. Special to azo dyes is the possibility to directly synthesize them onto diazotized glass substrates15,222 or onto modified PAN fibers via azo coupling.225
A popular method for covalent immobilization on cellulose is based on vinylsulfonyl chemistry known from textile industry (where it is known as the Remazol process).16,17,76,209,237−239 Numerous pH indicators were mainly immobilized on cellulose materials.16,17,76,208,209,237,238 In a typical process,111 the azo dye N9 (as used in indicator paper strips from Merck and others) is covalently immobilized on a commercial plotter foil (Hewlett-Packard, product 1770311). The foil is composed of a 100-μm polyester layer covered, on both sides, with layers of cellulose acetate. One of the two layers was removed by treatment with acetone. The other side of the foil (still coated with cellulose triacetate) served as the substrate for the immobilization of N9 via the Remazol method in strong sulfuric acid. Such sensors were used to manufacture protective clothing and to monitor wound healing or the pH of human body fluids.237,274,359 Mohr and co-workers prepared a variety of cellulose-based sensors and textiles, including T-shirts, facecloths, and cotton swabs.16,17,209,237,238,360
Reported covalent immobilization strategies also include reaction of triazine coupled azo dyes with cellulose,206 coupling via an acetal bond between an aldehyde prepared from vinylsulfonyl dyes to PVA,207,208 copolymerization of vinylsulfonyl dyes with acrylic monomers,208 coupling of Congo red to agarose after activation with epichlorohydrin,214,215 carbodiimide coupling of Congo red to poly-HEMA,217 and sol–gel reaction with trimethoxysilane coupled methyl red.228 Other immobilization matrices used for preparation of sensors are agarose,214 SiO2–ZrO2 organic polymer composite,201,202 poly-HEMA,217 PAN fibers,225 florisil,231 sol–gel,194,226−228 nylon-6,230,241 styrene-divinylbenzene copolymers,288 polycaprolactone and polycaprolactone/chitosan blends,229 polyamide 6.6,230 PVC,232−234 hydrogel D4,238 and most importantly, cellulose materials (c.f. application as dyestuff).16,17,23,76,203−206,209,212,213,215,,216,218−221,236−238 In a particularly simple but efficient method, the azo dye calcone [1-(2-hydroxy-1-naphthylazo)-2-naphthol-4-sulfonate; also referred to as Eriochrome blue black] was immobilized on a porous cellulosic polymer film361 to obtain a sensor strip for fully reversible pH measurement in the pH range of 4–9 with a response time of <5 min. The color of the membrane changes from pink to blue on going from acidic to basic medium. Ratiometric sensing was accomplished at wavelengths of 510 and 670 nm.
3.4. Other Dye Classes
From other dyes classes, only a few selected representatives have found application for preparation of absorptiometric sensors (Figure 18). Known from staining in histology, neutral red has a pKa of 7.4 and only a small cross-talk to ionic strength in aqueous solution. The dye has been immobilized into agarose,346,362 hydrolyzed cellulose acetate,216,218−220 styrene-divinylbenzene copolymers,288 ormosil,348 sol–gel, and sol–gel–Nafion composites252,259 and adsorbed onto a support using the layer-by-layer technique.347 Also known from staining and some extent fluorescence microscopy, Nile blue or its lipophilized derivatives have been used in the preparation of pH sensors for broad ranges in mixtures363 or sensor arrays232−234,302 or to widen the pH range using dynamic approaches.217,236 Although explosive, highly toxic and cross sensitive toward potassium, dipicrylamine has been used to measure in the highly acidic pH range from 0 to 3.2, either covalently immobilized or adsorbed on triacetyl cellulose.325,364
In search for NIR pH indicators, Lehmann et al. have developed indicators based on pyridine and aniline units that were connected via methine bridges.349 They have pKa values of 5.65 and 6.35 in water–isopropanol solutions. The absorption maxima peak at 675 and 850 nm when immobilized in plasticized PVC, and this enables 2-wavelength ratiometric sensing. Hazneci et al. investigated Schiff bases for absorptiometric and fluorometric sensing in the pH 3–7.8 range.365 The Schiff bases, derived from p-dimethylaminobenzaldehyde or 2,6-diacetylpyridine, were placed in thin films of plasticized PVC on a polyester support. The display yellow color (absorption peaks near 350 and 415 nm) and the 2,6-diacetylpyridine-derived films also display blue-green fluorescence. Response is adversely affected by ionic strength, and the addition of an antioxidant is required to improve stability beyond a few days. Many Schiff bases are prone to decomposition by slow hydrolysis of the >C=N– double bond.
Porphyrinoids attracted attention for use in optical pH sensors due to their high molar absorption coefficients. Among porphyrinoids, the free base porphyrinoids inherently possess pH sensitive groups. The pyrrolic nitrogens can be protonated, stepwise forming the mono- and dication, which is accompanied by a distinct change in spectral properties. This process typically occurs below pH 5 making porphyrinoids potentially interesting only for sensing in acidic conditions. As porphyrinoids are capable of forming many different metal complexes, sensors are susceptible to coordination/poisoning of metals that are capable of complexation under mild conditions. The complexation renders the indicator dyes pH insensitive. The copolymerization of protoporphyrin IX with acrylamide and N,N′-methylene bis(acrylamide) gives a pH sensitive film for the highly acidic range from 0.15 to 2 molar strong acids.339 Igarashi electrostatically immobilized a meso-tetrakis(4-N-trimethylaminophenyl)porphyrin on sulfonated polystyrene and measured pH in the range from 1.5 to 4.5, little data about the sensing performance of the highly charged system was given.330 Gulino et al. prepared porphyrin monolayers covalently bound to silica surfaces and measured from pH 1 to 5.335−337 The performance of the sensor was found to be hampered by Hg(II), Cu(II), and Zn(II) because of the formation of metal complexes. Delmarre and co-workers entrapped 5,10,15,20-tetra(4-sulfonato)porphyrin in a sol gel matrix and measured pH from 3 to 4.4.338 Below pH 1, they reported formation of J-aggregates, due to migration of porphyrins in the sol gel.
In contrast to free-base porphyrins, metalloporphyrins are intrinsically pH insensitive and modification of the porphyrin core is necessary to obtain pH sensitivity. Metal complexes of porpholactones (Figure 18) also lack a protonable group but are susceptible to reversible addition of a hydroxyl ion to the lactone, forming chlorin-like species with different spectral properties.331−333 Brückner’s group incorporated various PEGylated metal porpholactones into Nafion.332 The Pt(II) and Ga(III) complexes can indicate pH with a response time of approximately 3 min in ranges from pH 10.5–13 and 8–11, respectively. The sensors displayed cross sensitivity toward cyanide ions, which nucleophilically attack the lactone. The same Pt(II) porpholactone has been used to prepare a sprayable paint for pH imaging on cement-based materials.333
pH sensitive groups also can be introduced into metalloporphyrins by modification of the meso-position, such as introduction of a Schiff base or phenol moiety.69,334 For example, Blair et al. electropolymerized a cobalt tetrakis(4-hydroxyphenyl)porphyrin onto indium–tin oxide glass slides and measured pH in the range from 8 to 12 within 5 min.334 Papkovsky and co-workers investigated a Pd(II) porphyrin Schiff base and a free base porphyrin ketone for pH sensing in plasticized PVC membranes covering the ranges 5.5–8.5 and 3.5–7.5, respectively, with response times below 100 s.69 Later, the Pd(II) complex and also its Pt(II) analogue were reported to offer unique dual sensitivity acting as an absorptiometric pH indicator and a phosphorescent oxygen probe. Apparent pKa values shifted 0.15 units increasing the buffer temperature from 20 to 37 °C and 0.1 unit when increasing ionic strength by 0.05 mM.366
Cyanine dyes(367,368) are known from their use as tunable fluorescent labels with large molar absorptions. Their poor solubility, especially in commonly used plasticizers for PVC membranes,326 their tendency toward aggregation and their limited photostability hinder practical application. A NIR absorbing cyanine dye immobilized in Nafion369 showing response between pH 10 and 13 belongs to earlier examples of cyanine-based pH sensors. Several groups attempted to overcome some of the above limitations to make this group of dyes more suitable for optical pH sensing. Miltsov and co-workers developed pH sensors based on cyanine structures absorbing in the red to NIR region with increased solubility in organic media.326,327,329 Immobilized in plasticized PVC, several hemicyanines (Figure 18) were found to have linear ranges from pH 8.1–10 to 9.8–12 with response times (t95) from 1–2.5 min.326 The sensor membranes favorably displayed absorption peaks close to the emission wavelengths of laser diodes at 650 and 670 nm, and no hysteresis. Even more red-shifted, differently substituted ketocyanines (Figure 18) possess absorption maxima in the range from 727 to 771 nm when immobilized in plasticized PVC.327 Response times lie in the range from 0.5 to 3.6 min. PVC membranes doped with NIR nortricarbocyanine dyes cover the pH ranges from pH 2.5–5 to pH 7–9.329 The immobilized dyes absorb in the range from 793 to 834 nm and pH can be measured within 0.6–1 min. Similar to cyanines, these dyes suffer from poor photostability and rapidly decompose. Hisamoto et al. described a method for sensing of either pseudo-pH values or water content in organic solvents using merocyanines.328 Copolymerized with HEMA and diethylene glycol monomethyl ether methacrylate, the merocyanines displayed a water content dependent shift of the absorption peak that was also pH independent; for a given solvent/water mixture, the absorbance was a function of pH.
Aza-BODIPYs represent a class of highly fluorescent pH indicators with absorption bands in the red to NIR region with remarkable photostability and molar absorption coefficients (section 4.1). They can be converted to absorptiometric pH indicators by permanently “switching off” the fluorescence at pH higher than 4 (Figure 18).
In food industry, pH sensor foils based on absorptiometric indicator dyes are investigated for unaided eye detection of food spoilage in smart packaging. Food spoilage caused by microbial activity is accompanied by production of metabolites such as basic nitrogen compounds, which can be detected by pH sensors. To ensure the safety of the consumer, indicator dyes and matrices need to be toxicologically harmless. For this reason, natural dyes extracted from foodstuff have been investigated for their suitability as absorptiometric probes, among them, curcumin and various anthocyanines.340−345 The purification of extracted dyes, however, is either tedious, when pure substances are desired, or gives dye mixtures impairing reproducibility. Application of curcumin and anthocyanines is also limited by their stability. Under given limitations, the sensor foils often may not be suitable for actual sensing, but give only qualitative estimations. For example, Veiga-Santos et al. prepared an edible pH sensitive membrane based on cassava starch and anthocyanines extracted from Merlot grapes, which however was only suitable for visual discrimination between highly acidic and highly basic pH.340 Yoshida et al. also used anthocyanines extracted from grapes but chitosan as immobilization matrix.341 Immobilized in the same matrix, anthocyanines responded to pH changes in the range from 2.2 to 9 making the sensor suitable for visual detection.343 Abolghasemi et al. covalently immobilized anthocyanines on agarose after activation with epichlorohydrin.342 At 540 nm, the sensor film responded to pH changes in the range 1–10 within 3 min. Another food-related pH sensing material is based on curcumin and bacterial cellulose as immobilization matrix and is responsive from pH 6–10.344 For textile application, curcumin was also immobilized on cotton and polyamide 6.6 fabrics, giving pH responsive materials in the ranges from pH 6.5–8.5 and 8.5–13, respectively.345 Apart from natural dyes, also a commercially available Nile blue derivative (Chromoionophore I) has been proposed.370
In contrast to (metal)organic dyes, absorptiometric probes based on other materials are very rare. In fact, only a few sensors utilize the pH-dependent absorption in conjugated polymers such as polyanilines and polypyrroles (section 7.2). An uncommon sensor based on inorganic pigment Prussian blue was reported by Koncki and co-workers.350,371 The authors utilized the reversible decomposition of Prussian blue to determine pH in the range 5–9. Prussian blue is attacked by hydroxide ions, involving the disappearance of its near-infrared absorption peak at 720 nm. At pH values above 9, the reaction becomes irreversible due to the destruction of the zeolitic structure and escape of Fe(CN)64– from the films. Composite films of Prussian blue and N-substituted polypyrroles were reported to have response times of 30 s and no interference by ionic strength. On the other hand, Prussian blue is known to be easily reduced to Prussian white so that the sensor is likely to suffer from interference by reducing species.372
4. Overview of Commonly Used Luminescent pH Probes
Luminescent molecular probes for pH can be divided into two main groups–fluorescent probes based on organic dyes and phosphorescent probes based on metal–organic complexes. The number of organic fluorescent pH indicators is impressive, while less metal–organic probes have been reported. An overview on commonly used pH-sensitive fluorescent probes was given already in 1983, also with respect to their suitability for use in optical sensors.36 The indicators were divided into two classes. Class A comprises pH indicators that undergo a bathochromic spectral shift on deprotonation. These, typically, are phenols or sulfonamides. Class B comprises indicators that undergo a bathochromic shift on protonation. These, typically, are nitrogen ring compounds, such as quinines or acridines. Since then, the number of fluorescent pH indicator classes has increased considerably, and numerous systems making use of photoinduced electron transfer (hardly showing any spectral shift upon (de)protonation) have been introduced.
Metal–ligand complexes have long decay times and can be particularly valuable in time-resolved or lifetime-based sensing and imaging. On the other hand, only a few classes of metal–organic dyes show strong room temperature phosphorescence. These comprise primarily porphyrin complexes with platinum group metals but also ruthenium polypyridyl complexes, cyclometalated complexes of platinum(II) and iridium(III), as well as lanthanide chelates. Even within these classes, the choice of suitable systems is further limited due to poor brightness (molar absorption coefficients of most cyclometalated complexes), short wavelength excitation (terbium(III) chelates) or too long phosphorescence lifetime (palladium(II) and platinum(II) porphyrins), which results in strong cross-sensitivity to oxygen in virtually any proton-permeable matrix.
The following characteristics of luminescent probes should be considered apart from the pKa value, the compatibility to the matrix material, and the ease of availability:
Spectral properties. Excitation with UV light is associated with high levels of background fluorescence generated by the sample and optoelectronic components (fibers, filters etc.). Therefore, longer wavelength of excitation is preferred. Far red and NIR (including those based on upconversion) probes are preferred for in vivo applications due to high transparency of tissues to excitation and emission light and low light scattering. In other sensor formats, background fluorescence can be eliminated by using additional coatings (section 9.3). The choice of the indicator is also guided by its spectral compatibility with excitation sources and detectors, such as LEDs or lasers.
Brightness (Bs). It is defined as a product of molar absorption coefficient ε and luminescence quantum yield QY. High brightness (Bs > 20 000) enables preparation of thin sensing layers featuring fast dynamic response. Generally, luminescence brightness of NIR indicators is lower than that of UV–vis probes because of the smaller energy gap between the excited and the ground state and consequently more efficient radiationless deactivation.
Stokes shift. Symmetrical fluorescent dyes often show very strong overlap between the absorption and emission spectra. Therefore, the “useful brightness” for these dyes is typically much lower than the nominal one. In fact, to avoid crossover of the excitation light into the emission channel, either excitation should be performed at wavelengths that are significantly shorter than the absorption maximum or the emission filter is chosen such that only the long-wavelength part of the emission is collected. Evidently, this results in significant loss of brightness. On the other hand, the dyes, which feature lower ε and QY but larger Stokes shifts allow excitation at the absorption maximum and collection of almost entire luminescence. Some fluorescent indicators feature a rather intense shoulder (rhodamines) or even another maximum (perylenes) at shorter wavelength in addition to the main maximum of the excitation spectrum, which can also be very useful. Notably, phosphorescent dyes almost always exhibit large Stokes shifts (>2500 cm–1).
Photostability. Although high photostability is always desirable, the suitability of the indicator will depend on the application. For instance, even fairly photostable probes can degrade fast at high light intensities, which are characteristic of fiber-optic microsensors and in microscopy.
4.1. Organic Probes
Fluorescent pH probes based on organic dyes can be divided into several groups, namely, (i) fluorophores undergoing classical acid base chemistry; some also undergoing photoinduced proton transfer (PIPT) and (ii) dyes that undergo photoinduced electron transfer (PET).
The first group involves probes that usually have phenol groups as a part of chromophoric system (such as in fluorescein or HPTS) or aromatic rings containing protonable nitrogen atoms (such as in pyridines, quinines, or oxazines), or dissociable groups, such as −SO2–NH–R, attached to a chromophore. The second group consists of dyes that have protonable groups (such as tertiary amino groups or phenols) that are not part of the π-electron system of a fluorophore. The major difference between classical pH indicators of the first type and PET probes is that the absorption and emission spectra of PET probes hardly change with pH values because the quencher group usually is not part of the color-forming system.
Phenolic fluorophores of the first group are often present as a mixture of phenol and phenolate, and the equilibrium between the two is governed by the local pH value. Most often, the fluorescence of the phenolate is photoexcited (such as in case of fluoresceins or HPTS), and if the absorption of the phenolate form disappears at low pH values, no light is absorbed at this wavelength and the fluorescence of the phenolate also disappears. If the decay time of the phenolic form of the fluorescent pH indicator is long enough, photodissociation may occur. This is due to the fact that many phenols are stronger acids in the first excited singlet state than in the ground state. The excited state pKa value can be calculated from absorption and emission spectra via the so-called Förster–Weller cycle (see section 1.5). Hence, even if the phenol becomes photoexcited, fluorescence occurs from the excited state anion due to rapid photodissociation, such as in case of HPTS (Figure 19) or many 7-hydroxycoumarins. The phenol forms of fluoresceins and other xanthenes undergo less efficient photodissociation and have lower quantum yields.
Figure 19.

Different classes of pH indicators, which found application in optical sensors (part 1/2, other part see Figure 20). Numerous other dyes reported have been reported as molecular probes and are described in detail elsewhere.99,197
Photoinduced electron transfer (PET; also see section 2.2) occurs with indicators consisting of a pH-insensitive fluorophore and a receptor group, most prominently aliphatic or aromatic amines or phenols (Figure 9). The PET effect occurs if the HOMO of the amine has an energy level that is higher than that of the fluorophore. Electron transfer is associated with quenching of the fluorophore. If the amino group becomes protonated, no electron transfer can occur and quenching is suppressed. The main advantage of PET based indicators is their versatility. Numerous fluorophores may be attached to a receptor group with the desired pKa value. However, not every PET group quenches a fluorophore.373
The aliphatic amines, by far, represent the most common receptor group for PET based indicators. These, however, act as efficient fluorescence quenchers only in combination with certain chromophores, and are not suitable for modulation of fluorescent properties in other dyes. Aigner et al. compared the pH sensing properties of various fluorophores modified with aliphatic amine and phenol receptors at the same position.373 Among investigated chromophores, fluorescein, rhodamine, diketopyrrolopyrroles and perylene dyes were found to be quenched efficiently solely by phenolate, whereas tertiary amines modulate fluorescence only in case of some perylene dyes. In fact, efficient quenching by amines was possible only for the perylene-diimide (PDI) substituted at the core with electron-withdrawing chlorine atoms (Figure 20).373 For comparison, perylenes substituted with electron-donating substituents (phenoxy or morpholine) showed moderate (2-fold) or no quenching at all, respectively. A study on model receptor compounds revealed that the oxidation potential of triethylamine is 0.26 V higher than that of deprotonated 2,6-dichlorophenol, which confirms more favorable PET in case of the latter.
Figure 20.

Different classes of pH indicators that have found application in optical sensors (part 2/2, other part see Figure 19). Numerous other dyes have been reported to be viable molecular probes and are described in detail elsewhere.99,197
4.1.1. HPTS and Derivatives25,37,61,80,374−393
8-Hydroxypyrene-1,3,6-trisulfonate (Figure 19 R = O–Na+) is a highly water-soluble pH indicator dye with a pKa around 7.3 in aqueous solution. HPTS belongs to the class of dyes with photoinduced proton transfer in the excited state. Only the green emission from the deprotonated form around 510 nm is observed upon excitation of the protonated or deprotonated form, absorbing around 405 and 465 nm, respectively. These two absorption bands enable referenced ratiometric measurement. The anion features a molar absorption of around 20 000 M–1 cm–1 and a quantum yield close to unity. For preparation of sensing membranes, the highly charged dye requires covalent immobilization25,61,80,376,377,379,381,384,386,393,394 or derivatization382,383,390,395 to minimize leaching to an acceptable level. In this form, HPTS is widely used in commercial pH sensors. In a few cases, anion-exchange resins or cellulose acetate375,378,389 were used for electrostatic immobilization, but the indicator immobilized in these matrices is prone to gradual leaching and displays strong sensitivity to ionic strength.380,389 Hydrophobic sulfonamide derivatives of HPTS (R = NH-alkyl or N(alkyl)2, Figure 19)374,382,390,395 can overcome this problem and enable immobilization in hydrogel,374,382 PVC,395 or poly(styrene-block-vinylpyrrolidone) nanobeads382,390 with negligible leaching. The spectral properties of these dyes, however, are strongly affected by the substitution. In fact, it results in a strong bathochromic shift of absorption of the protonated and deprotonated forms of the dye. Additionally, the emission is observed from both forms. HPTS can also be rendered lipophilic by ion-pairing with quaternary alkylammonium ions.383 Incorporation in a sol–gel matrix produced a ratiometric pH sensor for the range from 5–8 with a resolution of 0.02 and a response time (t90) of 12 s. In 6,8-dihydroxypyrene-1,3-disulfonic acid (DHPDS, Figure 19A),386,389,394 the second hydroxy group can be used for covalent immobilization379 or is acting as a second pH sensitive group with a close pKa (7.33 and 8.53)36 slightly increasing the dynamic range.389 Immobilized, the dye displays dual excitation useful for ratiometric sensing.389
4.1.2. Coumarins and Derivatives25,29,396
7-Hydroxycoumarins25,29 have emission around 455 nm after excitation at 360 or 400 nm for the protonated and the deprotonated form, respectively. Apart from the unfavorable UV to blue region excitation, the dyes display lower brightness compared to HPTS with a similar molar absorption coefficient but lower quantum yield. Additionally, the photostability is slightly inferior to that of HPTS.25 Iminocoumarins (Figure 19A) show a bathochromic shift of the absorption into the blue to green region and higher absorption coefficients compared to 7-hydroxycoumarins.396 The pH-sensitivity of these dyes relies on a different mechanism. The dyes display two protonation equilibria with pKa values, for example, for one representative of 2.7 and 7.8, associated with deprotonation of an imino group and deprotonation of a phenol PET receptor, respectively. The deprotonation of the imino group results in hypsochromic shift from 510 to 410 nm absorption and a decrease in fluorescence intensity, whereas the deprotonation of the phenol induces PET and results in fluorescence quenching.
4.1.3. Fluoresceins and Derivatives
Xanthene dyes, particularly fluoresceins,24,30,44,49,53,56,88,110,121,143,146,150,382,392,397−443 (Figure 19) are the most commonly used pH probes. Wide commercial availability of various derivatives and conjugates offers easy access to various applications especially in biological and medical research. Fluorescein efficiently absorbs at around 490 nm and emits in the green part of the spectrum, typically at 515–520 nm; π-extension (seminaphthofluoresceins (SNAFL)397 and naphthofluorescein)30,444,445 results in a bathochromic shift of absorption and emission. The same effect is observed for seminaphthorhodafluor (SNARF) dyes.444,445 The brightness is highest for fluoresceins and lowest for naphthofluoresceins, whereas SNAFL occupies an intermediate position (c.f., refs (99 and 445)). Fluorescein has several protonation/deprotonation equilibria,446 but the most important in aqueous environment are the mono- and dianionic forms with deprotonated carboxylic acid and phenolic groups. In other solvents/polymeric matrices, the closed lactone form becomes more prominent, which, however, is colorless and nonfluorescent. Molar absorption coefficients and fluorescence quantum yields significantly differ between deprotonated and protonated (regarding the phenol) forms.99,445 For fluorescein, its derivatives and type B SNARFs (dialkyl SNARF derivatives, Figure 19), the deprotonated form is much brighter compared to the protonated form. For SNAFLs and type A SNARFs (SNARFs with fewer than two alkyl groups, Figure 19B), the base forms have higher molar absorption coefficients but the quantum yields are higher under acidic conditions.445 The photostability of fluoresceins and their π-extended derivatives is poor. It can be improved by introduction of electronegative halides in 2′ and 7′ positions (dichloro- or difluorofluorescein), but the pKa values also are lowered.110,447 Photostability drops if alkyl chains are introduced at the same positions.110,447 For preparation of sensing membranes, the commercial availability of various functionalized xanthene dyes simplifies covalent immobilization procedures. Fluorescein isothiocyanate (FITC)404,405,411,421,425,441 and fluoresceinamine (FA)24,400,401,412,414,429,448 are two commonly used representatives that have been directly immobilized or immobilized after additional functionalization. As the isothiocyanate group is electrophilic, FITC derivatives are useful for covalent coupling via nucleophilic attack. FITC has been coupled to various amino-modified materials such as sol gels,404,421 polystyrene beads,405 aminoethyl cellulose,49,127,425,441 hydrogels,49 and controlled pore glass.49 The use of oxygen nucleophiles has been limited to cellulose nanocrystals.411 Fluoresceinamine is the nucleophilic counterpart and has been coupled to materials containing epoxy-,401,414 cyanuric acid chloride-,24 thiophene-,412 isothiocyanate-,414 and alkyl halide448 electrophilic groups. The reaction of acryloyl chloride with fluoresceinamine leads to acryloylfluorescein.53,400,406,408,417,429,449 This dye-monomer conjugate has been extensively used for copolymerization with acrylic monomers such as acrylamide and hydroxyethyl methacrylate. Both amino- and carboxy-xanthene dyes can easily form amide bonds via coupling reagents or by using reactive succinimidyl esters.30,143,397,411,415,420,423,428,448 The carboxy-functionalized dyes were coupled to poly(acrylamide-co-vinylamine),397 amino-modified cellulose nanocrystals,411 concanavalin A-modified hydrogel,420 amino-functionalized polystyrene microspheres,415 aminoethyl cellulose,30 amino-modified pHEMA,423 and amino-containing ORMOSIL.428
A sensing membrane suitable for dual-lifetime referenced measurement of pH values was obtained by coupling a carboxyfluorescein succinimidyl ester to poly(acrylonitrile)-Ru(dpp) particles covered with a hydrogel.143 The particles were then dispersed in a hydrogel sensing membrane. Succinimidyl esters of xanthene dyes can also be coupled to amino dextrans. The conjugates have been used for intracellular pH measurement or have been immobilized on silver island films for metal-enhanced fluorescence sensing.416 Xanthene dyes also allow physical entrapment in hydrogels,110,121,398,424,430,438 sol–gels,399,402,403,407,414,422,431 poly(styrene-block-vinylpyrrolidone) nanobeads,382 cross-linked poly(vinyl alcohol)-silica gel copolymers,432 polyacrylamide,88 and pHEMA.56,419 To minimize leaching, the dyes can be alkyl substituted,110,121,398,424,430,438 directly or via ester bonds, to enhance their hydrophobicity for incorporation into hydrophobic materials. Alkyl core substitution, however, significantly deteriorates photostability. Another approach is to entrap chitosan or dextran conjugates in hydrogel,438,450 sol–gels,431 or poly(hydroxyethyl methacrylate).56,419 Also an electrophoretic deposition procedure has been reported by placing a film of fluorescein and 1-heptanesulfonate cointercalated in a layered double hydroxide matrix.413
4.1.4. Rhodamine and Rhosamine Dyes
Rhodamine and rhosamine dyes are bright fluorophores with good photostability,451 which also were found useful for construction of pH probes. pH-sensitivity usually relies on introduction of PET groups or spirolactam opening. Interestingly, the modulation of fluorescence by PET-active amino groups strongly depends on the position of the receptor. For instance, efficient PET quenching was observed for the rhosamine with PET-groups at the xanthene core (Figure 19C),152,452 whereas no modulation of fluorescence occurs for the molecule with the PET group attached to the periphery (Figure 19C).373 Yet, the PET-groups are not necessarily required to be coupled to the fluorophore. Zhou et al.453 prepared nanoparticles with the rhodamine and the PET-group copolymerized in close proximity. Several rhodamines that explore lactam formation have also been reported (Figure 19C).410,454−460 The spirolactam form at neutral pH is colorless, whereas opening of the ring in acidic media yields a highly absorbing and fluorescent rhodamine. The pKa of spirolactam rhodamines can be tuned by varying the substitution of the group attached to the spirolactam group; the dyes with pKa values from 2.8 to 6.5 have been reported.454,461 Unlike many other systems, the influence depends to a large extent on the steric effects of the substitution. Substitution on the spirolactam group can also be used for covalent immobilization. Yu et al. have modified a rhodamine spirolactam with an acrylic functional group for free radical polymerization.462 The rhodamine monomers were copolymerized with methacrylic acid to prepare pH-sensitive nanoparticles based on the spirolactam opening in acidic media. The nanoparticles with pKa values of 6.07 and 6.71 were then used to measure lysosomal pH. An interesting approach for measuring acidic pH values consists in the conjugation of a rhodamine to a naphthalimide dye.463 The mechanism involves quenching of the naphthalimide fluorophore by PET from the rhodamine. The dye conjugate was copolymerized with 2-hydroxypropyl methacrylate and enabled pH measurement in the range from pH 1.40 to 3.60.
4.1.5. 1,8-Naphthalimide Dyes139,463−476
These are probably the most common representatives of PET dyes. The PET group (most commonly an amine) can be introduced at the imide position or via core substitution (Figure 20A). The PET efficiency differs significantly for the two positions. PET is inhibited when the electron transfer process to the fluorophore has to occur against a repulsive local electric field (PET quenching from the imide position to the core of 4-amino-naphthalimides).134,139 On the contrary, PET quenching is efficient if there are electron withdrawing substituents, usually in 4-position or if the PET-receptor is attached to the 4-position.134,139,472 The introduction of electron-donating amino-group into 4-position of the core also generates a push–pull system with an ICT excited state. This results in broad and bathochromically shifted absorption and emission bands and enhances the molar absorption coefficients. For example, the absorption and emission maxima are at 418 and 535 nm, respectively, for the naphthalimide bearing a dimethylamino-group in the position 4, compared to 341 and 370 nm, respectively for unsubstituted naphthalimide.477 Nevertheless, even amine-substituted naphthalimides show comparably low brightness, which is due to moderate molar absorption coefficients of about 15 000 M–1 cm–1, even though the quantum yields can approach unity in organic solvents.134,478 On the other hand, the imide position offers simple access to covalent immobilization via copolymerization of acrylic467,476 or allylic468,470,475 functional groups, amide bond formation,469,471,473 or direct bonding via the imide function.471,473 Naphthalimide-based PET indicators carrying a 2-hydroxyethylsulfonyl function for covalent conjugation to cellulose and textiles were also synthesized and immobilized.479
In a typical example,469 a piperazine moiety is covalently linked to the naphthalimide fluorophore. Quenching by PET from piperazine to the naphthalimide is modulated by protonation of the piperazine nitrogen. The effect also occurs in a rather rigid sol–gel matrix. The signal increases by >100% upon protonation, and the sensor works in the physiological (pH 5–8) range. New PET-based naphthalimide pH indicators (typically carrying tertiary aliphatic amino groups) and ways for immobilization on arrays have also been presented.473 Majority of reported naphthalimide indicators utilize aliphatic amines as PET quenchers that significantly limits the range of available pKa values. To address this limitation, Qi et al.466 prepared a palette of naphthalimide indicators equipped with aromatic amines and phenols as PET quenchers that show pKa values from 2.5 to 12. Virtually identical spectral properties of these dyes made possible preparation of wide dynamic range sensors (section 13).
Core-substitution of naphthalene diimides (Figure 20A) allows modulation of spectral properties and introduction of both pH functionalities and groups for covalent immobilization.480 For example, Shen et al. modified the chromophore core with two piperazine moieties, one acting as a PET group, the other for copolymerization (after reaction with methacryloyl chloride) of the dye with 2-hydroxyethyl methacrylate.481 The absorption of the copolymerized purple dye peaked at 570 nm and the emission at 630 nm. The sensing membrane features an apparent pKa´ of 6.0.
4.1.6. Perylene Diimides (PDIs)
PDIs122,123,139,373,482,483 can be viewed as π-extended analogues of naphthalene diimides. However, even core-unsubstituted dyes absorb very efficiently in the green part of the spectrum and emit green-yellow light with QYs close to unity. These dyes are known for their exceptional photostability. The photostability of tetrachloro-derivatives in aqueous solution is poor.122 This may be due to photoinduced nucleophilic substitution reactions. Electron-donating substituents introduced in the bay position cause pronounced bathochromic shift of the spectra. For instance, tetraphenoxy-substituted dyes absorb at 578 nm, show emission at 620 nm373 and retain quantum yields close to unity typical for this group of dyes. Introduction of a single amine donor in the bay position (Figure 20A) results in even stronger bathochromic shift.123,484 These dyes absorb in the red and emit in the far-red part of the electromagnetic spectrum making them promising for application in pH sensors where low levels of background fluorescence are of particular importance. Unfortunately, the substitution also results in significant broadening of absorption and emission bands, decrease of ε (to about 19 500 M–1cm–1)123 and of QYs (to about 0.26).123,484 To render PDIs pH sensitive a PET group is introduced in the imide122,139,373 or bay123,482 position.
The absorption and emission of PDIs can be bathochromically shifted when the dyes are laterally extended in the bay region.483 By condensation with benzo nitriles, one or two pH sensitive imidazole structures are attached to the perylene core. The indicator dyes feature molar absorption coefficients of around 80 000 M–1 cm–1 and quantum yields close to unity. Deprotonation of the doubly substituted dye results in further bathochromic shift of the absorption, which is 100 and 150 nm for the monoanionic and dianionic forms, respectively. The corresponding pKa´ values in a hydrogel matrix are in the range from 9.84 to 10.56.
Exceptional photophysical properties including excellent brightness (albeit not for the perylenes substituted in the bay position with N-donors), multiband absorption spectrum (making efficient separation of excitation and emission possible) and high photostability make PBIs a promising class of pH indicators. On the other hand, the perylene core is highly hydrophobic which results in tendency to aggregate when noncovalently entrapped into hydrophilic matrices, making covalent immobilization of these dyes essential for practical use.123
4.1.7. Boron-dipyrromethenes (BODIPYs)
These dyes are bright fluorophores with highly versatile structures and spectral properties (Figure 20B).485−489 The simple BODIPYs absorb in the green region, but absorption can be shifted to the far-red and NIR region by π-extension or introduction of push–pull systems.490 The BODIPY-chromophore itself is insensitive to pH but pH sensitive groups can be attached in α or meso-position. However, comparably few pH probes on their basis have been reported65,491−502 and even fewer have found application in sensing materials.65,135,493,503,504 For instance, a dimethylaniline group acting as a PET receptor has been introduced in meso-position of the BODIPY to give a pH indicator for the acidic region.65 The BODIPY immobilized in a hydrogel covers the pH range from 0.5 to 2.5. Only some leaching at very low pH was detected. Later, Ando et al. introduced the dimethylaniline receptor in α-position of a BODIPY to prepare a ratiometric pH optode for use in pH range 0.8 to 4.5.503 Ratiometric readout was enabled by a pH-dependent spectral shift due to ICT. The indicator dye was covalently immobilized on activated porous silica glass via formation of a urethane. Response time, however, was comparably slow (>11 min) for a pH change from 1.19 to 1.54. Phenol groups acting as PET receptors for the alkaline region (pH > 9) have been introduced into meso-position of the BODIPY to give pH sensors when immobilized in hydrogels matrices.493,504
4.1.8. BF2-Chelated Tetraarylazadipyrromethene Dyes (aza-BODIPYs)
Compared to BODIPY dyes, they show bathochromically shifted absorption and emission spectra but lower quantum yields.485 These dyes show excellent photostability and great versatility with regard to the position of the PET receptor which is most commonly a phenol.151,505−509 The PET groups can be introduced in 3- and 5-position of both pyrrole rings, and hence, the relatively simple synthesis of asymmetric aza-BODIPYs provides even more flexibility. The other half of the dye can be used to attach substituents improving solubility or to enable covalent immobilization. Generally, deprotonation of phenol receptors bearing hydroxy group in para-position results in virtually complete fluorescence quenching due to PET but also in a bathochromic shift of the absorption spectra due to additional intramolecular charge transfer. Staudinger et al.510 identified a strategy to prepare aza-BODIPY pH indicator dyes solely based on PET. By consideration of the position of the PET receptor (Figure 20, phenol meta to attachment position) intramolecular charge transfer can be eliminated by avoiding conjugation of the receptor to the chromophore system.
4.1.9. Diketopyrrolopyrroles (DPPs)
(Figure 20B)511,512 These feature absorption and emission in the green to red region, moderate molar absorption coefficients around 25 000 up to 45 000 M–1 cm–1,513 high quantum yields and moderate photostability. Aigner et al. designed DPPs with pH sensitivity based on two different strategies: the use of phenolic PET groups and the deprotonation of the lactam nitrogens of the DPP chromophore.511 The lactam-based strategy enables pH sensing in the pH range 9–12. Co-immobilized with Macrolex Yellow as reference, RL100 nanoparticles were prepared and enabled RGB camera based readout.
4.1.10. Cyanine Dyes
(see Figure 20B)367,368 These are versatile tunable fluorescent labels with long wavelength absorption and emission, yet impaired by their poor photostability and poor solubility in most matrices. Probably due to this fact, cyanine dyes have only occasionally been used for fluorescence-based pH sensing.329,369 Zen and Patonay investigated the feasibility of using a cationic NIR-cyanine electrostatically immobilized on Nafion for pH sensing.369 The sensing membrane underwent no leaching and covers the pH range 11.5–13. However, the charged matrix introduced strong influence of ionic strength on pH measurement. Puyol et al. developed optodes based on NIR-norcyanine dyes immobilized in plasticized PVC.329 The sensing membranes displayed pKa´ values ranging from 3.89 to 8.02 and response times (t90) of below 1 min. The practical application, however, is limited due to leaching of the acidic form of the dyes and by photobleaching.
4.1.11. Free-Base Porphyrins
In this case, the pH sensitive groups are the protonable pyrrole moieties of the macrocycle (see Figure 20B). Such porphyrins feature high molar absorption coefficients and large Stokes shifts (if excited in the Soret band). Unfortunately, accessible pKa´ values are limited to the acidic range. For instance, sensors based on immobilized free-base porphyrins enabled pH measurements from pH 0.6 to 3.8514 and 1.5–5.515 The sensor that utilized a pH-sensitive naphthalimide dye in addition to the porphyrin had an extended range from 1 to 9.5.465 Generally, a serious drawback of the sensors based on free base porphyrins is tendency to complexation with metal ions that may be present in a sample. This can render the indicator dyes pH insensitive or change the mechanism of pH sensitivity. For example, a tin porphyrin complex incorporated into a polyethylene glycol hydrogel was found to display pH-responsive fluorescence that was used in an implantable sensor.516 Here, the axial water molecules of the tin porphyrins can deprotonate to yield a hydroxide-coordinated metal.
4.1.12. Triangulenium Dyes
This rather new class of pH probes (see Figure 20) is based on a cationic triphenylmethylium structure rigidified by bridging hetero atoms, generally oxygen and nitrogen.517 These highly stable carbenium ions absorb light between 450 and 650 nm. Replacement of one or two oxygen atoms from the trioxa-derivative by nitrogen induces a red shift. All representatives exhibit moderate molar absorption coefficients (10 000–20 000 M–1 cm–1) and moderate to high quantum yields. Mono- and diaza- derivatives are of special interest for optical sensing due to their relatively long fluorescence lifetimes (around 20 ns), which enables elimination of most autofluorescence by making use of time-resolved fluorometry.518 pH sensitivity is introduced via PET-receptors attached to the aza-position. Analogously to other PET-based systems, the pKa can be tuned by substitution on the receptor group.519 The second aza-position can also be used to introduce functional handles for covalent immobilization. Frankær et al. covalently immobilized diaza representatives in ormosil matrices for preparation of ratiometric fiber-optic sensors and biocompatible sensor spots.520−523 Dalfen et al.524 prepared diazatriangulenium dyes equipped with different receptors and immobilized them in polyurethane hydrogel. It was found that immobilization induced the decay time (section 10.2) to become pH sensitive. They attributed the pH sensitivity to a homo-FRET process. They also showed that anion composition of the sample has strong influence on the pKa of the indicator in the hydrogel matrix.
4.1.13. Miscellaneous Indicator Dyes
Various pH indicators from other dye classes have been reported,66,525−533 but only found niche application. These are described in the Supporting Information Table S3.
4.1.14. pKa and Dynamic Range Adjustment for Fluorescent Indicators
Limited dynamic range of the pH indicators implies the necessity of adjusting the pKa value for a particular application. The pKa value of an indicator, ideally, is in the middle of the pH range to be measured. It is often desirable to obtain a library of indicator dyes based on a single chromophore class, although indicators of different classes are known that match best different applications. Such approach minimizes the synthetic effort and simplifies the read-out instrumentation due to similar spectral properties of individual indicators. In addition, it allows preparation of wide dynamic range pH optodes based on the mixture of indicators with different pKa values (see section 13, for more details).
Generally, the acidity of the pH indicators based on deprotonation of hydroxyl group can be tuned over a wide range by introducing electron-withdrawing (halogen atoms, carboxy, sulfo, sulfonamide, or nitro groups) or electron-donating substituents, such as amino or methoxy groups.
Modification of the xanthene structure represents a nice example of tuning the pKa value over a broad range. The strategy is essentially similar to that used for triphenylmethane dyes. The electron-withdrawing groups introduced into the 2′,7′-positions of the xanthene ring decrease the pKa value. For instance, lipophilic octadecyl esters of 2′, 7′-dichlorofluorescein (DCFODE), 2′-monochlorofluorescein (MCFODE), 2′-chloro-7′-hexylfluorescein (CHFODE), and 2′, 7′-dihexylfluorescein (DHFODE) reported by Weidgans et al.121 (Figure 21A) embedded in a hydrogel showed pKa values of 5.56, 6.85, 6.96, and 8.5, respectively (ionic strength 0.1 M). The pKa´ value of 5(6)-carboxy-2′,7′-difluoro-fluorescein (oregon green) in aqueous solution is 4.8,534 which is similar to that of 2′,7′-dichlorofluorescein in the same media (5.19).535 Further fluorination in the 4′ and 5′ positions (Figure 21A) of the chromophore reduces the pKa´ to 3.7 (aqueous buffer)). The electron-withdrawing substituents improve the photostability of the dyes, but electron-donating alkyl chains, reduce it. In fact, photodegradation of DHFODE-based sensors was reported to be fast.110,121
Figure 21.

Structure–pKa´ value relationship in fluorescent indicators libraries exemplified for fluoresceins (A) and BODIPY dyes (B).
pH indicators based on quenching via PET are even more versatile with respect to tuneability of the pKa values due to a variety of available receptors. For instance, alkylamine receptors render the dyes pH sensitive in slightly basic and near neutral media (pKa of morpholine is 8.50,536 but it can decrease upon attachment to the fluorophore). Aromatic amines are protonated in more acidic media (pKa values of aniline and N,N-diethylaniline are 4.87 and 6.57, respectively).536 Alkylation of aromatic amines in most cases increases the pKa value. Rurack and co-workers used PET receptors to create a library of fluorescent indicators covering the whole pH range from 0 to 14 (Figure 21B).135 A hexaalkylated BODIPY core was substituted with PET receptors based on phenol, aniline or pyridine groups. The indicator dyes display pKa values (in the hydrogel matrix) increasing from 0.5 to 12.8. The general approach for tuning the pKa of the receptor groups was introduction of electron withdrawing substituents to decrease and electron donating substituents to increase the pKa. To demonstrate the utility, a sensor array with the dyes incorporated into hydrogel D4 was designed and enabled readout with a smartphone and an uncertainty of only ∼0.1 pH units. Similar strategies (albeit with a lower number of utilized pH sensitive groups) were adapted to create a palette of pH indicators based on naphthalimides and aza-BODIPY dyes.505
In summary, there is already an impressive amount of fluorescent pH indicators that found application in optical sensors (c.f., Table S3). The sensors reported by different groups appear to show adequate performance in described applications. However, it remains open if these systems can also adequately perform in other applications. As was demonstrated above, for several chromophores impressive palettes of pH indicators have been reported with pKa values covering a broad pH range. However, designing a material with required performance is much more than just taking a dye with suitable pKa value. Whereas stability of the chromophore can be adequate for relatively short-term usage (e.g., in disposable sensors), it may not be the case if the sensor has to maintain high accuracy during many months without possibility of recalibration (like on Argo floats in oceanography). For instance, BF2 chelated chromophores (BODIPYs and aza-BODIPYs) may exhibit slow decomposition in aqueous media, the drift being temperature-dependent537 and probably pH dependent. Photostability is a critical parameter if high light intensities are involved (e.g., in microscopy or in fiber-optic microsensors). This parameter often is not discussed at all, in the best case some information about sensor drift during continuous interrogation is provided. Evidently, taking into account dramatic differences in the set-ups used such information can only serve for orientation purposes. Therefore, a systematic comparative study of photostability of different chromophores used as pH indicators would be extremely valuable. Surprising discoveries are possible, such as a dramatic enhancement of photostability of some π-extended BODIPY chromophores compared to the “classical” structure shown in Figure 20B.538 Some applications (biotechnology, medicine) require sterilized sensors and the stability of the chromophores in sterilization conditions (e.g., exposure to γ and β radiation) is mostly unknown. Lack of this essential information makes selection of an indicator a difficult and frustrating task, particularly taking into account that most of the reported dyes are not commercially available and can only be accessed in a multistep synthesis.
4.2. Metal–Ligand Complexes
Compared to fluorescent organic probes, most luminescent metal–ligand complexes (MLCs) possess longer decay times, which can be advantageous for discrimination of background fluorescence and even its elimination in a time-resolved measurement. Phosphorescent MLCs also feature larger Stokes shifts compared to fluorescent dyes, because of the lower energy of the triplet state. Finally, pH-sensitive MLCs potentially offer a unique possibility of performing decay time measurement with phase fluorometers. Unfortunately, several limitations have so far prevented widespread use of MLCs in pH sensors. First, the brightness of most MLCs is often lower than of fluorescent organic dyes. With some exceptions, molar absorption coefficients rarely exceed 40 000 M–1 cm–1, whereas the luminescence quantum yields are typically well below 1 and are in the range of 0.05–0.5 for most dyes. The second limitation is efficient quenching of long-decaying luminescence by molecular oxygen. The sensitivity of dyes to oxygen is proportional to the luminescence decay time of the indicator and the oxygen permeability of the immobilization matrix that typically is rather good in case of polymers used for pH sensing. The choice of potential candidates is limited to dyes with decay times below 5–10 μs for which oxygen cross-talk is acceptably weak and can be neglected or compensated for. Europium(III) and terbium(III) chelates represent a notable exception since partly filled f-orbitals only weakly interact with the environment so that the excited states are only marginally quenched by oxygen despite long luminescence decay times typically exceeding 100 μs. On the other hand, all terbium(III) and most europium(III) chelates require UV excitation, which is often not desirable.
For the above reasons, only a few MLCs have been applied in pH sensing materials (c.f., Table S4) despite many examples of such dyes showing pH-dependent luminescent properties in solutions.539−549 The probe reported by Uray and co-workers550 is particularly interesting in this respect due to strong lifetime response from pH 4 to 7.5 (about 8-fold decrease), that provides self-referencing capabilities, and successful commercial applicability (Luxcel Biosciences/Agilent).549 In contrast to solution behavior, the luminescence of the probe immobilized in a sol–gel matrix is not affected by pH changes (pH 1–11).550 The immobilized dye is however useful as large Stokes shift emitter in sensing schemes that utilize energy-transfer or inner-filter effect.
Among metal–ligand complexes applied in optical sensing materials, Ru(II) polypyridyl complexes have been widely explored. They show broad metal–ligand charge transfer absorption bands in the region of 430–480 nm and are luminescent in the red part of the spectrum. Demas and co-workers551 have noncovalently immobilized ruthenium(II) polypyridyl complexes (1 and 2, Figure 22A) into a cross-linked hydrogel composed of hydrophilic PEG chains and hydrophobic cyclic methylsiloxane rings. The sensors undergo a drastic decrease of luminescence intensity upon deprotonation (∼100-fold) and pKa´ values are very low (2–4). A similar indicator 5 (Figure 22A) that explores the pH sensitivity of 4,7-dihydroxy-1,10-phenanthroline was embedded in Nafion 117 membrane.552 Because of the negative charge of sulfo-groups in Nafion, the pKa´ increased to 5.1 compared to the value of 2.6 obtained in solution of the dye and the cross-talk to ionic strength was very strong (decrease of pKa´ by ∼1 on going from 0.01 to 0.1 M buffer).
Figure 22.

Chemical structures of luminescent ruthenium(II) polypyridyl (1–6) and lanthanide (7–9) complexes used in optical pH sensors, and of model compounds 10, 11 that were used in solution studies.
Apart from phenols, other functionalities may be useful to induce pH sensitivity of Ru(II) complexes. For instance, Malins et al.553 showed that triazole group introduced into a Ru(II) complex (6, Figure 22A) induced luminescence quenching upon protonation.
Suitability of Ru(II) complexes for lifetime-based pH sensing was also investigated.554 Complexes 3 and 4 were noncovalently entrapped in a hydrogel. Upon deprotonation, the emission of 4 is enhanced and hypsochromically shifted. Both forms are emissive and this enables lifetime based sensing. The lifetime increases about 3-fold when the pH was increased from 1.5 to 6 (sigmoidal dependency, pKa´ 3.75). Significant cross-sensitivity to oxygen is observed in agreement with long decay times (3.25 μs of base form).
Fiber-optic sensors prepared by Goncalves et al.555 made use of complex 3 immobilized into sol–gel glasses. In solution, the dye showed good pH-sensing properties, sigmoidal response of intensity, large dynamics in intensity change (5-fold increase from pH 2 to 6) and acceptable dynamics in the lifetime (increase from 0.4 to 0.6 μs in the same range). However, immobilization resulted in drastic decrease of the resolution: Intensity increases by only 30% going from pH 2.0 to pH 8.1, and the decay time only increases from 1.05 to 1.16 μs.
Parker and co-workers556 explored the potential of luminescent Eu(III) and Tb(III) complexes for optical sensing of pH. Narrow emission bands of these complexes and the long decay times are particularly attractive. On the other hand, such chelates have to be excited in the UV, which is less favorable. Two different types of Eu(III) complexes were embedded into sol–gel matrix prepared from TEOS. The sensor based on indicator 7 (Figure 22B) showed a ∼3-fold decrease of the red luminescence of Eu3+ on going from pH 4 to 10. It is caused by quenching via electron transfer from phenanthridine. On the contrary, the luminescence is 3.5 fold enhanced in case of 8 (pH 5 → 9) because of the reversible binding of the deprotonated sulfonamide group to the metal ion. Luminescent changes for both sensors can be described with a sigmoidal dependency; the pKa´ values were 6.9 and 7.9 for the sensors based on 7 and 8, respectively. The sensors showed fairly fast response (t95 ∼ 80 s) but required conditioning for 28 days to warrant reproducible response. In contrast to Eu(III)-complex of 7, the sensor based on Tb(III) complex showed luminescence enhancement (∼30%) in the pH range from 4 to 9. This is due to the proximity of the 5D4 level of Tb3+ and triplet level of the protonated phenanthridinium, which results in enhanced quenching because of energy back transfer. The brightness of such probes is not good. McCoy and co-workers demonstrated “on–off” luminescence switching for complex 9 in solution and in a pHEMA matrix.557 The complex is luminescent at acidic pH values, but shows virtually no emission at pH 9. Apart from the complexes mentioned above, a Eu(III) complex coordinating thenoyltrifluoroacetone and pyridine dicarboxylic acid was also explored in pH sensors.558
Apart from Ru(II) and lanthanide(III) complexes, Re(I) complexes have also been applied as luminescent probes in pH sensors (Figure 22C). Orange-emitting dyes reported by Demas and co-workers featured luminescence decay times of 751 (10) and 266 ns (11) in cross-linked hydrogel D4J2000 thus enabling elimination of background fluorescence without significant oxygen cross-talk.149 A 3-hydroxypyridine group coordinated to the central atom induces pH sensitivity. It was observed in an intensity mode since the complexes showed no detectable luminescence in alkaline media. Therefore, a dual lifetime referencing (DLR) technique was implemented. Re(I) complexes can be excited at <400 nm and feature low molar absorption coefficients (<10 000 M–1cm–1).
The above examples clearly show that optical pH sensors based on metal–ligand complexes currently do not favorably compare to optodes based on organic dyes. Low brightness and cross-talk to oxygen remain serious limitations. The Ru(II) polypyridyl-based sensors feature rather low pKa values and, thus, have limited application potential. While their long luminescence decay times can be useful for elimination of autofluorescence by using time-resolved fluorometry, this aim can be also achieved by optodes based on bright NIR chromophores. The biggest advantage of the luminescent metal–ligand probes can be the unique possibility to quantify pH via measurement of the luminescence decay time. For example, sensors based on indicators 3 and 4 appear to be promising candidates for lifetime read-out. As was demonstrated by Orellana and co-workers,559 the situation is significantly more complex. In the first type of a useful lifetime indicator (Figure 22D), the proton exchange in the excited state will be fast and the excited state equilibrium will be established before emission takes place (diabatic equilibration). This indicator type shows a single emission lifetime which varies with the pH value (Figure 23). In the second extreme case, the proton exchange is significantly slower than the respective deactivation rates, so that the protonated and deprotonated excited species decay independently of each other. In this case, the luminescence decay time is biexponential. The luminescence lifetimes do not depend on pH. This is in contrast to the corresponding amplitudes, which reflect the ratio of both species. The authors also showed that comparably fast irreversible excited state proton transfer from or to buffer species renders most luminescent indicators less useful. For instance, indicator 12 (Figure 22D), shows drastic dependency of the response on the buffer type and its concentration due to quenching of the acidic form of the indicator by buffer components (such as hydrogen phosphate). On the contrary, the bulky hydrophobic perfluoroalkyl chain in dye 13 retards the kinetics of the excited state proton transfer at the amide position. Hence, the response of the probe is independent of buffer composition and concentration. This demonstrates the self-referencing capabilities in which only the relative contributions of the overall decay depend on the solution pH (Figure 23).
Figure 23.
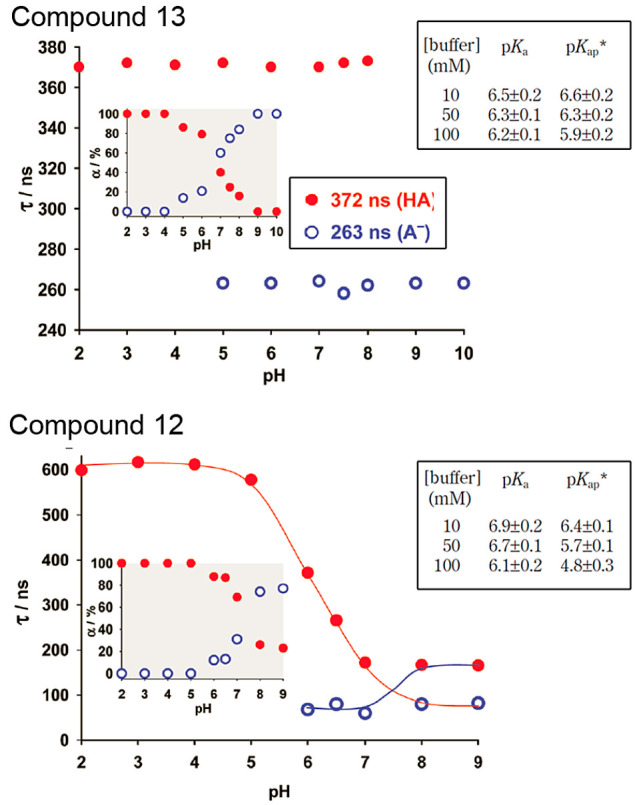
Luminescent lifetimes of the acidic and basic forms of 13 and 12 (Figure 22D) in 10 mM phosphate buffer (air saturation) as a function of pH. The inserts show the corresponding amplitudes of the luminescence lifetimes obtained from the biexponential fits of the emission decays at each pH value. Dependency of the pKa and apparent pKa´ values on concentration of the phosphate buffer is given on the right. Adapted with permission from ref (559). Copyright American Chemical Society 2010.
5. Polymeric Hosts and Supports
Polymer chemistry forms an integral part of sensor chemistry. Polymeric materials fulfill any of the following functions:
as a solid support onto which (or in which) an indicator probe is immobilized or dissolved; typical examples being hydrogels and cellulose;
as a permeation selective material that prevents species other than the proton to enter the sensing layer or a particle;
as a stimulus-responsive polymer (not treated in this section) examples being polyaniline or poly(dimethylaminoethylacrylamide) whose absorption in the visible and IR, respectively, change with the pH value;
as an inert mechanical support for planar sensor layers, examples being thin films of poly(ethylene terephthalate). These materials are treated in section 9.4.
5.1. General Considerations
A polymeric host performs the function of a solvent for the indicator but also acts as a permeation-selective membrane, which can minimize undesired cross-talks. Obviously, the polymeric host has to be permeable to protons. In other words, hydrophobic polymers such as polystyrene, ethylcellulose, silicone rubber etc. are not suitable for use in pH sensors. On the other hand, hydrophilic polymers which are able to swell (but are not soluble) in water (hydrogels) represent suitable hosts for pH indicators. The same refers to cross-linked networks built from organic polymers or inorganic materials (sol–gels). Finally, the indicators can also be immobilized on the polymer surface.
Proton transfer in the bulk water is generally accepted to result via proton hopping from H3O+ (or H5O2+) to a neighboring water molecule (Grotthus mechanism). Importantly, not an individual proton or a rigid molecular protonic complex is thought to migrate but the bonding situation in the network changes by concerted O–H bond breaking and making, illustrated by the term “structural diffusion”.560 Alternatively, a proton can be transported when attached to an uncharged host molecule (“vehicle mechanism” or Stokes diffusion). Obviously, proton transport in highly swollen hydrogels is similar to that in water. In case of sol–gels, hydrogen bonding involving the indicator and the silanol groups appears to have the major influence on the response times rather than proton diffusion.254 However, there is a consensus that proton transport is efficiently hindered by lipophilic substituents, for instance by alkyl and aryl groups in sol–gels.254,321 Unfortunately, only few systematic studies revealing the relationship between the structure of the matrix and the dynamic response times have been reported.
5.2. Organic Polymers and Supports
Uncharged hydrophilic linear polymers and cross-linked hydrophilic polymers are most often used in pH optodes. However, also pH sensors based on charged polymers and hydrophobic polymers have been described but they suffer from serious drawbacks (resulting from their charges or poor hydrophilicity) which will be described later. Apart from very few exceptions (such as plasticized poly(vinyl chloride)) the polymers are sufficiently hydrophilic and have high affinity for water. They are insoluble in water because they are physically or chemically cross-linked networks. Theoretical considerations predict that swelling of hydrogels is determined by the thermodynamic equilibrium between the opposing force of mixing and the retractive force of the polymer chains.561 One of the most important characteristics of a hydrogel is the polymer volume fraction in the swollen state which reflects the amount of water retained by the hydrogel. This parameter will affect proton diffusion in the hydrogel and therefore the response time of the sensor but also its mechanical stability. Hydrogels are elastic materials resembling natural rubbers and generally fully recover to their original dimension from a relatively small deformation (less than 20%).561 However, swelling of hydrogels is also known to negatively affect the mechanical strength of the materials.562 This can result in fast degradation of the sensing layer under mechanical stress, for example when using microsensors in sandy sediments. Such swelling may also result in detachment of the sensing material from the mechanical sensor support.
Among the hydrophilic linear polymers, poly(2-hydroxyethyl methacrylate) (pHEMA) and polyurethane hydrogels (such as hydrogel D4) belong to the most common matrices. Since these polymers are nonionic, the cross-talk of the pH-sensors to ionic strength is mainly determined by the charge of the immobilized indicator. Both polymers are biocompatible and find application in surgical implants and contact lenses and are soluble in a wide range of organic solvents and their mixtures with water (such as ethanol: water = 9:1, v:v)). A “cocktail” containing the polymer, the indicator and a solvent can be directly applied onto a mechanical support to result in a pH sensitive sensor layer after solvent evaporation. The simplicity of the process makes it possible to perform high-throughput screening and discovery of optimal polymeric substrates capable of trapping fluorescent pH indicators.563 For instance, more than 100 different polyacrylate and poly(acrylamide) copolymers have been screened using a microarray approach. Poly(methyl methacrylate-co-2-dimethylaminoethyl acrylate) was identified as the most promising candidate because it showed the highest dynamics between pH 4 and 10 when used in combination with 5(6)-carboxyfluorescein and allowed, via dip coating, the attachment of fluorescent pH probes to the tip of optical fibers.
pHEMA (Figure 24) is a rather hydrophilic polymer with a water uptake of about 40%. Swelling is significantly enhanced in the presence of urea and slightly reduced when chloride or sulfate ions are added.564 pHEMA containing copolymers generally represent good hosts for preparation of pH sensors. However, at extreme pH values (section 12) pHEMA-based materials may deteriorate due to hydrolysis of ester groups. Rather hydrophobic pH indicators tend to aggregate in pHEMA if entrapped noncovalently.122 Fortunately, many indicators can be modified with allylic, (meth)acrylate or acrylamide moieties and copolymerized with HEMA monomer. Alternatively, isothiocyanate derivatives of the pH indicators (e.g., fluoresceins or SNARFs) can be covalently attached to pHEMA.56 Amino-modified pHEMA variants can also be used for coupling of dyes via amide or sulfonamide bonds.381,384,423 The properties of pHEMA can be modified over a wide range via copolymerization of the HEMA monomers with other acrylate monomers. pHEMA does not degrade under physiological conditions.562
Figure 24.

Chemical structures of representative polymers as used in pH-sensing materials.
Polyurethane hydrogels have been used as matrices for immobilization of pH indicators since almost two decades. They benefit from high chemical stability, biocompatibility and are commercially available (Hydromed series, http://www.advbiomaterials.com). Unfortunately, the exact chemical structure of individual representatives is not disclosed. Polyurethane hydrogels reported in literature565−567 are composed of hydrophilic poly(ethylene glycol) blocks and hydrophobic domains build by the aliphatic isocyanate and butane-diol or poly(tetrahydrofuran) (Figure 24A).568 Often chemical cross-links are introduced via addition of polyol or polyamine.565,566 The commercially available Hydromed hydrogels are linear polymers that have excellent solubility in a wide range of organic solvents. However, their high water uptake, insolubility in aqueous solution and good mechanical stability indicate that microphase separation and physical cross-linking occur, which is typical for polyurethanes. This is due to a combination of hydrophobic interactions (aggregation of hydrophobic domains in order to minimize the surface area contacting with bulk water)569 and hydrogen bonding.565
Similar to PEG-based hydrogels, which are nontoxic, nonimmunogenic, and are approved for clinical use,561,562 polyurethane hydrogels are biocompatible (http://www.advbiomaterials.com). Among polyurethane hydrogels, hydrogel D4 (Hydromed D4) has been the most commonly used. It can take up as much as 50% of water.570 Hydrogels with higher water content (70%, Hydromed D1) and lower content (30%, Hydromed D7) are also available. Such polymers can well retain hydrophilic indicators carrying hydrophobic anchor groups (e.g., N-octadecyl-carboxamidofluoresceins)121 even without covalent immobilization. On the other hand, rather hydrophobic indicators (such as PDIs) tend to be localized in the hydrophobic domains. This can result in slower response and in hysteresis since the charged protonated form of the dye slowly migrates into more hydrophilic domains.123 The low polarity of the polyurethane hydrogels is also responsible for pronounced increase of the apparent pKa value upon immobilization of indicators generating negatively charged species upon dissociation (e.g., fluoresceins or HPTS-tris-amides382 or dyes equipped with phenol-based receptors in ref (135)) compared to the aqueous solutions and more polar polymers. Analogously, the pKa´ value for the indicators, which become positively charged upon protonation, would decrease compared to aqueous solution due to destabilization of the charged form in less polar environment (c.f., nitrogen based PET-receptors in ref (135)).
Thermogelating hydrogels (TGHs), such as poloxamer (a.k.a., pluronic), represent attractive alternative matrix materials. The poloxamer hydrogels are linear triblock copolymers of PEG and poly(propylene oxide). TGHs are highly biocompatible and easy to handle. They are water-soluble, and solutions are sprayable. pH sensor microparticles can be dispersed in Pluronic and sprayed on the surface of interest at temperatures of <20 °C.127 At these temperatures, the sensor gel adheres well to the target, even on uneven surfaces such as skin, wounds, and bacterial cultures. If temperature is risen to above 25 °C, the gels form a thin and soft but solid sensing layer, which can be imaged to observe the spatial distribution of pH values on such samples. The gel can be removed from surface by cooling and washing with water. Thermogelating sensor layers present obvious advantages over other sensors by not causing damage to the surface of interest. Such polymers also are applicable to sensors for other species including clinically relevant gases such as oxygen, but also for enzyme substrates (such as glucose or lactate) and ions. TGHs were found to be useful matrices for immobilization of pH indicators. Wang and co-workers demonstrated excellent pH-sensing performance of Pluronic-reinforced silica nanoparticles containing a covalently bound fluorescein dye.571
Block copolymers of the type polyacrylamide-alt-polyacrylonitrile572 also have been found to be quite useful and also are used in commercially available optical sensors.573 They have a chemical structure schematically shown in Figure 24A with alternating domains consisting of polyacrylamide and polyacrylonitrile. The former warrants good ion permeability, the latter good mechanical strength and adhesion on nonhydrophilic supports. They are known under the trade name Hypan. Hypan was used in planar sensors for pH574 but also for cations, such as potassium,575 and for anions, such as nitrate.576 Hypan is soluble in DMSO, well penetrated by water, but without strong swelling, and well biocompatible.
Other pH sensors rely on the use of rather hydrophobic hosts such as poly(vinyl chloride) or cellulose acetate (Figure 24B). To improve the ion mobility, addition of a large amount of a plasticizer is necessary (o-nitrophenyloctyl ether, dioctyl sebacate, tributyl phosphate etc., typically 1–3-fold the amount in respect to that of the polymer). It was recommended577 to replace, in optical sensors, the plasticizer o-nitrophenyloctyl ether by o-cyanophenylalkyl ethers, which do not act as a quenchers of luminescence and do not cause inner filter effects near 400 nm. The addition of a lipophilic salt (a quaternary ammonium salt for the negatively charged dyes and a lipophilic anion such as tetraphenylborate for the positively charged ones) is essential for solubilization of the indicator in a hydrophobic matrix. These optodes rely on the ion exchange mechanism:578 extraction of protons into the polymer results in protonation of the indicator, whereas the potassium ions diffuse out of the membrane to maintain electroneutrality. Such systems not only suffer from rather slow response (t90 = 3–12 min for 5 μm thick films)579 but also are affected by the composition of the buffer used for calibration. Similarly, Hakonen and Hulth580 observed a strong shift of the pKa´ (from 6.74 to 8.50). It may be due to the change in the environment of the indicator (HPTS in form of the lipophilic ion pair with tetraoctylammonium). Ethylcellulose films also containing tributyl phosphate as plasticizer show a pKa´ of 8.43 for the indicator.581
Another group of materials represents organic polymers in which the pH indicators are not dissolved but are rather immobilized into a certain domain or on the surface. Nafion 117 is highly chemically and mechanically stable perfluorinated membrane bearing charged sulfonato groups. The combination of a highly hydrophobic polymer backbone and hydrophilic sulfonato groups results in nanoseparation. The membrane, if swollen in water, consists of three different domains: a hydrophobic fluorocarbon backbone, hydrophilic ionic water clusters (⌀ ∼ 4.5 nm) interconnected by short channels (⌀ ∼1 nm), and a flexible interfacial region.582,583 Optical pH sensors have been manufactured by electrostatic immobilization of cationic pH indicators or of lipophilic indicators in the hydrophilic domains.228,332,369,533,552 However, the highly charged character of Nafion 117 results in cross-talk of the sensors to ionic strength552 (section 1.6). Hence, this material may not be an optimal choice. Similar to using Nafion as a cation exchange membrane, Zhujun and Seitz immobilized the negatively charged dye HPTS on the anion exchange membrane R-1035.37 Again, the cross-sensitivity to ionic strength was significant.
Cellulose represents another promising organic polymer for preparation of pH optodes. Usually, the dyes are covalently coupled or adsorbed to the polymer, which can be used either in the form of a thin film, or microparticles or nanocrystals.411 Thin cellulose layers can be obtained by hydrolysis of cellulose acetate coatings, for example, covering polyester support in transparency foils.16,111,215,239,322 This approach is highly advantageous since the material already contains a mechanically stable and optically transparent inert polyester support.
Agarose is a useful alternative to cellulose and more hydrophilic. Agarose was used, for example, in sensors utilizing orange(II),584 Congo red,214,215 sulfophthalein,309 neutral red,346,362 and anthocyanines342 as pH indicators partially after activation with epichlorohydrin. It was also used to physically immobilize fluorescent pH-sensitive nanoparticles for imaging of bacterial growth and metabolism.571
Agarose and chitosan (Figure 24B) have been used to coat glass slides.214,309,342,346,362 The indicator dyes were covalently immobilized after activation via epichlorohydrin or via simple dye adsorption. Chitosan341,343,438 found application as sensor matrix material in food packaging for spoilage indication based on pH-induced visually detectable color changes. Chitosan, however, is prone to biodegradation by enzymes, such as chitosanase or lysozymes.585
Alternatively, cellulose microparticles or fibers can be used for immobilization of dyes. Microparticles containing amino groups are promising because many pH indicators can be covalently immobilized on their surface (refs (30, 49, 80, 381, 396, 423, 425, 441, 466)). The pKa´ value of immobilized fluorescein isothiocyanate on aminoethyl cellulose fibrous particles was reported to be lower (∼5.2) than for fluorescein.49 This may be due to presence of residual protonable amino groups. Cellulose and aminocellulose as biobased materials are prone to degradation by enzymes originating from bacteria or fungi.585,586
Cross-linked hydrophilic polymers as shown in Figure 24 form another important group of organic supports. The linear forms are water-soluble and, therefore, not suitable for preparation of pH sensors. If, however, cross-links are introduced, the resulting hydrogels are mechanically stable and water-insoluble. The hydrophilic character and high water uptake of these sensors results in fast response. These hydrogels are nonionic, so that cross-talk of the pH optode to ionic strength is mainly guided by the properties of the indicator and not the matrix. Cross-linking also restricts diffusion of large molecules (such as proteins) into the matrix.587
Cross-linked polyacrylamide (PAM, Figure 24C) and its derivatives are probably the most common polymeric supports. The polymers have straightforward preparation procedures that give robust materials. Some indicators can be directly copolymerized with acrylamide (e.g., phenol red) without additional modifications. Other polyacrylamide derivatives were also found to be useful. For instance, Aigner et al.123,588 demonstrated that polyacryloylmorpholine (PAMP) cross-linked with poly(ethylene glycol diacrylate) represents an excellent matrix for immobilization of perylene dyes. Other matrices include cross-linked PEG gels. To obtain these gels, PEG-bis-methacrylates (Figure 24C) are useful as cross-linkers.561 The gels can be obtained via photopolymerization and indicators bearing allylic, meth(acrylate), or acrylamide groups can be covalently incorporated into the gels. Even highly cross-linked materials can have a water uptake of about 700%.589 Generally, water uptake decreases at higher cross-linking degrees (lower mesh size). The water uptake of cross-linked PVA increases from 400 to 800% when the mesh size (i.e., distance between the cross-links) increases from 1.8 to 6.5 nm.590 On the other hand, water uptake of cross-linked pHEMA only marginally depends on the mesh size because water is a rather poor solvent for HEMA.590,591
Micro- and nanoparticles prepared from cross-linked pHEMA or PAM derivatives are also popular. Here, amino-functionality is introduced during polymerization (e.g., via copolymerization with N-(3-aminopropyl)-2-methylacrylamide), thereby allowing subsequent covalent attachment of indicators.148,152,381,384,396,592 The microparticles can be conveniently dispersed in hydrogel matrices and mixed with other components, such as reference beads. Nanoparticles are valuable for intracellular imaging of pH values. Some linear polymers represent an alternative for these applications. For instance, a polymer on the basis of poly(N-(2-hydroxypropyl)methacrylamide) containing covalently attached ratiometric fluorescent pH indicator, a gadolinium(III) chelate and positively charged poly(2-(methacryloyloxy)ethyl]trimethylammonium chloride) for enhancing cell permeability was used for simultaneous pH measurement and MRI.593
Poly(vinyl alcohol)207,208,240,310,377 was cross-linked with glutaraldehyde, epichlorohydrin, diisocyanates, or via electron beam or γ-irradiation562,594 Cross-linked PVA was also used as a mechanical support to obtain a pH-sensitive membrane with immobilized phenol red.595 Alternatively, PVA can be cross-linked with tetraalkoxysilanes to obtain an organic–inorganic hybrid material.432 Homogenous crack-free layers obtained with 80–90% of PVA and 20–10% of TEOS showed fast and reversible response to pH. The change in the apparent pKa value over 2 months was attributed to the ongoing polycondensation reaction that is typical for sol–gels.
Demas and co-workers551 described hydrogels based on the amino-PEG derivative Jeffamine that was cross-linked with a cyclic siloxane bearing 3 isocyanate moieties. The material forms hydrophobic (siloxane) and hydrophilic domains which was found useful for immobilization of a lipophilic pH indicator without the necessity for covalent immobilization. Despite a high thickness of the films (250 μm), the response times were relatively fast (several minutes).
5.3. Inorganic Supports and Host Materials
5.3.1. Silicates (Including Sol–Gels and Ormosils)
The preparation of sol–gel materials involves several steps: hydrolysis of precursors (tetraalkoxysilanes or alkyl-trialkoxysilanes), deposition of the sol onto a support (typically glass), or a waveguide and drying for a prolonged time (24 h) at elevated temperature (e.g., 70 °C). Measurements are typically performed after 1–2 weeks required for stabilization of sensor properties due to slow aging. This is associated with drifts in the pKa´ values. In one of the first sol–gel-based pH optical sensors, a 5- and 6-carboxynaphthofluorescein was physically entrapped in a sol–gel matrix and was found to be surprisingly resistive to leaching.30 The sensor works in the pH range 6–9 and uses yellow or orange LEDs as light sources. The indicator dyes were also covalently immobilized on cellulose. However, many of the first sol–gel-based sensors suffered from both leaching of the indicator and long response times, often exceeding 1 h for the bulk monolithic films.596 The use of very thin films (>2 μm) along with evanescent field readout (see section 14.3) strongly reduces response time and yet gives good signals.
Most of the reported sol–gel sensors rely on the use of common pH-indicators that are not suitable for covalent immobilization. MacCraith and co-workers279 showed that leaching is affected by many factors, such as the pH of the solution and by conditions affecting the structure of the sol–gel. Base-catalyzed hydrolysis results in materials with large pores, which are less suitable for noncovalent entrapment of indicators due to strong leaching.267 On the contrary, acid-catalyzed hydrolysis and condensation produce microporous structure with small pores (<2 nm).597 However, if the pH is too low (<1), the condensation becomes too fast and this results in higher porosity and faster leaching.279 Leaching is much slower from aged films (3 months storage) compared to the freshly prepared. Finally, the introduction of hydrophobic groups (typically methyl or phenyl) results in materials referred to as ormosils (organically modified silica). This was demonstrated to efficiently prevent leaching.256,414 Unfortunately, such substitution also impairs proton diffusion and slows down the response. For instance, the response times (t100) of bromocresol green embedded into films prepared from tetraethoxysilane (TEOS) and methyltriethoxysilane (MTEOS) were 150 min and >24 h, respectively.254 In materials reported by Wang et al., dye-doped 1 μm thick sol–gel films prepared from TEOS showed surprisingly fast response (t95) of 5 s, whereas it increased to 600 s for an ormosil prepared from an equimolar ratio of TEOS and phenyltriethoxysilane (Ph-TEOS).321 The same effect was observed by Lobnik et al.:414 introduction of phenyl groups eliminated leaching of noncovalently immobilized aminofluorescein almost completely, but slowed the response from 90 s for tetramethoxysilane (TMOS) to 30 min for TMOS:PhTMOS (1:1) (t95, ∼300 nm-thick films). The decrease of polarity also drastically affected the pKa´ values (6.62 and 8.61, respectively).
Immobilization in sol–gels (particularly containing an organic component) affects the pKa´ value of the indicator compared to aqueous solution (usually by an increase of the pKa´ by 1–5 units for dyes generating negative charge upon deprotonation).256,598 It also results in a significant broadening of the dynamic ranges which can span 4–6 pH units266,321,407,442,459,469,472,503,599 compared to 3 pH units in solution. Ormosil-type of sol–gels were also doped with pH indicator dyes in order to sense alkaline analytes such as dissolved ammonia.600
Postmodification of the sol–gel pores is an efficient strategy for shortening response times.254 In sol–gels, hydrogen bonding between the hydrophilic indicator dyes and the silanol groups appears to be extremely important for the response time. Goddard and co-workers showed that treatment of sol–gel-based sensors with sodium hydroxide shortens the response times from 150 min to 45 s (in case of TEOS) and from 24 h to 22 min in case of MTEOS. Such modification occurs very fast but the risk of damaging of the sol–gel network is high.
During aging of sol gels, further hydrolysis and condensation of unreacted groups takes place. This results in an increased density of the sensor films. These structural changes induce drifts of the pKa and can represent a serious problem. For example, Lee and Saavedra observed a large (0.7) increase of the pKa value of bromophenol blue in TEOS based sensors after 9 months of storage.277 Lobnik et al.414 noticed the same increase (0.7 units) of the apparent pKa upon storage of aminofluorescein/TEOS films in air over several months (and much faster change at elevated temperature (70 °C)) whereas storage in aqueous media for the same time hardly affected the sensor properties. McDonagh et al.597 demonstrated that aging of sol–gel films at RT continues for many days and even months, which is indicated by decrease in the thickness of the films. 3-glycidoxypropyltrimethoxysilane (GPTMS) has been studied but with mixed results. It was cocondensed with TEOS,598 MTEOS,401 PrTEOS,520 sometimes under catalysis by BF3601 or aminoalkoxysilanes,442 with indicators, such as methyl red, bromocresol green, or fluoresceinamine.
Ion-pairing of a charged indicator with a lipophilic counterion is a common approach to minimize leaching. Rottman et al.228,602,603 investigated the influence of coentrapment of surfactants on the properties of pH indicators in sol gel films. The addition of cetyltrimethylammonium bromide (CTAB) strongly affects the pKa´ values, which were shifted by up to 3–4 units to more acidic values for azo dyes and to more basic values for phenolphthalein dyes.
Sol–gels based on elements other than silica have also been investigated. Beltran-Perez and co-workers studied sol–gels obtained via hydrolysis and condensation of titanium tetra-isopropoxide.604 They were made pH-responsive by doping with Brilliant green, coumarin or rhodamine dyes. However, the paper is of preliminary nature. Yang and Saavedra266 reported a waveguide sensor with a 110 nm sensing layer prepared via hydrolysis of methyltrimethoxysilane (MTMOS) and titanium tert-butoxide. Immobilized bromocresol purple responded over a wide range (pH 3.5–9). Islam et al.247,249,316 examined the properties of various silica–titania sol–gel composites prepared from TEOS and titanium tetra-isopropoxide as precursors and CTAB as surfactant. Response times were <7 s for both fiber optic and planar sensors, and no dye leaching was observed. A hybrid material for use in pH sensing was reported by Rosenzweig and co-workers.605 Carboxyfluorescein-doped liposomes (⌀ 70 nm) were embedded in a TEOS film. Immobilization did not significantly affect the pKa´ value (6.5 in liposomes) but strongly reduced dye leaching and improved response (<1 s for micrometer-thick films).
5.3.2. Mesoporous Materials
Mesoporous materials provide an interesting alternative to sol–gel sensors. They are obtained via hydrolysis and condensation of silicon alkoxide precursors but a surfactant is first added as a structure-directing agent and then removed via extraction. Wirnsberger et al.606 prepared sensing films (∼0.9 μm thick) by acidic hydrolysis of TEOS in the presence of a pluronic F127 poloxamer surfactant and APTS-coupled fluorescein. After aging at room temperature, crack-free films are obtained. The surfactant was removed by treatment with ethanol. The films demonstrated fast response t95 of ∼7s. Similarly, Miled et al.293 embedded bromothymol blue into a mesoporous material prepared from TEOS in the presence of CTAB as structure-directing agent (which, however, was not removed from the sensing material). The 1.5 μm-thick sensing layers responded quickly (<20 s) to pH changes in acidic media. Hiruta et al.607 covalently immobilized a triethoxysilane-modified BODIPY dye with a protonable dimethylamino group in a mesoporous film prepared via hydrolysis of TEOS in the presence of the surfactant Brij56, which was removed from the sensing film via extraction with hot toluene. The sensor works in the acidic pH range (pH 1–4).
In summary, sol–gel optodes excel by their mechanical stability. They withstand mechanical stress such as wiping with tissue,608 which can be useful for sensor cleaning (e.g., from biofouling deposits) also in the presence of detergents.599,609 They were also reported to withstand repeating autoclavation without change in sensing properties.608 In contrast to organic polymers, the sol–gels do not swell in organic solvents, which can be useful for measurements of proton concentration in solutions containing organic solvents.261 On the other hand, sensing properties of the optodes (apparent pKa value, response time, leaching of the dye) are sensitive to the ratio of the precursors used and reaction conditions (acid or basic catalysis, temperature, and time needed for hydrolysis). Many sol–gel films were reported to crack upon aging and storage. Sol–gel-based sensors also often feature pKa´ values, which are largely different from those of dyes in aqueous solutions and also cover a wider dynamic range. Hydrolytic stability of sol–gels should be kept in mind when designing sensors for basic pH range or using harsh sterilization conditions.
6. Immobilization of Indicator Dyes in Hosts
Leaching of pH indicators out of the sensor matrix represents a common problem of optical pH sensors. Leaching severely affects the calibration curves, also for majority of referenced sensors, except for sensors based on measurement of luminescence decay time or luminescence anisotropy. Many pH indicators are hydrophilic and prone to leaching into the aqueous samples. Leaching of the charged forms is particularly likely. There are several useful strategies to overcome leaching. A table with selected examples of immobilization procedures is provided in the Supporting Information (Table S5).
6.1. Physical Entrapment of Indicators
This strategy relies on the physical entrapment of pH indicators into a highly cross-linked matrix. It is important that the pore or mesh size (distance between the cross-links) of the cross-linked matrix is smaller than the size of the indicator. Mesh size is comparably high in hydrogels based on cross-linked polymers. For instance, highly cross-linked PEG-diacrylates have mesh sizes varying from about 1 to 14 nm depending on the molecular weight of PEG, its concentration and to a minor extent on the amount of cross-linker.589,610 The mesh size of swollen pHEMA hydrogels cross-linked with ethylene glycol dimethacrylate is 1.6–2.4 nm.590 Evidently, a mesh size of 1 nm and higher cannot prevent small dye molecules from leaching. This was demonstrated, for example, using tetramethylrhodamine as a model system.610 However, even in polymers with much smaller mesh sizes of 0.57–0.65 nm (cross-linked pHEMA) the diffusion of dye molecules, such as alizarin yellow, can be detected although it indeed decreased at lower mesh size.611
Physical entrapment of indicators in nanoporous sol–gel matrixes yields materials that show no leaching even in case of highly water-soluble indicators such as fluorescein or HPTS. For example, no leaching of physically immobilized fluorescein and phenolsafranine was recorded for silica nanoparticles of 30 nm in diameter.612 McDonagh and co-workers did not observe leaching of HPTS embedded in sol–gel obtained by hydrolysis of a mixture of ethyltriethoxysilane and (3-glycidoxypropyl)trimethoxysilane.383 HPTS was used, however, in the form of an ion pair with CTAB, which makes the indicator dye less hydrophilic and more bulky. Modifications of the sensor matrix to minimize leaching may, however, cause adverse effects, such as longer response times.321
Addition of surfactants can also reduce leaching because the amphiphilic molecules with their long alkyl chain tails can create a lipophilic environment for the indicator dye.602 In case of the negatively charged indicators, such as HPTS, quaternary alkylammonium ions with long aliphatic chains are preferred (Figure 25).354,383 The lipophilic ion pairs have been incorporated into PVC, silicone, hydrogel,354 and sol–gel matrices.383
Figure 25.

Physical entrapment as strategy for immobilization of pH indicators into matrices
Another common strategy relies on lipophilization of hydrophilic indicator molecules via chemical modification by introducing long-chain alkyl or perfluoroalkyl or tert-butyl groups. This is different from the previously discussed modification based on formation of ion pairs. The modified dyes can then also be immobilized by physical entrapment (Figure 25). For example, very hydrophilic fluoresceins are rendered water-insoluble via a long hydrophobic alkyl chain attached via ester bond or amide bond (carboxyfluorescein derivatives, Figure 25). Water-soluble HPTS can be made lipophilic by converting the sulfonate into N-alkylsulfonamide groups (Figure 25). Chemical modification, however, can strongly affect photophysical properties of the dyes. Whereas lipophilization of carboxyfluoresceins via modification with alkylamines in the 5(6)-position (Figure 25) has almost no effect on the photophysical properties, introduction of alkyl chains into 2′ and 7′ position of fluoresceins strongly reduces photostability and increases the pKa value. Hydrophobic HPTS sulfonamides (Figure 25) display bathochromically shifted absorption and emission maxima of the protonated and deprotonated forms.
Dyes conjugated to dextrans and chitosans have been immobilized in hydrogel,438 sol–gels,431 and pHEMA.56,419 On the other hand, attachment of such hydrophilic macromolecules may not be sufficient to prevent leaching431 even from cross-linked hydrogels. For instance, Kotsmar et al. demonstrated that fluorescein isothiocyanate (FITC) modified with a branched polysaccharide (MW ∼ 70 000; hydrodynamic radius 18.5 nm) does not enter cross-linked HEMA hydrogels, while FITC-labeled dextran (MW 20 000; hydrodynamic radius 9.3 nm) penetrates even 3.6 nm mesh size gels, albeit rather slowly.613
6.2. Covalent Immobilization of Indicators
Covalent coupling of the indicator to the matrix is the most reliable strategy to avoid leaching and migration of the dye, but often requires tedious synthesis or post modification of dyes. Reactive derivatives of several indicators (such as fluoresceins) are commercially available. The most common possibilities are exemplified in Figure 26. Among the absorptiometric indicators, the vinylsulfonyl chemistry common in textile industry was adopted by Mohr and co-workers16,17 to prepare reactive pH indicators such as 1. The 2-hydroxyethylsulfonyl group is then converted to a sulfato-ethyl sulfone in the presence of concentrated sulfuric acid. Subsequent treatment of these intermediates with base results in the formation of reactive vinylsulfonyl dyes. The latter react with polymers containing hydroxyl groups, most commonly cellulose,16,239 but also other polymers, such as pHEMA, PVA, or certain polyurethane hydrogels.208,238 The method was then extended to naphthalimide-based PET pH indicators with a 2-hydroxyethylsulfonyl function for covalent immobilization to cellulose.479 The vinylsulfonyl group also reacts in thiol-Michael additions614 and can be radically polymerized.208 Azo dyes also were covalently immobilized via (a) triazine coupling to cellulose,206 (b) coupling to PVA via an aldehyde prepared from vinylsulfonyl dyes,207,208 (c) copolymerization of vinylsulfonyl dyes with acrylic monomers,208 (d) coupling of Congo red to agarose after activation with epichlorohydrin,214,215 (e) carbodiimide coupling of Congo red to pHEMA,217 and (f) sol–gel reaction with trimethoxysilane coupled methyl red.228
Figure 26.

Covalent immobilization for immobilization of pH indicators into matrices.
Several reactive fluorescein-based pH indicators are commercially available which explains their high popularity in optical sensing despite poor photostability. For instance, 5(6)-carboxyfluorescein 2 (Figure 26) can be coupled to amino-modified pHEMA, PAM or cellulose via standard methods (e.g., DCC/EDC/NHS).30,143,397,411,415,420,423,428,448 Other dye classes with carboxy and amino groups have been also immobilized using amide bond formation, for instance azo dyes,217,224,228,615 triphenylmethane dyes,224 Nile Blue,217 or xanthene dyes,404,615 just to name a few.
Aminofluorescein 3 (Figure 26) can be reacted with acryloyl chloride to give 4, which was copolymerized with a variety of monomers including HEMA or AM.53,400,406,408,417,429,449,616 An analogous reaction was reported for piperazine substituted naphthalenediimide.481 On the other hand, aminofluorescein can also be reacted with 3-glycidyloxypropyltrimethoxysilane or 3-(trimethoxysilyl)-propylisocyanate to give a reactive derivative for immobilization in sol–gels.414 Interestingly, in case of the former, the pKa´ value of aminofluorescein was much higher (7.9) than for the dye in aqueous solution (6.62), whereas for the dye coupled to 3-(trimethoxysilyl)-propylisocyanate it was almost identical (6.73). FITC 6 (Figure 26) is undoubtedly one of the most popular reactive dyes. It can be directly coupled onto polymers containing amino or hydroxy groups (−OH, only under harsh reaction conditions), such as amino-modified polystyrene beads,405 aminoethyl cellulose49,425,441 and cellulose nanocrystals,411 amino-modified hydrogels,49 and amino-containing controlled pore glass,49 or reacted with 3-aminopropyltriethoxysilane to give 7 for sol–gel immobilization.404,421,606,617,618
If the polymer and the indicator share the same functional groups, reactive linker units like cyanuric chloride or epichlorohydrin can be used. These have two reactive sites, one for the dye, and one for the polymer. Cyanuric chloride was used to couple aminofluorescein to matrices such as cellulose or PVA,24,619 and an iminocoumarin to microbeads of aminocellulose and amino-modified pHEMA.396 Epichlorohydrin allowed coupling of Congo red and anthocyanines to agarose and cellulose films.214,215,342
The widely used pH indicator HPTS was immobilized in many ways. Representative examples include covalent linkage to an amino-modified solid support via chlorosulfonyl groups29 after prior protection of the hydroxy group, or by replacing one sulfo group by a methacryloyl group which then can be copolymerized with poly(ethylene glycol)diacrylate.379
The versatile toolbox of click chemistry offers attractive options in terms of covalent immobilization. For example, the pH-sensitive rosamine derivative 8 (Figure 26) was covalently immobilized into the pores of thiol-modified silica gel beads.152 Alternatively, it can be reacted with 3-mercaptopropionic acid to introduce carboxy groups for further modification. The thiol-Michael addition is another click reaction that has been used for immobilization of fluorescein on polymer-based nanoparticles.620 In this case, fluorescein-5-maleimide was used as Michael acceptor and coupled to thiol-functionalized particles.
As can be seen (Table S5), the above approaches were widely applied for immobilization of other functionalized pH indicators. Moreover, the same strategies can be adapted for immobilization of reference dyes. For instance, tetramethylrhodamine isocyanate was immobilized on the surface of silica nanoparticles modified with amino groups.404 Rhodamine B isothiocyanate was coupled to acrylamide and then copolymerized with 4.616
There is a number of less general methods. For instance, Peterson and Goldstein directly copolymerized phenol red with acrylamide.32 Umemura et al. used the vinyl groups of protoporphyrin IX to copolymerize it with acrylamide.339 A (p-hydroxyphenyl)porphyrin was covalently coupled to quartz optical fibers whose surface was modified with trichloro[4-(chloromethyl)-phenyl]silane.335 Dipicrylamine364 and Congo red218 were covalently coupled to cellulose that was activated in a two-step procedure. Various azo dyes have been directly synthesized on diazotized quartz and glass surfaces.15,222,223 Phenolphthalein was immobilized on amino-modified PAN fibers using the Mannich reaction.225,242 Phenolphthalein and o-cresolphthalein can be polymerized by reaction with formaldehyde.240 The resulting polymeric indicators were coupled to PVA. One should be aware of possible challenges associated with materials based on covalently immobilized dyes. Immobilization requires introduction of functional groups into the polymer. Many indicator probes are immobilized by covalent binding to amino groups or carboxy groups, but not all are bound to indicator molecules. Quite a few remain unmodified, and this introduces additional local charges (such as −NH3+ or −COO– groups). Residual charged groups that remain in polymer after coupling may affect apparent pKa values of the indicator due to formation of ion pairs with oppositely charged dye molecules, increase the cross-talk of the material to ionic strength or even act as fluorescence quenchers (e.g., via PET effect in case of NH2 groups for certain chromophore classes). Therefore, end-capping of the residual functional groups is advisable to reduce these undesirable effects. For example, the effect of amino groups may be reduced by acetylating them under appropriate conditions so not to acetylate the indicator dye. Excess carboxy groups may be eliminated by converting them into an amido group.
7. Materials with Dual Functionality (Indicator and Host)
7.1. Metal–Organic Frameworks
Metal–organic frameworks (MOFs) are crystalline solids characterized by extremely high structural diversity due to almost unlimited combination of metal ions and linkers and possibility of postmodification. Featuring high intrinsic porosity, they have been extensively investigated for gas-separation and gas-storage applications, in catalysis and for chemical sensing.621,622 Rocha and co-workers623 were probably the first who reported preparation of a pH-sensitive metal–organic framework. A material composed of Eu3+ and 1,10-phenanthroline-2,9-dicarboxylic acid showed typical lanthanide luminescence upon UV excitation (350 nm). The Eu3+ ions have luminescence peaks at 579 and 581 nm. The luminescence of the first peak increases linearly from pH 5 to 7.5 by about 30%. The intensity of the second peak remains constant thus providing the possibility of ratiometric pH measurement. Several limitations of the sensing material should be noted: (i) the peak maxima differ by only 2 nm; (ii) the overall quantum yield is 0.56, but the intensity of the analytically useful transition is about 2 orders of magnitude lower than the inert transition; and (iii) irreversible changes are observed at pH < 4 (due to protonation of the carboxylic groups) and at pH > 8 (formation of europium hydroxide).
Lu and Yan624 modified a bipyridine-containing MOF with Eu3+ and 2-thenoyltrifluoroacetone (TTA). Bipyridine binds Eu3+, which acts as an emitter, whereas the TTA ligand coordinates to the Eu3+ and acts as an antenna. The Eu3+ is located in two different environments, and only one of them is affected by pH changes. In fact, the red luminescence of Eu3+ (λmax 614 nm) remained unaffected by pH when excited at 330 nm. If excited at 375 nm a significant decrease of the luminescence intensity occurs on going from pH 7.7 to pH 5.0. Such a change is associated with protonation of the TTA antenna, which becomes only weakly bound to Eu3+ so that its sensitization ability decreases. Although such an effect can also be observed for Eu-TTA complexes in solution, the advantage of MOF is in its ability to retain the dissociated TTA molecules. The MOF decomposes at pH values of <4 and >8.
Zhang et al.625 modified silk fibroin powder with pyromellitic acid and Eu3+. In addition to the strong blue fluorescence of silk fibroin originating from amino acids, red luminescence from Eu3+ can be detected. The luminescence intensity moderately (∼25%) increased on going from pH 3 to 7. The intensity drops if the pH was further increased from 7 to 10 because of formation of europium hydroxide. A MOF composed of Tb3+ and viologen-functionalized m-benzenedicarboxylate was shown to have a luminescence response from pH 2 to 7.626
Li et al.627 have physically and electrostatically immobilized the Eu(III) thenoylacetonate complex (Eu(tta)n on synthetic silicate platelets via ion exchange. The resulting nanocomposites were deposited onto glass slide to form sensing films. Protonation of the antenna in acidic media resulted in complete disappearance of the characteristic red luminescence of Eu3+ peaking at 611 nm. The material showed sigmoidal response with a pKa´ value of 2.7. This makes it potentially suitable for monitoring very low pH values. The short excitation wavelength (345 nm) is a drawback, but the large Stokes shift is beneficial.
A triple-interpenetrated luminescent lanthanide-organic framework was reported that enables ratiometric measurement in the ranges from pH 2 to 7 and 7 to 10.5.628 The MOF is based on an amphoteric ligand (tetrabenzoic acid with two pyridine rings) and Eu3+. Upon excitation at 300 nm, the emission peaks at 390 and 480 nm are modulated by pH. The MOF can be combined with γ-Fe2O3 nanoparticles to allow magnetic manipulation.
Qi and Chen629 reported aggregated MOF nanoparticles (⌀ = 30–40 nm) composed of Tb3+, dimethylformamide and phenanthroline. The green emission is typical for Tb3+ and is 10-fold enhanced in acidic media (pH < 3.5). The luminescence lifetime of Tb3+ is, however, not affected by pH (τ ∼ 400 μs). The response of the network to pH is reversible and the stability in water is good. Common metal ions in 1 mM concentration do not interfere. Xia et al.630 prepared a MOF incorporating both Tb3+ and Eu3+, which showed ratiometric response from pH 3 to 6. This represents an advantage compared to the materials described above relying only on luminescence intensity, but the stability of MOFs remains a main issue.
As can be seen from the examples above, hydrolytic stability remains the main limitation of pH sensitive MOFs. Aguilera-Sigalat et al.631 modified a MOF composed of zirconium(IV) and 2-aminoterephthalic acid with an indole moiety via diazotation of the amino groups. It was attempted to increase the hydrolytic stability of the MOF in basic media, yet the performance in terms of sensing was not impressive. A similar strategy was utilized by Wang and co-workers632 who prepared a MOF on the basis of Zr6 clusters and 2,2′-bipyridine-5,5′-dicarboxylic acid, responsible for the intrinsic pH sensitivity of the material.
The MOF reported by Zhou and co-workers,633 in contrast, features exceptional hydrolytic stability even in boiling water and in aqueous solutions with pH values from 1 to 11. The framework composed on zirconium(IV) and meso-tetra(4-carboxyphenyl)porphyrin showed intrinsic NIR fluorescence from the metal-free porphyrin. Fluorescence increases in several steps (pH 1–6.5, 6.5–9, 9–10) corresponding to the formation of several forms of the porphyrin (dicationic, cationic, neutral and monoanionic). A similar MOF based on Zr(IV) and meso-tetra(4-carboxyphenyl)porphyrin was reported by Deibert and Li.634 The authors reported high stability of the network in acidic media and distinct color change from purple to green at pH ≤ 2 caused by protonation of the pyrrole nitrogens of the porphyrin. On the contrary, Lu and co-workers635 utilized deprotonation of the pyrrole nitrogens in a similar MOF prepared in the form of spherical particles (average size = 330 nm). The intensity of the red emission of the porphyrin increases from pH 9 to 11. Apart from the porphyrin, the MOF also incorporated magnetite nanoparticles and a rhodamine dye, which provided the MOF with magnetic properties and pH sensitivity in the range from 2 to 7, respectively. The main limitation of the porphyrin-based pH sensitive MOFs is potential interference from many metal ions that can be complexed by the metal-free porphyrin thus rendering the receptor pH insensitive.
Wu and co-workers636 described a stable MOF prepared from cadmium(II) and 5,5′-(ethane-1,2-diylbis(oxy))diisophthalic acid. It is stable both in highly acidic (pH 2.0) and highly alkaline (pH 12.2) solutions. Upon UV excitation (λ = 310 nm), the MOF showed emission band peaking at 350 nm and a shoulder at 410 nm. Fluorescence varies with pH values at <2 or >11. The use of Cd(II) ions makes such a sensor less attractive.
Xu and Yan637 prepared a MOF composed of Al3+ and 2-aminoterephthalic acid. Its blue fluorescence increases linearly from pH 4 to 7.5 by 25% and the response is reversible, but heavy metal ions interfere. Nonfluorescent Zr(IV) MOF nanoparticles (112 nm) were postmodified638 with the pH indicator fluorescein. The sensing properties of the pH sensor are similar to those of the dissolved dye. Its high brightness and efficient cellular uptake via endocytosis makes the MOF a promising tool for intracellular imaging of pH.
Nanoscale metal–organic layers were prepared and functionalized with a pH-sensitive fluorescein and an oxygen-sensitive ruthenium(II) bipyridyl complex linked to a hafnium(IV)-based framework to obtain a sensor material for ratiometric determination of both pH values and oxygen in live cells.639 Co-immobilized rhodamine B acts as a reference fluorophore.
In contrast to above MOFs, also a material with pH-dependent emission wavelength was reported.640 The MOF is prepared from carbazole based ligands and Zr6-clusters. Upon excitation at 365 nm, the emission peak shifts linearly from ∼420 to 600 nm when going from pH 1 to 8. The MOF degrades in aqueous solution with pH above 9. Interestingly, the pH sensitivity appears not to originate from the NH-group of the carbazole but rather from a conformational change in structurally flexible carbazole-based building block.
A smart approach was presented by Ding et al.641 who described a light-harvesting MOF nanoprobe for ratiometric fluorescence-based determination of pH values and temperature. The zirconium(IV) derived MOFs are self-assembled and combined with pH-responsive polymers, the MOF acting as the energy donor and the pH-responsive polymer conjugated to fluorophores acting as energy acceptor. In the light-harvesting system, the chain lengths of the stimulus-responsive polymer vary when the local pH value changes. pH values can be sensed between 3 and 8 under 420 nm excitation and by ratioing the emission peaks at 645 and 530 nm. The nanoprobe was applied to image pH values in HeLa cells.
It can be summarized that despite some promising approaches that have been described, the so far known MOF pH probes can hardly compete with better sensing materials. Disadvantages include (i) short wavelength of excitation and emission, (ii) low brightness, (iii) comparably small signal changes, and (iv) poor hydrolytic stability. Some MOFs have been reported to be stable over a broad pH range, but these materials suffer from other drawbacks as mentioned above. It also is often difficult to explain the pH effects on the luminescent properties of MOF, which makes rational design of improved materials challenging.
7.2. Conjugated Polymers
Conjugated (conductive) polymers, such as polyanilines, are colored, and some display fluorescence. If they contain protonable functions (such as amino groups or nitrogen ring atoms), their spectra are pH-dependent. Such materials possess the dual functions of an indicator and a matrix. This can be advantageous due to simplicity of sensor manufacturing and lack of leaching.
Carey and Jorgensen51 were probably the first who applied conjugated polymers for optical pH sensing. Poly(phenylquinoline), poly(biphenylquinoline) and poly(phenylquinoxaline) (Figure 27) were shown to display pH-dependent fluorescence, depending on the polymer, in strongly acidic conditions (0.1–8.4 M HNO3). The material was used to design fiber optic pH sensors.
Figure 27.

Chemical structures of the pH optodes based on conjugated polymers.
Polyaniline (PANI; see Figure 27) is a widely used conjugated polymer that functions as both a solid support and a pH probe. It can be conveniently prepared via oxidative polymerization of aniline in acidic aqueous solution. Ma and Mw values of 22 000 and 74 000 g/mol have been reported,642 but they are likely to vary significantly depending on the experimental conditions. PANI is an electrical conductor in the protonated state (Figure 27) and possesses strong NIR absorption (λmax 840 nm)68 that extends to beyond 1450 nm. The deprotonated form, in contrast, has an absorption maximum at 600 nm.68 Polyaniline has multiple pKa´ values. As a consequence, it responds to pH over a wide range (pH 2–12).55,68 Ge et al.55 were probably the first who deposited polyaniline onto a fiber core directly by polymerization. The thickness of the layer was controlled via the coating time (15–60 min) and the concentration of monomer in solution. Multiple evanescent field absorption was realized to warrant efficient absorbance, which was monitored in the NIR.
Pringsheim et al.68 utilized both visible and NIR absorption of various PANIs. The polymers were deposited on the inner wall of polystyrene cuvette. pH values were calculated from the ratio of absorbances at 600 and 840 nm. Unlike PANI, poly(2-bromoaniline), poly(3-chloroaniline), and poly(4-chloroaniline) are not sensitive to pH values between pH 1 and 12. Other conductive polymers possessed spectral properties similar to polyaniline but different pKa values. For instance, the pKa values for PANI, poly(2-toluidine), poly(3-toluidine), poly(N-methyltoluidine), and poly(diphenylamine) are 7.38, 7.23, 6.61, 5.42, and 10.5, respectively. The pKa´ from polyanilines from copolymerization of aniline and o-phenylenediamine could be adjusted by changing the molar fraction of o-phenylenediamine.643 The films were electrochemically deposited, and their absorbance changed in the range from 400 to 1000 nm with two isosbestic points at 465 and 830 nm. The authors later644 also prepared fluorescent beads (360 nm i.d.) coated with PANI that respond to pH values between 5 and 11 via an inner filter effect.
De Paoli and co-workers explored the pH sensing properties of a similar polymer, poly(o-methoxyaniline) as a composite with p-toluene sulfonic acid and cellulose acetate.645 The stability of the composite was high, allowing measurements within 9 months (albeit with recalibration every 10 days), but various salts have a strong effect on the titration plots.
Another group642 prepared sensing films by directly casting polyaniline and 10-camphorsulfonic acid from 1,1,1,3,3,3-hexafluoro-2-propanol. 1-μm thick films showed fast response (t90 ∼ 1 s) and operated reversibly for more than 300 h (500 cycles) without noticeable leaching of the polymer. However, the titration curves showed very strong hysteresis (∼1.5 units around the pKa´ value) on going from pH 2 to pH 10 and back. It should be mentioned that many PANI sensors are slowly decomposed by air. They also are affected by ascorbic acid, ozone, hydrogen sulfide, and NOx. This limits their applicability.
De Marcos and Wolfbeis investigated the pH sensing properties of polypyrrole.64 A thin polymer film (<1 μm) was deposited on the inner walls of polystyrene cuvettes. Polypyrrole possesses broad absorption in the range 400–1100 nm with a minimum at around 550 nm and a maximum in NIR. An increase of pH causes an increase of the absorbance between 600 and 900 nm and the shift of the absorption minimum from 600 to 500 nm. This corresponds to a color change from dark brown to green that can be observed visually. The pH dependence of the absorbance has sigmoidal shape (pH 5–12, pKa´ = 8.66) and is attributed to presence of hydroxy groups attached to pyrrole rings in the polymer. The response of the sensor was rather fast (10–20 s) and the calibration independent of the buffer composition. Unfortunately, the response of the material is not reversible at high pH values.
Few fluorescent conjugated polymers are known for use in pH sensing. Wang and co-workers646 reported a copolymer of fluorene and thiophene (PFPDA, Figure 27) modified with dopamine. The polymer has a strong blue fluorescence at low pH (λmax = 455 nm). At higher pH, dopamine is converted into a quinone form due to its autoxidation and the fluorescence is quenched via intramolecular electron transfer from conjugated polymer to quinone. Obviously, such a sensor relies on adequate oxygen supply.
Several reported pH-sensitive fluorescent conjugated polymers incorporate pyridine as a pH-sensitive group. Kappaun et al.647 reported on an alternating oligomer (Mn = 2300 g/mol) of 9,9-dihexylfluorene and pyridine (PFlPy,Figure 27), which showed pH-dependent fluorescence (pH range from −0.2 to +0.5) in a solid film triggered by protonation of pyridine.
In a similar work, Adachi et al.648 demonstrated reversible modulation of the fluorescence properties of poly(p-pyridinium phenylene ethynylene) (PPyPE, Figure 27) by pH. Protonation of pyridine in acidic medium results in about 2-fold decrease of the blue fluorescence (λmax = 455 nm), which is reversed upon addition of base. Unfortunately, only studies in a mixture of water and tetrahydrofuran were reported, so it remains unclear whether the material also works as a thin sensors film or in the form of nanoparticles. A conjugated hybrid polymer consisting of a polyfluorene-based conjugated backbone with thiophene units and carrying pyridyl moieties was reported to enable fluorometric sensing of pH value in the range from pH 4.8 to 13.649 The material was used to prepare sensor nanoparticles. If the pyridyl moieties are omitted, the fluorescence of the material is not affected by pH values.
Park and co-workers650 investigated the luminescence of poly(N-phenylmaleimides) (PPMI, Figure 27). Although not conjugated in the keto form, these polymers feature conjugated structures in the enol and enolate forms and are fluorescent, although the fluorescence is not very strong (QY of 5–11% depending on the solvent). A water-soluble block copolymer of PPMI and PEG showed ratiometric sensing capabilities in aqueous media (change from green to yellow fluorescence on going from pH 3 to 11) with fully reversible response. Importantly, the pH sensitivity was retained by incorporating the polymer into cross-linked polyethylene glycol diacrylate hydrogel.
In a different approach, Chan et al.620 prepared pH sensitive nanoparticles where a conductive polyphenylene-based polymer (PPE, Figure 27) was used as a fluorescent energy donor. pH functionality was introduced via a fluorescein moiety attached to the polystyrene backbone. Strictly spoken, this is not a conducting polymer with dual function, but a fluorescently doped conducting polymer. Both polymers were blended to obtain about 25 nm-large nanoparticles. Upon excitation with UV light, the conjugated polymer emits blue light (λmax ∼ 430 and 460 nm). The blue emission of the polymer is virtually pH-independent. On the other hand, the green emission of fluorescein is significantly enhanced upon deprotonation and ratiometric read-out becomes possible depending on the efficiency of FRET.
The pH sensing materials based on conjugated polymers are summarized in Table S6.
In summary, the earlier research was mostly focused on investigation of absorptiometric response of polyanilines. Despite reversible response and stability in solution, the performance of these materials is compromised by strong hysteresis of the response, poor stability of the materials on air, and sensitivity of the polymers toward reductants or oxidants. On the other hand, fluorescent conjugated polymers provide significantly higher flexibility in design and properties with potential benefits of high brightness (polymer is a chromophore itself) and absence of leaching. Additionally, nonlinear properties of the conjugated polymers (high two photon absorption cross sections) are particularly attractive for application in microscopy. However, currently their performance is compromised by high hydrophobicity of the backbone, which retards proton diffusion. We envisage that synthesis of significantly more hydrophilic conjugated polymers with pH sensing functionality will represent a significant progress in the field of optical pH sensors.
7.3. Genetically Encoded Fluorescent Proteins
Genetically encoded fluorescent proteins (GEFPs) proved to be essential tools for labeling of proteins, cells, tissues and whole organisms.651−659 GEFPs can be rendered sensitive to different analytes such as metal ions, nitrogen oxide, reactive oxygen species and used for noninvasive imaging of these parameters in vivo.651 Compared to molecular probes and nanoparticles, GEFPs have the advantage that they do not require an invasive procedure in order to be introduced into the cell. In addition, they do not disturb cellular functions, do not leach and can be adjusted to various wavelengths. On the other hand, photostability of GEFPs may be poor (in the same order of magnitude as of fluorescein).660 The most important class are green fluorescent protein (GFP) homologues. The “Phytofluors”, isolated from phytochrome proteins, form another class of such proteins. They display red and near-infrared fluorescence.657
Apart from the pH sensitivity intrinsic to most GEFPs, several pH probes have rationally been developed that feature improved fluorescence. These GEFPs fulfill the dual function of a pH indicator and a protein matrix. It protects the chromophore from undesired interferences. For intracellular measurements, the GEFP probes represent a promising alternative to molecular probes and nanosensors (see section 8 for more details) and benefit from their intracellular expression and high biocompatibility. Similar to fluorophores, the major properties to be considered are spectral properties, brightness, photostability and cross-sensitivity to other parameters.651 Some additional considerations are necessary to find a suitable GEFP for given organism and cell type. The brightness of the sample depends on the kind of protein expression, folding efficiency, chromophore maturation rate and stability of the GEFP to environmental parameters and aggregation.651,652 For the formation of the chromophore, the GEFPs need to reach a near-native conformation.651 Consequently, to increase the brightness, GEFPs with high folding efficiencies were developed.651 Depending on the targeted organelle, a GEFP with a suitable pKa for the prevailing pH has to be chosen. pH values can range from 4.5, in lysosomes, to around 8 in mitochondria.661 Most cancer-active cells have pH values of <6. These ranges are well covered by GEFPS with reported pKa values ranging from 2.7662 to 8.5.663
The pH sensitivity of most GEFPs relies on the deprotonation of a phenol moiety with a pKa usually between 5.2 and 7.2. Some GEFP representatives, however, have amino acids in the local environment that buffer chromophore ionization and therefore render them unsuitable for pH sensing.664 The emissive properties of the undissociated phenol group determine whether GEFP representatives can be used for ratiometric sensing. There is a large number of GEFPs that display only poor emission from the neutral chromophore. As intracellular pH calibration is impractical and the amount of chromophore is unknown, absolute pH values cannot be determined with GEFPs relying solely on fluorescence intensity measurements. These GEFPs are therefore limited to reporting temporal changes of pH.
Ratiometric GEFP probes, in contrast, do not require the knowledge of their concentration for pH values to be measured. Both ratiometric excitation and emission probes have been reported for GEFPs. For example, “pHlourin” displays excitation peaks at 395 and 475 nm for the protonated and deprotonated forms, respectively, and green emission for both forms at 508 nm.665 Analogously, the long-wavelength probe “pHRed” emits at 610 nm after excitation at 440 and 585 nm of the deprotonated and protonated forms, respectively.666 “deGFP” family represents ratiometric emission probes. The pKa values range from 6.8 to 8.0 and the proteins show a shift in emission wavelength from 460 to 515 nm upon excitation at 400 nm when going from low to high pH.667
The fusion of two GEFP variants having different pH sensitivities is another approach for design of ratiometric GEFP probes. For instance, pH sensitive mutants EGFP and EYFP were separately fused to form GFPuv.668 For both variants, dual excitation mode ratiometric sensing was possible, and for one of them also pH dependent FRET was observed. Analogously, the fusion of yellow fluorescent protein (YFP) acceptor variants with enhanced cyan fluorescent protein (ECFP) was used to create a family of FRET-based GEFPs for pH sensing, the “pHlameleons”.669 Contrary to development of other GEFPs used as pH indicators where mutagenesis is necessary, these ratiometric probes can be constructed by ligation of two literature-known GEFPs with known pH dependent characteristics.
The first GEFP probes were based on the use of green fluorescent protein. Given its success, large progress in design and optimization of red and far-red emitting proteins was achieved.656,657 These are even better suitable for intracellular imaging due to efficient elimination of (shortwave) autofluorescence, deeper light penetration and reduced phototoxicity. For example, Tantama and co-workers666 designed a ratiometric probe for intracellular pH imaging (called “pHRed”) featuring fluorescence peaking at 610 nm and two excitation peaks at 440 and 585 nm for deprotonated and protonated forms, respectively. Another red fluorescent protein (“pHuji”), reported by Shen et al.;670 combined attractive spectral properties (λexc = 566 nm, λem = 598 nm), large fluorescence change between pH 5.5 to 7.5 (22× enhancement of fluorescence) and a sigmoidal calibration curve.
The use of GEFPs with efficient two photon absorption enables even deeper light penetrations and superior signal-overbackground levels. The determined two-photon absorption cross section for various GEFPs vary significantly, but values in the range from 180 to 600 000 Goeppert–Mayer units indicate efficient two-photon absorption despite all controversies.671 Especially, the probes, deGFP4 and E2GFP, appear to be promising candidates for two-photon fluorescence-based pH-measurement.664,667
8. Nanomaterials
8.1. Nanoparticle-Based Sensing of pH Values
Nanoparticle-based sensor materials, commonly referred to as “nanosensors”, represent a comparably new optical sensors format. The definition of a nanosensor is analogous to that of a chemical sensor, with the restriction that its dimensions are supposed to be smaller than 1 μm672 or–in another definition–than 100 nm.673 With increasing size, materials or their aggregates cause increasing light scattering as the intensity of scattering (Rayleigh scattering) scales with the power of sixth of the particle diameter. Table 5 summarizes the different dimensions and characteristics of dyes, fluorescent proteins, and nanomaterials.
Table 5. Characteristics of Nanomaterials Used for pH Sensing.
| size (nm) | photostability | modes | advantages | limitations | |
|---|---|---|---|---|---|
| molecular probes | <1 | – to + | A, F | commercial availability, no further modifications, cover a wide spectral range | undefined properties in complex biological environment |
| genetically encoded fluorescent proteins | ∼3 | – to ∼ | F | biocompatible; can be used for intra- and extracellular measurements | long maturation times for some proteins |
| dendrimers | 1–14 | – to + | A, F | lower interferences compared to molecular probes | only partial protection from environment; high synthetic effort |
| quantum dots of type MeX | 2–10 | + | F | high brightness; often relatively long luminescence decay times and FLIM suitability | blinking; toxicity |
| upconversion nanomaterials | 10–100 | + | F | complete elimination of background fluorescence | 2-wavelength ratiometry often possible; typically photoexcited at 880 or 980 nm |
| organic polymeric NPs | 10–200 | – to + | A, F | high versatility in materials, preparation methods, cell penetrating properties and size | robust methods for indicator immobilization are necessary to avoid leaching resulting in higher effort |
| silica NPs | 3–200 | – to + | A, F | high versatility in materials, preparation methods, cell penetrating properties and size | robust methods for indicator immobilization are necessary to avoid leaching resulting in higher effort |
| carbonaceous nanomaterials | 3–15 | + | F | simple preparation | mostly short-wavelength excitation; emission can depend on exc. wavelength, prone to interferences |
| polymeric micelles with conformational changes | 3–50 | – to + | A, F | also pH-insensitive dyes can be used | very narrow dynamic range; concentration dependence of micellar formation except for unimolecular micelles |
Nanomaterials and respective sensors can be subdivided into three groups, namely, 1D nanomaterials (nanowires) 2D nanomaterials (nanosheets), and 3D nanomaterials (spherical dots). There has been enormous progress in this field, which is highlighted in several reviews;672−702 regarding pH sensing, there is a book section with an extensive review on nanomaterials for intracellular pH sensing and imaging.5 Due to their small size, nanosensors are suitable for measurements in small samples, most prominently cells and in tissue cells. This is hardly possible with other sensors. The small dimensions also decrease diffusion pathways of analytes to the “indicator chemistry”. Therefore, they have virtually instantaneous response and qualify for investigation of fast processes.
Molecular probes also feature similar characteristics but they are more prone to various interferences caused by nonspecific binding and effects of the environment. On the other hand, their broad commercial availability, versatility of properties and broad accumulated knowledge on selectivity, cell delivery and distribution, and toxicity, currently make them tools of choice in most biological studies. In situ calibration of such probes enables correction for many interferences.
The matrix in nanosensors fulfills a protective function and improves the robustness of the nanosensors. For instance, the pH response of the nanosensors in the absence and in the presence of proteins is often very similar.436 This is in distinct contrast to molecular probes. Nanosensors, therefore, are more easily calibrated. From another perspective, the matrix protects the cellular environment from direct contact with potentially cytotoxic dyes. Nanosensors with incorporated reference dyes simplify referenced sensing. Yet, leaching and photobleaching effects should be kept in mind for these materials.
The potential of nanosensors has been recognized several decades ago by Lübbers and co-workers who were probably the first to encapsulate a pH indicator in nanobeads.31 The pH-probe β-methyl-umbelliferone (7-hydroxy-4-methylcoumarin) was embedded into polyacrylamide beads obtained via polymerization of the monomer initiated by γ-irradiation. The nanoparticles (150–200 nm) showed response to pH in the range of 6–8. Kopelman and co-workers later described so-called PEBBLEs (probes encapsulated by biologically localized embedding), that is, nanosensors for various parameters including pO2, Ca2+, pH, etc.427,433
Nano- and microparticles have also been used to design optodes of other formats (planar optodes or fiber optic sensors) by dispersing them in proton-permeable hydrogels or in micrometer-sized beads. Also, more than one kind of nanoparticles can be used. This approach allows for simple adjustment of the sensor composition and is particularly useful for preparation of referenced sensors126,145,152,438 (section 2.11) and multiparameter sensors381,384,441 (section 10.7). In contrast to the situation where all the emitters are dissolved in a single matrix, application of micro- and nanoparticles allows for separation of components and, therefore, minimization or elimination of undesired effect, such as FRET, luminescence quenching, decreased photostability due to formation of reactive oxygen species etc. For each indicator dye or intended purpose, an appropriate matrix can be chosen.127,145,425 Considering the rather large number of pH nanosensors reported and their good characteristics, it is rather surprising that their potential has been so scarcely explored for manufacturing of optodes.
Most pH nanosensors have been designed for intra- and extracellular pH imaging. However, other applications of pH nanosensors such as pH sensing in microfluidic devices are gaining popularity.703 For intracellular measurements, particles have to be placed in cells. Methods for delivery include injection with a gene gun, a pico-injector or cell delivery with the help of liposomes have their advantages and disadvantages.433 Nowadays, most of pH nanosensors can be incorporated into cells via natural uptake (endocytosis), which is facilitated by the presence of positively charged groups on the surface of the nanoparticle. However, positively charged particles often are more cytotoxic than negatively charged ones, which in turn are more cytotoxic than neutral ones.681,704 Positive charges are more likely to enhance membrane disruption, while anionic charges are more likely to enhance apoptosis.704 Fortunately for cancer research, nanoparticles tend to preferentially accumulate in tumor tissues due to the enhanced permeability and retention effect (EPR) and the poor lymphatic drainage of tumors.692,705
In all cases, aqueous dispersibility of nanosensors is essential. This is usually enabled by introducing charged or uncharged but polar groups on the surface of nanoparticles. Depending on the kind of charged groups present on a surface (examples being carboxy groups or protonated amino groups), the surface charge will be affected by the actual pH value. Consequently, these groups may also have a varying buffering effect and thus perturb pH measurements.
8.2. Dendrimers and Biomolecular Conjugates
Dendrimers are highly branched and mostly symmetrical molecules that are built up via branched monomers from a central multifunctional core. Their size and composition can be systematically varied to tailor the properties. Starting from the core, the number of branching points to the surface defines its generation. Typically, dendrimers with only a few generations can be obtained in a highly monodispersed form; for higher generations, purification is impeded by the similarity of the desired dendrimers and small-defect byproducts.706 Most dendrimers are based on the use of polyamidoamines (PAMAMs), and less so of polyimines, polypeptides, polyethers, or polyesters. In dendrimers for optical sensing, the indicator dye core is protected from its environment by the oligomeric/polymeric shell, which is assembled around the chromophore. Alternatively, the indicator dye can be coupled to the surface. Peripheral coupling is chosen when high indicator concentrations without aggregation are desired or when multiple dyes are to be coupled.707 Because of the small distances involved, FRET may occur, especially when using high dye concentrations or dyes with overlapping absorption/emission spectra. From another perspective, dendrimers are useful structures for designing FRET-based systems. Apart from application as self-contained tools for sensing, dendrimers have also been used in composite materials to prevent dye leaching from a sol–gel matrix after physical entrapment.708
Another way to generate water-soluble pH sensitive nanoprobes is to couple a pH probe to an oligonucleotide, protein or even viruses. The biomolecule serves to protect the pH probe against its environment and can be used for targeting. Biomolecules can also change their conformation depending on the pH. These changes can be used to modulate the environment of probes based on FRET, quenching or polarity. Table 6 summarizes nanosensors based on dendrimers or biomolecular conjugates.
Table 6. Nanosensors Based on Dendrimers or Biomolecular Conjugates.
| class | material | comment | ref |
|---|---|---|---|
| dendrimers | PAMAM | pH-dependent intrinsic fluorescence | (709−711) |
| PAMAM–1,8-naphthalimide | PET-based, metal ion cross sensitivity | (712−717) | |
| acetyl-capped G5 PAMAM–SNARF 2 and boronate-caged peroxyfluor-1 | dual imaging of pH and H2O2 | (707) | |
| PAMAM–2 1,8-naphthalimide dyes | light harvesting, PET-based | (718) | |
| PAMAM–1,8-naphthalimide dyes | PET from dendrimer to dye, light harvesting | (719−722) | |
| PAMAM–perylene diimide | PET from dendrimer to dye, metal ion cross sensitivity | (723) | |
| PAMAM–7-hydroxy-4-methyl-3-coumarinylacetic acid, 5(6)-carboxyfluorescein, Oregon green 488 | specific subcellular localization | (724) | |
| poly(propyleneamine)–methyl orange | G0 and G1 properties similar to dye | (725) | |
| polyglutamic dendritic porphyrins | ratiometric, pKa´ changes with generation number | (726) | |
| tetraaryltetracyclohexenoporphyrins with 8 Newkome-type dendrons and PEGylated periphery | pKa´ in physiological range, no effect of ionic strength | (727) | |
| biomolecular conjugate | bovine serum albumin NPs–ref dye | BSA NPs pH sensitive, ratiometric | (728) |
| bovine serum albumin–energy transfer cassette | temperature dependent localization in cell | (729) | |
| DNA–gold NPs | absorption, pH-dep. conformational change | (730) | |
| fluorescein–DNA–gold NPs | for pH monitoring during application of nanomaterial-based therapeutics, ratio metrically | (731) | |
| elastin-like recombinamers and gold NPs | absorption, pH-dep. conformational change | (732) | |
| DNA–Alexa-488 and 647 | pH-dep. conformational change, FRET based | (733) | |
| oligonucleotides, gold NP–dyes | FRET based | (734) | |
| DNA–dye, graphene oxide | pH-dep. conformational change and quenching | (735) | |
| protein–naphthalimide | pH-dep. conformational change, solvatochromic dye | (736) | |
| bacteriophage–cyanine dyes | ratiometric, NIR, imaging | (737) | |
| bacteriophage–fluorescein, rhodamine | ratiometric, NIR, imaging | (738) | |
| bacteriophage–fluorescein, rhodamine | FRET-based | (739) |
In the above examples, coupling of an indicator to the surface of biomolecules or dendrimers not always results in strong protection from environmental influence, which may affect the pKa´ or photophysical properties. Consequently, for these materials the distinction between sensors and probes is blurred. However, conjugation can significantly improve the applicability of such materials compared to molecular probes as it allows targeting and, analogously to that of the bulk optodes, prevents/minimizes leaching and enables referenced sensing by cocoupling of a pH-insensitive dye.
8.3. Silica Nanoparticles
Silica-based nanoparticles are chemically inert, photostable and thermally stable materials that do not swell when dispersed in water. Due to their surface silanol groups, they are intrinsically hydrophilic and surface modification is straightforward. Generally, dispersibility in water is good but bivalent ions may cause aggregation. The nanomaterials are reported to be biocompatible and are hardly attacked by bacteria. Several reviews illustrate their importance in bioapplications.689−693,740,741 Two main approaches are mainly used for their preparation: the Stöber process and reverse microemulsion techniques.
Silica-based nanosensors can be illustrated by the work of Burns et al.404 who prepared core–shell nanoparticles composed of a silica core (⌀ 50 nm) doped with a tetramethylrhodamine dye and a silica shell doped with fluorescein. Both dyes were covalently integrated into the matrix by first reacting the respective isothiocyanates with the aminopropyltriethoxysilane and subsequent hydrolysis together with TEOS. The aqueous particle suspension (⌀ 70 nm) was stable against flocculation and leaching of the dyes for several months. The particles penetrated rat basophilic leukemia mast cells in the presence of phorbol-12,13-dibutyrate (which is used to increase endocytotic activity) and allowed ratiometric imaging of pH (λmax = 525 and 575 nm for the pH indicator and reference, respectively).
The mesoporous silica NPs are another type of silica-based nanomaterials.742 The mesoporous structures exhibit large surface areas and can be heavily loaded with dyes. Several groups have described such nanosensors by incorporating both a fluorescein and a reference dye (in most cases a rhodamine) into mesoporous SiNPs.
pH nanosensors based on silica particles are summarized in Table 7 and more details on their properties are provided in Table S7.
Table 7. Examples of Nanosensors Based on Silica Particles.
| class | material | comment | ref |
|---|---|---|---|
| silica particles | Stöber, naphthalimide, and sulforhodamine B | core–shell NPs, ratiometric | (471) |
| rhodamine B isothiocyanate | mechanism of pH sensitivity remains unclear | (743) | |
| microemulsion, FITC and Ru(bipy)32+ | ratiometric imaging | (744, 745) | |
| microemulsion, FITC and Ru(phen)32+ | core shell, ratiometric imaging | (746) | |
| HPTS-polyelectrolyte-SiNPs, rhodamine B SiNPs | raspberry-like assembly of the two SiNPs | (747) | |
| poly(ethylene glycol) or hyaluronic acid coated SiNPs | increase of colloidal stability | (748) | |
| zeolite core, silica shell, Stöber, fluorescein | ratiometric | (436) | |
| ormosil NPs, naphthalenylvinylpyridine | two-photon active | (526) | |
| spirorhodamineamide | different particle architectures investigated | (459) | |
| core–shell SiNPs, acridine orange | linear calibration | (749) | |
| core–shell SiNPs, reverse microemulsion; HPTS | indicator physically entrapped in the shell; works in the pH range from 5.5 to 9.0 | (750) | |
| modified Stöber, fluorescein, tetramethylrhodamine | core–shell NPs, ratiometric imaging | (751) | |
| imidazolium salicylaldehyde ionic liquid Schiff base immobilized on SiNPs | 60-fold intensity increase as the pH value increases from 5 to 11; method also applied to the determination of ammonia | (752) | |
| mesoporous silica nanoparticles | fluorescein and rhodamine B | charge neither affected pH response nor cellular uptake, but localization | (753) |
| fluorescein and rhodamine B | FRET-based | (618) | |
| fluorescein and Texas red | cell permeable | (754) | |
| hollow MSiNPs | extended pH range | (755) | |
| MSiNPs pores blocked by polyethylenimine | targeting mitochondria | (756) |
8.4. Organic Polymer Particles
Nanosensor-based on polymeric materials are commonly obtained via emulsion polymerization of the respective monomers (most prominently acrylamide) with a cross-linker and dyes (pH indicator and a reference). Indicator dyes can be immobilized in nanomaterials by physical entrapment or by covalent coupling. For nanomaterials, however, there can be additional limitations to consider. Contrary to the bulk optodes, nanomaterials are generally required to be dispersible in water. Dispersibility is provided by polar polymers or polar groups on the particle surface. Excess reactive groups can make the nanomaterials more prone to aggregation.675 Physical entrapment of the indicator and the reference dye is often a method of choice because of its simplicity and reproducibility. Noncovalent dyeing procedures include entrapment during the polymerization process, dyeing after swelling of polymeric beads and coprecipitation. The first method is equally suitable for covalent immobilization of indicators providing that they possess necessary functional groups. For dyeing via swelling, the polymeric nanoparticles are swollen in a mixture of organic solvent and water, which is also a solvent for the dyes. The dye must be water-insoluble to prevent leaching. The indicator dye is then “forced” into the polymer by slowly evaporating the swelling solvent or removing it by dialysis. Among suitable materials, poly(styrene-block-vinylpyrrolidone) beads allow straightforward staining and even enable selective dying of the core or the shell of the core–shell structured beads.382,390
Hydrophobic pH indicators can also be incorporated into polymeric nanoparticles from solution via nanoprecipitation.757 The formation of the nanoparticles relies on the use of two miscible solvents. The polymer and the dye are dissolved in a suitable (organic) solvent and then coprecipitated by addition of the second solvent (water) in which they are insoluble. Afterward, the “good” solvent is removed by evaporation or dialysis. Nanoprecipitation was successfully used to prepare nanoparticles from polymers, such as poly(styrene-co-maleic anhydride), poly(methyl methacrylate-co-methacrylic acid), RL-100, RS-100, ethylcellulose, poly(vinylidene chloride-co-acrylonitrile), polysulfone, hydrogel D4 and D7, Hydrothan H15, pHEMA, cellulose acetate butyrate, and Nafion.757
8.4.1. Hydrophilic Polymers
Nanosensors based on hydrophilic polymers generally show high water uptake and are, in essence, hydrogels. Therefore, they are often referred to as nanogels. Kopelman and co-workers coined the term PEBBLEs (probes encapsulated by biologically localized embedding) for nanosensors designed for measurement inside single living cells.427,687,758 Allowing the application of well-known indicator dyes, the polymeric embedding protects the dyes from interferences from cellular environment and is supposed to reduce potential toxicity of the dye in the cell. Similar to that of bulk optodes, it also simplifies realization of complex sensing schemes and ratiometric imaging.687 PEBBLEs for pH measurement have been prepared mainly from cross-linked polyacrylamide using a water-in-oil microemulsion polymerization technique.
8.4.2. Hydrophobic Polymers
Hydrophobic polymers also are suitable for preparation of pH nanosensors provided that the indicators are attached to the surface of the particles. Due to moderate protection of the indicator the environmental influence is stronger than for the materials containing the dyes incorporated into the bulk of the nanoparticles. In this concept, a reference dye is typically embedded into the bulk of the nanoparticle to minimize environmental effects.
8.4.3. Core–Shell Nanoparticles
Core–shell nanoparticles allow separation of dyes for referencing or multiparameter analysis. The separation can be used to prevent the interaction of dyes or to have each dye immobilized in an appropriate matrix.
pH nanosensors based on polymeric particles are summarized in Table 8. Details on spectral and sensing properties of some representatives of polymeric nanosensors can be found in Table S7.
Table 8. Overview of Nanosensors Based on Polymeric Particles.
| class | material | comment | ref |
|---|---|---|---|
| hydrophilic polymers | polyacrylamide, various fluorescein derivatives | ratiometric, leaching | (427) |
| polyacrylamide, HPTS | two photon excitation | (759) | |
| polyacrylamide, fluorescein, rhodamine B | ratiometric, less leaching | (616) | |
| polyacrylamide, hyaluronic acid on surface | improved endocytosis | (760) | |
| polyacrylamide, fluorescein, Oregon green, rhodamine | extended dynamic range | (761) | |
| polyacrylamide, pH indicators oregon green, oregon green 488 and fluorescein, pH-insensitive reference fluorophore Alexa 568 | analytical range from pH 1.4 to 7.0; spontaneously internalized by HeLa cells, localize at the lysosomes | (762) | |
| polyacrylamide, oregon green fluorescein, rhodamine B | extended dynamic range | (763−766) | |
| hydrogel, fluorescein, magnetic particles | miniemulsion solvent evaporation method, magnetic | (767) | |
| polyurethane, bromothymol blue, Nile red, coumarin 6 | FRET-based | (768) | |
| Eudragit RL-100, 1,4-diketopyrrolo-[3,4-c]-pyrroles, Macrolex yellow | ratiometric, imaging | (511) | |
| Eudragit RL-100, perylene bisimide | FLIM | (482) | |
| Eudragit RL-100, triangulenium dyes | homo-FRET, FLIM | (524) | |
| hyperbranched polymer composed of polylactide and PEG, 2 naphthalimide dyes | accumulate in acidic organelles, imaging | (769) | |
| hydrophobic polymers | amino modified cross-linked polystyrene, FITC, diphenylanthracene | ratiometric | (405) |
| amino modified cross-linked polystyrene, fluorescein | 2 μm particles, yet cellular uptake | (415) | |
| methyl methacrylate, 2-aminoethyl methacrylate copolymer, 1,8-naphthalimide, fluorescein | FRET-based, localized in the lysosomes | (770) | |
| polyacrylonitrile, fluorescein, Ru(dpp) | DLR-based, Ru dye temperature sensitive | (126) | |
| PVC, chromoionophore I | absorptiometric and fluorometric | (771) | |
| poly(phenylene-1,4-ethynylene), fluorescein | semiconductor polymer dots, FRET-based | (620) | |
| core–shell nanoparticles | polystyrene core, poly(acrylic acid) shell, naphthalene diimide | conjugated to rapid cell-penetrating peptides (HIV-1 TAT) to increase cell-penetration | (772) |
| poly(N,N-dimethylaminopropylacrylamide) core, poly(acrylamide) shell, naphthalimide, rhodamine | ratiometric | (773) | |
| polyaniline shell, polystyrene core, dye | pH-dep. polyaniline absorption modulates fluorescence of dye | (644) | |
| poly(styrene-block-vinylpyrrolidone), fluorescein derivatives and HPTS | selective staining of core/shell via swelling method | (382, 390) | |
| poly(styrene-block-vinylpyrrolidone), porphyrin, aza-BODIPY | simultaneous measurement of oxygen and pH, DLR-based | (703) | |
| poly(N-isopropylacrylamide) shell, polystyrene core, 1,8-naphthalimide, ref dye | ratiometric | (774) | |
| hollow polymer microcapsules filled with SNARF-1-dextran-conjugates | cellular uptake | (775) | |
| poly(2-(methacryloyloxy) ethyl phosphorylcholine-block-2-(diisopropylamino)ethyl methacrylate), Nile blue-based dyes | rapid cellular uptake, absorptiometric | (776) | |
| copolymer of poly(methyl methacrylate) and poly(methacrylic acid), 1,8-naphthalimide, rhodamine | FRET-based | (777) | |
| triblock copolymer, coumarin, Oregon green 488, 2′,7′-bis(2-carboxyethyl)-5-(and-6) carboxyfluorescein, Alexa 633 | ratiometric | (778) | |
| micelles from poly(vinylpyridine) and poly(vinylphenol) containing polymers, fluorescein, tris(dibenzoylmethanato)europium(III) | cellular uptake | (779) | |
| copolymer from poly(ε-caprolactone) and poly(oligo(ethylene glycol) methacrylate) with positively charged ammonium groups on the surface; fluorescein, PtTFPP | dual nanoprobe, intracellular imaging | (780) | |
| via coprecipitation from polystyrene amino-terminated polystyrene, poly(styrene-co-maleic anhydride) and poly-l-lysine; FITC, PtTFPP | ratiometric, intracellular imaging | (781) | |
| liposomes, micelles and emulsions | polypeptide micelles, fluorescein and N-(rhodamine B) lactam | complex pH response, FRET, self-quenching involved | (782) |
| nanoemulsions from perfluoropolyethers, Pluronic F68, polyethylenimine, cyanine dyes | also possible 19F MRI application | (783) | |
| liposomes from dimyristoylphosphatidylcholine, cholesterol, dihexadecyl phosphate, fluorescein | no leaching | (784) | |
| phospholipid coated polystyrene particles, fluorescein, tetramethylrhodamine | micrometer-sized | (785) | |
| cellulose and dextran | cellulose nanocrystals, fluorescein, Oregon green, rhodamine | two labeling strategies investigated | (411) |
| cellulose nanocrystals, fluorescein | spacer used to prevent quenching | (786) | |
| aminocellulose particles, fluorescein isothiocyanate, Ru(dpp)-PAN | in bulk optodes, imaging | (145, 425, 49, 127) | |
| dextran-propionate, fluorescein, sulforhodamine B | nontoxic, incorporated into cells without any additional agent | (439, 787, 788) |
8.5. Quantum Dots
Semiconductor quantum dots represent promising emitters for biological applications.789−797 Traditional quantum dots are nanometer-sized crystals made from metal chalcogenide semiconductors. Their luminescent properties originate from their nanoscale dimensions that induce the “quantum confinement effect”. The consequences are that a variation of the size of the quantum dot controls the energy levels and hence the absorption and emission wavelengths. Correspondingly, the absorption and emission wavelengths can be tuned by variation of size. The QDs are characterized by broad absorption spectra and narrow emission peaks, an exceptionally high brightness, photostability, absence of swelling and longer luminescence lifetimes compared to organic, fluorescent dyes. For instance, the decay time of CdZnS QDs is as long as 1 μs.798 Their long lifetimes can be very useful for discrimination of the signal from fluorescence background. Because of the broad absorption spectra, a single excitation wavelength can be used to excite QD with various different emissions. Photostability is generally considered good but can be further improved by using core–shell QDs. Importantly, core–shell architectures also increase quantum yields. The cytotoxicity of QDs is a complex issue and has been the subject of considerable debate.790,792 General considerations include the leakage of toxic metal ions into the sample, however, mechanisms of toxicity can vary and are not always clear. It was proposed that toxicity can also arise from polymer coating on the surface of the QD resulting in precipitation on the cell surface.799 Surface coating and size are crucial parameters determining cellular uptake but also breakdown of QDs. Concerning the downsides, QDs display fluorescence intermittency, blinking of the single quantum dots. In contrast, dye-doped nanoparticles comprise multiple dye molecules that absorb and emit independently. Therefore, polymeric or silica particles do not display blinking. The “off” states during blinking can be as long as 100 s for some QDs.800 However, the blinking is by some regarded as a mean to ensure the observation of a single dot event, for example, observation of a single protein.789 Without modification, QDs are poorly soluble, susceptible to quenching, unstable in dispersions and are not intrinsically pH sensitive. Additional modification is necessary for them to overcome these limitations and be useful as pH nanoprobes. QDs can show pH sensitivity due to carboxylic groups on their surface (Table 9).798,801,802 The changes in fluorescence intensity are accompanied by modulation of fluorescence decay time of the QDs (see section 10.2 for more details). Analogously, luminescence modulation because of deprotonation of surface defects was observed for Ti3C2 QDs.803 This material was modified with a Ru(II) complex to obtain ratiometric response but unfortunately required UV excitation.
Table 9. Overview of Nanosensors Based on Quantum Dotsa.
| material | sensing mechanism | comments | ref |
|---|---|---|---|
| CdSe/ZnS | deprotonation of COOH groups on the surface | decay time sensing (τ = 8.7–15.5 ns) | (801) |
| Cu-doped CdZnS | deprotonation of COOH groups on the surface | tunable emission, decay time sensing (τ = 200–900 ns) | (798) |
| CdSe/ZnS | deprotonation of COOH groups on the surface | intensity measurement, pH range 4–12, smartphone-based read-out | (812) |
| CdSe/ZnS | quenching via hole transfer to phenol, no quenching for phenolate | intensity measurement, decay time measurement (τ = 0.65–4.86 ns) | (804) |
| CdSe/ZnS | quenching via hole transfer to amine, no quenching for protonated amine | intensity measurement, decay time measurement (τ = 12.32–33.74 ns) | (805) |
| CdSe/ZnS | pH-dependent quenching from oxidized dopamine | ratiometric 2–λ sensing | (813) |
| CdSe/ZnS + squaraine | FRET from QD to the pH indicator | ratiometric 2−λ sensing | (806) |
| CdSe/CdZnS + SNARF | FRET from QD to the pH indicator | ratiometric 2−λ sensing, identical pH response under two-photon excitation | (807) |
| CdSe/ZnS + pyrene | FRET from pyrene to QD; polymeric linker undergoes swelling upon protonation | ratiometric 2−λ sensing | (807) |
| CdSe/CdZnS + fluorescein | FRET from pH indicator to QD | ratiometric 2−λ sensing | (811) |
| CdZnSe/CdZnS/ZnS + fluorescein | FRET from QD to the pH indicator | ratiometric 2−λ sensing | (814) |
| CdSe/ZnSe + naphthofluorescein | FRET from QD to the pH indicator | ratiometric 2−λ sensing | (815) |
| CdTeSe/ZnS + cyanine dye | FRET from QD to the pH indicator | decay time sensing (τ = 12–29 ns) | (808) |
| mercaptoacetic acid capped CdSe/ZnSe/ZnS | deprotonation of COOH groups on the surface | intensity measurement, loss of surface capping at low pH, resulting in aggregation | (816) |
| QD ITK + mOrangeb | FRET from QD to pH sensitive GEFP | ratiometric 2−λ sensing | (660) |
| black phosphorus QDs | protonation and deprotonation of hydroxyl groups causes a different degree of quenching | particle size 5.2 nm; pH range of 1.0–9.0 | (817) |
A more detailed version of the table can be found in the Table S8.
Commercially available QDs.
Semiconductor QDs can also be rendered pH sensitive via coupling of a sensitive group acting as a hole trapper. Wang and co-workers demonstrated that p-mercaptophenol804 and p-aminothiophenol805 coupled to CdSe/ZnS induce fluorescence quenching of the QDs in acidic conditions.
FRET represents another possibility to prepare a pH responsive system using intrinsically pH-insensitive QDs (Table 9). Feasibility of the approach was demonstrated by Nocera and co-workers who covalently bound a pH sensitive squaraine dye806 or SNARF807 to the surface of CdSe/CdZnS QD. Tang et al.808 utilized FRET from NIR emitting CdTeSe/ZnS QD to a cyanine dye, which shows NIR absorption. Remarkable feature of the presented nanosensor is strong response of the fluorescence decay time of the QD (τ = 29 ns at pH > 7 and 12 ns at pH < 5). Dennis et al.660 used pH sensitive fluorescent proteins as FRET acceptors instead of organic dyes.
In contrast to above sensors utilizing QDs as energy donors, Kim and co-workers explored FRET from pyrene dye to CdSe/ZnS QD, acting as energy acceptor.809
Several researchers utilized fluorescent pH indicators as energy donors for QDs. The luminescence of the QD can be modulated to a certain extent (for instance if the emission of the donor is “switched off”) and observed ratiometric response can be due to combination of direct excitation of the QD and excitation via FRET from organic dye. Examples include naphthalimide810 and fluorescein811 coupled to CdSe/ZnS QDs.
8.6. Carbon-Based Nanomaterials
8.6.1. Carbon Dots
Carbon dots (CDs) and graphite oxide nanoparticles (Table 10) feature water solubility/dispersibility, chemical inertness, straightforward surface chemistry, high photostability, and high two-photon absorption cross sections. The luminescence of carbon dots is susceptible to PET quenching making ion sensing possible in principle.818 Because of the low cytotoxicity, intracellular pH-imaging represents one of the major applications.819−827
Table 10. Overview of Nanosensors Based on Carbonaceous Materials.
| material | preparation method | comment | ref |
|---|---|---|---|
| carbon dots | various | a review on CDs for use in pH sensing | (851) |
| hydrothermal method from Agaricus bisporus | in microgels to monitor 3D cell culture scaffolds | (820, 830) | |
| from polyethylenimine | pH range 2–12, cellular uptake | (819) | |
| from flower (carnation) | pH range 3–12, absorptiometric and fluorometric | (821) | |
| from chloroform and diethylamine | coupled to fluorescein, CD as reference | (822) | |
| hydrothermal method from β-resorcylic acid and ethylenediamine | linear pH range 3.8–6.2 | (852) | |
| nitrogen- and chloride-doped CD | from urea in choline chloride–glycerine deep eutectic solvent | pH range 5–10, virtually no effect of ionic strength | (823) |
| hydrothermal method from mushrooms | pH range 2–13, linear range 4–8, quenched by hemin | (824) | |
| hydrothermal method from ascorbic acid | intensity decrease 10-fold (pH 4–8) emission shift from 441 to 550 nm (pH 2–12) | (853) | |
| thermal decomposition of ascorbic acid in DMSO in microfluidic system | absorptiometric, fluorometric, upconversion | (825) | |
| hydrothermal method from p-phenylenediamine | excitation-independent emission at 590 nm | (826) | |
| from glucose and edible oil | linear range pH 3–13 | (827) | |
| hydrothermal method from citric acid and dicyandiamide or aniline hydrochloride | high quantum yields 37% | (854) | |
| 63% | (855) | ||
| hydrothermal method from citric acid and basic fuchsin | dual emission with different pH-dependent behavior allowing ratiometric measurement | (856) | |
| hydrothermal method from citric acid and l-serine or monoethanolamine | linear range pH 1.5–7.5 | (857) | |
| from phenylenediamine | emission peaking at 620 nm under 470 nm excitation; 15% quantum yield; 3.8 nm i.d.; used to image pH values in E. coli bacteria, pH 5–10 | (858) | |
| CDs doped with Eu(III), Tb(III) and a chelating ligand | from PEG 400 | excitation/emission wavelengths of 272/545 (Tb) and 272/614 nm (Eu); effects are due to pH-induced variations in energy transfer; applied to visualize pH values in breast adenocarcinoma, pH 3–10 | (859) |
| nitrogen and oxygen-rich CD | from aspartic acid and urea | pH range 1–13, sensitive toward oxidation | (860) |
| hydrothermal method from o-phenylenediamine PEG, oxalic acid | dual emission, ratiometric, linear range pH 2.2–4.0 | (861) | |
| nitrogen- and boron-doped CD | from aminophenylboronic acid | dual emission with different pH-dependent behavior allowing ratiometric measurement | (862) |
| CD Eu(III) doped | hydrothermal method from EDTA and (Eu(NO3)3*6H2O) | ratiometric response to pH from pH 2–10 | (863) |
| N- and P-doped CD | CD treated with diammonium phosphate | dual emission with different pH-dependent behavior allowing ratiometric measurement, linear range 2–12 | (864) |
| B- and P-doped CD | CD treated with H3BO3 or phosphoric acid | boron doping increased QY, phosphorus doping decreased QY, ratiometric | (865) |
| CD | with polyaniline layer | two linear regions from pH 3.5–5.5 and 6–12 | (866) |
| nitrogen-rich carbon NPs | hydrothermal method from melamine and triethanolamine | PET quenching, linear range 3–12 | (867) |
| CD with fluorescein | from acrylic acid and 1,2-ethanediamine | FRET-based, ratiometric | (834, 835) |
| CD with fluorescein and rhodamine B | from citric acid and 4,7,10-trioxa-1,13-tridecanediamine | ratiometric pH 6–8 | (836) |
| CD with fluorescein | from kelp juice | CD as reference, linear range 4.6–7.7 | (831) |
| GO nanosheets | 10-fold fluorescence quenching on going from pH 2 to 12, show strong cross-talk to ionic strength | (849) | |
| pH sensitivity from carboxylic and phenolic groups | (98) | ||
| betaine-modified | pH range 4–12, quenched by Cu2+ and Fe3+ | (868) | |
| GO NPs | bathochromic shift of emission in pH range 1 to 14, strong temperature sensitivity | (869) | |
| transducer for urea detection | (870) | ||
| single-walled carbon nanotubes | in wavelength range from 1.1–1.4 μm, pH range 4.5–8.5, temperature sensitive | (850) |
Dually emitting carbon dots were shown828 to be viable probes for ratiometric fluorometric sensing of pH values, mercury(II), chloride and chromate. The ratio of fluorescence emissions at 565 and 410 nm strongly depends on the pH value in the range from 4.5–6.5 and 10.0–13.0, respectively. Obviously, the other ions interfere in determination of pH. Green fluorescent carbon dots, probably being doped with nitrogen, also were shown to enable determination and imaging of pH values in in SMMC-7721 cells.829 The dots were prepared from m-phenylenediamine, have a 36% quantum yield, an average size of 2.3 nm, excitation/emission peaks at 450/510 nm, and work in the pH range from 6.0 to 10.0.
Carbon dots also found application in pH monitoring of complex 3D cell culture scaffolds in microfluidics, because of their biocompatibility.830 The downsides include low QY and absorption in the UV with only a tail in the VIS region. Absorption can be shifted to longer wavelengths via surface modification. CDs can be obtained via different techniques but hydrothermal synthesis probably represents the most convenient method. The photophysical properties largely depend on the preparation procedure and the resulting surface. Various biobased or “green” CDs have been described that are produced from natural products such as kelp juice,831 mushrooms,830 and even urine and manure.832,833 The composition of these CDs, however, lacks reproducibility compared to procedures using chemicals of known purity/composition. Often, surface passivation or doping increases quantum yields or is necessary for luminescence to occur at all. The pH sensitivity is introduced via carboxylic groups or nitrogen doping. CDs can also fulfill the dual function as support for a pH probe and as reference. Most commonly fluorescein is attached to the surface of the CDs.831,834−836 Temperature sensitivity and selectivity should be considered;837−847 cations, such as Ag+, Cu2+, Fe3+, or U6+, interfere. Also, luminescence quenching from nitrite was reported.848 Carbon dots are usually smaller (⌀ = 2–8 nm) than other types of nanosensors and show a broader dynamic range. They are excited at significantly shorter wavelengths (<450 nm) than most (metal−)organic pH indicators. Most of these materials show emission spectra that depend on the excitation wavelength.
8.6.2. Graphite Oxide Dots
Graphite oxide dots (GODs) are obtained by oxidation of graphene. Similar to carbon dots, GODs do not represent a well-defined material, and the properties strongly depend on preparation method. Chen and Yan849 demonstrated pH sensing properties of graphite oxide for the first time recording ∼10-fold fluorescence quenching on going from pH 2 to 12. Hirsch and co-workers98 demonstrated that graphite oxide nanoparticles possess carboxylic and phenolic groups which are both responsible for pH sensitivity. Excitation and emission of GODs occurs at significantly longer wavelengths, compared to carbon dots. GODs show strong cross-talk to ionic strength, fluorescence decreases by about 30% upon addition of 50 mM NaCl to pH 4 buffer.849
8.6.3. Single-Walled Carbon Nanotubes
Functionalized single-walled carbon nanotubes also display pH-dependent luminescence in wavelength range from 1.1–1.4 μm.850 Attachment of an aminoaryl function introduced a defect in the carbon lattice, resulting in red-shifted luminescence. De-/protonation of the aminoaryl function alters the energy level and hence shifts the emission peak introducing pH-sensitivity. The system responds in the range from 4.5 to 8.5 pH units.
8.7. Miscellaneous Materials
8.7.1. Nanosensors Based on Conformational Changes in Polymers
In addition to the major classes of pH nanosensors described above, several other nanomaterials have also been presented. A very interesting approach is a group of nanosensors based on conformational changes in polymers (Table 11) in combination with Förster resonance energy transfer (FRET). The pH sensitivity of these probes is introduced by FRET modulation because of conformational changes of the polymer backbone or a linker.
Table 11. Overview of Optical pH Probes Exploring Conformational Changes in Polymersa.
| dye | polymer | comments | ref |
|---|---|---|---|
| pyrene + coumarin 343 | PAA modified with sulfadimethoxine as a linker | very sharp response; ratiometric 2-λ read-out; short wavelength of excitation and emission | (871) |
| 7-hydroxy-4-bromomethyl coumarin + coumarin 343 | PAA modified with sulfadimethoxine or sulfamethizole as a linker | very sharp response; ratiometric 2-λ read-out; short wavelength of excitation and emission | (876) |
| fluorescein + rhodamine B | PAA modified with sulfadimethoxine as a linker | very sharp response; ratiometric 2-λ read-out | (876) |
| Cy3 + Cy5 | N-palmitoyl chitosan NPs | ratiometric 2-λ read-out | (877) |
| Cy5.5 + quencher | poly(oligo(ethylene glycol) methacrylate) and poly(benzyl-l-aspartic acid) | sharp response due to micelle formation | (878) |
| CdS/ZnS + CdSe/ZnS QDs | graphene oxide NPs decorated with QD-polymer conjugates | ratiometric 2-λ read-out/lifetime read-out | (872) |
| numerous chromophores | block copolymer PEG + alkylamino-modified PMMA | very sharp transitions, high tunability of optical and sensing properties | (453, 873, 879) |
| BTPE + coumarin | block copolymer PEG + alkylamino-modified PMMA | ratiometric 2-λ read-out; short wavelength excitation and emission; two-photon read-out possible | (880) |
| perylene-bis-imide | PAEMA dendrimer | operates in diluted solutions | (874) |
A more detailed version of the table can be found in the Table S9. BTPE = 2-((E)-2-(pyridin-2-yl)vinyl)benzo[d]thiazole, PAEMA= poly(aminoethyl methacrylate), PAA = poly(acrylic acid).
For instance, Hong et al.871 prepared a pH nanoprobe by connecting a pyrene energy donor and a coumarin energy acceptor via a polyacrylamide linker modified with sulfadimethoxine (Figure 28A). Protonation of the sulfadimethoxine group results in collapse of the linker, which brings the dyes in close proximity, promoting FRET from pyrene to coumarin.
Figure 28.

Examples of pH nanosensors exploring conformational changes of polymers. (A) Chemical structure and sensing mechanism of the nanoprobe based on a pyrene energy donor and a coumarin energy acceptor connected via a polyacrylamide linker modified with pH sensitive sulfadimethoxine. Reprinted with permission from ref (871). Copyright American Chemical Society 2005. (B) Chemical structure, sensing mechanism and pH dependency of fluorescence spectra (λexc = 365 nm) for the nanoprobe composed of two quantum dots emitters and graphite oxide acting as a quencher. Reprinted with permission from ref (872). Copyright American Chemical Society 2014. (C) chemical structures of the self-assembled polymeric micelles nanosensors, fluorescent images of their aqueous solutions at the same polymer concentration (100 μg/mL) but different pH values (pseudocolors were used for PC7A-C55 and PC6A-C75 nanoprobes due to their near IR emissions) and the pH response of the nanosensors. Reprinted with permission from ref (873). Copyright American Chemical Society 2012. (D) Chemical structure of a unimolecular polymeric micelle pH probe, schematic representation of the volume phase transition and respective pH response. Reprinted with permission of The Royal Society of Chemistry from ref (874). Copyright The Royal Society of Chemistry 2014. Permission conveyed through Copyright Clearance Center, Inc.
Kim and co-workers872 reported a hybrid material exploring quenching properties of graphite oxide. First, pyrene-terminated poly(acrylic acid) (PAA) chains were anchored onto the surface of blue-emitting CdS/ZnS QDs (BQD, λmax = 440 nm), whereas pyrene-terminated poly(2-vinylpyridine) (PVP) was anchored onto the surface of orange-emitting CdSe/ZnS QDs (OQD, λmax = 580 nm), Figure 28B. Then, both conjugates were anchored onto a single graphite oxide sheet via π interaction of the pyrene and graphene oxide. The resulting nanosensors showed ratiometric response to pH (Figure 28B). In close proximity, graphite oxide quenches the emission of the QDs. The distance between the QDs and the graphite oxide sheet is determined by the conformations of the PAA and PVP parts, which in turn depend on the pH.
Another group of nanosensors explores the properties of pH-switchable self-assembled materials.875 Gao and co-workers453,873 prepared a library of pH-sensitive self-assembled polymeric micelles based on block copolymer modified with tertiary amino-groups and common pH-insensitive fluorescent dyes (Figure 28C). The conjugates were highly fluorescent in acidic media due electrostatic repulsion of the polymeric chains bearing protonated amino-groups. At higher pH, micellization greatly enhanced quenching of the dyes via homoFRET mechanism. The materials feature extremely narrow dynamic ranges with the “on–off” effect achieved within 0.25 pH units (Figure 28C).
Unimolecular polymeric micelles (UPMs) offer the advantage of being stable in very diluted solutions in contrast to self-assembled polymeric micelles. You et al.874 reported two fluorescent UPMs probes based on dendrimers bearing a perylene core and cationic or anionic polyelectrolyte shell (Figure 28D). The micelles are compact when the groups are uncharged but undergo a volume phase transition as a result of electrostatic repulsion between the charged chains. The increase in the size of the micelles is accompanied by strong decrease of fluorescence intensity (Figure 28D), which is fully reversible.
8.7.2. Inorganic–Organic Hybrids
Inorganic–organic hybrids (Table 12) are either prepared to improve the performance of the resulting material or to introduce additional functions such as upconverting capability (these materials are treated separately in section 10.6), fluorescence enhancement or additional magnetic properties. For instance, Wang et al.571 prepared hybrid organic–inorganic pH nanosensors from Pluronic F127, TEOS, and fluorescein. The dye itself is embedded in silica nanoparticles that are entrapped in the micellar structure formed by the Pluronic polymer. Intended for monitoring of pH during bacterial growth, the particles are not ingested by bacteria and are excellently dispersible in standard agarose/nutrient growth media. A similar system was applied for dual sensing of oxygen and pH using a Pt(II) tetraphenyltetrabenzoporphyrin as oxygen indicator.881 The particles could be delivered to the cytosol of cells via electroporation.
Table 12. Overview of pH Nanosensors Based on Miscellaneous Materials.
| material | pH probe–reference | comment | ref |
|---|---|---|---|
| silica/γ-Fe2O3 core–shell NPs | fluorescein, sulforhodamine B | 2-λ emission | (887) |
| silica/polymeric core–shell NPs | naphthalimide, rhodamine B | intensity | (472) |
| Ag core + silica shell with poly(allyl amine) | HPTS self-referenced | 2-λ excitation | (884) |
| pluronic F127, TEOS | fluorescein, porphyrin reference | silica–polymer hybrid, no cellular uptake, for monitoring pH during bacterial growth | (571) |
| pluronic F127, TEOS | fluorescein, porphyrin reference, Pt(II) porphyrin oxygen indicator | dual sensing of oxygen and pH | (881) |
| dendrimer-coated QD | SNARF-5F dye, CdSe/CdZnS QD | FRET-based, two-photon excitation | (807) |
| hydroxypropylcellulose-poly(acrylic acid) nanogel | CdSe quantum dots | swelling of the nanogel induces luminescence quenching | (882) |
| polyethylenimine coated NaYF4:Yb,Er UCNPs and graphene oxide | NaYF4:Yb,Er UCNPs | graphene oxide acts as quencher depending on strength of the electrostatic interactions | (883) |
| metal–organic framework NP (Zr(IV) and amino-triphenyldicarboxylic acid) | fluorescein | high dye loading up to 4% wt. without self-quenching | (638) |
| silver core, silica shell, poly(allylamine) coating | HPTS | metal-enhanced fluorescence | (884) |
| silver core, silica shell | fluorescein, eosin | dying via click chemistry | (889) |
| polythiophene-Au composite | absorption independent of pH, emission linear from pH 3–6 | (885) | |
| gold nanoparticles with thiol spacer | anthracene derivative, rhodamine | ratiometric | (141) |
| gold nanoparticles | tetramethylrhodamine | pH dependent dimer formation of rhodamine, pH range 6–10 | (890) |
| gold nanoparticles | PEGylated porphyrin | ratiometric (absorbance), intensity | (891) |
| silica-coated iron oxide nanoparticles with polymer shell | benzo[a]phenoxazine derivative | magnetic, NIR, 40-fold enhancement of luminescence intensity from pH 8.4–3.6 | (886) |
| maghemite (γ-Fe2O3) nanocrystals with 2 silica shells | fluorescein, sulforhodamine B | magnetic, ratiometric | (887) |
| nickel core, silver layer, polymer gel shell | silver layer | magnetic, pH-sensitivity due to volume phase | (888) |
| NaGdF4:Yb/Er UCNPs | AgS nanodots modified with 3-mercaptopropionic acid and glutathione | NIR excitation (980 nm) and NIR emission (795 nm), ratiometric, pH range 4–9, imaging | (892) |
| silica-coated polystyrene NP | fluorescein, CrBPh4, porphyrin or Nile red | simultaneous measurement of T, O2 and pH with single excitation | (893) |
| silica core and polymeric shell | 1,8-naphthalimide with PET group | also for drug release | (769) |
| poly(3,4-dihydroxyphenylalanine) | ratiometric, linear pH range 4–8 | (894) | |
| silicon carbide NPs | pH range 5.6–7.4, ratiometric | (895) | |
| MnO2 nanosheets | 3-acetyl-7-hydroxy-2H-chromen-2-one | pH range 4–7, dual sensing of pH and glutathione; exc/em maxima at 417/456 nm | (896) |
Somers et al.807 reported a ratiometric pH sensor prepared from dendrimer-coated quantum dots and pH-sensitive SNARF-5F dye. The CdSe/CdZnS quantum dots were coated to increase robustness against degradation and provide a higher number of coupling sites. Wu et al.882 embedded CdSe quantum dots into polysaccharide-based hybrid nanogels. pH dependent swelling of the nanogel induces luminescence quenching.
Yan et al.883 designed a hybrid pH-sensor film based on upconverting nanoparticles and graphene oxide. NaYF4:Yb,Er UCNPs were coated with polyethylenimine and upon 980 nm excitation displayed emission at 540 and 660 nm. pH sensitivity from pH 5 to 8 is induced by pH-dependent quenching from graphene oxide.
Lin and co-workers638 used metal–organic framework nanoparticles (made of zirconium(IV) and amino-triphenyldicarboxylic acid) for covalent immobilization of fluorescein. High dye loading (up to 4% wt.) could be achieved without self-quenching. High brightness of the material and efficient cellular uptake made the material promising for intracellular imaging of pH. These properties are in contrast to low brightness and short wavelength excitation of other MOFs reported so far (see section 7.1 for more details).
Several groups designed pH nanosensors with a metal core. Bai et al.884 exploited metal-enhanced fluorescence of HPTS using a hybrid material with a silver core. Panda and Chattopadhyay885 reported pH responsive polythiophene-Au composite. Absorption was independent of pH, but emission at 465 nm showed linear pH dependency in the range from pH 3 to 6. Gold nanoparticles were used to fabricate a ratiometric pH-nanosensor material based on PET.141 Anthracene substituted with a PET group and rhodamine as reference were coupled to the surface of the gold nanoparticles via thiol-containing spacer molecule. The system was used for intracellular measurement in the pH range of 3.5–6.
8.7.3. Magnetic Nanoparticles
Magnetic nanoparticles are used to allow manipulation with a magnet or enable magnetic resonance imaging (MRI). Liu et al.886 prepared hybrid magnetic nanoparticles by attaching a polymer coating onto silica-coated iron oxide nanoparticles. The coating was added to improve water solubility, prolong the circulation lifetime and reduce nonspecific protein binding. A NIR fluorescent benzo[a]phenoxazine dye was attached via DCC coupling. Luminescence intensity enhanced 40-fold, when changing pH from 8.4 to 3.6.
Lapresta-Fernandez et al.887 reported core–shell nanoparticles that allow manipulation with a magnet. The inner shell contains covalently bound sulforhodamine B, whereas the outer shell covalently bound fluorescein. The material was designed for ratiometric sensing. Wu et al.888 prepared magnetic core–shell hybrid nanogels for pH sensing. A fluorescent silver layer was grown onto the magnetic nickel core and then coated with a pH-responsive copolymer gel shell. pH-sensitivity relies on a pH-induced volume phase transition. The material responds in the range from pH 5 to 7.4.
Hybrid materials can also be promising for simultaneous pH sensing and drug release. In a model system, Wan et al.769 prepared hybrid nanoparticles composed of a silica core and polymeric shell with a naphthalimide pH indicator. After loading with guest molecules for drug-release experiments, the pores were closed by cross-linking with cystamine forming disulfide groups. Leaching of guest molecules was low in water. In presence of dithiothreitol, the guest molecules were released, due to cleavage of the disulfide groups.
8.8. Aggregation-Induced Emission
Aggregation-induced emission (AIE) is based on the effect that molecules or nanoparticles (NPs), on aggregation, undergo an increase in fluorescence intensity, which is in contrast to the widely observed phenomenon of emission quenching.897 Aggregation makes radiative deactivation the primary pathway from the excited state to the ground state. AIE-based methods may be considered as forming the interface between molecular sensing and NP-based sensing. A review on AIE for use in optical sensors has been presented by the Tang group.898 The same group later has described899 AIE-based probes/sensors for measurement of intracellular pH values (pHi) that is making use of a tetraphenylethene–cyanine adduct. Upon diffusion into cells, it responds sensitively to pHi over the physiological range, visualizing the acidic and basic compartments with intense red and blue emissions, respectively. The ratiometric signal of the red and blue channels can thus serve as an indicator for local proton concentration. A through-bond energy transfer-based modification of this method was presented later.900 Others have used a pyridyl functionalized tetraphenylethylene for ratiometric fluorometric determination of pHi.901
Another kind of ratiometric AIE-based pH nanosensor material was obtained769 by preparing NPs consisting of a hyperbranched polymer with AIE activity. The NPs selectively accumulate in the acidic organelles of living cells by endocytosis. The pHi of HeLa cells was determined by ratiometric sensing. At about the same time, AIE-based probes were introduced where the diketopyrrolopyrrole and the anthracenone chromophores were conjugated to each other.902 The diketopyrrolopyrroles containing two diethylamino groups display AIE. At alkaline pH values, the emission is 6.7-fold stronger compared to that at pH 2.5. A dual-emission pH-sensitive fluorescent probe was developed, which displays green fluorescence in alkaline conditions after deprotonation, while orange emission in acid at aggregated state. This novel probe allows the specific light-on in acidic lysosomes of cancer cells and tumors in nude mice, which indicates its potential application in cancer diagnosis.
Polymers not containing classical dyes or fluorophores were also found to display pH-dependent AIE if they incorporate protonable functions. For example, pH-responsive blue AIE903 can be observed in polymers containing N,N-diethylethylenediamine. Similarly, pH-induced AIE was found for an interpenetrating polymer network composed of poly(N-isopropylacrylamide-co-tetra(phenylethene acrylate)/poly(methacrylic acid) that may be used as a nanosensor materials.904
Some Schiff bases and azines appear to readily undergo pH-dependent AIE. A chlorosalicylaldehyde-derived Schiff base was synthesized and used for pH sensing in live cells.905 Fluorescence is weak in solution, but strong AIE is found for the nanoaggregated state. This is ascribed to the restriction of the intramolecular rotation of a C–N bond and the nonplanar configuration in the aggregate/solid state. The sensor undergoes a fluorescence color change from orange to green, and the intensity ratio at 516 and 559 nm is enhanced when the pH value is increased from 5.0 to 7.0 (pKa value 4.8). The same is true for other Schiff bases,906,907 salicylaldehyde azines,908 and of some hydrazones.909 Some show dual emission and therefore enable ratiometric intracellular sensing.910 Other AIE-based sensors for determination of pHi make use of smartly functionalized anthracenes,911 of BF2 chelates912,913 or of E/Z isomers of N-methylpyrrole-benzohydrazide-based BF2 complexes, these also containing >C=N– bonds of the Schiff base type and undergoing pH-induced AIE.914 They were applied to the determination of the pHi of living cancer cells. It should be mentioned that most of the pH probes based on AIE are expected to show the same limitations as molecular probes, that is, shift of the calibration due to interaction of the biomolecules with the monomeric form of the dye.
8.9. Nanofilm Sensors
The nanomaterials described in the sections 8.1–8.7 are self-contained analytical tools that are mostly applied in the form of an aqueous solution/dispersion for pH quantification in comparably small volumes (e.g., living cells). Only in some cases they have been incorporated into sensors of different formats, such as planar optodes or fiber-optic sensors. Nanofilm sensors represent another type of nanomaterials useful for pH sensing, that, in contrast to self-contained nanosensors, are not self-standing because they are prepared on a support (a planar waveguide or an optical fiber). This section covers the use of classical (soft) lipid nanofilms but not of nanofilms made from materials, such as polyaniline, graphenes, or other solid nanomaterials. There are two common methods for making such nanofilms. Both utilize lipophilic compounds with polar groups at their end. The first is making use of the Langmuir–Blodgett (LB) technique, the other of layer-by-layer (LbL) deposition. Schaffar and Wolfbeis85 have used LB films doped with the lipophilic blue fluorescent pH probe 7-hydroxycoumarin-3-carboxylic acid hexadecyl ester (pKa = 7.4). The doped LB film was placed on the surface of a glass platelet, and fluorescence was measured via an evanescent wave technique. In another kind of pH sensor,915 evanescent coupling between a side-polished single-mode optical fiber and a single-mode, pH-sensitive LB overlay is used. The sensor is intrinsic and does not require the presence of a pH indicator. The sensor shows a wavelength sensitivity of around 19 nm/pH unit and a transmission sensitivity of 9.7 dB/pH unit when operated at 750 nm. LB films generally suffer from poor mechanical stability and disruption by detergents and many proteins including serum albumin.
The LbL technique has been used more often because LbL layers are more versatile and somewhat more stable. Polyallylamine is widely used. It is present, at neutral pH values, as the hydrochloride and then referred to as PAH (not to be confused with the common acronym for polycyclic aromatic hydrocarbon). PAHs are cationic and form monolayers and bilayers. In addition, layers with alternating charge may be deposited sequentially, for example layers of poly(acrylic acid) (PAA; being anionic)) and of PAH (being cationic). Such layers are best deposited on supports by alternating a voltage applied to the support. By incorporating the pH indicator neutral red into alternating layers of PAA and PAH, a pH sensing membrane was obtained for absorptiometric determination of physiological pH values.193 In similar work by the Arregui group,347 a thin-core fiber modal interferometer was alternatingly covered with poly(allylamine hydrochloride) and poly(acrylic acid) by LbL electrostatic self-assembly. The response also is fast, the linear range is said to be much wider (pH 2.5–10), and the resolution is ±0.013 pH units. The group of Grattan211 showed that six double layers of PAH doped with the pH indicator brilliant yellow showed the best sensitivity in the pH range from 6.8 to 9.0. The method was later extended to fiber optic pH sensing using an unclad silica fiber,916 and to the use of neutral red deposited on U-shaped fibers.917 An LbL method for interferometric (indicator-less) sensing was described by Gu et al.918 The side surface of an optical fiber modal interferometer was self-assembled with alternating layers of sodium alginate (mainly anionic at pH values above 3) and polyethylenimine (mainly cationic at pH values below 10). The sensors have a wide pH sensing range (2 to 11), fairly linear response, and good stability. However, the sensor also has disadvantages including complex fabrication and small signal change.
White light interferometry was used to sense pH values in the range from 3 to 10 and using a halogen lamp as the light source.919 The Fabry–Perot interference patterns caused by thin polymeric films on standard optical fiber substrates depend on the pH value of the surrounding solution. The films consist of alternating layers of the weak polyelectrolytes poly(allylamine hydrochloride), which is cationic, and of the poly(acrylic acid), which is anionic. The films reversibly swell and shrink as pH values change. Generally spoken, nanofilm sensors are of fundamental interest but have not found wide application, mainly because of difficulties to ensure highly reproducible production of the sensor films, sensitivity of the coatings to detergents and proteins, such as albumin, the adverse effects of many electrolytes, and because of the weak signals provided by extremely thin sensor films, be it absorption (from the visible to the infrared), reflectance, fluorescence, or scattering.
9. Additives, Coatings, and Other Components
9.1. Plasticizers
Use of plasticizers in pH optodes is rare because pH sensors mostly rely on the use of proton-permeable materials. Plasticizers have been used in pH optodes only in a combination with poly(vinyl chloride), for example in a matrix for a dually responding pH/pO2 sensor to achieve optimal dynamic range for pH and oxygen sensing (section 10.7).366 We do not recommend the use of such sensor materials.
9.2. Scattering Particles
The signal of indicator-based sensors can be enhanced via addition of white scattering particles.110,146,920 Nano- or microparticles based on materials having high refractive index efficiently enhance the fluorescence signals by increasing the pass-way of excitation light. Titanium dioxide represents a cheap pigment with high refractive index (2.488–2.609 depending on the form) and is thus almost ideally suitable for the signal enhancement. It is available in many modifications (hydrophilic or hydrophobic surface). Potential interaction of the indicator with the surface of the particles should be considered. Hydrophilicity/hydrophobicity of the surface may affect the apparent pKa value, whereas photocatalytic properties of titanium dioxide may enhance photobleaching or be responsible for fluorescence quenching. It is possible to avoid the above effects by coating an additional light scattering layer (TiO2 particles dispersed in the matrix) over the sensing layer. Such additional layer reduces the wave guiding to the edges of the foil, which results in additional enhancement of the signal. Overall enhancement can reach 10-fold, which makes even moderately bright indicators competitive. It should be kept in mind that enhancement factor for NIR pH indicators is significantly lower than for UV–vis dyes due to wavelength-dependent nature of light scattering.
Several other scattering materials were proposed. For instance, Moßhammer et al.921 used a diamond powder as a light scattering material. Although scattering efficiency of diamond is slightly lower than that of titanium dioxide (n = 2.418) diamond does not introduce potential risks due to absence of photocatalytic properties.
Other materials which might be useful include cubic zirconia (n = 2.13), zinc oxide (n = 2.0), and barium sulfate (n = 1.64). White particles have the advantage of being both scatterers and isolators.
9.3. Optical Isolations
Optical isolations (see Figure 29) are recommended to separate the spectral system of the sensor from the spectral characteristics of the sample. Note that most genuine samples display strong intrinsic absorption, fluorescence or scattering capability. An optical isolation is essentially an opaque layer (e.g., soot particles dispersed in the matrix), which is coated over the sensor layer. It also prevents external light entering the sensor, for example sunlight, which otherwise may lead to accelerated dye bleaching or result in saturation of the photodetector. Optical isolations are particularly important in case of highly scattering or absorbing samples, such as blood, sediments, or microbial systems. Most commonly, optical isolations are prepared from lamp black, Fe2O3 (red), BaSO4 (white), or surface-modified TiO2 (white). The surface modification of TiO2 is necessary to prevent photocatalytic reactions that may deteriorate the sensing chemistry. White optical isolations do allow some scattered ambient light to penetrate the sensing layer whereas the black ones of adequate thickness completely block it. Black optical isolations are commercially available (https://www.acktar.com/).
Figure 29.
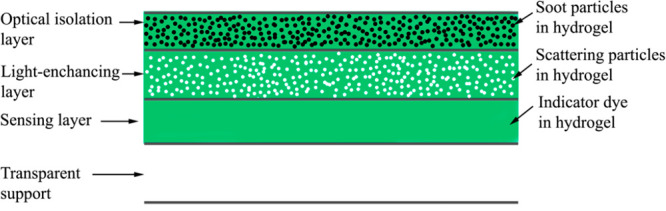
Cross-section of a planar optode with light-enhancing and optical isolation layers. The same design can be adapted for fiber-optic sensors. The upper layers are knife-coated or sprayed onto a dry sensing layer. Dissolution of the upper part of the sensing layer ensures good adhesion but also bears the risk of dye extraction in case of physically entrapped indicators.
The design of a sensor with optical isolation is not straightforward. In principle, a black optical isolation layer can be directly coated onto the dry pH sensing layer. On the basis of the same polymer dissolved in the same solvent, the second layer dissolves the upper part of the sensing layer and this warrants excellent adhesion between the two layers. However, it is advisable to add a light-scattering layer between the sensing layer and the black optical isolation layer to enhance the fluorescence signals (3-layer design, Figure 29). Alternatively, to reduce the complexity of the system, it is also possible to coat the optical isolation layer on the sensing layer containing light scattering particles (2-layer design). Obviously, the light-scattering and optical isolation layers should be proton-permeable. If the indicator is noncovalently entrapped into the sensing layer the multilayer design bears the risk of its migration into upper layers that may result in sensor drift. In this case, a proton permeable polymer that is a poor solvent for the indicator is the preferable material for optical isolation. For instance, amphiphilic indicators typically show low solubility in pHEMA which can be coated on polyurethane hydrogel layer using the same solvent mixture. In case of the systems with low or nonexisting risk of indicator migration (indicators covalently embedded into polymeric matrices; indicators entrapped into dense sol–gel network), the two additional layers can be composed of any proton-permeable polymer. It is also possible to obtain an optical isolation layer by spraying a commercially available soot dispersion in isopropanol onto the light-enhancing layer. The residual solvent swells the hydrogel layer, which enhances the adhesion of carbon particles on the surface. The right settings (such as the distance from the spraying head to the sensor foil) are crucial to obtain a homogeneous layer: If the solvent is completely evaporated, the soot particles will not adhere well and too much residual solvent may cause deformation of the sensing layer due to its dissolution.
It should be kept in mind that the additional layers slow down the response of the sensors. Therefore, additional coatings can be omitted if the above-mentioned light interferences are not critical.
9.4. Materials Acting As Inert Mechanical Support
Planar optodes require a support that is supposed to have following properties: (i) mechanical stability, (ii) transparency to the excitation and emission light, (iii) chemical and photochemical inertness, (iv) resistance to solvents used for coating of the pH sensing layer, (v) low or no background fluorescence, and (vi) allow adhesion of the pH sensing layer. Poly(ethylene terephthalates) (PET, such as Mylar or related brands) fulfill virtually all these requirements. It is the support of choice in most planar optodes reported so far, commercial products included. The autofluorescence of PET can only be observed under excitation with UV or violet light, which again underpins the advantage of longwave indicators. The foils coated with the sensing material can be conveniently punched or cut into spots of several millimeters in diameter.
The sensing layer may be further treated with an oxygen or nitrogen plasma to result in a more hydrophilic surface and thus to promote adhesion of the hydrogel.922,923
Glass supports are less common in case of planar optodes due to lower flexibility in the dimensions and postprocessing. However, glass surface can be modified in many ways via silanization and sol–gel chemistry.123 This is particularly attractive for covalent coupling of the sensing layer.
In fiber-optic sensors, the fiber acts as a solid support. Glass fibers can be modified as described above, and plastic poly(methyl methacrylate) fibers can be directly coated with the sensing material but adhesion of hydrophilic hydrogels on the hydrophobic surface may not be optimal. It should be kept in mind that PMMA dissolves or swells in many organic solvents.
9.5. Photostabilizers
Oxygen practically is omnipresent. Organic dyes in the first excited singlet state can convert triplet oxygen (3Σg– O2) to singlet oxygen (1Δg, 1O2) which then can react with indicators to give nonluminescent products of photo-oxidation. Singlet oxygen can also attack polymer backbones. Quenching of the singlet excited state by molecular oxygen is relatively inefficient because of the short lifetime of the former. On the other hand, efficient generation of singlet oxygen is expected from metal–organic phosphorescent indicators and in organic molecules with significant probability of intersystem crossing, such as porphyrins.
Photodecomposition of indicators is particularly efficient under strong UV radiation, when using strong light sources, and under continuous illumination. It can be reduced by applying pulsed light excitation or low radiant powers. Three strategies have been employed to prevent photodecomposition. The first consists in the fluorination of the indicator dye, the second in the incorporation of protective functional groups (such as tertiary amino groups) into the indicator dye, and the third by simply adding a stabilizer to the sensor matrix. This section mainly refers to additives.
It was reported quite some time ago924 that olefinic and aromatic molecules carrying tertiary amino substituents are very stable toward photodegradation by 1O2. This was exploited to prevent indicators from being oxidized by 1O2 by addition of tertiary amines925 to the sensor matrix. They physically quench 1O2, for instance 1,4-diazabicyclo-[2.2.2]octane (DABCO).926−928 Other stabilizes (e.g., carotene)929 chemically react with 1O2 and thus are consumed. Other donors that can decompose 1O2 include certain sulfur compounds,930 astaxanthin,931 allylurea,932 azides.933,934 Molecules where a reducing and an oxidizing moiety are covalently linked have been reported.935 Very recently, Demchenko936 has presented a topical review on mechanisms of photobleaching of organic fluorophores, and on ways how to prevent it.
10. Luminescent Sensors
Luminescent pH sensors are the ones most often reported in recent years. Numerous spectroscopies and read-out schemes have been reported. They are summarized in this section.
10.1. Intensity-Based Sensors
Measurement of luminescence intensity at a single wavelength is common in case of pH sensors but mainly restricted to characterization of the new materials at an early stage of sensor development. It enables fast screening of these materials with respect to the analytical range, and signal change. However, it is less suitable for practical applications since the signal of the sensor is affected by the intensity of the light source, sensitivity of the photodetector, thickness of the sensing layer, or its distance from the optical fiber (for the sensor spots positioned on the inner wall of a glass window). Self-referenced indicators explore either measurement of luminescence decay time (described in section 10.2) or measurement of luminescence intensity at several wavelengths (ratiometric probes, section 2.11).
The first type of ratiometric pH indicators explores a difference in fluorescence excitation spectra for protonated and deprotonated forms. Such scheme is particularly useful in case of indicators, which feature photodissociation in the singlet excited state, such as HPTS (section 4.1), and therefore having identical emission spectra for the protonated and deprotonated forms of the indicator (Figure 30A).36
Figure 30.

Ratiometric luminescent pH sensing. (A) pH dependency of excitation (left) and emission (right) spectrum of 8-hydroxypyrene-1,3,6-trisulfonate HPTS in an aqueous buffer. Reprinted by permission of Springer Nature from ref (36). Copyright Springer Nature 1983. (B) pH-dependent excitation (left) and emission (right, λexc 534 nm) spectra of C-SNARF-1 in an aqueous buffer. Reprinted from ref (445) with permission from Elsevier. Copyright Elsevier, Inc., 1991. (C) pH-dependent emission spectra of the sensing material incorporating an aza-BODIPY pH indicator in hydrogel D4 and reference emitter Egyptian blue used in form of microcrystalline powder in the same matrix. Both emitters are excited at 625 nm. Author version of a figure from ref (153). Copyright American Chemical Society 2013.
Indicators that feature significantly different emission spectra in both forms include seminaphthorhodafluors (SNARFs) (Table S10, Figure 30B). The calibration may alter significantly with the variation of the peak wavelength of the excitation source (e.g., LED) when absorption spectra differ (Figure 30B). In case of spectral overlap of absorption and emission (Table S10, Figure 30B), FRET can occur and shift apparent pKa values. Then, the calibration of the ratiometric sensor is concentration-dependent, resulting in the shift of the inflection point to higher values at lower concentrations of the dye (less effect of FRET).
Ratiometric indicators are valuable for microscopic imaging of pH, but they have been also applied in pH sensing materials. For instance, SNAFL-2 was covalently immobilized into a photo cross-linked poly(acrylamide-co-vinylamine) hydrogel positioned on the tip of optical fiber397 and SNARF-1 isothiocyanate was coupled to pHEMA and immobilized onto a tip of PMMA fiber.56
Since self-referenced indicators are comparably rare, optical pH sensors often contain an additional reference emitter with luminescent properties that do not depend on pH. The best candidate will possess the excitation spectrum similar to that of the pH indicator, but different emission spectrum (Figure 30C). The fluorescein/rhodamine system, despite several limitations, has been used most often (refs (404, 411, 618, 753, 755), (763−766, 788, 836, 876, and 887)). In fact, a referenced measurement can often only be achieved by using 2 different excitation wavelengths (e.g., 488 nm for fluorescein and about 550 nm for the rhodamine dyes) which does not fully compensate for potential drifts (e.g., in the excitation source). Nevertheless, a combination of fluorescein and rhodamine dyes has been widely used probably due to availability of reactive derivatives. For instance, Lei et al.618 prepared mesoporous silica nanoparticles from fluorescein and rhodamine B isothiocyanates.
In case of NIR emitting pH indicators, microcrystalline powders of inorganic phosphor Egyptian Blue (broadband excitation from 500 to 900 nm; λmax,em = 909 nm) were found to be very promising.153 Large Stokes shift of the luminescence of the phosphor is responsible for efficient spectral separation from the fluorescence of the indicator (Figure 30C).
10.2. Decay Time-Based Sensors
Measurement of luminescence decay time represents a self-referenced technique, which is free from the drawbacks of the intensity-based read-out. Generally, the fluorescence lifetime can be measured in frequency domain and in time domain. Phase modulation technique allows calculation of decay time from the fluorescence phase shift Φ (τ = tan Φ/2πf). Evidently, in case of indicators with nanosecond decay times, the modulation frequencies have to be very high (10–300 MHz) to measure phase shift reliably. Longer decay times (e.g., typical for some QDs and metal–ligand complexes) require lower modulation frequencies and thus cheaper instrumentation. Importantly, phase modulation technique allows measurement of the average decay time so that the calculated values will be affected by the level of background fluorescence, which, however, can be minimized by using long-wavelength probes. Time domain measurement of fluorescence decay time is usually realized using time correlated single-photon counting technique (TCSPC). Providing that the fluorescence decay time of the probe is much longer than of the background, the background signal can be almost completely eliminated. However, TCSPC, which is widely used for fluorescence lifetime imaging (FLIM), is neither very compact nor very cheap, it requires high quality pulsed light sources and is therefore less suitable for application in compact optical sensor devices.
In contrast to optical oxygen sensors, which rely on dynamic luminescence quenching,132 the situation is more complicated in case of fluorescent pH indicators. With the exception of FRET-based systems (section 10.4), measurement of the decay time with a single indicator dye is only possible if (i) both indicator forms are emissive and (ii) they have significantly different fluorescence decay times. Evidently, because two forms with different decay times coexist, the overall signal cannot be described by monoexponential model. An alteration of pH shifts the ratio of the two forms, and this results in the change of the respective amplitudes in the biexponential signal. However, for practical purposes it is often sufficient to measure average decay time of the sensor.
Because of the above requirements, the number of pH probes suitable for the decay time read-out is rather limited. Lakowicz and co-workers demonstrated that the fluorescence lifetime of SNARFs can serve as an analytical parameter (Figure 31A).937 Frequency domain measurement of the fluorescence phase shift and decay time revealed dependence of the calibration curves and pKa´ on the wavelength at which the fluorescence was excited and detected. Evidently, design of solid state sensors based on dyes like SNARF or SNAFL is more challenging because of relatively high concentration of the dye in matrix and very strong overlap between the emission of the protonated form and the absorption of the deprotonated form of the indicator. This results in an efficient FRET affecting the pH calibration in terms of both fluorescent intensity and decay time response.
Figure 31.

Examples of decay time sensing of pH. (A) Fluorescence phase shift and decay time response of SNARF-6 to pH under 543 nm excitation and emission detected at different wavelengths. Adapted with permission from ref (937). Copyright American Chemical Society 1993. (B) Decay time response of the Cu-doped gradient-alloyed CdZnS nanoparticles to pH. Adapted with permission of The Royal Society of Chemistry from ref (798). Copyright The Royal Society of Chemistry 2015. Permission conveyed through Copyright Clearance Center, Inc.
Sensors based on probes exploring photoinduced electron transfer can be more advantageous since the emission spectra of the protonated and deprotonated forms are very similar and the complications due to concentration-dependent FRET effect are not expected. Indeed, Draxler and Lippitsch showed66 that the sensor based on diethylaminomethylpyrene embedded into a polyurethane hydrogel shows no concentration-dependent effects. Unfortunately, numerous “on”–“off” probes are not suitable for this read-out. However, such read-out becomes possible if the PET effect is comparably inefficient. This can be achieved by rational design of the probe by combining a receptor with relatively high oxidation potential and the chromophore with relatively low reduction potential, by shifting the absorption of the chromophore to longer wavelengths or by reducing polarity of the matrix.373 For example, Aigner et al.482 designed a decay time pH probe based on an alkylamine receptor and perylene chromophore. The negatively charged indicator embedded into positively charged Rl-100 nanobeads showed a decrease in fluorescence decay time from 6.7 to 4.6 ns on going from pH 4.5 to pH 8.
The decay times of organic chromophores rarely exceeds 10 ns and is often significantly shorter. Therefore, fluorescence background may significantly affect the lifetime measurement particularly in case of the indicator form with the shortest decay time. Several probes featuring long decay times have been developed. The above-mentioned diethylaminomethylpyrene features decay times of 160 ns for the acid form and 22 ns for the base form.66 The protonated form of acridine also features very long fluorescence decay time of 31.6 ns, whereas τ for the deprotonated form is 6.6 ns.533 Ryder et al.533 designed a pH sensor based on acridine immobilized into Nafion 117 membrane. The dye retained high lifetime dynamics (33 and 14 ns for the protonated and deprotonated forms, respectively) in the matrix.
Quantum dots represent bright and photostable emitters. Their decay times are significantly longer than those of most organic chromophores. Orte et al.801 demonstrated that modification of commercially available CdSe/ZnS QDs (λmax,em = 535 nm) with mercaptopropionic acid renders them pH sensitive. The average decay time increases from 8.7 to 15.4 ns on going from pH 5–9.
Cu-doped gradient-alloyed CdZnS QDs (⌀ = 3.5 nm) reported by Chen et al.798 showed tunable NIR fluorescence (650–750 nm) and very long decay time approaching 1 μs. The luminescence lifetime has a sigmoidal dependence on pH with a linear range from pH 5.5–7.0 (Figure 31B). It changed almost 4-fold (200 ns at pH 4 to 900 ns at pH 8). Other promising QDs nanosensors explore FRET effect (section 10.4).808
The decay time of Pt nanoclusters was reported to show strong pH dependence.938 The decay time changes from 21 to 10 ns when going from pH 5 to 9 due to the change of the surface states (zeta potential changes from −0.83 mV to −20.80 mV from acidic to alkaline pH).
Finally, metal–ligand complexes featuring long-lived luminescence (see section 4.2 for more details) appear to be promising candidates for pH sensing and imaging in the lifetime mode. Indeed, the read-out of the relatively long decay times (>1 μs) can be realized with very compact and cheap instrumentation (phase fluorometer). Main disadvantage of such probes is their cross-talk to oxygen, which is typically proportional to the luminescence decay time, only lanthanide chelates represent a notable exception. The number of these probes, however, is limited and the spectral properties, stability and cross-talk to other species are far from being optimal. As was discussed above (section 4.2), only some indicators are in reality suitable for the lifetime read-out,559 whereas others show strong dependency of the calibration on buffer concentration and composition and are virtually useless.
Selected examples of lifetime-based sensors and nanosensors can be found in Table S11.
10.3. Fluorescence Anisotropy-Based Sensors
The fluorescence anisotropy upon excitation with a polarized light (r) can be defined as follows: r = (III – I⊥)/(III + 2I⊥), where III and I⊥ are the emission intensities detected upon orientation of polarizer parallel and perpendicular to direction of the polarized excitation, respectively.131 Similar to the decay time, anisotropy is a self-referenced parameter which is independent of, for example, intensity of the excitation source or sensitivity of the detector. Importantly, the read-out can be realized with a very simple equipment. Measurement of fluorescence anisotropy is very useful for investigation of binding reactions causing a change in the rotational time of the molecules. The question arises if anisotropy can be a useful parameter in case of pH sensors. For a pH indicator or any other fluorescent molecule, the observed anisotropy will be determined by the fluorescence lifetime τ and the rotational correlation time ϕ as follows: r(t) = r0 exp(−τ/φ), where r0 is the intrinsic anisotropy of the molecule.939 Thus, to observe a change in anisotropy the pH indicator should possess a short fluorescence lifetime (well below 1 ns) or be located in a highly viscous environment. It should also show a pronounced change in the fluorescence decay time upon (de)protonation but simultaneously possess comparable fluorescence quantum yields. Evidently, very few fluorescent pH indicators fulfill these requirements; however, viscosity/rigidity of the matrixes (polymeric hydrogels and particularly sol–gels) may be sufficient to observe an effect for fluorophores with decay times of several ns. An example of such system was presented by Lippitsch,940 who demonstrated potential suitability of 10-diethylaminomethylanthracene for pH sensing (albeit for dissolved dye) via anisotropy. The dye features a long fluorescence decay time of 20 ns in the acid form but a very short one (<0.1 ns) in the base form. Accordingly, an increase of anisotropy from 0 to 0.15 is observed as pH increases, the dependency almost ideally described by sigmoidal equation. No dependency of the calibration curve on concentration of the indicator was observed but the situation might be different in case of optical sensors where homo FRET can be significant.
Lakowicz et al.941 proposed anisotropy-based read-out of pH sensors by using a reference luminophore. The measured anisotropy r is determined by the intensity weighted average of the anisotropies of indicator and reference. Two combinations of an indicator and a reference luminophore has been proposed: (i) a reference with 0 anisotropy (long decay time) and an indicator with short decay time and (ii) a reference with high anisotropy (oriented fluorophores in stretched polymeric films) and a fluorescent indicator with close to 0 anisotropy. As a proof of concept, the authors used stretched poly(vinyl alcohol) films doped with a conjugated dye Py-2 (Figure 32) as a reference, which have anisotropy close to unity. 6-Carboxyfluorescein was used as a pH indicator in solution. Increase of pH resulted in enhancement of fluorescence of fluorescein and consequently in decrease of anisotropy (Figure 32). As in the case of all ratiometric read-out schemes, any variation in concentration of the indicator or a reference but also the excitation wavelength and the spectral window in which the emission is detected, will affect the calibration plot.
Figure 32.

Examples of anisotropy-based pH sensing. (A) pH dependency of fluorescence anisotropy of 10-diethylaminomethylanthracene in an unspecified solvent. Adapted with permission from ref (940). Copyright American Chemical Society 1993. (B) pH dependency of the emission spectra (left) and anisotropy (right) of the stretched films containing Py-2 (structure shown below) and solution of 6-carboxyfluorescein. Adapted with permission of The Royal Society of Chemistry from ref (941). Copyright The Royal Society of Chemistry 2015. Permission conveyed through Copyright Clearance Center, Inc.
Lippitsch discussed the challenges of designing an optical sensor based on anisotropy measurement.940 Apart from above limitations in availability of suitable indicators and matrices, the performance of the anisotropy sensor is compromised by light scattering, since scattered light is polarized. Thus, measurement in a scattering sample is difficult. To be inert to variation of the turbidity of the probe, the optical sensor must contain an additional black optical isolation layer. This, however, will result in a lower brightness since additives such as titanium dioxide particles (section 9.2) cannot be used to enhance luminescence brightness via scattering. It should also be considered that protonation/deprotonation of the indicator may change the microviscosity of the matrix, which affects anisotropy. Also, reorientation of the fluorophores in the polymer (accelerated at higher temperatures) is likely to compromise the storage stability of such sensors.
10.4. Energy Transfer-Based Sensors
Förster Resonance Energy Transfer (FRET, section 2.2.3) can be very useful in optical pH sensing. It is utilized (i) to convert the response of an absorptiometric indicator (used as a FRET acceptor) into luminescence intensity/decay time change with help of a luminescent energy donor, (ii) to enable ratiometric 2-λ read-out by using a fluorescent pH-insensitive donor and a fluorescent pH-sensitive acceptor, and (iii) to enhance the luminescence brightness of pH sensors or to increase the Stokes shift via addition of energy donors with high molar absorption coefficients. The use of FRET from a fluorescent donor to a nonfluorescent pH-sensitive acceptor was first proposed by Walt and co-workers.44 They prepared a fiber optic sensor containing fluorescent eosin and nonfluorescent pH sensitive phenol red in cross-liked polyacrylamide. Lakowicz and co-workers942 pointed out potential limitations of the FRET approach, such as a drift of calibration, because of a change of the acceptor concentration caused by, for example, osmotic effects. Covalent coupling of an acceptor to a donor was indicated as a promising strategy to overcome the above drawback. Later, the same group reported a sol–gel pH sensor (TMOS) exploring FRET from Texas red hydrazide (TXH) to bromothymol blue (BTB) (1, Figure 33).608 In fact, the emission spectrum of TXH shows almost perfect overlap with the absorption band of deprotonated BTB resulting in fluorescence quenching at pH > 6. Surprisingly, the material exhibited an extreme sensitivity to ionic strength and to the nature of the ions added.
Figure 33.

Chemical structures of the optical pH probes utilizing FRET.
FRET was widely used to design pH nanosensors suitable for ratiometric 2-λ read-out. Chan et al.620 reported semiconducting polymer dots (⌀ = 25 nm) made of fluorescent poly(2,5-di(3′,7′-dimethyloctyl)phenylene-1,4-ethynylene) (PPE) acting as energy donor and fluorescein as an energy acceptor (2, Figure 33). Upon excitation of the PPE (390 nm), the nanoparticles showed pH-sensitive green fluorescence from fluorescein and pH-insensitive blue fluorescence from PPE, used for referencing purpose.
Peng et al.768 prepared polyurethane nanoparticles (⌀ = 137 nm) doped with pH insensitive dyes coumarin 6 and Nile red and absorptiometric pH indicator bromothymol blue (BTB) (3, Figure 33). The coumarin 6 antenna enables efficient excitation with blue light and partly transfers the energy to Nile red. FRET from the coumarin 6 to the protonated form of BTB results in a decrease of green fluorescence (λmax = 500 nm) at low pH (Figure 34). On the other hand, deprotonated form of BTB acts as an energy acceptor for Nile red, resulting in quenching of the red emission at high pH making the nanoparticles suitable for ratiometric read-out.
Figure 34.

Examples of FRET-based pH sensors. (A) Fluorescence spectra (left) and pH calibration plot (right) for ratiometric pH-sensitive nanoparticles based on coumarin 6, Nile red, and BTB. Reprinted with permission from ref (768). Copyright Wiley-VCH Verlag GmbH & Co., KGaA, Weinheim 2010. (B) Luminescence lifetime-based pH sensing utilizing FRET from the phosphorescent Ru(II) polypyridyl dye to a pH-sensitive aza-dye. Reprinted with permission from ref (944). Copyright American Chemical Society 1998.
FRET represents an efficient way to increase the brightness of the optical sensors.943 The energy acceptor is an indicator, which possesses the desired properties but features comparably low molar absorption coefficients and therefore low brightness. Addition of bright antenna fluorophores helps to overcome this limitation. Larsen et al.374 used a coumarin antenna (Macrolex yellow) to enhance the brightness of 1-hydroxypyrene-3,6,8-tris-bis(2-ethylhexyl)sulfonamide (HPTS(DHA)3), 4, Figure 33. The absorption of the deprotonated form of HPTS(DHA)3 (λmax = 525 nm) almost ideally overlaps with the emission of the coumarin (λmax = 505 nm) resulting is strong fluorescence enhancement upon excitation with blue light. On the contrary, the protonated form of the pH indicator absorbs at 433 nm, so no FRET is possible and the emission from the coumarin is observed. Thus, the sensor is suitable for ratiometric 2-λ read-out realized via measuring of green fluorescence from the coumarin (low pH) and orange fluorescence from HPTS(DHA)3 (high pH).
Nanoparticles based on conformational changes in the polymer, which promotes FRET between the chromophores represent a very interesting approach.871,877 Also, many nanosensors based on inorganic semiconductor quantum dots employ FRET to render the emission pH sensitive.807,808 Often, this allows to generate pH-dependent changes in the fluorescence decay time and makes the probes suitable for FLIM imaging.808 Notably, the fluorescence lifetime of QDs is significantly longer that of organic fluorophores so that the fluorescence background can be efficiently eliminated even in the quenched state.
As was mentioned in section 10.2, measurement of relatively long luminescent lifetimes is attractive from practical point of view. Apart from metal–ligand complexes, which show intrinsic response of their decay time to pH, it is also possible to design optical sensors based on FRET. Here, a bright pH-insensitive luminescent metal complex acts as an energy donor whereas a pH indicator acts as an energy acceptor in one of its forms. Importantly, a wide range of absorptiometric indicators can be used. Kosh et al.944 prepared several sensors based on ruthenium(II) tris-4,4-diphenyl-2,2-dipyridyl as an energy donor and a pH-sensitive dye (BTB or an aza-dye) as an energy acceptor (5, Figure 33). The efficiency of FRET was highly dependent on BTB concentration, and 10 mmol/kg of BTB was necessary to achieve sufficient response. FRET was efficient at high pH, resulting in decrease of the luminescence lifetime of the Ru(II) complex from 1.44 μs at pH 5 to 0.76 μs at pH 9 (Figure 34). The cross-sensitivity to oxygen was very modest: reduction of the decay time from 1.38 to 1.31 μs at pH 6 was observed on changing from O2-free to air-saturated solution, which is equivalent in error of 0.16 pH units. Nevertheless, photosensitized singlet oxygen accelerated photodegradation of the pH indicator, particularly in its deprotonated form. More advantageously, the distance between the donor and acceptor can be kept constant with help of a covalently bound spacer (6945 and 8,946Figure 33). As energy donors, Eu(III) chelates (7550,947 and 8,946Figure 33) represent an interesting alternative to the Ru(II) complexes since their luminescence is only slightly quenched by oxygen despite long decay times of several hundreds of microseconds.
Dalfen et al.524 reported pH sensors utilizing diazaoxotriangulenium (DAOTA) dyes (9, Figure 33). In solution, the indicators showed “on”–“off” behavior due to fluorescence quenching via photoinduced electron transfer. In contrast, a clear dependency of the fluorescence decay time was observed for the dyes immobilized into polyurethane hydrogel. The lifetime response was the most pronounced for the sensors using high dye loading (0.5–1 wt %) and was attributed to homo-FRET from the fluorescent protonated to nonfluorescent deprotonated form of the dye.
A comparative table of optical pH sensors based on FRET can be found in the Supporting Information (Table S12).
The above examples demonstrated usefulness of FRET in design of optical pH sensors. Limitations of these sensors arise from the fact that FRET efficiency is determined by the distance between the donor and acceptor and consequently their concentration in the sensing material. Thus, if the pH indicator that acts as a FRET acceptor is leached out of the sensor, a substantial drift of the calibration is expected. Water uptake (swelling) of the polymers might be affected by temperature or ionic strength, which, therefore, may also affect the calibration. Preparation of conjugates in which donor and acceptor are covalently coupled through a spacer, is a preferable strategy to minimize the above effects, but it can be challenging from synthetic point of view. In case of phosphorescent energy donors, photobleaching can be very fast due production of highly reactive singlet oxygen. Evidently, destruction of the donor or acceptor by photosensitized singlet oxygen will result in the sensor drift.
10.5. Other Luminescent Sensing Schemes for pH
Several reported pH optodes rely on the inner-filter effect on fluorescence. These sensors are based on absorptiometric indicators (section 3), which are highly versatile with respect to their chemical structure and acidity constants. Some of the cross-sensitivities of fluorescence (e.g., dynamic quenching) can be avoided. In this method, the intensity of an inert emitter (fluorescent dye, quantum dot, inorganic phosphor) is modulated by the pH-dependent absorption of the indicator, which screens off excitation light or emitted light. To obtain a ratiometric response, a mixture of several emitters can be used. For example, Suzuki and co-workers948 fabricated a pH sensor, which contained two types of photostable quantum dots (λem = 525 and 605 nm, respectively) embedded into a sol–gel layer and a colorimetric indicator (Congo red or Basic Fuchsin) immobilized into a second sol–gel layer. Both sensors showed decrease of the red fluorescence at lower pH accompanied by simultaneous enhancement of the green fluorescence. The sensors based on the use of Congo red or Basic Fuchsin showed dynamic ranges between pH 2–6 and 0.2–1.2. A wide-range sensor (containing a mixture of neutral red and methyl yellow) covering the pH range from 4 to 10 was also prepared and showed remarkably linear calibration but also relatively low resolution.
Borisov and Klimant reported a similar approach949 but used inorganic phosphor micropowders as luminescent emitters. Compared to metal(organic) dyes and quantum dots, these emitters show exceptional chemical and photochemical stability and inertness to potentially interfering species such as oxygen or ions. On the other hand, the brightness of the phosphors is lower than that of the dyes. Broad-band excitation and/or emission spectra allow using a single phosphor for ratiometric 2-wavelength read-out based inner filter effect. For instance, in the first concept (Figure 35A) the NIR emission of chromium(III)-doped gadolinium aluminum borate (Cr-GAB) was modulated by the pH-dependent absorption of an aza-BODIPY indicator (section 4.1) due to overlap of the protonated and deprotonated forms of the indicator with short-wavelength and long-wavelength components, respectively, of the broad emission of Cr-GAB (Figure 35B). Long luminescence decay time of the phosphor (85 μs) enabled complete elimination of the background fluorescence originating from the protonated form of aza-BODIPY, which otherwise interferes (Figure 35). Reliable ratiometric 2−λ read-out was possible (Figure 35B, inset). In the second mode, the pH indicator m-cresol purple was used. Cr-GAB features two excitation bands in the blue and orange parts of the spectrum. The protonated and deprotonated forms of m-cresol purple overlap with the first and the second excitation bands of the phosphor, respectively, thus making ratiometric measurement in the excitation mode possible. The phosphor Egyptian blue features similar properties (broad excitation at 500–700 nm, NIR emission at >800 nm) and also is suitable for the ratiometric read-out in the excitation mode.153 It was also shown that simultaneous sensing of pH and temperature is possible.949 Cr(III)-activated yttrium aluminum borate is used as a phosphor that has identical excitation spectra at different temperatures but its decay time is highly temperature-dependent.
Figure 35.
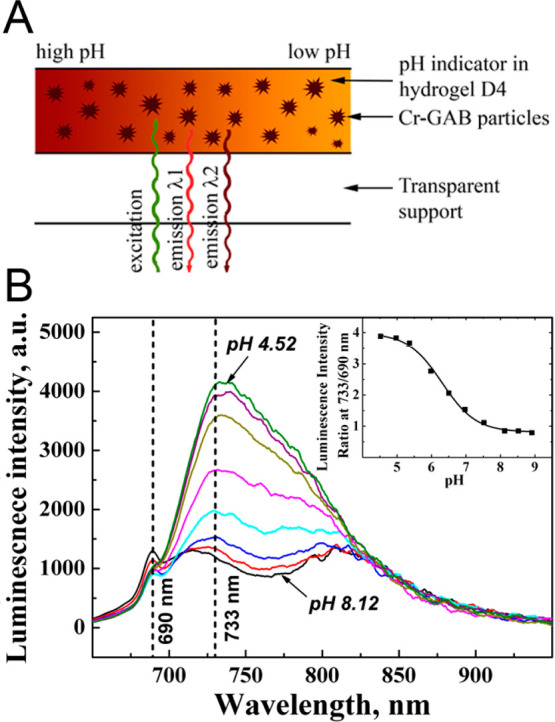
(A) Cross-section of an optical pH sensor based on inner-filter effect read-out. (B) Emission spectra of the pH sensor (λexc = 590 nm) obtained in a time-resolved measurement (delay 20 μs) and resulting calibration curve (inset). Reprinted from ref (949) with permission from Elsevier. Copyright Elsevier B.V. 2013.
Wolfbeis and co-workers950 made use of the inner-filter effect to design an upconversion-based pH sensor. NaYF4:Er,Yb nanorods (50 nm in diameter and 950 nm in length) show pH-independent green (511–566 nm) and red (635–685 nm) emission under excitation with a 980 nm laser. The nanorods were dispersed in a polyurethane hydrogel containing dissolved bromothymol blue (BTB). The absorption of BTB overlaps the emission, which therefore can be modulated by pH. The effect was found to be different for the two bands, which enables ratiometric measurement. In further work,951 the indicator was substituted by neutral red, which is more lipophilic and enables better modulation of the green luminescence of the nanorods. Analogous systems were reported by Xi et al.952 (section 10.6) and Strobl et al.,953 who used a combination of a molybdate phosphor doped with Yb(III), Ho(III), and Tm(III) and a NIR-absorbing aza-BODIPY indicator.
The red fluorescence of 2 nm gold nanoclusters (AuNCs), with excitation/emission peaks at 470/640 nm, is strongly modulated by the pH indicator BTB.954 BTB is present in a bovine serum albumin shell on the AuNCs. Sensitivity to pH results from an inner filter effect due to spectral overlap between the pH-dependent absorption of BTB and the emission of the AuNCs. The method was applied to quantify and to image pH values (between 5 and 9) that occur after the death of red blood cells. Such pH changes are considered as a potential forensic marker for estimating the time passed since death has occurred.
10.6. pH Sensors Based on Upconversion and 2-Photon Absorption
Probes that emit at wavelength shorter than the excitation wavelength, are of high interest for their ability to eliminate fluorescence background. Anti-Stokes luminescence can be generated via three main types: (i) lanthanide upconversion, (ii) triplet–triplet annihilation based upconversion (TTAU), and (iii) multiphoton absorption (most prominently two photon, 2-P). TTAU has been almost exclusively investigated for energy conversion applications and has not been explored for design of pH probes that is explained by strong oxygen quenching of the molecules in the triplet state that are involved in the upconversion process. On the other hand, several pH sensors based on lanthanide upconversion and two-photon excitation have been reported. For these two types, the luminescence quantum yields are much lower than for conventional single-photon probes. Therefore, the required energies of excitation light vary from high (lanthanide upconversion) to very high (2-P excitation). Consequently, the scope of 2-P probes is restricted to microscopic imaging, which is also the main application of the lanthanide upconversion.
Application of lanthanide upconversion in microsensors and planar optodes is still possible but advantages of the anti-Stokes luminescence are balanced by the bulkiness of the setup. In case of bulk optodes, a good NIR probe can deliver very low levels of autofluorescence. pH sensors based on upconverting materials benefit from high chemical and photochemical stability of the inorganic upconverting emitters. Wolfbeis and co-workers950 were the first to report a pH sensor relying on lanthanide upconversion. They modulated the upconverted green and red luminescence of NaYF4:Er3+,Yb3+ nanorods (emission λmax = 540 and 660 nm) via an inner-filter effect (section 2.2.4) caused by the pH indicator bromothymol blue (Figure 36A). Both components were embedded into a polyurethane hydrogel layer. Referenced ratiometric measurement is possible since the red emission of the nanorods is modulated to a higher extent (2-fold intensity decrease from pH 6 to 10) than the green one. In further work reported by the same group, bromothymol blue was substituted by neutral red.951 The protonated form of the latter almost perfectly overlaps the green emission of the upconverting nanoparticles resulting in a strong inner filter effect. Since the indicator does not absorb in the red part of the spectrum, the red emission from the nanorods is not modulated by pH and is suitable for referencing. For the first time, ratiometric RGB imaging (see section 11.1 for more details) with planar optodes under NIR excitation became possible because both green and red emission from the upconverting nanoparticles (UCNPs) almost perfectly overlap with the respective color channels of an RGB camera. Anker and co-workers prepared a rather complex sensor utilizing a layer containing UCNPs and a pH-sensitive layer based on bromocresol green in a sol–gel material.955 Since the deprotonated form of the dye only partly overlaps the red emission band of Er3+, the upconverted emissions at 671 and 661 nm are modulated to a different extent. In practice, it is challenging to separate two emission peaks separated by only 10 nm.
Figure 36.

Examples of pH sensors based on lanthanide upconversion. (A) pH-dependent upconversion spectra for the sensor film utilizing NaYF4:Er3+,Yb3+ nanorods and bromothymol blue. Reprinted with permission of The Royal Society of Chemistry from ref (950). Copyright The Royal Society of Chemistry 2009. (B) pH-dependent upconversion spectra of the sensor film containing NaCaY0.2Yb0.7Tm0.02Ho0.08(MoO4)3 microcrystalline powder and an aza-BODIPY pH indicator and the respective calibration plot (inset). Reprinted from ref (953) with permission from Elsevier. Copyright Elsevier B.V. 2017. (C) Emission spectra of the NaYF4:Yb3+,Er3+ nanorods (inset) together with the absorption spectra of the ETH 5418 pH indicator in protonated and deprotonated forms. Reprinted with permission from ref (952). Copyright American Chemical Society 2012. (D) pH-dependent upconversion spectra for the sensor film containing NaYF4:Yb3+,Er3+ nanorods and ETH 5418 in plasticized poly(vinyl chloride) and the respective calibration plot (inset). Reprinted with permission from ref (952). Copyright American Chemical Society 2012.
Xi et al.952 demonstrated that the response of an upconversion sensor can be further improved by using indicators if spectral properties better match the emission of the lanthanide nanorods. The absorption of the protonated form of a lipophilic Nile blue derivative (ETH 5418, Chromoionophore VII, λmax = 670 nm; designed by Simon et al.86,87) shows almost perfect overlap with the red emission of the nanorods, whereas the absorption of the deprotonated form (λmax = 525 nm) matches very well with the green emission of the nanorods (Figure 36C). Consequently, the luminescence intensity at 660 nm increases as the pH increases, and the opposite effect is observed for the green emission (Figure 36D). Since the pH indicator and the nanorods were embedded in a matrix consisting of poly(vinyl chloride), sodium tetrakis-[3,5-bis(trifluoromethyl) phenyl] borate and a plasticizer were necessary.
The above nanosensors are based on the NaYF4:Er3+,Yb3+ phosphor and utilize the dual emission of the Er3+ (green and red). Strobl et al.953 presented an attractive alternative. A molybdate host was doped with Yb3+, Ho3+, and Tm3+ to give dual (red; λmax = 645 nm and NIR; λmax = 797 nm) emission under 980 nm excitation (Figure 36B). The NIR emission of the phosphor decreased in basic media due to rise of the NIR absorption of the aza-BODIPY indicator, whereas the red emission of the phosphor remained almost constant and can serve as a reference. Ma et al.956 coupled the pH sensitive dye xylenol orange to the amino-modified surface of silica-coated UCNPs (NaYF4:Yb3+,Tm3+). Because of an inner filter effect, the protonated form of xylenol orange reduced the fluorescence intensity of the blue upconverted emission, whereas red emission from the beads remained unchanged.
NaYF4:Yb3+,Tm3+ UCNPs have inert dual emission (blue, 451 and 475 nm; red, 646 nm) under 980 excitation.957 The blue emission can be used to excite a BODIPY dye equipped with a pH-sensitive PET group and is spectrally well separated from the fluorescence (green, 500–600 nm) of the dye. The red UC emission serves as a reference for ratiometric measurement.
Other authors utilized FRET from the upconverted phosphor to a pH sensitive indicator. Schäferling and co-workers958 coated NaYF4:Yb3+,Er3+ nanocrystals with a silica shell and further modified it with the pH indicator pHrodo Red. Under NIR excitation, the organic dye emitted upconverted emission at 590 nm as a result of the energy transfer from the lanthanide nanoparticles. Unfortunately, sensitization of the fluorescence was very inefficient, most likely because of a too large distance between donor and acceptor. Li et al. noncovalently immobilized a pH sensitive hemicyanine dye onto core–shell–shell upconverting Yb3+, Tm3+-doped particles to obtain ratiometric green/red emission response.959
Tsai et al.960 investigated the mechanism of pH-sensitivity of upconversion nanoparticles that are coupled to pH indicators. They electrostatically bound the indicators to UCNPs with polyethylenimine shells of varying thickness. For the thick layer shells, the pH effect was solely due to the inner filter effect. For the thin layer shells, the situation was more complex. Contrary to previous expectation, the main effect remained emission-reabsorption. The resonance energy transfer occurred only with ∼10% efficiency. This is attributed to the fact that only Er3+ ions close to the surface are within the Förster distance for UC-RET with the dye.
Several groups utilized a common strategy of coating the UCNPs (capped with oleic acid) with polyethylenimine layer to introduce amino groups and subsequent covalent coupling of a pH indicator to the latter. Kong and co-workers used NaYF4:Yb3+,Tm3+ nanoparticles in combination with a fluorescein dye.961 The dye acted as a FRET acceptor, which was confirmed by the strong decrease of the luminescence decay time of the upconverted green emission after dye coupling. Because of the pH-dependent FRET, the blue emission of the nanoparticles (λmax = 475 nm) decreased and the green emission of fluorescein (λmax = 510 nm) increased with increasing pH, whereas the red upconverted emission was pH-independent and served as a reference. Another group utilized a similar material but doped Nd3+ into the inner shell to enable sensitization at 808 nm in addition to the typical sensitization wavelength of 980 nm because of Yb3+.962 Finally, Schäferling and co-workers used polyethylenimine-coated NaYF4:Yb3+,Er3+ instead of NaYF4:Yb3+,Tm3+ beads and yellow light emitting pHrodo red indicator instead of FITC.963 This material enabled ratiometric sensing and imaging of intracellular pH.963
In contrast to the above upconversion based pH sensors, the pH sensor reported by Zhao and co-workers883 explored the quenching properties of graphite oxide. Positively charged polyethylenimine-coated NaYF4:Yb3+,Er3+ nanoparticles were electrostatically immobilized on graphite oxide nanosheets. This resulted in the formation of ∼50 nm large composites, which showed linear decrease of luminescence intensity (λmax = 540 nm, 980 nm excitation) in the pH range 5.0–8.0. This change was attributed to an increase of the negative charge of graphite oxide and in a shortening of the distance between the UCNPs and the quencher promoted by stronger electrostatic interaction. A bulk optode was constructed by depositing the nanoparticles into the pores of a membrane filter via vacuum filtration. The extent of quenching was rather moderate (35%) but sensing was fully reversible. A similar material modified with APTES has a slightly wider pH range from 5 to 9.964
It should be noted that several reported upconverting pH “sensors” are actually only single-shot assays since the UCNPs are simply dispersed in an aqueous solution of a pH sensitive dye.965,966 The state of the art in upconversion luminescence based pH nanoprobes has been reviewed by Mahata et al.698
The pH probes based on lanthanide upconversion are summarized in Table S13.
Two photon (2-P) excitation is another attractive possibility to eliminate the autofluorescence. In case of 2-P probes, the intensity of the emission is proportional to the square of the excitation light intensity. This makes them attractive for imaging applications due to better resolution and lower photobleaching rates compared to 1-P probes. Additional benefits include better penetration depth of NIR light, which is useful for imaging in tissues and tissue models, such as spheroids. By analogy to the brightness of conventional probes determined by molar absorption coefficient and luminescence quantum yield, the brightness of 2-P probes depends on their quantum yield and 2-P absorption cross-section (σ2). Unfortunately, most conventional 1-P dyes are poor two photon absorbers with a 2-P cross-section of 1–20 Goeppert Mayer (GM) units. Compared to 2-P excitable pH probes (indicator molecules),967,968 the number of 2-P nanosensors is even smaller. For instance, Jia et al.853 reported on carbon dots with 2-photon absorption and pH-sensitive emission. The fluorescence intensity decreases on going from pH 4 to 8. Kong et al.969 prepared carbon dots with a very high 2-P cross-section of 32 000 ± 4500 GM at 800 nm. The carbon dots have surface bound terpyridine units that induce pH sensitivity in the pH range from 6 to 8.5. They allowed imaging in living cells and tissues in depths up to 185 μm. Kim et al.526 designed a fairly bright pH probe for 2-P imaging based on naphthalenylvinylpyridine incorporated into ormosil beads (⌀ = 33 nm). Both the protonated and neutral form of the dyes are emissive (λmax = 565 nm, ϕ = 0.18 and λmax = 460 nm, ϕ = 0.06). The protonated form can be excited with NIR light (λmax = 800 nm, σ2 = 52 GM), whereas excitation of the neutral form is weaker (λmax = 750 nm, σ2 = 4 GM). Ratiometric emission read-out in the 2-P mode was demonstrated to be possible, and the calibration plot correlates very well with that obtained under 1-P excitation. Deficiencies of such methods include (a) the lack of dedicated pH sensing materials suitable for 2-P read-out, (b) the lack of an adequate referencing method due to nonlinear dependency of the emission light intensity on the intensity of the excitation light, and (c) loss of the excitation light by scattering, which diminishes the signal. All these effects may result in wrong pH values.
10.7. Multiparameter Sensors
The unique possibility of light to guide multiple information simultaneously can be utilized for multiparameter sensing. Simultaneous monitoring of different parameters, such as pH, pO2, and pCO2, is of much interest in biotechnology, marine science, medicine, and many other fields. Basic principles are covered in reviews970,971 and will be only briefly discussed here. One may distinguish between (a) arrays of several spots or fiber sensors in close spatial proximity (poor spatial resolution, not suited for intracellular sensing), (b) several indicators in the sensor layer (μm resolution), (c) several sensor beads in the same polymer host, and (d) indicators sensitive toward two parameters each with distinct influence on the luminescence properties. The advantages of single material multiparameter sensors include high spatial resolution and compact setup. However, they may suffer from optical cross-talks originating from inadequate signal separation. Often, a combination of several probes with desired photophysical properties can be found, but this requires a compromise between the best optical match and other properties, including brightness, photostability, and sensitivity.
Gehrich et al.41 described a sensor array for intravascular measurements composed of three fiber-optic sensors (pH, oxygen, and carbon dioxide) and a thermocouple for compensation of the temperature cross-talk. A discontinued Paratrend sensor (Diametrics Medical)972 adapted a very similar approach (Figure 37A). Another array reported by Weigl et al.76 included a flow-through cell with integrated absorptiometric pH and pCO2 sensors and pO2 sensor based on luminescence quenching. Walt and co-workers modified different parts of an imaging fiber (⌀ = 350 μm) composed of 3000 individual elements with sensing materials for pH, pO2, and pCO2. The modification was performed via photopolymerization by illuminating different areas of the fiber array to deposit the respective “sensing chemistry”.429
Figure 37.
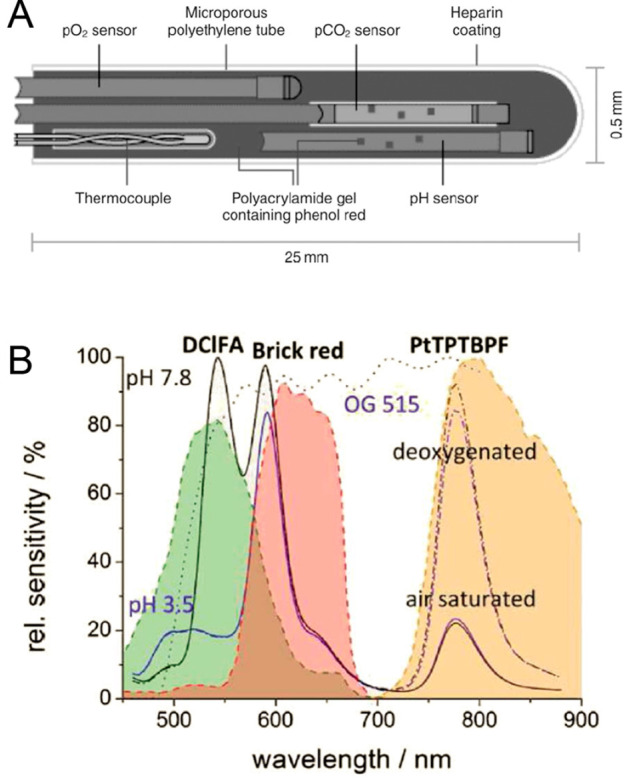
(A) Cross-section of the Paratrend 4-parameter array sensor. Reprinted by permission from Springer Nature from ref (972). Copyright Springer Nature 2004. (B) Spectral properties of the pH/pO2 dual sensor at different pH and oxygen concentrations as well as the spectral sensitivity of the camera channels. (DClFA, 2′,7′-dichloro-5(6)-N-octadecyl-carboxamidofluorescein; PtTPTBPF, platinum(II) meso-tetra(4-fluorophenyl) tetrabenzoporphyrin) Reprinted from ref (973) with public license. Published by The Royal Society of Chemistry.
Multianalyte sensors can be realized in a number of formats (section 14) including fiber-optic sensors,381,419,423 planar optodes,435,921 or nanosensors881,974 (section 8). Multiparameter optodes that rely on use of a single sensing material are mostly limited to dual sensors. It becomes increasingly difficult to find a suitable combination of individual probes but also the complexity of required instrumentation and optical components is increased significantly. In fact, only a few reported sensors can measure 3 or 4 parameters simultaneously.384,398 Among dual sensors, combination of pH with oxygen115,441,703,975 and pH with temperature is most common. Here, we do not consider some “dual” probes reported in the literature, which apart to their response to pH also show response to another parameter.845,976,977 These probes do not allow simultaneous quantification of the analytes since the changes produced by two (or more) analytes are virtually indistinguishable.
The information generated by individual probes is separated either spectrally or via decay time. In the first case, ratiometric approach (section 2.11) is useful. The individual probes and the reference are excited with a single light source but have to have different emission spectra.441,973 The information can be separated by emission filters or an RGB camera. Meier et al. reported a planar optode for simultaneous imaging of pH and oxygen with help of an RGB camera.441 Three types of microparticles (FITC covalently bound to amino-cellulose, Pt(II) porphyrin embedded into polystyrene beads, and diphenylanthracene immobilized into polyacrylonitrile beads) act as probes for pH, oxygen and a reference fluorophore, respectively. All of them are dispersed in a single layer of polyurethane hydrogel, which is permeable for protons and oxygen. The probes show blue (diphenylanthracene), green (FITC), and red (Pt(II) porphyrin) luminescence. In a similar design, Chen and co-workers978 prepared a dual-sensor for pH and oxygen suitable for the read-out with a color chip of a smartphone. Red-emitting oxygen-sensitive nanobeads based on Pt(II) porphyrin were dispersed in a hydrogel composed of cross-linked chitosan. FITC was reacted with the hydrogel to introduce pH sensitivity. Blue-emitting 4,40-bis(2-benzoxazolyl)stilbene served as a reference.
Tian et al.979 immobilized green-emitting 4-amino-1,8-naphthalimide-based pH indicator and red-emitting Pt(II) tetraphenylporphyrin-based oxygen indicator into a cross-linked poly(2-hydroxyethyl methacrylate-co-acrylamide) hydrogel. Since no reference dye has been added, dual sensing of pH and oxygen is only possible in intensity mode. Referencing of the oxygen indicator against pH probe and vice versa can only be performed if one of the two parameters remains constant during calibration and measurement.
Ehgartner et al.973 designed a dual sensor for pH and oxygen by using lipophilic 2′,7′-dichloro-5(6)-N-octadecyl-carboxamidofluorescein (DClFA) as a pH indicator, platinum(II) meso-tetra(4-fluorophenyl)tetrabenzoporphyrin (PtTPTBPF) as an oxygen indicator and fluorescent pigment brick red as a reference. Under excitation with blue light DClFA, brick red, and PtTPTBPF emit in the green, red, and NIR parts of the spectrum (Figure 37B). It was utilized for the read-out with a dual chip RGB-NIR camera.
Spectral overlap between the emission spectra is difficult to avoid in practice. Hence, probes with narrow emission bands are particularly useful. For instance, the very narrow emission band of Eu(III) complexes is beneficial in a dual pH/O2 optode921 and in a triple pH/pO2/temperature optode.384 In the former, the red-emitting Eu(III) complex used as an oxygen probe was combined with NIR-emitting aza-BODIPY pH indicator and a green-emitting coumarin reference. The sensor was used for imaging with a dual chip RGB/NIR camera. It was found that the dual sensor relying on a Pt(II)-porphyrin used instead of the Eu(III) complex suffers from optical cross-talks between oxygen and pH and vice versa due to significantly broader emission spectrum of the Pt(II) porphyrin compared to the Eu(III) complex. In contrast to the above material, the triple sensor reported by Stich et al.384 utilizes another Eu(III) complex as a temperature probe, which is immobilized into poly(vinyl chloride) microparticles to minimize oxygen cross-talk. The pH is detected by a hydroxypyrenetrisulfonate (HPTS) derivative immobilized onto pHEMA beads, and oxygen is monitored by a Pt(II) meso-tetrapentafluorophenylporphyrinlactone (PtTFPPL) in poly(styrene-co-acrylonitrile) microparticles. All three probes are dispersed in a polyurethane hydrogel. They are excited with a 405 nm LED and the signals are clearly separated spectrally: the pH, temperature and pO2 probe emit in the green, red and NIR parts of the spectrum, respectively. Oxygen and temperature are accessed via decay time measurement (imaging in time domain), and pH via ratiometric intensity imaging referenced either to the pO2 or to the temperature probe.
Another triple sensor980 combines HPTS as a pH indicator, ruthenium(II) tris(4,7-diphenyl-1,10-phenanthroline) (Ru-dpp) as an oxygen probe, and CdSeTe quantum dots as a temperature probe. Although the luminescence signals of the indicators are well separated, the sensitivity of the oxygen and temperature probes are rather low (10% intensity change for 0–100% O2 and about 10% intensity change for the temperature probe in the range 10–45 °C).
The dual lifetime referencing technique (section 2.2.7) can be modified so that simultaneous detection of two parameters becomes possible. This method is referred to as mDLR. The information on pH values is obtained from the fluorescence of a pH indicator, which is referenced against the slow-decaying luminescence of the reference dye. The lifetime response of the reference delivers information on the second parameter. This method was demonstrated to be useful both in frequency domain150,381 and in time domain.981
Even 4-parameter sensing (pH, pO2, pCO2, temperature) has been demonstrated.398 The method utilizes a combination of two pairs of optical probes (fluorescent and phosphorescent) which are spectrally independent of each other. The first layer includes oxygen-sensitive phosphorescent Ir(III)-coumarin embedded in polymeric beads made from cross-linked poly(styrene-co-divinylbenzene). They are dispersed in an ethylcellulose layer. Fluorescent HPTS and a quaternary ammonium base are dissolved in ethylcellulose to render the layer CO2-sensitive. Both dyes are excitable by blue light and emit in 500–600 nm window. The information is extracted by measuring the overall phase shift at two modulation frequencies. The upper layer is composed of temperature-sensitive phosphor (a Cr(III)-activated yttrium aluminum borate) and a lipophilic fluorescent SNARF pH indicator in a hydrogel. Both probes can be excited with red light and emit in far-red; they behave completely independently on the pO2 and pCO2 probes. The disadvantages include high complexity of the optical setup and multilayer architecture of the sensing material that combines the hydrophobic lower layer and the hydrophilic upper layer.
Indicators with dual sensitivity reduce the complexity of multiparameter sensors. They eliminate consideration of spectral compatibility and different leaching or photobleaching rates. It can be difficult, however, to find a suitable indicator and a matrix depending on which combination of parameters are to be measured. Wolfbeis982 early demonstrated the feasibility of sensing two parameters (pH, oxygen) with one indicator (HPTS) and introduced two approaches for measurement. In the two wavelength approach, the pH is determined via the ratio of intensities measured at the isosbestic point (pH independent) and the emission peak of the anion. As parameter for oxygen, the fluorescence intensity at the isosbestic point is measured. In the second approach, the oxygen content is assessed via the fluorescence decay time that decreases with increasing oxygen concentration. Other indicators for determination of two parameters (pH/O2, pH/T, CO2/O2, pH/Cl–) were proposed. Papkovsky and co-workers366 reported metalloporphyrins modified with a Schiff base moiety (Figure 38) as indicators for pH/O2 determination. Protonation of the Schiff base results in a decrease of the absorption at 400 nm and the formation of a new maxima at 440 nm. This is accompanied by a decrease of phosphorescence. Phosphorescence is also quenched by oxygen, resulting in decrease of phosphorescence intensity and decay time. Such properties enable simultaneous measurement of pH and oxygen either via (i) measurement of overall emission intensity (influenced by pH and oxygen) and phosphorescence decay time (influenced by oxygen only) or (ii) via measurement of absorbance/reflectance at two wavelengths (the ratio depends only on pH) combined with determination of phosphorescence decay time. The second schema is preferred due to its self-referenced nature. The proper selection of either Pt(II) or Pd(II) complex allows tuning of the dynamic range for oxygen measurement since the decay times of both complexes are largely different.
Figure 38.

Chemical structure and acid–base equilibrium for Pt(II) porphyrin acting as a dual indicator for oxygen (via phosphorescence quenching) and pH (via absorption changes).
Multiparameter sensing and imaging with nanosensors (section 8) is also popular.881,974 The design of multiparameter nanosensors is challenging; in contrast to bulk optodes, the dyes in nanosensors can be located closer to each other promoting undesired quenching via FRET or accelerated photobleaching. Leaching of the indicators and reference dye may be more critical. Spatial separation of the dyes in a core–shell approach appears to be a promising solution. The dual nanosensors reported by Wang et al.881 rely on a unique core–shell structure. A lipophilic oxygen indicator and a reference dye (Pt(II) benzoporphyrin and metal-free porphyrin, respectively) are embedded into a soft hydrophobic poly(propylene oxide) core, which is rigidized with a silane agent; pH sensitive FITC is covalently attached to the poly(ethylene glycol) groups of the shell. The core–shell structure warrants good dispersibility and high stability of the nanosensors (⌀ = 12 nm) in aqueous media, whereas PEG chains render them cell-impermeable. The dyes emit in the green (FITC), red (metal-free porphyrin) and NIR (Pt(II) benzoporphyrin) parts of electromagnetic spectrum with virtually no overlap.
Chen and co-workers974 also prepared nanosensors for pH and oxygen by combining red-emitting Pt(II) porphyrin as an oxygen indicator and green-emitting FITC as a pH indicator in a single particle composed of poly(9,9-dioctylfluorene). The latter acts as a matrix for the dyes but also as an antenna (partly transferring energy to Pt(II) porphyrin) and as a reference fluorophore since its residual blue fluorescence is neither pH nor oxygen-sensitive. As was shown in a related work,983 such approach enables imaging under two photon excitation due to exceptionally large two-photon cross-section of the conjugated polymer. Importantly, to avoid leaching, FITC is covalently attached to amino-modified polystyrene, which is incorporated into nanoparticles upon precipitation. On the other hand, the Pt(II) porphyrin is sufficiently lipophilic to be retained by the polymers.
A lysosome-targeting nanosensor for simultaneous fluorometric imaging of intracellular pH values and temperature was described,984 where three dyes are covalently immobilized in or on 95 nm silica nanoparticles, one acting as a pH probe, one as a temperature indicator, and the third dye (europium(III) complex) as a reference dye. The dual nanosensor responds to pH values in the range from 3.0 to 9.0, and to temperature in the range from 20 to 60 °C. Owing to its good biocompatibility and good sensitivity, the dual nanosensor has been used to monitor changes in local pH values and temperature in the lysosome of HeLa cells.
A dendrimeric nanosensor reported by Srikun et al.707 enabled simultaneous imaging of two parameters: pH and hydrogen peroxide. The G5 PANAM dendrimer was functionalized with the pH indicator SNARF2 and a nonfluorescent boronate ether-modified xanthene dye which generates highly emitting fluorescein upon reaction with hydrogen peroxide. Compensation for the pH effects on fluorescein is necessary and detection of H2O2 is not reversible. pH measurement also provides important information on pH regulation in cells.
In some applications, it may be not necessary to combine both probes in a single material. For instance, a luminescent pH probe and a phosphorescent oxygen probe (both commercially available from Luxcel Biosciences/Agilent) were simultaneously used in microplate readers of various manufactures.985 Measurement of pH and oxygen along with a chemiluminescent ATP assay and total protein measurement via absorption makes it possible to assess bioenergetics of cells. Similarly, Ehgartner et al.703 performed simultaneous sensing of pH and oxygen in microfluidic chips using a mixture of two types of nanoparticles based on poly(styrene-block-vinylpyrrolidone), separately doped with an oxygen indicator (in the hydrophobic core) and a pH indicator (in the hydrophilic shell). Both probes are excited with red light and read out using the mDLR method via phase shift measurement at two modulation frequencies.
Also, a dual sensor was reported that uses 2 different techniques to sense pH and oxygen. The oxygen concentration is accessed via measurement of the phosphorescence decay time of a metallobenzoporphyrin. The pH is measured via surface-enhanced Raman spectroscopy of gold nanoparticles capped with pH-sensitive 4-mercaptobenzoic acid. Microcapsules containing the sensing chemistry for either pH or oxygen were incorporated into a hydrogel. Although being complex, the system proved the feasibility of multimodal optical sensing.
Wang et al.893 designed silica-coated polystyrene nanoparticles for simultaneous measurement of temperature, oxygen, and pH. Fluorescein, CrBPh4, and 5,10,15,20-tetrakis(pentafluorophenyl) porphyrin or Nile red were used as pH-, O2/T-indicator and reference dye, respectively. After amino-modification of the silica coated polystyrene nanoparticles, fluorescein was covalently coupled and used for ratiometric pH measurement around its pKa´ of 6.5. The triple parameter nanosensor covered the physiologically relevant parameter ranges with a single excitation wavelength.
A referenced triple sensor for intracellular measurement of temperature, pH, and oxygen concentration was presented by the group of Wang.986 Bovine serum albumin (BSA) is selected as the scaffold (support) to which four fluorophores were linked. The following luminophores were used: (a) fluorescein as a probe for pH values, (b) a platinum(II) porphyrin complex for oxygen, (c) a europium(III) clathrate complex for temperature, and (d) rhodamine B as a reference dye. The nanoparticles have a size of 20 nm and show excellent biocompatibility and good brightness. The nanosensors were used for ratiometric imaging of intracellular pH values, oxygen, and temperature in HeLa cells.
Optodes for simultaneous monitoring of pH and other analytes are summarized in Table S14.
11. Imaging of pH Values
Imaging of pH values is exclusively performed by using optical indicators and nanoprobes, most often via fluorometry. Refractive index based methods and planar plasmon resonance methods play no role, even though photonic crystals may serve the purpose, but this was not shown so far. One may distinguish between 2D imaging (which can be realized with planar optodes in contact with a sample), and 3D imaging (where molecular probes or nanoparticles are placed in a sample such as tumorous tissue). One may also distinguish between conventional imaging and imaging via fiber bundles. Planar optodes are used to visualize pH distribution in fairly large objects (bacterial cultures, Petri dishes, sediments, microbial mats, etc.; see Figure 39). Imaging with nanoprobes is the method of choice in case of small objects (such as cells or microfluidic channels). One can also distinguish between intensity-based and lifetime-based imaging. Fluorescence lifetime imaging (FLIM) represents a self-referenced technique, while fluorescence intensity has to be referenced by other means such as ratiometry or DLR (see sections 2.11 and 2.2.7).
Figure 39.
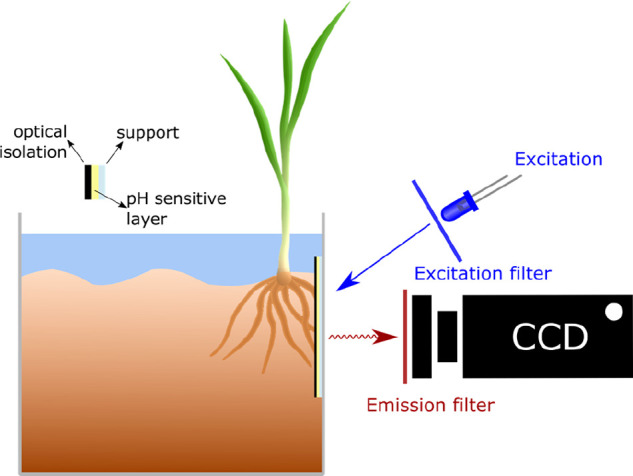
Typical setup for imaging of pH distribution at a water–sand interface with planar optodes.
Various reviews on imaging based on luminescent materials are available.681,699,702 Regarding pH sensing, there is a book chapter with an extensive review on nanomaterials for intracellular pH sensing and imaging.5 Methods for self-referenced fluorometric imaging using camera read-outs and the so-called RGB techniques have been described in detail.987
11.1. Intensity-Based Imaging
A typical example is pH monitoring in isoelectric focusing.430,592,988 For referenced ratiometric read-out, intrinsic properties of some indicators can be utilized. For instance, a ratiometric planar optode reported by Hulth et al. utilized dual excitation of HPTS (protonated and deprotonated forms) immobilized on a cellulose acetate membrane.375 Zhu et al.377 reported imaging of marine sediments with covalently immobilized HPTS dye using excitation with two LEDs (420 and 505 nm) and detection with an RGB camera. Typically for HPTS, the apparent pKa value of the indicator was heavily affected by the ionic strength and far from being optimal for measurements in seawater.
Fluorescence intensity can also be referenced against that of a pH-insensitive reference luminophore (see section 10.1). Dedicated solutions with movable filters are commercially available. For example, Ocean Optics (https://oceanoptics.com) offers a SpectroCam system including a camera in combination with a rotating wheel equipped with 6–8 band-pass filters. The camera system was demonstrated to be useful for imaging of pH distribution in didemnid ascidian with help of a ratiometric sensor material.989 In a similar custom-made setup, an RGB camera was used to image pH, pO2, and pCO2 distribution in marine sediments with help of three planar optodes.990
RGB cameras are widespread and affordable devices both in industry and in consumer market. The camera filters corresponding to the blue, green, and red channels are attractive for isolation of optical signals from the indicator and the reference. For instance, if the excitation is performed with blue light, the green and the red channels can be used for fluorescence of the indicator and the reference, respectively, or vice versa. It is important that one of the emitters possesses significantly larger Stokes shift so that its emission is located in a different channel. Cross-linked polymeric particles doped with a mixture of several fluorophores efficiently increase apparent Stokes shift via FRET, which is beneficial for their use as references.424 It should be kept in mind that the detection channels in the RGB cameras are rather wide and show significant overlap (Figure 40A).
Figure 40.

Examples of pH imaging. (A) Spectral response different channels of a dual chip (RGB + NIR) camera. Reprinted from ref (973) with public license. Published by The Royal Society of Chemistry. (B) Example of RGB pH imaging (pseudocolor) with a planar optode in marine sediment containing a burrow. Reprinted with permission from ref (374). Copyright by the Association for the Sciences of Limnology and Oceanography, Inc., 2011. (C) Imaging of a sensor array of immobilized pH indicators with a smartphone. Fluorescence images of the array at different pH values under UV excitation (left) and screenshot of a software for image processing (right). Reprinted with permission from ref (135). Copyright 2017 American Chemical Society. (D) Confocal fluorescence microscopy images (overlaid on bright field) of pH nanosensors in RBL mast cells showing (a) reference dye channel, (b) sensor dye channel, (c) overlaid images, and (d) pseudocolor ratiometric imaging of pH in various intracellular compartments. Reprinted with permission from ref (404). Copyright Wiley-VCH Verlag GmbH & Co., KGaA, Weinheim 2006.
Planar optodes typically utilize visible light for excitation. In contrast, Meier et al.951 utilized NIR light (980 nm) to excite a planar optode based on upconversion NaYF4:Er3+,Yb3+ nanorods (see section 10.6 for more details). Under this excitation, the nanorods emit strongly both in the green and red part of the spectrum (λmax = 540 and 660 nm). These emissions are rather narrow (full widths of the emission bands 25–40 nm) and almost perfectly match the color channels of the RGB camera. Sensing relies on an inner-filter effect (see section 10.5) caused by an organic pH indicator whose absorption overlaps the green emission of the nanorods but shows no overlap with the red emission.
RGB imaging of pH values becomes increasingly popular due to the uncomplicated and low cost equipment required.374 Several reported systems utilize a consumer camera, a high power LED for excitation and a trigger to ensure illumination of the sensor foil only during the image acquisition time. Planar optodes have been used for imaging of pH values in marine sediments (Figure 40B),991,374 seawater,992 wounded tissues,441 and for visualization of bacterial metabolism in Petri dishes.127,571 A commercial VisiSens system is available from PreSens GmbH and includes an RGB camera and a set of planar optodes (pH, oxygen, and carbon dioxide). Application of this system for imaging of pH gradients (also pO2 and pCO2 gradients) in rhizosphere was demonstrated.993
The quality of smartphones cameras improves continuously making them attractive for the RGB imaging of different parameters, including pH. The light torch of a smartphone in combination with a short-pass filter can serve as a suitable excitation source, and the processing capabilities are good enough to convert images into pH values. For instance, Chen and co-workers reported simultaneous imaging of pH and oxygen with a smartphone.978 The authors, however, used a UV lamp as an excitation source to photoexcite (a) the reference dye (4,4′-bis(2-benzoxazolyl)stilbene), (b) the pH indicator (fluorescein), and (c) oxygen indicator (platinum(II) pentafluorophenylporphyrin). They emit in the blue, green, and red channels, respectively. Rurack and co-workers135 made a step further and presented a self-contained pH measurement system on smartphone basis. A 16 spot array of 10 hydrogel-immobilized fluorescent pH indicators and reference dyes was not only imaged with a smartphone but also processed with a specially designed software running on the same device (Figure 40C). All dyes are based on a BODIPY chromophore and, therefore, have almost identical excitation and emission spectra. On the other hand, the indicators are decorated with different receptors and show transitions in different pH ranges. Impressively, the sensor array covers the entire pH range from 0 to 14. Although most of the experiments were performed with the UV lamp as an excitation source, the authors also designed an adaptor housing a 470 nm blue LED powered through the smartphone’s micro-USB connector. This allows for autonomous on-site and in-field measurements.
The above examples demonstrate high potential of digital cameras and smartphones for RGB imaging. However, three channels may not be sufficient for some applications. For instance, ratiometric imaging of more than one parameter would require three suitable channels for signal detection. Although UV excitation with detection in blue, green, and red channels is possible in principle, it is often undesirable due to high disturbance to biological systems and high levels of generated autofluorescence, which would possibly interfere with ratiometric imaging. The commercially available RGB/NIR camera Jai AD-130GE (www.jai.com) substantially increases the flexibility in choice of pH indicators and reference dyes and their combination with probes for other parameters (Figure 40A). Ehgartner et al.973 used the camera for ratiometric imaging of pH upon excitation with red light (617 nm) with help of the pH indicator and the reference dye emitting in NIR and red part of the spectrum, respectively. In the same work, a dual sensor for pH and oxygen has been described. It utilized a fluorescein-based pH indicator, Pt(II) benzoporphyrin as the oxygen indicator, and dye-doped polymeric reference beads. The materials emit in the green, NIR, and red channels, respectively, under excitation with blue light (458 nm). Later, Moßhammer et al.921 used the same camera for simultaneous imaging of pH and oxygen in algal biofilms albeit in combination with different indicator and reference dyes (see section 10.7).
As can be seen from the examples described above, imaging with the planar optodes has been mostly used to visualize pH distribution in marine sediments, soils, tissues, wounds, etc. Since light scattering strongly depends on the wavelength, the effects caused by the sample can severely affect the ratiometric intensity measurements particularly in case of highly scattering sediments for which the optodes are often applied. Therefore, it is essential to use an optical isolation layer. For better contrast and higher fluorescent signals it is advisible to use an additional layer containing scattering particles, such as TiO2 or BaSO4, and above it an optical isolation layer containing, for example, carbon black (see section 9.3).
Similar to planar optodes, many nanosensors (section 8) are designed to enable ratiometric imaging (Figure 40D).404 In nanosensors, mostly fluorescent compounds are used as reference dyes due to their high brightness, insensitivity to oxygen, and high variety of commercially available derivatives suitable for covalent coupling. The optical setup is significantly different from that used for imaging of planar optodes: in most cases, excitation is performed with a laser and emissions from the indicator and the reference dye are collected by a photomultiplier.
Apart from imaging with fluorescent sensor films, imaging of absorptiometric pH planar optodes with RGB cameras or a scanner was also performed.232,233 It was shown that the use of the hue component in the HSV (hue, saturation, value) color space not only reduces the parameter space from three dimensions to one but also makes the read-out more robust against variation in the ambient light conditions compared to the RGB read-out. The hue value is particularly robust in respect to variations in indicator concentration, membrane thickness, spectral sensitivity of the detector, and illumination conditions and can be easily obtained in a read-out with commercial devices such as scanners and digital cameras.994
Optical fiber imaging of pH values is less often used. They can be prepared by using inkjet printing technology.995 Microjet printing technology was applied for fabricating imaging sensors by printing an array of photopolymerizable sensing elements, containing a pH sensitive indicator, on the surface of an optical fiber image guide. The reproducibility of the printing process is said to be excellent for micrometer-sized polymers, with sensor diameters of around 90 μm and a height of 35 μm. The sensors were evaluated in terms of pH sensing ability, response time, and hysteresis using a custom fluorescence imaging system.
Table S15 gives an overview of fluorescence intensity based pH imaging using planar optodes.
11.2. Lifetime-Based Imaging
Luminescence lifetime imaging of pH using optical sensors started with work by Liebsch et al.94 who presented a modular system for time-resolved two-dimensional luminescence lifetime imaging of planar optical pH sensors (and others). Both luminescence intensity-based and time-resolved images of the sensor spots were evaluated. The combination of optical sensor technology with time-resolved imaging allows for the determination of the distribution of pH values in heterogeneous systems. As discussed in section 10.2, lifetime sensing and imaging is possible with relatively few pH probes only. So called rapid lifetime determination (RLD) represents a simple technique for determination of average decay times.996 It also allows autofluorescence to be completely eliminated. The RLD scheme is common for imaging of planar optodes based on phosphorescent oxygen and temperature probes and of course can be adapted for read-out of long decaying pH probes (section 4.2). It can also be applied to pH probes exploring FRET from phosphorescent emitter to an absorptiometric pH indicator. For instance, Nagl and co-workers945 reported imaging of pH in a microchamber array with help of a FRET luminescent probe (see section 10.4 for more details). The RLD method requires a gated camera such as discontinued SensiCam from PCO (www.pco.de). On the other hand, imaging of fluorescence lifetime can also be performed in the frequency domain. Commercial cameras support modulation frequencies from 5 kHz to 40 MHz (pco.flim, www.pco.de). This enables imaging both in nanosecond and microsecond time domain. Accordingly, virtually all lifetime-based pH probes (section 10.2) can be read-out with the camera. Both micro- and microscopic pH imaging capabilities of the system were recently demonstrated for the lifetime sensor based on triangulenium indicator524 (see section 10.4 for more details), Figure 41A.
Figure 41.
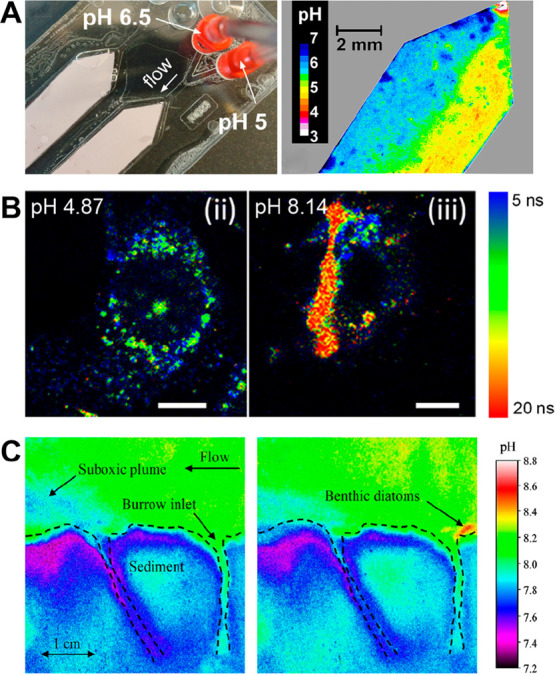
Examples of lifetime-based pH imaging. (A) Frequency domain FLIM imaging of pH with the planar optode via fluorescence decay time of a triangulenium indicator PhOHCl2-DAOTA. Left: photographic image of the microfluidic chip with integrated sensor foil. Right: false color image of the pH distribution in the chip simultaneously flushed with buffers of pH 6.5 and 5.0 (speed 21 μL min–1). Reprinted with permission from ref (524). Copyright 2019 American Chemical Society. (B) Time domain FLIM images of MC3T3-E1 cells incubated with nigericin and buffers mimicking the extracellular medium at pH 4.87 (left) and 8.14 (right). The scale bars (white lines) represent 10 μm. CdZnS quantum dots pH probes were utilized. Reprinted with permission from ref (801). Copyright 2013 American Chemical Society. (C) False color images of pH distribution acquired with time domain DLR technique for a marine sediment after 10 (left) and 40 (right) min light exposure (∼450 μmol photons·m–2·s–1). Reprinted with permission from ref (146). Copyright by the Association for the Sciences of Limnology and Oceanography, Inc., 2006.
On a microscale, ratiometric 2−λ read-out remains the most popular method. Application of several lifetime nanoprobes for intracellular pH imaging have been reported. Imaging experiments are typically performed in the time domain using the time-correlated single-photon counting (TCSPC) technique and laser scanning microscopy. For instance, several groups demonstrated application of quantum dots798,801 and dye-doped polymeric nanoparticles482 (see section 10.2 for more details) for intracellular/in vivo imaging (Figure 41B).
Dual lifetime referencing (DLR, section 2.2.7) is equally useful for interrogation of pH sensors in the frequency domain and for imaging in the time domain. pH imaging with DLR sensors in the time domain was pioneered by Klimant and co-workers94,143 and has been widely used since then (Table S16). This includes imaging of pH distribution in marine sediments (Figure 41C)110,146 and concrete samples,997 monitoring of pH dynamics during wound healing,425 and imaging of pH distribution in microfluidic chips as utilized for isoelectric focusing.148 Although the read-out was performed exclusively using a discontinued SensiCam from PCO, it is certainly possible to interrogate the same materials with frequency domain-based FLIM camera.
It should be considered that imaging of planar optodes that utilize the DLR scheme (both in time and in frequency domains) can be compromised by background fluorescence. Optically dense isolation layer (see section 9.3) is not always possible since the structures behind the optodes cannot be visualized. The problem can be tackled via application of long-wavelength emitters and applying semitransparent optical isolation layer that includes scattering particles in comparably low concentration.
Table S16 gives an overview of lifetime-based pH imaging using planar optodes.
12. pH Sensors for Extreme pH Values
Sensors for extreme pH values are much less numerous compared to those covering the physiological range. Nevertheless, such sensors have important applications, for instance for monitoring of pH in gastric system, the pH value of concrete, or during the production and processing of strong acids and bases. Sensing in highly alkaline conditions is of primary interest in many technological fields, for example, in paper industry, wastewater treatment, leather processing, metal mining and finishing, or microbial production involving alkaliphiles.504 It is also of utmost importance for corrosion prediction and detection in steel-reinforced concrete structures, which lifetime strongly depends on the internal pH.
The major challenge in the design is to identify indicator dyes, polymers, and host materials that are stable under rather harsh experimental conditions. Most of these sensors work either at very high or at very low pH values as shown in the following sections. Recently, however, Nawaz et al. have described a sensor for determination of both extreme acidic and strongly basic conditions.998 The sensor is based on the use of a cellulose support that is known to resist both strong acids and strong bases. A pH-responsive phenanthroline chromophore (Phen-MDI) was immobilized to obtain a sensor material that allows for visual determination of pH values. In the colorimetric (visual) mode, it can readily discriminate pH values in the pH 11 to 14.0 and in the pH 0.0 to 2.0. In the fluorometric mode, it can differentiate pH values between pH 11.0 and 13.2. Response can be made more distinct by adding a pH-independent reference dye. The material was used to fabricate a pH test strip. The colorful response of the Phen-MDI based test strip is shown in Figure 42.
Figure 42.

Comparison of the responses of a commercial test strip and the new pH test paper strips to (A) strong bases and (B) strong acids. Row I: Commercial pH test paper strips. Row II: Phen-MDI pH test paper strips. Rows III–IV: Phen-MDI in the presence of two different reference dyes that improve contrast. The photographs on the left were taken under visible light, and those on the right under irradiation with 365 nm light. Reprinted with permission from ref (998). Copyright American Chemical Society 2019.
12.1. Sensors for pH Values from 10 to 14
Optical sensors for high pH values are of interest because they can be prepared at low costs from alkali-resistant materials, such as cellulose and because electrodes, at high pH values, suffer from interferences due to the so-called alkali error. Several absorptiometric sensors have been reported. Werner and Wolfbeis54 covalently immobilized an azo dye N8 1 (Figure 43) onto cellulose support prepared via partial hydrolysis of cellulose acetate layer under alkaline conditions. The immobilized dye showed absorption maxima at 484 and 560 nm in the neutral and highly alkaline media, respectively, and a pKa of 11.72. Although the stability was excellent (6 months) for the sensor stored in dry state between the measurements, some delamination of the sensing layer based on cellulose from the polyester support was observed after 7 h of continuous measurement in 0.1 M NaOH.
Figure 43.

Chemical structures of the indicators used for sensing of high pH. Upper and lower panels: Absorptiometric and fluorescent indicators, respectively. Note that the structure of indicator 1 is not disclosed; one of the R groups is a hydroxy group responsible for the pH sensitivity.
Safavi and Abdollahi70 immobilized thiazole yellow 2 (Figure 43) onto the same support (hydrolyzed cellulose acetate). Advantageously, the absorption bands of the neutral form and the deprotonated forms (λmax = 423 and 512 nm, respectively) show only minor overlap. The immobilized dye showed high pKa of 12.5 and fully reversible response. Interestingly, the sensor showed no cross-talk to Mg2+, which is in contrast to behavior in alkaline aqueous solution where the same dye forms a complex with Mg2+. The same group325 immobilized a mixture of triphenylmethane dye Victoria blue and dipicrylamine onto cellulose support. The latter shows absorption change in highly acidic media, while immobilized Victoria blue reversibly responds in the range from 8.5 to 13.0 in decreasing the absorption at 621 nm (pKa = 11.2).
Thiazole yellow also was the indicator of choice in the sensors reported by Allain and Xue.201 The indicator was embedded into a composite of SiO2/ZrO2 and a polar polymer (Nafion, poly(styrene-co-methyl methacrylate) or a mixture of both). The indicator showed high pKa value in all the matrices (13.8–14.1). All the sensors showed excellent stability in highly alkaline solutions and tolerated 30 days of storage in 4 M NaOH. In further work,202 it was indicated that some of the materials remain stable in highly alkaline conditions for up to 120 days after which enhanced indicator leaching was observed. Drastic differences in dynamic response and recovery times have been observed for various sensing materials. The sensors based on dye-doped SiO2/ZrO2 films and those with additional poly(styrene-co-methyl methacrylate) showed the response times of up to several hours. In contrast, the composite sensors based on SiO2/ZrO2 with addition of Nafion and on SiO2/ZrO2 with addition of both Nafion and poly(styrene-co-methyl methacrylate) demonstrated response times of 5–50 s, which makes these materials particularly promising.
A benzo[de]anthracen-7-one indicator 3 (Figure 43),999 noncovalently immobilized on viscose fabric, showed a distinct color change from yellow (pH ≤ 10) to orange-red (pH > 10.7) with a response time of several minutes. Xu and Sadik1000 described another colorimetric pH sensor based on the indicator 1-(2-pyridazolo)-2-naphthol 4 (Figure 43) immobilized in polystyrene. The absorption of the dye (λmax = 561 nm) decreased by about 30% when the concentration of NaOH was increased from 0.5 to 10 M. The optode showed high stability in 10 M NaOH (6 months) and reversible response, which was surprisingly fast (several minutes) considering the thickness of the sensing layer (∼20 μm) and high hydrophobicity of polystyrene.
Porpholactones 5 (Figure 43) are promising absorptiometric indicators for sensing pH in alkaline conditions.331 The sensing mechanism does not involve deprotonation of the pyrroles of the porphyrin macrocycle but rather a nucleophilic attack of the OH– on the lactone moiety (Figure 43). In fact, both metal-free porpholactone and Pt(II), Zn(II) and Ga(III) complexes show almost identical spectral changes:331,332 the Q-band in the red part of the spectrum (∼600 nm) disappears and a new broad band at around ∼700 nm appears in alkaline media. The pH optodes manufactured via immobilization of the metal-free/Pt(II) porpholactones into copolymers of methyl methacrylate, methylenebis-acrylamide and methacrylamidopropyl trimethylammonium chloride have slow response (30–90 min) due to low ion permeability of the polymer.331 In further work, the same group modified the porpholactones with 4 PEG groups via nucleophilic substitution of the para-fluorine atom of the pentafluorophenyl substituents (6,Figure 43).332 The Ga(III) complex showed a strong decrease of the absorption of the Soret and Q-bands (417 and 605 nm, respectively) and a new band at 706 nm appeared. The complex has a pKa of 11.8.
Fluorescent indicators based on phenol PET groups (photoinduced electron transfer, sections 2.2.5 and 4.1) are good candidates for sensing of very high pH values. The pKa value of phenol, which is a viable PET quencher in its deprotonated form, is 10.0.1001 Gareis et al.493 reported application of phenol-bearing BODIPY dyes 7 and 9 (Figure 43). When immobilized in a hydrogel, the dyes showed pKa values of 10.4 and 10.8, respectively. Similar systems based on dye dyes 8(504) and 10(135) (Figure 43) were reported. The methyl groups in the 1 and 7 positions of the BODIPY are important to ensure high fluorescence quantum yields of the indicators, and they also have an effect on the pKa values. Interestingly, a significant increase of the apparent pKa was observed after immobilization of dye 8 into the polymer (11.44 and 9.98 for the polymer-supported dye and dye in EtOH–H2O solution, respectively). This is in contrast to the work of Gareis et al.493 who did not observe any significant change upon immobilization of the dye 10 (pKa´ 12.83 and 13.1 for the dye in hydrogel and EtOH–H2O solution, respectively).
A phenol receptor attached to the aza-BODIPY chromophore 11 (Figure 43) has a pKa´ of 11.9 when immobilized in hydrogel.505 This is higher compared to EtOH:H2O buffer solution (11.1). Aza-BODIPY indicators 12 and 13 (Figure 43) have pKa´ of 10.8 and 11.7, respectively.510 A sensor based on dye 12 was recently shown to be very useful for imaging of pH distribution in concrete.997
Among fluorescent indicators, π-extended imidazole-substituted perylenes 14 and 15 (Figure 43) represent another promising group of indicators for sensing high pH values. These dyes are equally useful as absorptiometric and fluorescent indicators showing strong change in absorption and emission spectra upon deprotonation of the imidazole group. The apparent pKa values obtained from the absorption spectra (11.36–11.45) are higher than those obtained in fluorometry (10.15–10.56), which is attributed to FRET from the protonated to the deprotonated form of the dye. Molar absorption coefficients and quantum yields for both perylene dyes are very high (>75 000 M–1 cm–1 and >85%, respectively).
Fluorescent coumarin indicator 16 (Figure 43) was covalently embedded into highly cross-linked microparticles prepared from 1,4-bis(acryloyl)piperazine and methacrylic acid.1002 The particles positioned between a quartz disc and a porous nylon membrane were read-out with a fiber-optic fluorometer. A moderate (∼40%) quenching of the fluorescence of the indicator was observed upon pH decrease from 9 to 13.2 (pKa´ 11.9) attributed to PET from the neutral imidazole receptor. The material showed excellent photostability and virtually no change in the calibration within 20 months of storage in the dry condition and repeated short-term measurements. Dye leaching was observed at pH > 13.2, which may be due to hydrolysis of the polymer. It should be mentioned that the dynamic response was very slow (t95 = 50 min) which, however, may not be problematic for the intended application (monitoring of pH in the concrete structures).
Derinkuyu et al.579 manufactured a high pH sensor via immobilization of the Schiff base 17 (Figure 43) into poly(vinyl chloride). The dye shows fairly strong orange fluorescence (λmax = 593 nm, QY = 0.37) in the protonated form (pH ≤ 8) which is almost completely quenched in alkaline media (pKa´ = 10.3). Because of the low permeability of the polymeric matrix to ions, fairly long response and recovery times (up to 13 min) were observed even for rather thin sensing films (5 μm).
It can be concluded that sensing of high pH values is undoubtedly challenging since preparing an indicator with suitable spectral properties and pKa value is only one side of the medal. Stability of the indicator and the matrix at the extreme conditions represents the main challenge particularly for long-term applications, such as pH monitoring in concrete. For instance, polyacrylate polymers and silica-based matrices tend to degrade in basic media due to hydrolysis of the ester bond, whereas polyacrylamide polymers are more stable. However, even these polymers can be cleaved in very basic conditions. On the other hand, the sensors based on Nafion332 and SiO2/ZrO2 composites201 appear to be stable in highly alkaline conditions. One should also keep in mind that the degradation of the optodes is accelerated at higher temperatures.
Table S17 summarizes the composition and properties of optical pH sensors for measurements in highly alkaline conditions.
12.2. Sensors for pH Values below 3
Carey et al.50 investigated the ability of several polymer-immobilized absorptiometric indicators to sense nitric acid from 1 M and stronger. The triphenylmethane dye chromazurol-S 1 (Figure 44) showed ratiometric response from 2 to 10 M nitric acid when immobilized into a mixture of polybenzimidazole and polyimide. Noire et al.324 reported an evanescent wave sensor based on a similar dye chromoxane cyanine R 2 (Figure 44) embedded into TEOS sol–gel. It showed reversible response (absorbance at 542 nm) to 1–8 M solutions of nitric acid but, unfortunately, also a decrease of absorption by about 45% after 40 days of continuous measurement (1 M HNO3) probably due to leaching of the dye.
Figure 44.

Chemical structures of the indicators used for sensing of low pH. For the structures of other indicators used in sensing of low pH the reader is referred to section 3.
Baldini et al.71 immobilized thymol blue (section 3) on controlled pore glass particles and recorded the changes in reflectance of the probe placed on a distal end of an optical fiber. The absorption of the indicator (λmax = 565 nm) decreased almost to 0 from pH 0.91 to 4.90. Immobilized in a TEOS-based sol–gel, bromocresol purple was used for high acidity measurement (1–10 M HCl, pKa´ = −0.77).267 The sensor response was very fast (<1 s for 2.7 μm thick films), and only a little leaching was observed (4% in 12 weeks). In later work,252,259 the same group investigated the performance of this and other materials in mixtures of strong acids and metal salts. They, then, proposed an algorithm for compensation of variations in ionic strength.
Wang et al.1003 showed that the pH optode based on phenol red embedded into a TEOS-PhTriEOS sol–gel was suitable for sensing in highly acidic solutions (apparent pKa of 0.2). The material shows an increase of the absorption at 510 nm upon protonation. The same material was previously used for sensing in slightly basic conditions321 utilizing the second deprotonation step of the indicator (c.f., Figure 17). The combined use of indicators rhodamine B and Safranine T entrapped in porous silica glass films prepared by the sol–gel method resulted in sensors for high-acidity ([H+] = 1–9 M) measurements.1004
Congo red 3 (Figure 44) was covalently immobilized on an epoxy-activated agarose membrane.214 The absorption band at 600 nm observed in highly acidic conditions (pH 0.5), disappeared as the pH was increased to 6 giving rise to a new band peaking at 500 nm. The immobilized indicator showed a pKa value of 2.8 and the response of the sensor was fully reversible. Using a similar strategy, Salmani et al.215 immobilized Congo red on an epoxy-activated cellulose membrane achieving a dynamic range from pH 0 to pH 4.
Dipicrylamine (2,4,6,2′,4′,6′-hexanitrodiphenylamine) can be easily covalently immobilized on triacetylcellulose films.364 The membranes can be used for reversible pH measurement in the range of 0.0–3.2 at 450 nm. The sensor is interfered by potassium ion, and bleaching and low sensitivity are main problems in highly acidic media (>1 M of strong acid).
Protonation of pyrrole nitrogens of metal-free porphyrins in acid conditions is well-known. Protoporphyrin IX 4 (Figure 44) was immobilized into cross-linked polyacrylamide gel.339 The absorption of the Soret band of the porphyrin (λmax = 410 nm) is the highest in highly acidic conditions (pH = −0.5) but decreases by more than 10-fold on going to pH 1. The response of the evanescent wave sensor was fast (t90 = 10 s) because of the thin layer thicknesses (1 μm) and high proton permeability of the polymer. The sensor showed no significant change in the properties after 100 assays and after storage in a dry state over 6 months.
Fluorescent sensors for strongly acidic media have also been reported. Posch et al.49 immobilized fluorescein and eosin into different polymers including amino-ethyl cellulose and amino-modified controlled porous glass. Immobilized onto amino-ethyl cellulose, eosin, and fluorescein covered the pH range from 0 to 3 and from 2 to 6, respectively. Tetrafluorofluorescein was applied in a nanosensor based on cross-linked poly(acrylamide). The nanosensors show an apparent pKa of around 3.762 A coumarin indicator 5 (Figure 44) showed almost no fluorescence in the neutral form, whereas fluorescence intensity increased strongly in highly acidic media.396 Compared to the EtOH/H2O buffer, the pKa´ value slightly increased upon immobilization onto amino-modified cellulose (pKa´ of 2.8 and 3.36, respectively). Nevertheless, the immobilized indicator showed rather broad fluorescence dynamics (pH 1–7).
Kim and Kim527 prepared pH sensors by covalently immobilizing a dicyanomethylene-4H-pyran dye 6 (Figure 44) into cross-linked pHEMA hydrogels. The neutral form of the dye (pH 3) in the optode features the absorption maximum at 438 nm and emission maximum at 520 nm. Upon protonation of the aniline nitrogen in highly acidic media (pH < 0), the absorption shifts to 370 nm, whereas the fluorescence is completely quenched. The sensor shows reversible response and good stability without significant leaching.
A fluorescent sensor based on pHEMA hydrogel with copolymerized conjugate of rhodamine and 4-amino-1,8-naphthaliimide 7 (Figure 44) was reported.463 At pH > 3, the rhodamine dye is present in the colorless spirolactam form, which efficiently quenches the fluorescence of the naphthalimide dye. Opening of the spirolactam ring in the strongly acidic conditions results in a strong enhancement of naphthalimide fluorescence. Such enhancement is rather surprising, since the emission spectrum of the naphthalimide (λmax = 520 nm) shows very good overlap with the absorption of the open form of the rhodamine (λmax = 567 nm and a shoulder at ∼520 nm) so that strong FRET from naphthalimide to rhodamine could be expected.
N,N-dialkylaminophenyl receptors are excellent candidates for designing fluorescent indicators for acidic range. The dyes equipped with such receptors typically are not fluorescent in moderately acidic media due to PET effect (see section 4.1 for more details) but the fluorescence is “switched on” upon protonation of the aniline in highly acidic conditions. Particularly, Hiruta et al.607 immobilized a BODIPY dye equipped with a N,N-dimethylaminophenyl receptor 8 (Figure 44) into mesoporous silica to obtain a sensor operating from pH 0.5 to 4. A far-red aza-BODIPY chromophore was equipped with the same group thus rendering the dye 10 (Figure 44) sensitive to variation of pH in acidic media (pKa´ of 2.6 for the dye immobilized into polyurethane hydrogel D4).505 A perylene dye modified with dimethylaniline in the imide position 9 (Figure 44) shows favorable spectral properties (λmax ex/em, 520/559 nm), adequate molar absorption coefficient (45 000 M–1cm–1) and high fluorescence quantum yield in the protonated form (0.81).122 The fluorescence of the neutral form is completely quenched due to very efficient PET. It has an apparent pKa of 1.1 when embedded into polyurethane hydrogel D4 and 1.9 when immobilized into poly(hydroxypropyl methacrylate).
4-Amino-1,8-naphthalimide was modified with an aromatic dialkylamino receptor 11 (Figure 44).466 The pH optode was prepared via covalent immobilization of the dye onto amino-modified cellulose beads. The beads were incorporated into polyurethane hydrogel D4 and showed a pKa´ value of 3.1. Rurack and co-workers135 attached various aminophenyl receptors (4-bis(2-methoxyethyl)aminophenyl, aniline, N,N-diethylaminophenyl, N,N-diisopropylaminophenyl) to the BODIPY chromophore (12, 13, Figure 44) to obtain sensors for acidic range. The dye substituted with the 4-bis(2-methoxyethyl)aminophenyl receptor showed the lowest pKa´ value (0.95). The authors also demonstrated that 2,6-dimethylpyridin-4-yl (14, Figure 44) represents another promising PET receptor for sensing pH in acidic range (pKa´ of 2.34 for the hydrogel-immobilized dye).
Conjugated polymers (poly(phenylquinoline), poly(biphenylquinoline) (15, Figure 44), or poly(phenylquinoxaline)) coated onto the tip of an optical fiber showed response (decrease or increase of the fluorescence intensity) in strongly acidic conditions (0.1–8.4 M HNO3).51
Table S18 summarizes the composition and properties of optical pH sensors for measurements in highly acidic conditions.
13. pH Sensors with Wide Dynamic Range
The dynamic range of pH optodes is much narrower than that of the glass electrode and of pH ion sensitive field effect transistors. Most of the signal change occurs within 2 pH units, which, however, is usually sufficient for the majority of applications. On the other hand, in some applications the pH may show more significant variations making the conventional pH optodes unsuitable. Additionally, one may wish a more universal analytical tool on the basis of optical measurements, which is able to access the pH in a variety of different samples thus reducing the cost of the setup (multiple sensors) and maintenance (exchanging and calibrating the sensors). Therefore, significant effort has been focused on designing a pH optode covering a comparably wide dynamic range.
Four fundamental methods do exist to enlarge the analytical range of optical pH sensors. The first method is making use of indicators with more than one pKa value, for example dyes that have two or more hydroxy groups or have both an acidic group (e.g., a phenol) and basic functions such as pyridine or tertiary amino groups.46 The second method is making use of the fact that fluorescent indicators have strongly different pKa values in the electronic ground state and in the first excited singlet state (e.g., HPTS).61 The third method utilizes the effects of the immobilization matrix on pKa values; by placing the same chromophore in quite different microenvironments, indicators with statistically distributed pKa´ values are obtained. Finally, the most common approach is to mix several dyes with different pKa values.
The indicators of the first and the second type are rather rare. Several dye classes feature multiple protonation equilibria (e.g., triphenylmethane dyes) and may potentially be used for wide dynamic range sensors. Wolfbeis and Marhold in 1987 designed coumarin probes with both a protonable site (pyridine) and a deprotonable site (a phenolic hydroxy group). This results in a dynamic range from pH 2 to 8.
Uniform response over a wide pH range is rare and a typical response curve is represented by a combination of two sigmoidals,61 thus making multipoint calibration necessary. The unimolecular indicator 10-(4-aminophenyl)-5,15-dimesitylcorrole (Figure 45A)1005 immobilized into a sol–gel is a notable exception. It shows multiple protonation steps: deprotonation of a pyrrole nitrogen in basic conditions, protonation of a pyrrole nitrogen in acidic conditions, and finally protonation of aniline in the strongly acidic media. This is accompanied by the change in the absorption spectrum characterized by the Soret band (380−450 nm) and the Q-bands (500−700 nm). The fluorescence intensity (λmax = 656 nm) increased almost linearly in the pH range 2–10 demonstrating a fully reversible response (Figure 45B). It should be noted, however, that the fluorescence response reflects the pH dependency of both the fluorescence QY and the absorption spectra (resulting in different amount of absorbed light) so that the response curve is likely to be different in shape if the excitation is performed at a different wavelength compared to the experimental conditions (507 nm).
Figure 45.

(A) Chemical structure and acid–base equilibria of the corrole indicator. (B) Response of the pH optode based on sol–gel immobilized corrole. α = (F – Fb)/(Fa – Fb), where F, Fb, and Fa are, respectively, the fluorescence intensities at a given pH, in the completely deprotonated form (pH 11) and in the completely protonated form (pH 1). Reprinted with permission of The Royal Society of Chemistry from ref (1005). Copyright The Royal Society of Chemistry 2006. (C) Extended range pH optode utilizing surface curvative of mesoporous silica nanoparticles (MSN) creating different density of positively charged groups originating from aminopropyltrimethoxysilane (AMPMS). Reprinted with permission of The Royal Society of Chemistry from ref (755). Copyright The Royal Society of Chemistry 2013. (D) pH response of mesoporous silica nanoparticles (MSN) and hollow mesoporous silica nanoparticles (HMS) stained with fluorescein and rhodamine dyes. Reprinted with permission of The Royal Society of Chemistry from ref (755). Copyright The Royal Society of Chemistry 2013.
Another way to extend the dynamic range of pH sensors is to utilize the effects of the immobilization matrix on the acid–base equilibrium. These effects are particularly strong for charged matrices so that the dynamic range of a conventional pH indicator can be significantly extended.755,1006 For instance, deprotonation of a fluorescein dye is facilitated in the proximity of positively charged groups (e.g., −NR2H+). This results in the decrease of the apparent pKa value. Evidently, if the indicator is located in many different environments varying in the amount of charged groups, an extended dynamic range is possible. An interesting concept was reported by Mou and co-workers who made use of different surface curvature of hollow mesoporous silica nanoparticles.755,1006 Both fluorescein and rhodamine (as a reference dye) were covalently immobilized into the beads. The excess of the latter rendered the surface positively charged in acidic conditions. Different surface curvature in hollow mesoporous nanoparticles (HMS) efficiently extends the dynamic range of the sensor compared to the reference nanoparticles (MSN) (Figure 45C and D). A different explanation was proposed for acridine immobilized in amine-modified porous silica.1007 The immobilization matrix itself is subject to protonation equilibria which affects the pKa´ of the indicator due to variable microenvironment. For acridine, this result in a lifetime change of 20 ns over the pH range of 2–12. It should be noted here that ionic strength is expected to strongly affect the response of the sensors utilizing charged surfaces, which is a limitation of the approach. Although the effect of ionic strength has not been investigated in the above studies, the material utilizing a similar approach (gold nanoparticles of different sizes modified with carboxylic groups) was demonstrated to have a very high cross-sensitivity to ionic strength.1008
The design of wide dynamic range sensors via combination of several indicators with different pKa values remains the most common approach.287 Ideally, the indicators should possess very similar spectral properties and comparable photostability and should not leach out of the matrix. Simulations demonstrate257 that if the difference between the pKa values is too high (≥2) even the central part of the calibration curve will not be linear. This is inconvenient in practice since multipoint (re)calibration will be necessary. On the other hand, if the pKa values differ by only 1, the mixture of the indicators will show sigmoidal response but the broadening of the dynamic range is not very significant. Therefore, the pKa difference of 1.5 between the individual indicators is optimal. This requirement is difficult to achieve in practice. Additionally, the individual indicators may differ in their spectral properties and in the signal difference between the protonated and deprotonated forms. Hence, an adjustment of the concentration of individual indicators is necessary. Experiments with the mixture of absorptiometric indicators in aqueous media demonstrate excellent correlation with the calculated calibration curves.257,1009 For instance, a linear response from pH 4.3 to 8.8 could be obtained by mixing bromocresol green, bromocresol purple, phenol red, and thymol blue (pKa of 4.59, 6.13, 7.78, and 8.88, respectively).1009 A similar absorptiometric sensor was reported by Gupta and Sharma,281 who coated an optical fiber with a thin sol–gel layer containing a mixture of cresol red, bromophenol blue, and chlorophenol red (pKa in water 8.3, 7.4, and 6.3, respectively). Transmittance, measured at 600 nm (which is the optimal wavelength for the mixture of the dyes), decreased almost linearly from pH 5.5 to 13. However, low hydrolytic stability of sol–gels in alkaline conditions may be problematic. Later, Dong et al.283 reproduced the same system but added Triton surfactant (∼1% wt.) to TEOS. Such a modification resulted in a very smooth sol–gel coating on the optical fiber without cracking defects observed for the material containing no Triton. The authors noticed the reduced hysteresis and also better repeatability of the response. The dynamic range of the sensor (4–13) was not affected by the modification. It should be mentioned here that many pH indicators show wider dynamic range when immobilized in sol–gels. For instance, pH sensitivity of methyl red immobilized in TMOS-based sol–gel was shown to span over 7 pH units with linear range from about pH 5 to 8.599
In another work,362 a mixture of neutral red and thionine was covalently immobilized onto the epoxy-modified surface of agarose-coated glass slide. The sensor showed a nonlinear decrease of absorption at 555 nm in the pH range 0.5 to 12. Interestingly, immobilized neutral red alone already shows a pH response over a very broad range (0.5–7.5). The optode featured good reversibility of the signal and operational stability. However, the immobilization drastically affected the spectral properties and the pH response of the dyes, so that overall absorption decreased only 15% relative to the highest value (pH 0.5).
Six hydroxyazobenzene indicators were prepared and immobilized on cellulose triacetate204 to obtain pH optical sensors with distinct color changes in the visible. These have a linear response in the 7.0 to 11.5 pH range, response times of less than 20 s, and excellent long-term stability.
Several fluorescent sensors with extended dynamic range have been presented. Posch et al.49 immobilized fluorescein and eosin onto amino ethyl cellulose fibrous particles. The pKa´ values of the immobilized dyes were about 5.2 and 1.1, respectively. The beads were mixed in different proportions and fixed on a polyester support to result in broad range sensors covering the pH range between 0 and 7 that is typical for gastric juice. Vasylevska et al.396 reported a pH sensor containing 2 types of microbeads with immobilized iminocoumarin indicators. The sensor membrane showed fluorescence response from pH 1 to 11 but represented a combination of two sigmoidal curves due to very large difference between the pKa values of the indicators (3.36 and 8.42, respectively). Aigner et al.122 extended the dynamic range via combination of two perylene indicators immobilized in hydrogel D4. The fluorescent response was sigmoidal due to rather low difference of the pKa values of the indicators (5.2 and 6.5).
Suzuki and co-workers948 prepared a wide range sensor via combination of colorimetric indicators neutral red and methyl yellow with two types of fluorescent quantum dots (λem = 525 and 605 nm, respectively). The sensor operated via the inner-filter effect read-out (see section 2.2.4 for more details) and showed ratiometric response, which was linear in the pH range from 4 to 10.
Combination of more than 2 indicators makes it possible to obtain a smooth response curve over a broad range of pH values. Ideally, all the indicators possess very similar photophysical properties i.e. belong to the same chromophore class. He et al.466 used mixtures of 2–6 individual indicators based on a single fluorophore 4-amino-1,8-naphthalimide (see section 4.1 for more details) to obtain pH sensors with wide dynamic range. All the indicators possess similar absorption and emission maxima and photostability, but largely different pKa values. Carboxylic group enabled covalent binding of the dyes onto aminocellulose microbeads. These were dispersed in a polyurethane hydrogel. Not surprisingly, blending particles doped with different indicators resulted in extension of the dynamic range of the pH sensor reaching maximum when 6 different indicator dyes were used. This sensor was suitable for measurement in the pH range 1–14 showing almost linear decrease of fluorescence intensity (Figure 46A). The extension of the dynamic range was accompanied by the decrease of the resolution. In fact, the slope of the curve decreased from 0.56% signal change/0.01 pH unit for 1 indicator to 0.16%/0.01 pH unit for the mixture of 6 beads. It is important that all the individual indicators possess very similar (and good) photostability, and show only minor cross-sensitivity to ionic strength, which can be compensated for. The reversibility of the sensor was excellent without a noticeable drift observed upon multiple cycles of switching between pH 1.1 and 14.0 and back. This underlines high hydrolytic stability of the immobilized indicators, aminocellulose, and polyurethane hydrogel used in the sensor.
Figure 46.

(A) Response of the sensor based on a mixture of 6 4-amino-1,8-naphthalimide pH indicators immobilized onto aminocellulose particles, which were dispersed in polyurethane hydrogel. Adapted with permission from ref (466). Copyright 2015 American Chemical Society. (B) Response of a pH sensor based on a mixture of 4 aza-BODIPY indicators immobilized into polyurethane hydrogel. Adapted from ref (505) with public license. Published by The Royal Society of Chemistry. (C) Response of the nanosensors containing covalently embedded individual indicators (fluorescein FS, Oregon green OG) and their mixture (OG-FS) along with rhodamine reference dye. Adapted with permission from ref (764). Copyright 2011 American Chemical Society. (D) Comparison of pH values obtained with the smartphone photographing the fluorescence of a sensor strip (array of 10 BODIPY indicators) and a conventional pH glass electrode. Adapted with permission from ref (135). Copyright 2017 American Chemical Society.
A wide range sensor presented by Strobl and co-workers505 makes use of 4 fluorescent aza-BODIPY indicators (see section 4.1 for more details) immobilized into hydrogel D4. The sensor shows sigmoidal response curve in the pH range of 2–10 (Figure 46B). The aza-BODIPY indicators are advantageous for their long wavelengths of absorption and emission, good fluorescence brightness and excellent photostability, which is particularly important for the application of the dyes in the wide dynamic range sensor.
Frankær et al.519 also used a palette of diazaoxatriangulenium dyes substituted with different aniline or phenol PET receptors. A mixture of four indicators immobilized in a sol–gel matrix resulted in a sensor with a pH range from 1–10.
Nanosensors (see section 8 for more details) with broader dynamic range are also of high interest for instance for imaging of pH in endosomal–lysosomal system. Since the pH varies from 6.0 to 6.5 in endosomes to 4.0 in lysosomes it is almost impossible to maintain adequate resolution in such a range with a single indicator probe. Therefore, probes containing two761,764,765 or even three762 xanthene-based indicators have been reported. Aylott and co-workers761 embedded dextran conjugates of fluorescein isothiocyanate, 5(6)-carboxy-2′,7′-difluoro-fluorescein (Oregon green) and a reference fluorophore 5-(and-6)-carboxytetramethylrhodamine into poly(acrylamide) nanoparticles. Andresen and co-workers764 covalently immobilized Oregon green and fluorescein into cross-linked poly(acrylamide-co-N(3-aminopropyl)methacrylamide) nanoparticles. Immobilization of two dyes with substantially different pKa values (4.7 and 6.4 for Oregon green and fluorescein, respectively) resulted in doubling of the dynamic range of the nanosensor (Figure 46C).761,764 In further work, Zhang et al.762 added 5(6)-carboxy-2′,4′,5′,7′-tetrafluoroluorescein (pKa´ = 3.0) to Oregon green and fluorescein, which resulted in expansion of the dynamic range to 1.4–7.0. All dyes were covalently immobilized into the nanoparticle along with a reference dye (red-emitting Alexa 568). Since the photostability of xanthene dyes is known to significantly improve with introduction of electron-withdrawing halogen atoms, the nanosensor is likely to show drift in the calibration curve due to photobleaching of less photostable fluorescein. Nevertheless, such nanosensors allow reliable pH monitoring in endosomal–lysosomal system, whereas nanosensors based on a single pH probe provide erroneous results.764 A recently reported nanosensor (metal–organic framework incorporating a mixture of porphyrin and rhodamine)635 shows reversible dual response in acidic media (pH 2–7, sensitivity due to rhodamine) and basic media (pH 9.5–11.5, sensitivity due to porphyrin) but almost no sensitivity between pH 7 and 9.5.
Array approaches were described,232,233,302 where many individual sensors based on pH indicators covering broad range of pKa values are combined in an array which is read-out with help of an RGB camera or scanner.232,233,302 For instance, Capitan-Vallvey and co-workers232,233 combined 11 individual absorptiometric pH sensors embedded in plasticized poly(vinyl chloride) or cellulose acetate with addition of a lipophilic salt such as tridodecylmethylammonium chloride. Fairly good prediction of pH in the range from 0 to 14 was achieved using hue values obtained from imaging of the sensor array with a calibrated scanner. The use of HSV (hue, saturation, value) color space compared to the RGB technique reduces the parameter space from three dimensions to one. It also makes the read-out more robust against variation in the ambient light conditions. The use of neural networks233 improves the quality of the prediction and reduces the requirements on computer memory and processor speed. The application of artificial neural networks can help to extend the dynamic range of sensors based on a single indicator.63
Rurack and co-workers135 recently presented an array containing 10 structurally similar fluorescent pH indicators bearing different receptors. The apparent pKa values of the immobilized indicators vary from 0.5 to 12.8, resulting in the array covering impressive pH range from 0 to 14 (Figure 46D).
The materials described above make use of either absorptiometric or fluorescent pH indicators. Only a few reported optical sensors utilize alternative concepts. Particularly, Pathak and Singh1010 presented a fiber-optic sensor in which a small part of the waveguide was removed and substituted with a cross-linked poly(acrylamide) hydrogel. pH sensitive swelling/shrinking of hydrogel results in the change of the refractive index which enables measurements between pH 3 and 10 (see section 2.3). In other work of the group, the cladding of the fiber was removed to be modified with a combination of ZnO nanorods and poly(acrylamide) hydrogel.1011 The sensor showed response between pH 3 and 11. These sensors operate reversibly and show very little hysteresis. However, no study of potential interferences has been conducted which may be particularly strong in case of temperature and ionic strength.
An uncommon optical fiber pH sensor with wide analytical range was described by Khan et al.1012 It is based on an optical fiber pulse width modulation (PWM) technique. The sensing signal’s pulse width changes when the unclad sensing element of the fiber comes into contact with buffers of varying pH values. The unclad sensing elements of the array were coated with indicators (methyl red, methyl orange, thymol blue, Nile red, and rhodamine B) that are said to change their refractive index (RI) when contacted with the buffer solution. As a result, the pulse width of the sensing signal also changes. The sensor has a linear response over a wide range of pH values (from 2 to 12). However, such sensors are of quite limited practicability because any other species being present in the sample that would also affect RI and interfere. A more practical optical fiber wide-range pH sensor was obtained by doping a titania sol–gel with organic dyes.604 The sensing films were obtained from a precursor solution composed of titanium tetraisopropyl orthosilicate and the dyes brilliant green, rhodamine 6G, rhodamine B, and coumarin. Titania was used because it is more chemically resistant and has a longer lifetime than silica films. The analytical range of the sensor extends from pH 2–12.
The composition and properties of wide dynamic range pH sensors are summarized in Table S19.
14. Sensing Formats
14.1. Planar Sensors
Planar optodes (Figure 47A) belong to the most common sensor formats. They represent a sensing layer coated on a transparent support (plastic or glass, see section 9 for more details) and optionally additional layers such as scattering and/or optical isolation layer (section 9). Planar optodes can be manufactured by different methods, preferably by knife coating (Figure 47A), dip-coating, spin coating, spray coating, screen and inject printing. In all these methods, a sensor “cocktail” containing an indicator dye, polymer (or sol–gel), and a solvent is deposited onto the support to give a sensor layer after solvent evaporation. Additional steps (e.g., curing under UV light) may be necessary. The thickness of the sensing layer can be easily adjusted in some methods, for example, by varying viscosity of the “cocktail”, the thickness of the spacer in knife-coating or rotation speed in spin coating. In case of transparent layers, the thickness can be estimated via measurement of the absorbance of the foil assuming that the molar absorption coefficients are not affected by immobilization. Fluorescent pH sensor foils are commercially available.
Figure 47.
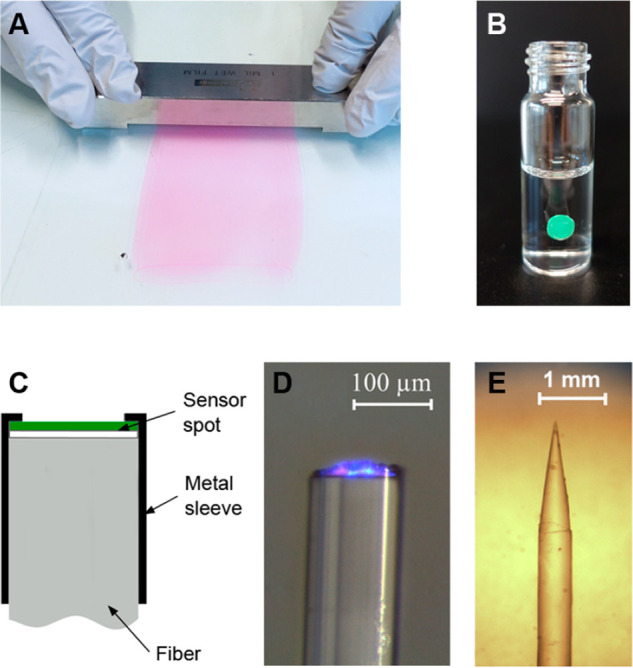
Examples of the planar optodes and fiber-optic sensors. (A) Preparation of a planar optode by knife-coating of a sensor “cocktail” (indicator, polymer, organic solvents, and optionally some additives) onto a transparent poly(ethylene terephthalate) support. (B) Planar sensor spot glued to the inner wall of a transparent glass vial. (C) Fiber-optic sensor manufactured by fixing a planar sensor spot of a small diameter (2 mm) onto a distal end of a plastic optical fiber. (D) Example of a flat-broken fiber-optic pH microsensor for simultaneous measurement of pH and pO2. The blue color of a 470 nm LED (used for the excitation), as well as red luminescence from the indicators is visible. Reprinted with permission from ref (381). Copyright 2007 American Chemical Society. (E) Example of a tapered fiber-optic sensor.
Planar optodes are well suitable for characterization of the sensing materials even if they later may be used in other formats, such as in fiber optic sensors. Parameters include absorption and emission spectra, luminescence quantum yields, decay times, leaching, and response and recovery times.
Planar optodes also enable imaging of pH distribution on two-dimensional surfaces (section 11). One may also punch sensor spots for contactless sensing through a transparent glass wall (Figure 47B). The support side of the spot is glued to the inner part of the chamber (for instance a fermentation flask or a microplate) and the read-out is performed by positioning an optical fiber (or a fiber-less read-out unit) in front of the spot. Small spots (typical Ø 1–3 mm) can be fixed at a distal end of an optical fiber to produce fiber-optic sensors (Figure 47C).
14.2. Fiber Optic and Other Waveguide Sensors
In this format, a sensor spot may be glued onto a distal end of the fiber (Figure 47C). Alternatively, the fibers may be directly coated with the “cocktail” containing indicator, polymer, and organic solvent (Figure 47D and E).56,381 Also, the fibers can be coated with a solution of an indicator in a mixture of monomers, cross-linker and photoinitiator, and subsequently photopolymerized.88,397,1013,1014 In the case of polymerizable materials, the indicator typically bears a functional group to enable covalent incorporation into the resulting polymers. Fiber-optic sol–gel sensors are manufactured by depositing the sol solution onto the fiber. In most cases, the indicator is covalently coupled to an alkoxysilane before it is mixed with other precursors.442
It is important that the spectral properties of the indicator (and reference material if it is present) match those of the fiber material. Glass and quartz fibers have a numerical aperture (NA) of about 0.2–0.5 and show excellent transparency in visible and NIR parts of the electromagnetic spectrum. Additionally, quartz fibers are transparent to UV light. The NA of much cheaper plastic PMMA fibers is higher (about 0.6), but their transparency in UV and NIR is rather poor. In the red-NIR part of the spectrum, attenuation maxima are observed at ∼630 and 730 nm and attenuation minima at ∼650 and 760 nm, and light absorption increases continuously at higher wavelength.1015 For instance, at 730 nm at least 50% of the light is expected to be lost passing through a 1 m fiber. Thus, in case of NIR indicators, only short (1–2 m) plastic fibers are useful unless deuterated or fluorinated modifications of the polymers (which show much lower attenuation in NIR but have limited commercial availability)1016 are used. Concerning mechanical stability, glass fibers are flexible enough at the core diameters of 140 to 400 μm but thicker fibers (e.g., 1 mm in diameter) are inconvenient to use because of the high rigidity and poor stability to bending. In contrast, 1 and 2 mm PMMA fibers have excellent mechanical characteristics. It should be mentioned that fibers of larger diameter are preferable for interrogation of sensor spots through relatively thick walls.
Fiber-optic microsensors are popular due to better spatial resolution, suitability for measurements in small volumes and minimal disturbance caused by measurement. Although coating of flat-broken fibers of small diameter is possible (Figure 47D), tapered fibers (Figure 47E) often are preferable because of their higher signals and faster response times. Because of favorable diffusion, the dynamic response of the tapered microsensors is significantly faster than that of the planar optodes and can be in a subsecond range. Additional microstructures on the fiber tip can improve the response times even further.417 Considering the size, apart from the standard dimensions of hundreds of microns, also sensors based on micrometer-sized88 and submicrometer53 fibers have been reported. They enable profiling with 0.1 mm spatial resolution, and fast measurements with response times of <1 s for 3 μm-thick optodes)88 in very small objects (such as cells). However, they are challenging to manufacture, are mechanically fragile, feature reduced operational stability and faster drift.53 They also require more sophisticated setup for interrogation including laser diodes for the excitation and a photomultiplier for signal detection.408 In contrast, microsensors of larger diameter (≥100 μm) can be conveniently read out using cheap and compact combination of an LED and a photodiode. Such fiber microsensors can also be used for profiling, for example to analyze pH gradients in saltmarsh ponds at sediment-water interface.1017
Most fiber-optic microsensors are capable of measuring pH only, however several multiparameter sensors have also been reported. Ji and Rosenzweig419 prepared a microsensor (⌀ = 50 μm) for simultaneous measurement of pH and calcium based on SNARF-1-dextran and Oregon green BAPTA-1-dextran conjugates incorporated into pHEMA. Kocincova et al.381 reported a fiber-optic microsensor for simultaneous monitoring of pH and oxygen. They used a composite material based on combination of oxygen- and pH-sensitive microbeads dispersed in a hydrogel. Walt and co-workers presented an interesting concept yielding multiparameter fiber-optic sensors.429 They modified an optical imaging fiber1018 (i.e., a fiber with the ability to carry a coherent image from one end to the other) of 350 μm in diameter comprising 3000 individual elements with pH, pO2 and pCO2 “sensing chemistries”. The photodeposition of the sensing layers was realized via illumination of individual areas (⌀ = 40–50 μm) of the fiber.
14.3. Evanescent Wave Sensing
In an optical waveguide, light is totally reflected at the interface between an optically denser core and a less dense cladding if the angle of incidence is larger than of the critical angle. The reflected light penetrates the second medium (the so-called evanescent field), which decays exponentially with the distance from the core. Evanescent field read-out makes it possible to obtain sufficient signals from very thin sensing layers. Because of multiple reflections, the increased optical path results in acceptable signals and fast response.281,283,284 This read-out type has been applied particularly often in sol–gel-based pH optodes,83,277,293,324,609,1019 but several evanescent wave sensor based on polymeric materials have also been reported.55,347,1020 The reader is advised to search for the term evanescent in other sections of this Review.
In a typical configuration based on a step index multimode fiber (Figure 48), a section of the protective plastic jacket is removed and the cladding in this part is reduced by polishing or chemical etching. It is then covered with a very thin layer of a pH-sensitive material.
Figure 48.

Schematic representation of an evanescent-field sensor (left) and its photographic image (right): 1, fiber core; 2, original cladding; 3, protective jacket; 4, typical propagation modes. Reproduced from ref (1020) with permission from Elsevier. Copyright Published by Elsevier, Ltd., 2004.
The depth of light penetration (dp) in evanescent field can be described by the following equation:1021
| 22 |
where λ is the wavelength of the light source, θ is the angle of incidence of the light at the core/cladding interface, and ncore and ncl are the refractive indexes of the core and cladding, respectively. In case of a silica fiber (refractive index ∼ 1.45) with removed cladding placed in contact with an aqueous medium and assuming light to enter the core at an angle of 80°, the estimated dp is λ/3.3, which is equal to a depth of 170 nm for 550 nm light. The fiber with core diameter of 400 μm will be expected to have 1 reflection each 1 mm or more, resulting in a maximum light path length of 17 μm for the sensing part of the fiber of 10 cm in length. Such pass length is expected to result in sufficient signals for both absorptiometric and fluorescence sensors. Interestingly, in case of very thin sensing films, indicators immobilized even in rather hydrophobic polymers such as PMMA can show pH sensing behavior.1020 Evanescent field sensors based on the use of conductive polymers such as polyaniline (section 7.2), which display pH dependent absorption between 400 and 1000 nm, are also known.55 Apart from fiber-optic sensors, evanescent field read-out is also utilized in planar waveguide-based sensors. For instance, Yang and Saavedra266 coated indicator doped sol–gel layer onto a glass substrate (microscope slide).
U-shaped fiber optic pH probes also utilizing evanescent field absorption and dye-doped sol–gels were presented.282 The U-shaped probe was applied to increase the evanescent field in the film and hence the interaction strength with the dyes in the film (Cresol red, bromophenol blue, chlorophenol red). The influences of bending radius of the probe and the numerical aperture of the fiber on the sensitivity of the sensor were studied. As the bending radius of the probe decreases, the sensitivity of the sensor increases. Further, for a given bending radius and the fiber core diameter, increase in the numerical aperture of the fiber increases sensitivity. Similar work on determination of pH values via U-shaped fibers was presented later.1022 Another kind of optical fiber pH sensor was described1023 that is based on surface adsorption of the pH-inert dye methylene blue, producing absorption in the evanescent field surrounding the fiber in a section where the cladding was removed. The linear range of operation is said to be between pH 3 and 9. However, the authors do not explain why the dye (which is not a pH indicator in this pH range) responds to changes in pH values.
Some limitations of evanescent field sensing should be considered. First, changes in the refractive index of the sensing layer (due to swelling, temperature change, etc.) may affect the properties of the sensor.347 Second, since a significant length of the optical fiber/waveguide should be modified, a compact design of the sensor becomes rather challenging. The configuration shown in Figure 48 and the planar waveguide versions266 only allow for measurements in a flow-through cell. This issue can be partially addressed by using a configuration with a mirror positioned on the distal end of the fiber.347 However, even in this case, the total length of the fiber coated with the sensing composition typically exceeds 1 cm.
14.4. Refractive Index and Surface Plasmon Resonance Based pH Sensors
As pointed out in section 2, numerous hydrogels are known that undergo pH-dependent swelling/deswelling. This has resulted in a variety of optical sensing schemes because swelling is associated with changes in the turbidity, refractive index, reflection, color, or fluorescence (for example by using a solvatochromic probe, section 2.10). Detection schemes in pH sensors based on the use of swellable polymers include measurement of refractive index, surface plasmon resonance, holography, or by using hydrogels as a matrix in photonic crystals. Numerous materials have been descried that undergo pH-induced swelling/deswelling, and the following are most common: acrylates and methacrylates (and numerous chemical modifications), polyurethanes, cross-linked polyglycols, chitosan, poly(vinyl alcohols), and copolymers like poly(acrylonitrile-co-polyacrylamide), to give representative examples only. The following sections cover refractive index and surface plasmon resonance-based pH sensors.
14.4.1. Refractive Index Based pH Sensors
The fundamentals of refractive index (RI) based sensing have been outlined in section 2.3. Methods based on measurement of RI do not require a pH indicator to be used. Rather, they are making use of a swellable/shrinkable material. This has certain advantages. On the other hand, changes in RI in such materials often not only depend on the pH value but also on other parameters, such as temperature, salinity or the fraction of organic solvent. There is a substantial wealth of literature on the design of sensor for measurement of RI, but the number of papers specifically devoted to sensing of pH values is moderate. A review covering hydrogel based sensors appeared in 2008. It covers both optical and other sensors.158 Notwithstanding this, many of the RI sensors described so far (for example in refs.1024−1029) may be converted into pH sensors if coated with a pH-responsive material, and this may result in numerous future papers.
The polymers used in such sensors are often referred to as stimuli-responsive polymers, and the stimulus in this case is the local pH value. During the process of swelling, the fraction of water in the polymer increases, and this causes a decrease in the RI of the hydrogel. Alternatively, swelling may be optically detected via the physical displacement it can induce (see below). The milestone paper by Seitz back in 1999 summarizes the principles and the features of a typical RI-based pH sensor. These include (a) the use of a porous materials to enable fast diffusion of protons, (b) the use of composites consisting of microparticles placed in a hydrogel matrix, and (c) the option of using near-infrared light along with fiber optics technology.1030 In fact, most such sensors are based on the use of optical fiber waveguides.
Probably the first fiber optic pH sensor based on RI transduction was designed by Attridge et al.47 Two methods were used in parallel. The sensing material on the fiber comprises an ion exchange membrane carrying a sulfophthalein dye acting as an indicator. In parallel, changes in the RI are monitored by using a coaxial directional coupler consisting of two monomode waveguides placed a few μm apart over a well-defined interaction length. The two kinds of information are analyzed to assess the practicality of a sensor capable of discriminating against interfering refractive index variations. The response time is as short as a few seconds. A related scheme was presented later1031 by using a thermoresponsive copolymer bearing a pH-responsive solvatochromic dye to result in a dual sensor for temperature and pH value.
The group of Arregui154 has described pH-sensitive long-period fiber gratings with polymeric nanocoatings. The pH-sensitive films with optimal overlay thickness were deposited by self-assembly poly(allylamine hydrochloride) (which is cationic) and poly(acrylic acid) (which is anionic at pH values above 5). Sensors were also prepared that incorporate the pigment Prussian blue (PB) in the films. Both sensors were compared in terms of sensitivity and response time, and a faster response was obtained in case of sensors with PB particles in the polymer. Linear response is reported for the pH 4–7 range. In related work, multilayered thin poly(allylamine) (PAH)films containing the pH indicator brilliant yellow (BY) were prepared on a quartz slide by layer-by-layer (LBL) deposition technique.210 The spectra and color of the PAH/BY films change in the pH range from 9.0 to 5.0, and the response time is fast because the film is very thin.
Zamarreño et al.155 have deposited a thin polymeric coating on an optical fiber core. Lossy-mode resonance (LMR) occurs depending on the refractive index of the coating and the thickness of the coating. Poly(allylamine hydrochloride)/poly(acrylic acid) acted as the pH sensitive coating whose thickness reversibly varies with the pH value of the solution due to swelling/deswelling. This LMR-based optical fiber pH sensor is said to have an accuracy of ±0.001 pH units (at constant temperature) and an average sensitivity (resolution) of 0.027 pH units per nanometer in the range between pH 3 and pH 6, but effects of ionic strength were not tested.
Fiber Bragg grating (FBG, Figure 16) sensors are fairly simple and in wide use. In essence, it consists of a white (multicolor) light source that passes the core of a fiber possessing a Bragg grating. Depending on the RI of core and fiber, most of the while light will be transmitted and spectrally separated. However, a small band will not be transmitted but reflected. Representative examples for such optical pH sensors include an FBG sensor172 with a swellable hydrogel whose RI is strongly affected by pH values. On swelling, the hydrogel causes a physical stretch on the fiber, which expands the grating period. Such a sensor resembles the function of displacement sensors as described in the section on less common detection schemes. Alternatively, a so-called chirped grating coupler may be used.1032 Again, pH-induced swelling of a polymer membrane is detected via refractometry using a compact multichannel sensor module. Signal transduction by means of the chirped grating couplers allows for the design of a simple sensor module. Experiments were performed with replicated polycarbonate TiO2 waveguide sensor chips coated with an ultrathin photopatterned hydrogel membrane carrying amino groups, which reversibly change from the neutral state to a positively charged state upon acidification. The resolution reported by the authors is said to be <±0.00011 at pH 7.5 in a dual-channel module, but this is not plausible given the experimental circumstances described and the lack of a more realistic test scenario.
Wavelength interrogation was applied in a no-core fiber optic pH sensor using a polyacrylamide coating.1010 A no-core fiber was stubbed between two single-mode fibers with a standard fiber connector before immobilizing the hydrogel. The sensor is placed in a flow cell through which solutions of various pH values are passed. Wavelength shifts, measured with a FBG, can be related to actual pH values. Typically, wavelengths shifts by 1.94 nm per pH unit over the pH range from 3 to 10, with good linearity and fast response.
An example of an interferometric pH sensor is represented by a fiber sensor based on the use of waist-enlarged bitapers and mode excitation.182 The interferometer, which comprises a waist-enlarged bitaper, a round tip, and a tantalum pentoxide layer displays high refractive index (RI) sensitivity. It was coated with a poly(vinyl alcohol)/poly(acrylic acid) composite hydrogel to induce sensitivity to pH values. The interference fringes shifted with varying pH solutions, and the pH sensitivity is 1.58 nm per pH unit in the pH 2.5–6.5 range. Rise/fall times are as short as 10/11 s.
In another kind of refractometric pH sensor, a pH-sensitive coating was placed on indium tin oxide-coated optical fiber.1033 The pH of the external medium modifies the thickness of the thin polymeric coating and, hence, the effective refractive index. This, in turn, causes a wavelength shift in the near-infrared region. The devices permit wavelength-based pH determination with high sensitivity (17.5 nm/pH unit) and with fast response.
14.4.2. Surface Plasmon Resonance-Based pH Sensors
The fundamentals of surface plasmon resonance (SPR) based sensing have been outlined in section 2.4. Like pH sensors based on (fiber) optic measurement of pH induced effects on refractive index (RI), SPR is another but experimentally entirely different approach to detect changes in RI. Note: This section only refers to SPR sensors based on either the Kretschmann or Otto instrumental configurations, not on so-called “SPR sensors” where the color change of gold nanoparticles in colloidal solution (often from red to blue and back) is exploited, usually a result of particle aggregation. This effect often is referred to as localized SPR but is read out visually or by photometry.
SPR-based sensing does not require a pH indicator to be used. Again, a swellable/shrinkable material comes to use. This has several advantages over indicator-based methods (such as the lack of leaching or the need for immobilization of probes), but on the other hand, changes in RI in such materials often not only depend on the pH value but also on other parameters, such as temperature, salinity, or the fraction of organic solvent. The first sensors of this kind were described by the Liedberg group1034,1035 back in 1982. Nowadays, SPR based detection is mainly applied to study ligand–receptor interactions of biomolecules by using one of the several commercially available devices. Typically, sensor chips are used, where the gold film is covered with a micrometer film of a hydrophilic polymer. Such films undergo pH-dependent swelling, and hence, all these sensors often are inherently pH-sensitive. Figure 49 shows a typical (fiber optic) arrangement for measurement of changes in RI via SPR using a sensor coating placed on a gold film.
Figure 49.
Schematic of a fiber optic sensor for measurement of refractive index by using surface plasmon resonance. The lower panel shows the flow system, including a syringe pump, a flow-through cell, and respective tubings. The upper panel shows an enlarged view of the SPR detection system. The swellable pH-responsive material can be placed on the gold film. The angle of reflection (Φi) depends on the RI of the polymer. Reprinted from ref (1036) with public license. Published by the Optical Society of America.
Various kinds of smart nanomaterials have been presented. To achieve an optimal match between the RI of the sensing layer and the waveguide, a sensing probe was prepared1037 by coating an unclad core of an optical fiber with three consecutive layers of silver, silicon, and a pH-sensitive hydrogel. The change in pH of the fluid around the probe causes the hydrogel layer to reversibly swell and shrink, this in turn resulting in a change in RI. The change in RI causes a change in the resonance wavelength in the transmitted spectrum, and a blue shift is observed in the resonance wavelength (which is in the visible) on increasing the pH value of the solution. The measurement of wavelength rather than of intensity makes the sensor independent of fluctuations of light source intensity, detector sensitivity, and geometrical effects of the optical system. The sensor operates in the low and high pH range, but not at around pH 7. The influence of environmental temperature (between 16–28 °C) is negligible. Other features include a short response time, small size and good temporal stability. Another coating used in SPR based sensing of pH consists of silver, ITO (In2O3:SnO2), aluminum and smart hydrogel layers over an unclad core of an optical fiber.1038 Layers of metallic silver, aluminum and ITO were coated using a thermal evaporation technique, while the hydrogel layer was prepared by dip-coating. The sensor detects changes in the RI of the hydrogel due to its swelling and shrinkage caused by changes in the pH value of the fluid. An increase in the pH value causes swelling of the hydrogel which decreases its RI and results in a shift of the resonance wavelength toward the blue in the spectra. The ITO layer increases the sensitivity while the aluminum layer increases the detection accuracy. Temperature has very little effect in the 25–45 °C range.
An optical fiber SPR pH sensor was reported that is based on the use of multimode and single-mode fibers coated with a carboxylated hydrogel.1039 Depending on local pH values, the fraction of dissociated carboxy groups in the hydrogel changes and affects the volume and RI of the hydrogel. This results in a shift of the SPR peak wavelength. The sensor works over a wide pH range (from 1 to 12), and at the best sensitivity, the shift is 13 nm/pH (in the pH range 8–10). The influence of temperature (in the range from 20 to 40 °C) on SPR wavelength is weak. The sensor possesses remarkable repeatability and excellent stability, has a wide analytical range, and can be fairly easily fabricated. Another pH-responsive nanoplasmonic pH sensor was fabricated1040 by chemical attachment of poly(allylamine) onto ∼28 nm diameter gold nanoprisms bound to a silanized glass surface. The reversible change of polymer structure upon protonation and deprotonation (causing shrinking and swelling) of the amino groups of the polymer alters the localized surface plasmon resonance (LSPR), typically peaking at 694 nm. A spectral shift of the peak can be observed. The pH-induced shrinking and swelling were subsequently applied in an enzymatic glucose sensor.
There is a wealth of literature on the design of sensor for measurement of RI via SPR, but the number of papers specifically devoted to sensing of pH values is moderate. Notwithstanding this, virtually all SPR-based sensors (described, for example, in refs (1041−1046)) may be converted to optical sensors for pH values if coated with a pH-response polymer as discussed before. It is also noted, here, that most of the hydrogel based sensors for determination of relative air humidity also are likely to be sensors for pH values of aqueous solutions.1047
14.5. Photonic Crystal-Based pH Sensors
Photonic crystals (PhCs) have so-called structural colors and do not require the use of indicator dyes. Structural colors are widely found in nature, the color of butterflies or chameleons being typical examples. Their color can undergo quick changes by applying a mechanical stress on the system. Color changes may also be induced by changing local pH values because these affect the lattice spacing in PhCs. This has inspired many researchers to mimic nature.
The fundamentals of PhC based sensing have been outlined in section 2.5, and numerous variations of methods for measurement of changes in local diffraction patterns in PhCs have been published in recent years (for example in refs (1048−1051)), albeit not for sensing pH values. A review is available on various kinds of photonic hydrogel-based sensors, PhCs included.1052 Virtually all of them may be converted to optical sensors for pH values of combined with a pH-responsive hydrogel as discussed before. The state of the art by the year 2014 in PhC-based chemical sensing and biosensing has been reviewed.163
In the simplest (and purely synthetic) version, sensor materials are prepared by incorporating polystyrene nanoparticles into a hydrogel matrix. Hydrogels include acidic polymers, such as poly(meth)acrylates, poly(meth)acrylamides, polyurethanes, and polyethylenimine. Swelling is often due to protonation of basic polymers or due to deprotonation of acidic polymers. Even mixtures (deposited layer-by-layer) have been used. Color effects are quite significant, with spectral shifts as large as 250 nm. Color changes are beautiful and can be observed visually but one has to keep in mind that the colors are so-called structural colors (like those of a butterfly), not like the colors of an indicator dye. Remarkably, some sensors have a rather wide analytical range.
In their milestone papers, the Asher group1053,1054 describe PhC-based pH sensors, referred to as a colloidal crystalline array (CCA). Plastic microspheres were incorporated into a stimuli-responsive hydrogel. Visible light is diffracted in the CCA, and the observed color is a function of the lattice spacing d of the plastic microspheres (see Figure 14) which—in turn—is governed by pH-dependent swelling of the gel. Hence, swelling increases the mean separation between the microspheres and shifts the Bragg peak of the diffracted light to longer wavelengths. As a rough rule of thumb, a 0.5% change of the volume of the hydrogel shifts the diffraction wavelength by ∼1 nm. The operative pH range of such sensors can be adjusted by proper choice of the hydrogel, but response times can be quite long (>10 min), which is much longer compared to refractive index (RI) based sensors. On the other hand, such sensors can be judged with bare eyes and, therefore, allow for a fast rough estimation of pH values. Instrumental read-out is, of course, more precise.
Various kinds of such sensors for pH values have been reported in subsequent work,1055−1060 several based on the use of nanosized particles. Low and high pH sensing capability was achieved by variation of the gel material, for example by functionalization with carboxylates and phenol derivatives, respectively. A mechanically robust and fast responding PhC-based pH sensor was fabricated1061 by templated photopolymerization of hydrogel monomers within the interstitial space of a self-assembled colloidal PhC. This pH sensor has a response time of <10 s and a >6 month lifetime without compromising the reproducibility of the pH-driven color change. Similarly, a planar defect layer within an inverse opal hydrogel was used in a tunable PhC-based pH sensor. It was fabricated by combining the Langmuir–Blodgett technique and the PhC template method. The resulting material consists of a three-dimensional, highly ordered, and interconnected macroporous array of poly(methacrylic acid), which is a hydrogel sensitive to pH values. The optical properties of these inverse opals were investigated using reflection spectroscopy but can also be detected visually.1062 Typical materials and properties of pH sensors are summarized in Table S20.
Even dual sensing of pH values and temperature was shown to be feasible. The diffraction pattern of hybrid particles prepared by copolymerization of N-isopropylacrylamide and methacrylic acid in a gel were shown1063 to be sensitive to temperature in the range from 15 to 40 °C, and to acidity at pH values between 2 and 7. The sensitivity to pH changes leads to a wavelength shift of around 150 nm, while temperature only induces a shift of 50 nm at pH 7 and of 20 nm at pH 2. Unlike in dual sensors where two indicators with different optical properties are used, these sensors can hardly differentiate whether the color changes originate from changes in temperature or pH value.
In more recent bioinspired work, Fei et el.1064 have designed a pH sensing scheme by placing poly(acrylic acid)-co-polyacrylamide [P(AAc-co-AAM)] via in situ copolymerization onto the wings of the butterfly Papilio paris. The wings have a hierarchical, lamellar structure (composed of chitosan) as shown in Figure 50. The structural color of the modified wings is changed by local pH values. The introduction of AAM into the system created covalent bonding, which strongly bridges the polymer with the wings and leads to an accurate yet broad variation of reflection wavelength to measure environmental pH values. The reflection wavelength can be tailored by varying the RI of the lamellar interspacing because of the swelling/deswelling of the polymer. The application of covalent cross-linking results in a PhC-based pH sensor with high cycling performance. While interesting from a purely scientific point of view, such sensors are unlikely to be used by others given the fact that simpler sensors have been described that can be made from materials that are readily available at any time and any place in the world.
Figure 50.
Schematic of a bioinspired photonic crystal based optical sensor for H values. The graph shows the typical chitosan structure of the wing of a butterfly that was coated with a synthetic copolymer that undergoes pH dependent swelling. This results in a change in the structural color of the wing. Reprinted with permission from ref (1064). Copyright American Chemical Society 2016.
Liu and co-workers1065 have applied polyaniline in 1D PhCs with a gradient architecture as a material that responds to vapors of acidic or alkaline chemicals. PhC based sensors were also combined with fiber optic sensing schemes in order to enable remote sensing. A pH sensor of that kind is based on the use of a poly(vinyl alcohol)/poly(acrylic acid) coating and interferometric laser interrogation.183 The sensor works in reflection mode, has an average sensitivity of 0.9 nm per pH unit (for the 11 wt % PVA/PAA coated sensor) in the pH range from 2.5 to 6.5 and rise/fall times, respectively, of 12 and 18 s. Inverse opal photonic crystal hydrogels (IOHs) were obtained1066 by polymerization of polyacrylamide and poly(methacrylic acid) along with poly(styrene-co-acrylic acid) particles by a “sandwich” method. These IOHs exhibit brilliant structural color that can be tuned by variation of particle size the concentration of monomers and cross-linkers. The color and Bragg diffraction peak of the IOHs responds to pH values (and also to methanol and ethanol). Reflectance is red-shifted at low pH values, and blue-shifted at high pH values.
Various kinds of nanoparticles were also applied in PhC-based sensors. A pH responsive PhC sensor was obtained1067 by incorporating magnetite nanoparticles (Fe3O4) into a poly(acrylamide)-poly(2-hydroxyethyl methacrylate) gel. The Fe3O4 particles were linearly arranged by polymerization under an external magnetic field. The resulting materials were endowed with pH sensing capability by converting poly-HEMA into PAA units. Other nanomaterials for use in PhC-based colorimetric sensing using hydrogel matrices include porous silicon in poly(2-diethylaminoethyl acrylate) to give a sensor for the pH 3–9 range,1068 silver and gold nanoparticles,1069 various kinds of zeolite nanoparticles, and others. A few other PhC-based methods are known but discussed in another section. These can be found by electronically searching for photonic crystal.
All PhC-based pH sensors are strongly interfered by ionic strength, which is disadvantageous and limits their application to defined situations.1060 PhC sensors can also be used as transducers in biosensors, where enzymes cause the production or consumption of hydrogen ions. Examples include organophosphorus hydrolase1070 and urea,1071 the determination of the activity of urease.1072 Urease causes an increase in pH, but organophosphorus hydrolase, on the other hand, produces two protons on hydrolyzing the insecticide parathion, and the drop in local pH causes the polymer-based PhC to shrink and to undergo a visually detectable blue-shift. Such sensors also may be used to detect acidic or basic gases.1065 A recent review covers the use of photonic crystals as detectors in microfluidic chips.1073
14.6. Holographic pH Sensors
This work was pioneered by Chris Lowe and co-workers. In such sensors, changes in the replay wavelength of sensor films are used to characterize the swelling behavior of the matrix as a function of analyte concentration. The various kinds of materials for use in (mainly physical) sensors has been reviewed.1074 In the first holographic pH sensor ever,1075 a 300 nm film of poly(hydroxyethyl methacrylate) was used. The holographic diffraction wavelength (which determines the apparent color) is governed by shrinkage or swelling of the hydrogel as a function of pH. The sensor works best in the pH 5–7 (i.e., physiological) range, and the analytical wavelength changes by up to 165 nm per pH unit. Such large changes make such sensors also well suited for visual estimation of pH values. The sensor, in slightly modified form, was later applied to enzymatic sensing of lactate via the drop in local pH values as the enzymes causes the oxidation of lactate.1076 Several patents also have been issued.
Beiu et al.1077 have introduced photonic crystals (PhCs) embedded into cores of optical fibers, where they undergo mechanical deformation perpendicular to the length of the fiber. While not specifically demonstrated, it may well work as a PhC based pH sensor when using a swellable polymer matrix whose RI varies with pH values. The near-infrared holographic glucose sensor described by Vezouviou and Lowe1078 is likely also to be a good pH sensor. This is also true for the swelling-based holographic sensors for lead(II),1079 ethanol,1080 temperature,1081 cocaine,1082 all based on the use of swellable hydrogels, more recently in combination with molecular imprinting.1083
14.7. Distributed Sensing of pH Values
Combination of fiber-optic sensor format, evanescent field read-out and time-resolved measurement allows for distributed sensing, that is, obtaining information from different regions along a long fiber-optic waveguide. Evidently, it represents an interesting alternative to the sensor array approach. In the distributed sensors, different parts of the core of optical fiber are coated with the sensing composition. The distance from the fiber front to a fluorophore-doped region is given by x = (c/2n)τd, where c is the speed of light in the fiber, n is the refractive index of the fiber core, and τd is the time delay between the excitation pulse reflected from the fiber front and the subsequent fluorescence emission from particular sensor region.1084 Consequently, a short laser pulse (e.g., 0.5 ns) and time-resolved fluorescence detection not only allows to access the fluorophore location but also its decay time and, therefore, the analytical information (Figure 51). The spatial resolution of this technique is determined by the fluorophore lifetime and is about 10 cm for a 20 m fiber1085 and 1 m in case of a 100 m fiber.1086 Time-resolved fluorescence detection following pulsed excitation can be used to probe distributed intrinsic fiber-optic sensors, resolve fluorophore locations along the fiber, and yield the optical dynamics of the chromophore.1084 Potential advantages include possibility of sensing in multiple locations with a single setup and potential suitability for read-out of different “sensing chemistries” (e.g., multiparameter sensing) localized at different fiber regions. However, several factors limit the practical applicability of the technique. Apart from the instrumental requirements (pulsed excitation source and equipment for time-resolved read-out) removing the cladding from a long fiber and coating it with the sensing composition can be very challenging increasing the risk of fiber damage and inhomogeneous coating. Additionally, the technique allows for self-reference read-out only in case of fluorophores showing pronounced response of their fluorescence decay time to pH (section 10.2), which are very rare. Although laser excitation corresponding to the absorption of a protonated or deprotonated form of the pH indicator may be potentially used,1084 it would significantly increase the complexity of the system. Because of these limitations, distributed pH sensing is more suitable for detection of significant pH changes in course of undesired events (e.g., leaks) rather than for precise pH measurements. This is even more true for the sensors that do not use an indicator dye but rather utilize the attenuation in the fiber due to pH-dependent swelling of a hydrogel.59
Figure 51.

Operating principle of a distributed sensor. (A) Schematic representation of the optical fiber modified with sol–gel layers containing immobilized aminoacridine (AA) and cresyl violet (CV). (B) Corresponding time-resolved emission profiles following pulsed laser excitation for a 9 m fiber. Reprinted with permission from ref (1084). Copyright American Chemical Society 1996.
15. Selected Applications of Optical pH Sensors
15.1. Applications of pH Optodes in Medicine and Test Animals
15.1.1. Sensing and Imaging of pH Values in Blood and the Vascular System
The normal blood pH varies between 7.35 and 7.45. Values below and above this range (acidosis and alkalosis, respectively) serve as an indicator of various disorders. Measurement of pH in arterial blood is one of the most frequent tests in monitoring of critically ill patients and is commonly performed intermittently with the help of blood gas analyzers.468 Commercial systems are available that make use of an optical pH sensor among 5 other planar sensors (pH, pO2, pCO2, K+, Na+, and Ca2+) incorporated in a disposable cassette (Figure 52A).1087 Similarly, a blood parameter monitoring system 500 (Therumo Cardiovascular) incorporates optical sensors for pH, pO2, pCO2, and K+ and enables continuous monitoring of these parameters during cardiopulmonary bypass. All are mainly based on the early work of the groups of Wolfbeis and of de Silva.
Figure 52.

Critical care analyzer developed by AVL Scientific Corporation: instrument (left) and disposable cartridge (right). Blood (60 μL) is injected via the Luer port and, then, passes the various optical sensors. The whole sensor kit is placed in a portable instrument for on-site use. The fluorescence of the sensor spots is read by a photodiode after photoexcitation with a blue LED. Reprinted with permission of The Royal Society of Chemistry from ref (1087). Copyright The Royal Society of Chemistry 2005. (B) Schematic cross-section of a multiparameter intravascular blood gas probe. Reproduced from ref (1103) with permission from BMJ Publishing Group, Ltd.
There has been a great interest in developing a system for continuous monitoring of “blood gases” (pH, oxygen, and CO2) in arterial blood particularly with help of optical sensors because of their high potential for miniaturization and minimally invasive character. The overall requirements are, however, much tighter than in case of in vitro measurements with blood gas analyzers. Particularly, the sensors for intravascular blood gas monitoring should be small enough to pass the artery cannula without affecting blood pressure fidelity, be accurate under all clinical conditions, and have to be biocompatible and nonthrombogenic.1088 Back in 1980, Peterson and co-workers reported the first fiber optic probe for online pH measurements in blood.33,1089 The absorptiometric probe showed good correlation with the data obtained by a blood gas analyzer and an electrode. Since this pioneering work, the suitability of various optodes for pH measurement in blood has been tested in humans and animals.311,399,468,1090−1093 Gehrich and co-workers41 were the first to report a multiparameter intravascular sensor for pH, oxygen and carbon dioxide relying solely on optical principles (Figure 52B). The sensor also included a thermocouple for compensation of the effects of temperature. Several commercial sensors also incorporating pH sensors have been introduced to the market.1088,1094 These sensors share a similar design by representing an array of pO2, pH, pCO2, and temperature probes in a single compact package.1095−1098 The performance of these probes was evaluated in numerous studies,1088,1099,1100 which were particularly extensive in case of the Paratrend sensor (Figure 37, section 10.7).1101 Despite often rather satisfactory in vitro performance, further success of such probes was hindered by the strong effect of many factors (thrombosis, reduced flow, etc.) on the accuracy of the intravascular measurements.1088 Furthermore, the cost-effectiveness of intravascular measurements has been disputed,1102 and some manufactures faced problems in terms of reproducible and low-cost mass production.1088 As a result, the above optodes for intravascular measurement did not make it to the market, or have been withdrawn.
15.1.2. pH Sensing in Other Biological Fluids
Monitoring of pH in stomach and esophagus is of importance for diagnostic of peptic ulcer disease and gastroesophageal reflux, respectively, and for assessing the effect of gastric antisecretory drugs.1104 Here, fiber-optic sensors can offer higher comfort to patients due to the small size of fiber optic sensors. To qualify, the material should show optimal response in (highly) acidic conditions since the pH value of the gastric juice normally varies from 1.5 to 3.5.1105 Several fiber-optic sensors for measurements in gastroenterological system were tested in vivo, among them the optodes reported by Baldini and co-workers71 and Netto et al.285
Because of their compact design, fiber-optic sensors offer significant advantages for in vivo measurements in other biological fluids. Schultz et al. recently reported pH measurements in surface liquid of the respiratory tract of patients with cystic fibrosis.1106 Assays were performed with a fiber-optic sensor (⌀ = 1 mm) inserted through a working channel of a bronchoscope. Sweat represents another medium where pH monitoring is of high interest due to correlation between pH value and health. The typical pH value of sweat is 5 to 7.1107 Measuring pH in sweat can be a good indicator of dehydration.1108 Curto et al.1109 described a microfluidic array of pH sensors based on 4 different absorptiometric indicators, which can be read out with a digital camera to enable semiquantitative pH measurement in sweat. Caldara et al.1110 designed a wearable pH sensor based on sol–gel immobilized absorptiometric indicator in combination with the dedicated read-out device and used it in body trials.
15.1.3. Sensing and Imaging of pH Values on Skin and in Wounds
Wound healing is a complex process involving many biochemical events and parameters that impair healing. The process is still not fully understood due to the lack of appropriate analytical tools.1111 pH is one of the most important parameters during wound healing because of its regulatory function in numerous processes associated with healing.1112 pH optodes enable real time 2D monitoring of the healing process via imaging. Schreml et al.145 imaged pH values during wound healing with the help of a DLR-referenced (section 2.2.7) pH optode. Although the optode follows a common design (pH-sensitive and reference microparticles dispersed in hydrogel layer), the choice of support was of extreme importance for this application. Biologically inert, transparent, and flexible 25-μm poly(vinylidene chloride) foil was found to be the best. Wound healing was accompanied by decrease of pH values (Figure 53).
Figure 53.

Luminescence imaging of pH during cutaneous wound healing. Upper row: Photographic images of the skin sites. Lower row: Respective pseudocolor images created with optical 2D pH sensors. Scale bars: 1 cm. Reprinted from ref (145) with public license. Published by the United States National Academy of Sciences.
The same group modified the above pH sensor layer to enable simultaneous imaging of pH and oxygen with an RGB camera441 since oxygen is another very important parameter in wound healing. A detailed study of chronic wound surfaces with a similar material revealed gradients in extracellular pH in chronic wounds that disrupts epidermal repair.425 The same method was adopted to study postradiogenic wound healing disorders using commercially available pH sensor layers.1113
Further development was focused on improvement of material composition and coating techniques to warrant good adhesion of the sensing layer on uneven skin. A fluorescein (with green fluorescence) was used as the indicator, and a red-emitting Ru(II) complex as an inert reference emitter, and the RGB techniques for signal processing.1114 Spray-coating of the sensing “cocktail” was demonstrated to be promising. A support material (such as polyester) is not needed.
Another group1115 embedded absorptiometric pH sensitive beads into alginate hydrogel fibers which possessed excellent flexibility and adhesion to the skin surface with the trade-off of losing the spatial information obtained via imaging. In another approach, phenol red was incorporated into an antibiofouling and biocompatible zwitterionic polycarboxybetaine (PCB) hydrogel matrix.1116 The material allowed smartphone based readout via the blue and green channels of the camera.
The materials described above rely on a single pH indicator and are thus have a limited dynamic range of about 3 pH units. Since the entire range observed in wounds and skin disorders is larger (pH 4–9), further improvement of the indicator chemistry is necessary to achieve optimal resolution in the whole range of interest.
In view of potential applications for treatment of skin diseases via (trans)dermal drug delivery, Haag and co-workers1117 measured the pH values in hair follicles with help of follicle-penetrating submicroparticles. They found a strong pH gradient in the hair follicle. The pH value is 6.5 on the skin surface but increases to 7.4 in deeper areas with a sharp increase in pH over the first 300 μm. Later, Mohr and co-workers1118 developed disposable cotton swabs for pH measurements in wounds based on covalently immobilized colorimetric pH indicators and a reference dye. Although the swabs allowed only semiquantitative pH determination, they combined a number of attractive features such as suitability to gamma sterilization, low toxicity, and low cost. A similar approach was used for a smart bandage that was combined with a small, autonomous analytical instrument that allowed readout with a smartphone using international wireless standards RFID and NFC.360
15.1.4. Sensing and Imaging of pH Values in Tissue and Organs
Monitoring of pH in brain may be beneficial for diagnostics and treatment of neurosurgical patients since pH changes are related to brain damage. Fiber-optic pH microsensors are attractive tools for such studies because of their small size and, therefore, minimal invasiveness. Experiments in test animals performed with a commercial multiparameter sensor (section 10.7) showed that brain pH value decreases by 0.2–0.4 units during brain injury and focal ischemia.1119 During the brain insult, the pH value of brain parenchymia decreased from 7.13 to 6.75.1120 Similar results were obtained in brain of mice which underwent a stroke.422 The authors used a fiber-optic sensor (⌀ = 125 μm) based on a sol–gel-immobilized seminaphthorhodamine pH indicator. They also studied the response of brain pH to the injections of sodium bicarbonate into the peritoneal cavity and demonstrated excellent correlation between the readings obtained by the optode and a microelectrode.422 Magnotta et al.1121 studied effect of CO2 inhalation resulting in a decrease in mouse brain pH values with a commercial optical pH microsensor.
The microenvironment of tumorous tissue is characterized by hypoxia, vascular abnormalities and low extracellular pH (pHe).1122 The difference between extracellular and intracellular pH values is particularly distinct. The extracellular pH value near tumor cells is about 0.5 units lower than the intracellular value.1123,1124 Low pH, therefore, can be considered as a cancer marker. Typically, pH imaging in tumors is performed with (a) dissolved pH indicators,1123,1124 (b) addressable conjugates of pH indicators (e.g., with antibodies),1125 (c) fluorescent proteins,1126 or (d) nanosized sensors.782,886,1127 These probes (which are often referred to as “pH activatable”) become highly emissive in tumor microenvironment due to fluorescence “switch on” under acidic conditions. This function is very useful for tumor visualization, but precise pH measurement remains challenging for two reasons: (a) The precision and accuracy of fluorescent pH imaging in tumors and other tissues is strongly affected by scattering and absorption of the excitation and emission light, and (b) calibration is difficult. Chen et al.1128 showed that even in case of NIR pH indicators most fluorescence is lost already at comparably small tissue thicknesses (<1.5 mm). In contrast, the self-assembled nanoprobes based on albumin-immobilized NIR pH indicator and reference dyes were found to be excellently suitable for pH measurement via photoacoustic imaging. Here, ratiometric capabilities were retained even in deeper tissue layers (3 mm).
Compared to in vivo studies, measurement of pH in tumor models is a more convenient and reliable method to study their metabolism, viability, and drug resistance. For instance, Kenney and co-workers performed pH measurements in paper scaffolds containing breast adenocarcinoma cells which were positioned above a planar pH optode.438 Ex vivo, a 250 μm fiber optic probe inside a hollow needle was demonstrated to be applicable for pH measurement in an ovine lung tumor model.1129 The fiber optic probe could distinguish tumorous from healthy tissue with statistical significance. For choice of the immobilization matrix, a polymer microarray approach was used that allowed the selection of the material with the best performance from 180 samples.
15.2. Intracellular and Extracellular Measurement of pH Values
Intracellular pH values are typically measured during cell proliferation, apoptosis, endo- and exocytosis, ion transport, or muscle contraction.99 Because of the small size of the cells, optical methods are virtually the only possibility to perform measurements. The most common tools include dye-based pH probes, pH sensitive fluorescent proteins, and pH nanosensors. Numerous pH indicators for intracellular measurements, described in detail elsewhere,99 have been reported over the past decades are still the most developed and used analytical tools. Fluorescent proteins (section 7.3) can be expressed inside cells and therefore are excellently suitable as biocompatible intracellular probes. The many known pH nanosensors (section 8) are characterized by a large structural variety. The proper choice of materials and functional groups determines their suitability for intra- or extracellular measurements. However, most nanosensors have been designed for intracellular sensing. Their addressable character453 enables accumulations at specific intracellular sites. Since typical pH in cellular compartments differs considerably (cytosol (7.1–7.2); mitochondria (7.5–8), lysosomes (4.5–5.5)), and because optical pH sensors are limited in the dynamic range to 2–3 pH units, different “sensing chemistries” have to be employed to obtain optimal resolution in a particular application. To address broader pH distribution with a single material, nanobeads relying on combination of several pH indicators have been designed (see section 13 for more details).762,764
Read-out of the intracellular pH probes is almost exclusively performed by using microscopy. In most cases, the probes are designed to enable ratiometric (2-wavelength) read-out,404,724,744,753,760,834,836,1130,1131 but some lifetime based nanosensors for fluorescence lifetime imaging (FLIM) also have been reported.482,801 These probes are advantageous due to absence of artifacts associated with wavelength-dependent light scattering and also overcome the adverse effects of indicator/reference leaching or photobleaching. Intracellular pH measurement with help of 2-photon526,880 and upconverting probes956,958 should also be mentioned. It has not been demonstrated in all cases; however, that the pKa values of probes and sensors are the same during calibration with buffers and in the intracellular space.
Extracellular pH plays a very important role in biological processes making this parameter useful to study the regulation of bone cell function,1132 in cancer research due to characteristically low extracellular pH of the tumor cells1133 or to study metabolic perturbations via assessment of glycolytic activity.549 The optical tools for measurement of extracellular pH values are versatile, and many materials covered in this Review can be useful. For instance, extracellular pH was accessed with help of planar optodes,467 pH sensitive quantum-dots,814 nanoprobes based on pH indicator-DNA-lipid conjugates that anchor directly on the cell surface1134 or even with water-soluble luminescent pH indicators.467 In this kind of applications, combination of extracellular pH measurement with measurement of other parameters, such as concentration of dissolved oxygen, ATP, and total protein, is of particular interest since it allows assessment of cell metabolism.985
15.3. Sensing and Imaging of pH Values in Plant Research
Many response systems in plants are linked to complex dynamics in signaling parameters, such as Ca2+, reactive oxygen species, and pH.1135 Most researchers have studied pH in cytoplasm and cell wall of plants with help of genetically encoded fluorescent protein probes.1135−1139 For instance, anoxia- and salt stress-induced pH changes in root cells were studied.1139 Optical sensors (planar, fiber optic, or nanosized) have been used more recently. Examples include imaging of pH values in the rhizosphere, that is, an area of soil around a plant root, which is directly influenced by root secretions. Compared to electrodes, planar optodes are much less invasive and allow mapping of different parameters in rhizosphere. Among other parameters, pH is of particular importance due to ability of some plants to acidify the rhizosphere to enhance the uptake of poorly soluble nutrients. Rao and co-workers1140 used a colorimetric system (bromocresol purple in agar gel) to visualize the pH dynamics in rhizosphere of legume roots and found light-induced acidification (Figure 54A). Blossfeld and Gansert demonstrated rhizosphere acidification by mapping pH with a commercial planar optode.1141 The pH values were read-out point-by-point with help of a micromanipulator. The same sensor system was also used for pH mapping in soils contaminated with trace metals1142 and in combination with an oxygen sensor for monitoring of rhizospheric dynamics in short-time flooded plant species.1143
Figure 54.

(A) Changes of rhizosphere pH along the root axis in dark (left) and light (right) conditions. Reprinted by permission of Oxford University Press from ref (1140). Copyright Oxford University Press 2002. (B) Combined optical pH imaging and imaging of trace metals with DGT technique in Salix smithiana rhizosphere. The bars represent pH and average solute flux to the gel (in pg·cm–2·s–1) respectively. Adapted from ref (424) with public license. Published by Elsevier.
The above drawbacks of the point-by-point read-out can be overcome by using fluorescence imaging. Several groups utilized a combination of a planar optode and a dedicated imaging unit.993,1144,1145 Rudolph and co-workers430,1146 used hydrogel-immobilized aminofluorescein in combination with a UV lamp and a CCD camera. The pH sensor relies on measurement of fluorescence intensity, which is not the best approach. In several cases, the pH measurement was combined with optical imaging of other parameters, including oxygen,1146 carbon dioxide,1144 or both oxygen and carbon dioxide.993 Santner and co-workers424 combined imaging of pH (with a ratiometric optode and a consumer RGB camera) and chemical imaging of cationic trace metals (Mn2+, Cd2+, Zn2+, Cu2+, Fe3+, Ni2+, Al3+, Co2+, and Pb2+) as shown in Figure 54B. The latter was realized using diffusive gradients in thin films1147 with subsequent analysis of the bound solutes by laser ablation inductively coupled plasma mass spectrometry. A sensor consisted of a thin (<100 mm) hydrogel film containing anion and cation binding materials, a fluorescent dichlorofluorescein-based pH indicator, and red-emitting reference particles. The experiments demonstrated clear increase in the concentration of several ions (such as Mn2+, Figure 54B) in the rhizosphere due to proton-induced dissolution of metal oxides (Figure 54B). The method was later extended to different plant species and combined imaging of pH and cations with chemical imaging of labile phosphorus.1148
15.4. Sensing and Imaging of pH Values in Oceanography and Marine Biology
Such sensors have to be compact enough to be installed on different platforms, enable autonomous sampling and transmission of the data, and possess precision of better than 0.002 pH units1149 to enable comparison of data obtained from different locations and time periods. Currently, such precision can only be achieved with systems based on spectrophotometric read-out using dissolved indicators, such as m-cresol purple.1149,1150 As pointed out in the section on effects of ionic strength (section 1.6), the varying salinity of samples can heavily compromise the precision of such measurements.112 One of the first studies was presented by Monici et al.45 who reported a fiber optic pH sensor for seawater monitoring. Present day (commercial) sensors are still rather bulky (weight of several kilograms).1151 Several groups have attempted to design/adapt pH optodes for oceanographic applications. Almost three decades ago, Serra et al. designed a colorimetric fiber-optic sensor for seawater measurements,306 which however had moderate reproducibility. Clarke et al.120 investigated a commercial pH sensitive sensor spot in a custom-made setup including a LED for the excitation, dichroic beam splitter, and a photomultiplier. The sensor showed a precision of 0.0074 pH units, moderate salinity cross-talk (−0.01 pH/PSU in the salinity range 5–35), a drift of 0.06 pH units in 4 weeks, and good photostability. On the other hand, the limitations included strong cross-talk to temperature (−0.046 pH/K for temperature range from 5 to 25 °C) and the pKa value of 6.93 at 20 °C, which is about 1 unit below the value optimal for oceanographic applications.
Staudinger et al.537 reported an optode system specially designed for oceanographic applications. It consists of a read-out module and screwable caps with the sensing materials (Figure 55A). The compact reader (length = 154 mm, weight = 970 g) includes an optoelectronic unit, logger, and battery positioned into a pressure-resistant housing and enables autonomous measurements down to 500 m depth. It can be deployed for 1 year, with data provided in intervals of 30 s. The interchangeable sensor caps enable measurements of pH, dissolved oxygen, or dissolved carbon dioxide with the same reader, which is expected to significantly reduce the manufacturing and deployment costs. The pH material based on a far-red aza-BODIPY indicator in a cross-linked hydrogel features almost ideal pKa value of 8.05, high precision (0.0023 pH units at pH 8.02), low temperature cross-talk (−0.0114 pH/K), negligible cross-talk to salinities from 15 to 35, and high stability (no drift within 54 days at 10 °C and a drift of 0.0021 pH units/day at 25 °C).124 Later version of the optode system allowing measurements up to 4000 m depth is commercially available from PyroScience (www.pyroscience.com).
Figure 55.

Examples of applications of optical pH sensors in oceanography and marine biology. (A) Stand-alone pH optode for oceanographic applications developed by Staudinger and co-workers. Reprinted from ref (537) with public license. Published by Wiley Periodicals, Inc., on behalf of Association for the Sciences of Limnology and Oceanography. (B) Imaging of pH distribution with planar optode and an RGB camera. The pseudocolor image shows the elevated values around a 2 day old burrow of the polychaete Hediste diversicolor. Reprinted from ref (374) with public license. Published by Frontiers. (C) Photograph of cross-section of didemnid ascidian Lissoclinum patella containing symbiotic cyanobacterium Prochloron (left) and pseudocolor images of the pH distribution in L. patella before and under irradiation with visible light (incident photon irradiance of 250 μmol photons m–2 s–1). Reprinted from ref (1152) with public license. Published by the Association for the Sciences of Limnology and Oceanography, Inc., 2011.
In contrast to the pH sensors developed for oceanography, very high precision and stability are not mandatory for short-term applications of optodes in marine biology. Several state-of-the-art systems fulfill the necessary requirements. pH optodes have been used particularly often for studies involving photosynthetic organisms since photosynthetic activity consumes carbon dioxide and thus leads to an increase of pH, while decomposition of organic matter has the opposite effect. Many pH optodes have been designed for imaging of marine sediments. Sensors using HPTS as an indicator embedded in cellulose acetate are far from optimal (pKa´ = 6.4)375 and also suffer, not surprisingly, from high cross-talk to salinity. The response of covalently immobilized HPTS377,990 was better with respect to the dynamic range (pKa´ = 7.06), and the sensor showed more favorable properties (good chemical stability, absence of dye leaching, acceptable cross-talk to salinity), but the “sensing chemistry” was not well described. The group of Klimant146 reported on a pH optode based on a lipophilic fluorescein derivative with an almost ideal pKa value of 8.3. The main drawback of the sensor is the poor photostability of the fluorescein chromophore.
Larsen et al.374 described a ratiometric pH sensor layer for imaging with a digital camera. A light-harvesting system composed of a green-emitting coumarin dye (the energy donor) and yellow-emitting lipophilic HPTS derivative (the energy acceptor) showed response from pH 6 to 9, which makes it suitable for imaging sea sediments (Figure 55B). Specially designed software and hardware (now commercially available) makes it possible to control the illumination with photodiodes and to use virtually any consumer RGB camera for imaging. Han et al.991 report on a ratiometric optode for imaging slightly alkaline sediments. It is making use of an indicator immobilized in PVC (pKa´ of 9.0 at 15 °C). Good correlation between the profiles obtained with the optode and microelectrode was observed. The drawback of the sensor is rather strong temperature cross-talk (∼0.04 pH units/K).
Similar to sediments, planar optodes have been used for pH imaging in marine photosynthetic microbial mats921 and rhizosphere of seagrass.1153 In both cases, the sensor based on the indicator aza-BODIPY (section 4.1) showing optimal pKa´ value of 8.0 and excellent photostability was used. The NIR emission of the pH indicator allowed for simultaneous imaging of pH and oxygen distribution with the dual optode.921 Planar optodes in combination with a commercial camera were applied for imaging of pH, oxygen, and carbon dioxide in rhizosphere of a saltmarsh plant.993 A pH-optode based on an imaging fiber was used for imaging the release of acids from sea urchin eggs, which was induced by fertilization.1154 The group of Kühl explored an alternative approach to imaging pH and oxygen in the rhizosphere of seagrass with help of nanoparticles dispersed in an artificial sediment.1155 The same group investigated the photobiology of a didemnid ascidian containing symbiotic cyanobacterium Prochloron.1152 Upon light exposure strong increase in pH and production of oxygen in the regions containing the cyanobacterium was observed via imaging (Figure 55C). Also the same group used a fiber-optic pH microsensor to sense pH values in the gastric cavity of corals.151
15.5. Sensing and Imaging of pH Values in Biotechnology
Agayn and Walt1156 published one of the earliest reports on application of pH optodes for monitoring of bacterial fermentation (Escherichia coli). A fiber-optic sensor based on fluorescein immobilized in pHEMA matrix showed excellent performance in the complex fermentation media and survived steam sterilization without significant alteration of the properties. Shortly later, a triple sensor was described76 for measurement of pH, CO2, and oxygen in bioreactors. Sample fluid was continuously passed through an external flow cell containing the sensors. This reduces the risk of contamination of the bioreactor. However, it is more common now to integrate planar optical sensors into shake flasks and bioreactors, and such products are commercially available. Despite this, other tools (glass pH electrode, ISFET) are still used in many applications. This is explained by the fact that special versions of electrodes offered by main manufactures tolerate harsh cleaning-in-place (CIP) conditions (e.g., 2% NaOH and 80 °C), a process commonly used for cleaning equipment in biotech, pharma, food, and beverage industries. Hardly any state-of-the-art pH optode can survive such conditions without drift due to degradation of the indicator or the matrix. However, most pH optodes tolerate mild sterilization methods including sterilization by steam,1156 radiation, or H2O2 or simply by dry heat (at 160 °C for 45 min).111 A dual excitation ratiometric fluorescent pH sensor was used for noninvasive bioprocess monitoring.380 The fluorescent indicator 8-hydroxy-1,3,6-pyrene trisulfonate was immobilized onto a basic anion exchanger and entrapped into a proton-permeable hydrogel layer. The sensor responded within <9 min and fully reversibly, is sterilizable and can be used for online monitoring of the pH value of an E. coli culture. Continuous pH monitoring in a perfused bioreactor system using an optical fiber pH sensor was also demonstrated.1157
On the other hand, extreme chemical stability is not needed for application of optodes in microbioreactor systems. Here, optodes offer several unique advantages such as being small (allowing for integration of optodes for different parameters in a single microwell) and low-cost (making the sensors disposable). Most optodes are resistant to sterilization with γ or β radiation and some to sterilization by steam in autoclaves.111 Several combined sensor/micro bioreactor systems are available from different manufactures (such as BioLector from m2p-laboratories, ambr 15 system from Sartorius, micro-Matrix from Applikon Biotechnology, bioREACTOR from 2mag). They utilize pH and pO2 optodes integrated into microplates and minireactors with culture volumes varying from 0.8 to 15 mL. Instrumentation relies on sensors from PreSens (Regensburg, Germany). PreSens also offers a line of products for biotechnology including a microplate system in 24-well format (SensorDish, Figure 56B).1158 Other sensor/microbioreactor systems include incubator shaker systems for cultivation and measurement in up to 96 plastic cultivation tubes and shake flasks of larger volume equipped with pH and pO2 sensor spots.1159 These commercial systems have been used in numerous studies, for instance for microorganism cultivation,1160,1161 strain screening,1162,1163 rapid process optimization,1162,1164−1166 and recombinant protein production1167 to mention only a few. The main limitation of the above systems is the measurement range from pH 5.5 to 8.0, which does not cover all potential applications. To address this issue, Janzen et al. presented a pH sensor based on chlorinated fluorescein derivative showing dynamic range from ∼4–7 and demonstrated its applicability for anaerobic production of acetone, butanol, and ethanol.1168 Unfortunately, application of the sensors in complex medium resulted in a drastic reduction of resolution and dynamic range.
Figure 56.

(A) Simultaneous monitoring of pH, carbon dioxide, and oxygen with a fiber-optic multiparameter sensor during fermentation of beer. Reprinted from ref (429) with permission from Elsevier. Copyright Elsevier B.V. 1997. (B) Photograph of a 24-channel SensorDish reader from PreSens on a shaker (left) and cross-section of a well of a microplate with the sensor in its bottom. Reprinted with permission from ref (93) Copyright Wiley Periodicals, Inc., 2008. (C) Scheme for the preparation of a sprayable sensor using a thermogelating hydrogel and its application. Reprinted from ref (127) with permission from Elsevier. Copyright Elsevier B.V. 2015.
pH values often are measured along with metabolic parameters, such as pO2 and pCO2 (Figure 56).429 A dual sensor was described for simultaneous monitoring of pH and oxygen during bacterial fermentation.93 An agarose-coated Petri dish with immobilized pH sensitive nanoparticles was used to image bacterial growth and metabolism with help of an RGB camera.571 In later work, the same group127 used the thermogelating properties of the polymer block-co-polymer Poloxamer407 to spraycoat the Petri dish with a pH sensing layer. pH sensor microparticles were dispersed in the polymer and sprayed on the surface of the Petri dish at below 25 °C (Figure 56C). At these temperatures, the sensor “cocktail” remains fluid and yet adheres well. If temperature is risen to above 25 °C, the gels form a thin and soft but solid sensing film. The method was applied to monitor pH changes caused by the growth and metabolism of a culture of the pathogen Staphylococcus aureus. Rao and co-workers integrated optical pH sensors (hydrogel-immobilized 6,8-dihydroxypyrene-1,3-disulfonic acid or Dowex-immobilized HPTS) and oxygen sensors in (micro)bioreactors for mammalian cell culture,100,394 cultivation of E. coli(380,1169,1170) and effective clone selection.1171 Good agreement was found between values obtained by optodes and electrodes, respectively.100
Although microbioreactors and microplates already allow for dramatic reduction of sample volume compared to shake flasks and lab-scale bioreactor systems, even further miniaturization is possible with microfluidic devices (see section 15.8 for more details). Similar to microbioreactors, optical pH sensors have been integrated into microfluidic devices and used for bioprocess monitoring.1172
Biocatalytic synthesis of fine chemicals often is performed in continuous manner employing enzymes immobilized on insoluble porous carrier particles. In this application, measurement of pH in solution surrounding the particles does not provide desired information about optimal conditions since pH inside the particle may vary considerably from the bulk. The approach proposed by Nidetzky and co-workers addresses this issue by monitoring of local pH with help of enzyme-modified beads (Sepabeads EC-EP) that are stained with a fluorescent pH indicator (or Yellow Fluorescent Protein) and phosphorescent reference material.147,1173,1174
15.6. pH Sensors as Transducers in Biosensors
Many enzymatic reactions involve the formation or consumption of protons and, therefore, can be indirectly monitored with the help of pH sensors. Respective biosensors are composed of a pH sensing layer (typically in the form of a planar optode or a fiber-optic microsensor) and a second layer containing immobilized enzyme. Even better, both components are contained in a single layer, for instance in the form of micro- or nanoparticles. Typical enzymes include glucose oxidase, penicillinase, urease, acetylcholine esterase and organophosphorus hydrolase. It has to be stated here that enzymatic biosensors with pH transduction suffer from two limitations. The first is the varying buffer capacity of an unknown sample, and the second is the unknown initial pH value of an untreated unknown sample.
Glucose biosensors utilizing optical pH sensors explore classical indicator chemistry,92 utilize pH-dependent absorption changes of polyaniline (section 7.2 on conjugated polymers),1175 or the swelling of amino-modified hydrogel as induced by pH changes.57 Biosensors for penicillin38,1176−1181 utilize hydrolysis of the antibiotic catalyzed by penicillinase (β-lactamase). This results in the formation of penicilloic acid and therefore a drop of the pH value. Alternatively, penicillin-G-amidase may be used.1182 Ammonia and carbon dioxide are formed upon enzymatic hydrolysis of urea in the presence of urease. This was utilized in numerous biosensors for urea based on optical pH transduction.38,177,308,1183−1195 Such biosensors can, in principle, also be used for analysis of metal ions due to their inhibitory action on the activity of urease.1192 Ammonia and CO2 also are formed on hydrolysis of creatinine in the presence of creatinine deiminase which was used for detection of this analyte with help of an optical pH transducer.1184 The pH change associated with the production of phosphoric acid upon hydrolysis of p-nitrophenyl phosphate catalyzed by alkaline phosphatase was utilized by Koh and Pischko in an enzyme activity essay.1195 A biosensor for the herbicide atrazine based on optical pH transduction utilizes the enzyme glutathione S-transferase, which catalyzes the reaction of atrazine with glutathione and results in the release of protons.1196
Hydrolysis of acetylcholine, catalyzed by acetylcholinesterase (AChE) and resulting in formation of choline and acetic acid, can be utilized to detect acetylcholine with help of an optical pH transducer.1183,1192,1197,1198 All these methods work irreversibly and can be hardly applied to online sensing. The same detection scheme was used in assays for organophosphorus compounds (pesticides and warfare agents), which inhibit the action of AChE.268,1188,1199,1200 The selectivity of these methods is poor since action of AChE is inhibited by a wide variety of other toxic compounds and heavy metal ions. Methods based on organophosphorus hydrolase offer much better specificity than those utilizing AChE. The enzyme catalyzes hydrolysis of various organophosphate esters, including pesticides and chemical warfare agents, resulting in a pH change. Several sensors utilizing this enzyme in combination with an optical pH transducer have been reported.1201,1202 A biosensor for antiglaucoma drug acetazolamide based on inhibition of bicarbonate dehydration catalyzed by carbonic anhydrase was also described.1203 Enzyme-based test stripes for rapid visual or photographic detection of gaseous sulfur mustard by using a hydrolase immobilized on a commercial pH test strip were reported.1204
15.7. pH Sensors as Transducers in Chemical Sensors
Optical sensors for pH values also were used to quantify acidic or basic chemical species including carbon dioxide, sulfur dioxide, ammonia, and amines. In all these approaches, an existing pH sensor is covered with (or incorporated into) a gas-permeable but proton-impermeable matrix, such as silicone. Typically, the pH sensor consists of a microbead soaked with a solution of a pH indicator probe (such as phenol red or bromothymol blue) in a weak buffer. The pKa value of the buffer has to be adjusted to the pKa value of analyte gas (whether acidic or basic), and the capacity of the buffer governs the analytical range. Strong buffers yield wider analytical ranges, but detection limits are higher. The approach has the advantage in enabling both gaseous and dissolved gases to be determined. Sensors based on this analytical scheme have been reported for carbon dioxide, HCl gas, sulfur dioxide, and ammonia, to give a few examples only. Table S21 summarizes representative examples of pH sensors used as transducers in such sensors.
Optical sensing schemes for pH values may also be used to sense anions or cations via the so-called coextraction or ion-exchange mechanisms, respectively. In this case, lipophilic pH indicators are preferably used. In simplified terms, the coextraction method relies on the extraction of an anion by an anion carrier, such as dodecyltributylammonium ion into a plasticized polymer membrane, which is accompanied by the coextraction of a proton for electroneutrality reasons. The coextracted proton will protonate a lipophilic pH indicator dye also contained in the sensor matrix, and this will cause a detectable color change. The ion-exchange mechanisms relies on the extraction of a cation by a carrier such as a crown ether or valinomycin into a plasticized membrane. To maintain electroneutrality, a proton is released from a lipophilic pH indicator dye also contained in the sensor matrix, and this will also cause a color change. Table S21 also summarizes representative examples of pH sensors used as transducers in optical sensors for cations. Both the coextraction and ion-exchange mechanisms make use of highly lipophilic indicators to warrant solubility in plasticized PVC or ethyl cellulose. Chemical formulas are given in Figure 57. Such lipophilic pH indicators can be used, in principle, in optical sensor strips for pH values but were mainly used in sensors for ions, such as K+, in serum. MEDPIN [7-(n-decyl)-2-methyl-4-(3,5-dichlorophen-4-one)-indonaphth-1-ol] was long used in a test commercialized by Ames-Miles.1205 Its color reversibly changes from orange to pink to blue. The color of the Nile Blue derived probes ETH 5350 or ETH 5418 changes from red to purple to blue,86,87,1206 that of KFU 11 from yellow to green to blue,1207 and that of KFU 22 from blue-green (684 nm) to yellow (420 nm).60
Figure 57.

Chemical formula of representative lipophilic pH indicators for use in sensors for pH values and ions.
15.8. Integration of pH Sensors into Flow-Injection Analyzers, Microfluidic Devices, and Lab-on-a-Chip Systems
Flow-injection analysis (FIA) is a popular and mature tool for high-throughput chemical and biochemical analysis. Various commercial systems are available and can be adapted to numerous kinds of analytical challenges. Numerous (bio)analytical methods are available. Notably, FIA also is a perfect tool to calibrate optical sensors and to establish the response functions of newly designed sensors. Early uses of pH sensors as detectors in FIA have been reviewed.1208 A small-volume fiber-optic pH sensor based on evanescent wave excitation and fluorometric detection was adapted such that it can be placed in a FIA analyzer.1209 The sensor was fabricated by inserting a declad fiber into a transparent capillary tube. The microchannel between the optical fiber and the capillary inner wall acts as the flow cell. Flow injection was also used to sense urea via its enzymatic decomposition to ammonium and carbonate and to determine the activity of the enzyme urease.1210
The first microfluidic system of that kind was a product that is on the market ever since 1985. It enables measurement of the pH value and of several other parameters of whole blood (not serum!) via optical sensors placed, one by one, along a microfluidic channel (Figure 52). Blood is injected at one end. On its way to the reservoir at the end contacts the sensors spots as shown. It consists of a microfluidic system comprising an entrance port, flow channels with integrated sensor spots, and a reservoir for excess blood. The channels in the kit come filled with a fluid that is used for 1-point calibration of the sensors spots prior to filling them with a blood sample.
Seemingly simply, the integration of the sensors in a microfluidic chip can be a challenging task since chip materials vary from very hydrophobic (cross-linked polydimethylsiloxane, poly(methyl methacrylate), cyclic polyolefins, such as Zeonor or Topas), to very hydrophilic (glass). In case of pH sensors, good adhesion of the sensing layer on the support is mandatory. This is often accomplished via surface pretreatment or covalent linkage to the surface. The choice of sensing materials and the deposition method is also determined by the technique used to seal and bond the chip. Heat, organic solvents, or UV light as required during the bonding step1211 may adversely affect the sensor properties or even lead to malfunction.
Microfluidic channels were functionalized with mesoporous silica films and subsequently surface-modified with covalently linked fluorescein (Figure 58A).1212 Also, polyaniline nanofibers were incorporated into microchannels of a flexible PDMS chip for colorimetric visualization of pH gradients (Figure 58B),1213 and oxygen and pH sensor arrays for lab-on-a-chip devices were produced by a microfabrication technique.1214 Commercially available microfluidic devices made out of glass can be equipped with pH sensor spots by maskless photopolymerization of suitable prepolymers inside the devices. The method does not require any microfabrication methods and only requires a microscope and a UV–LED.1198
Figure 58.
Examples of optical pH sensors integrated into microfluidic devices. (A) pH response of sol–gel immobilized fluorescein in microfluidic channels of a patterned fluidic system. Reprinted by permission from Springer Nature from ref (1212). Copyright Springer Nature 2000. (B) Absorptiometric sensing with polyaniline nanofibers integrated into microfluidic channels of a flexible chip. Adapted with permission of The Royal Society of Chemistry from ref (1213). Copyright The Royal Society of Chemistry 2013. Permission conveyed through Copyright Clearance Center, Inc. (C) Fluorescence images of ratiometric pH sensor spots exposed to different pH. Adapted from ref (1195) with permission from Elsevier. Copyright Elsevier B.V. 2004. (D) Fluorescence image of a chip for isoelectric focusing with integrated pH layer. Adapted with permission of The Royal Society of Chemistry from ref (988). Copyright The Royal Society of Chemistry 2013. Permission conveyed through Copyright Clearance Center, Inc. (E) Simultaneous pH gradient observation and separation of fluorescently labeled proteins lactalbumin (La), lactoglobulic (Lg), and myoglobin (My). Adapted from ref (588) with public license. Published by The Royal Society of Chemistry.
Microfluidic devices and lab-on-a-chip systems allow for even further miniaturization of microbioreactors.945 Optical pH sensors integrated into microfluidic devices have also been used for fast pesticide detection1215 and for rapid screening of antibiotics.1216 These systems rely on inhibition of metabolism of algae and E. coli, respectively. Microarrays for simultaneous measurement of pH values and solvent polarity1217 and simultaneous sensing of pH and glucose have also been reported.1218 Alternatively, microfluidic channels may be modified with pH-sensitive microparticles1219−1221 for example in predrilled holes.1221 Nanoparticles were also dispersed in the flowing sample.511,703 In this approach, laborious integration of sensor spots inside the chip is not required so that the commercially available microfluidic chips and particles can be used.
Optical pH sensors integrated into microfluidic chips and flow-injection analysis have also been used for monitoring enzymatic reactions. These sensors are essentially biosensors with optical pH transduction (see section 15.6). The indicator SNAFL-1 was conjugated to alkaline phosphatase (ALP) in PEG-diacrylate-based hydrogel microstructures (Figure 58C).1195 ALP hydrolyzes p-nitrophenyl phosphate to produce phosphoric acid, which lowers the pH value. The authors also realized a microfluidic biosensor for urea by substituting alkaline phosphatase with urease. In this case, the pH value is increased because of the formation of ammonia. In a different approach, the microfluidic chip was modified only with pH sensors; the enzyme and the substrate were supplied separately.1222 The authors monitored synthesis of l-erythrulose from hydroxypyruvate and glycolaldehyde catalyzed by transketolase and decomposition of penicillin G into 6-amino penicillanic acid and phenyl acetic acid catalyzed by penicillin G acylase, which are associated with pH changes.
Nagl and co-workers integrated fluorescent pH sensors into microfluidic chips for application in isoelectric focusing (Figure 58D, E).148,588,592,988,1223,1224 In this high-resolution variant of electrophoresis, different molecules (typically proteins) are separated due to differences in their isoelectric point (i.e., the pH value at which the molecule has no net charge).The pH gradient created in the gel, together with an applied electrical field, causes migration of the molecules to the position where the isoelectric point is reached. Optical pH sensors were used for direct visualization of the pH gradient. The authors prepared sensor arrays via multistep liquid photolithography on the basis of cross-linked oligo(ethylene glycol diacrylate) hydrogels utilizing fluorescein148,592,988 and HPTS592 as indicators. They were covalently coupled to pHEMA to avoid leaching.592 In further work, the pH sensitive layer was prepared using a photopolymerizable far red perylene bisimide indicator123 incorporated into cross-linked poly(acryloylmorpholine) hydrogel.588,1224 pH sensing in the far red spectral range enabled on-chip labeling of proteins and peptides with fluorescent dyes emitting in visible part of the spectrum and, therefore, visualization of the labeled biomolecules without spectral interference with the pH sensor.588 Various kinds of microchannel based systems (referred to as SensorPlugs) for parameters, such as pH value, oxygen, and carbon dioxide, and an imager (referred to as VisiSens), are commercially available (PreSens) for sensing or imaging, such culture parameters inside microfluidic chips.
15.9. pH Sensors in Food Packaging
The research on intelligent food packaging has seen considerable growth in the last years.1225 In intelligent packaging the main function to maintain the quality of the product for extended period of time is complemented by its ability to indicate the changes in the quality. This is often done with help of integrated indicators and sensors because deterioration of food is accompanied by characteristic changes in chemical parameters. Food spoilage can be indicated by change in the gas composition of the headspace (oxygen, carbon dioxide, ammonia). pH represents another important parameter since spoilage of meat and fish is known to result in the increase of the pH value.1225 For instance, spoilage of pork and beef meat is accompanied by increase of pH from about 5.1–6.1 to 7.2–7.4.1225,1226 Optical sensors are particularly interesting for application in intelligent food packaging due to their ability to operate nondestructively and allow straightforward visualization of changes in the product quality though transparent packaging. Evidently, safety is of utmost importance: the sensors should either not be in contact with food (that is of course not feasible for sensing of pH value) or be nontoxic if contamination with the components of the sensing material may occur. In case of pH sensors for food packaging applications, two main types of materials can be distinguished. The first and largest group of materials relies on absorptiometric indicators and immobilization matrices of natural origin. Typically, these materials are harmless and even edible. Examples of indicators include extracts from blueberries,1227,1228 mulberries,1229 grape skin,341,1230 red cabbage,1231 black carrot,1232 sweet potato,1233,1234 nutmeg,1235 jamun,1235Lycium ruthenicum,1236 and curcumin1237 that originate from food but also plants (litmus,1238 alizarin1239) or even microalgae.1240 These were embedded into gelatin,1237 chitosan,341,1227,1229,1233 starch1228,1234 from different sources, bacterial cellulose,1232 starch-cellulose composites,1239 tamarind seed polysaccharide,1238 tara gum,1230 poly(lactic acid)-poly(ethylene oxide) blends,1240 and κ-carrageenan.1236 One can summarize that (i) these materials are mostly intended for visual indication of food freshness and not for precise pH measurements. Moreover, only some of the immobilized dyes show distinct color response, such as, for example, transition from a red-colored form in the acidic conditions to a green-colored form in the basic;1234 (ii) the choice of indicators often is determined by their local availability. The utilized indicators mostly belong to anthocyanine dyes. These, however, may strongly vary in the absorptiometric response, chemical stability and photostability. For instance, anthocyanins extracted from red cabbage were found to be more stable and photostable than anthocyanins extracted from black beans; (iii) all the indicators are essentially water-soluble and may leach out of the sensor foil.1231 Unfortunately, evaluation of the stability of the sensors in respect to leaching, storage in darkness, and upon exposure to light was not performed in most cases.
Less numerous group of materials represents synthetic dyes covalently embedded into natural matrices using established dye chemistry. These include, for instance, aza-dyes covalently attached to regenerated cellulose1241 or aza-anthraquinone hybrid dyes coupled to a paper support1242 and of course other dyes, such as vinylsulfonyl reactive aza-dyes,17 can be used as well. Common for these materials is very distinct color response and suitability for ratiometric two wavelength read-out, absence of dye leaching and high chemical and photochemical stability of the immobilized indicators. A fluorescent sensor based on SNARF-1 pH indicator should also be mentioned.437 The sensor showed high accuracy of 0.12 pH units and reliably detected fish spoilage via the pH increase; however, the indicator was not covalently embedded into the matrix material.
Application of optical pH sensors in food packaging is not limited to direct measurement of pH value. pH sensors are utilized as transducers in other sensors (see section 15.7 for more details), and these, in turn, can be applied to monitor food freshness. Sensors detecting ammonia and volatile amines1226,1243 that evolve during fish and meat spoilage, as well as carbon dioxide sensors,1244 can be particularly useful.
15.10. Corrosion Studies and Monitoring of pH Values in Concrete
Corrosion is accompanied by local changes of pH values. Walt and co-workers421 demonstrated suitability of an optical pH sensor for monitoring different types of corrosion. They used a fiber-optic array containing a pH sensing material on the distal end of the fiber, which is capable of simultaneous sample visualization and pH imaging.
The pH of concrete is usually between 12.5 and 13 and the most severe concrete damages are associated with dropping of the alkalinity level due several reasons including chloride ingress, carbonation or acid attack.1245 Decrease of pH is associated with corrosion of steel reinforcing elements, which are originally protected by a passivating oxide layer. Since these elements are passivated only at pH values above 9,1246 reliable monitoring of pH in concrete in pH range from pH 9 to 13 is important. Fiber-optic sensors provide unique advantages in being compact and cheap, but the need for the long-term stability of the sensor material is challenging. Several absorptiometric sensors based on immobilized azo-dyes,1247 triphenylmethane dyes1248 and other indicators1246 have been investigated. Dantan and co-workers1246 concluded that among many investigated indicators available for the basic pH range only a few possess the required stability. A functional pH sensor has been configured by using a commercial fiber optic reflectometer and a “sensing chemistry” composed of thymol blue immobilized on Amberlite microbeads and optically isolated with a white layer of TiO2 particles incorporated into a polymer film. The sensor showed good response in the pH 9–12 range and worked for one year as demonstrated for a concrete anchor in a harbor. A fluorescent fiber-optic sensor for pH monitoring in concrete was described.1002 It is based on a fluorescent coumarin indicator covalently embedded into cross-linked polymeric beads. The sensor showed a pKa value of 11.9 and long-term stability, but no measurement in concrete was demonstrated.
In contrast to the fiber-optic sensors suitable for point measurements only, planar optodes allow for 2D mapping of pH distribution on surfaces and, therefore, can provide deeper insights in degradation of such heterogeneous material as concrete. Liu et al.333 demonstrated pH mapping on concrete surfaces with the help of a platinum porpholactone indicator (section 12.1) embedded into poly(vinyl alcohol) along with a surfactant. The sensor with a ratiometric absorptiometric response was read out with a digital camera (Figure 59A). A dually lifetime referenced pH optode (section 2.2.7) uses a hydrogel-immobilized fluorescent aza-BODIPY pH indicator (section 12.1) in combination with a phosphorescent reference dye.997 High-resolution pH imaging on concrete surfaces revealed strong microscale pH variations within the core regions attributed to the heterogenic mineralogy of the concrete specimens (Figure 59B). In later work, the same group extended the dynamic range of the sensor to 6 units (pH 6.5–12.6) by using a mixture of two pH indicators with different pKa values.1249 Also an aza-BODIPY pH indicator was used in a ratiometric approach using a single-lens reflex camera instead of a gated CCD camera.1250 The system was used to characterize the pH of porewater within cracks of self-healing concrete materials. It enabled imaging of pH with a high resolution (50 μm per pixel) and a gradient of 1.4 pH units per 1 mm.
Figure 59.

Examples of pH imaging in concrete samples. (A) Pseudocolor images of pH distribution in cement paste specimens at various degrees of carbonation Adapted from ref (333) with permission from Elsevier. Copyright Elsevier, Ltd., 2017. The sensing composition containing a highly viscous solution of an absorptiometric indicator in a mixture of polymers and surfactants was spread over the concrete surface. (B) pH imaging with a planar optode in concrete specimen previously exposed to accelerated carbonation. (B-A) pH image of the sample recorded with t-DLR imaging technique. (B-B) Photographic image of the concrete surface used for pH imaging. (B-C) Combined image of B-A and B-B including reference pH measurements using a flat surface electrode. Reprinted from ref (997) with permission from Elsevier. Copyright Elsevier Ltd. 2018.
16. Challenges
Notwithstanding the success of the various optical methods for sensing pH values, substantial challenges remain to be solved. These can be classified into two groups, namely, challenges of general nature and challenges of specific nature.
16.1. Challenges of General Nature
The main challenge of all sensors, be they based on the use of indicators or of swellable polymers, is the inherent sensitivity of pH optical sensors to ionic strength (IS). If good accuracy is required, compensation of the effect of ionic strength is indispensable. In case of sensors for blood pH values (which is the largest application in clinical chemistry), an accuracy of ±0.01 pH units is required. Since blood electrolyte concentrations vary a lot and are mainly governed by the concentration of sodium ion, the effect of IS can be adequately compensated for by measurement of the concentration of Na+ (which is wishful anyway) and by correcting pH values for its effect by using proper algorithms. This is a generally applicable method (that may also work for estuary waters) but requires a second if not third sensor. If larger inaccuracies are acceptable, the use of sensors with low sensitivity to IS (as described in previous sections) is recommended. For some reasons, pH sensors based on the use of reversibly protonable/deprotonable (often referred to as swellable) polymers are more sensitive to IS than most indicator based sensors.
Temperature is the second important parameter that affects accuracy. Any sensor for pH values also is a sensor for temperature. If possible, the sample should be thermostated to ±1 °C. If not, one has to be aware of the fact that wrong data may be obtained, or temporal drifts may be encountered even at constant pH values.
In case of small sample volumes, one may face the so-called indicator error. In simplified wording, this term refers to the fact that the indicator itself is a (weak) buffer. The same is true for any (de)protonable (and thus swellable) polymer or conductive polymers. The local charge density of both indicator-based sensor layers or—even more so—of (de)protonable polymers can be high, and if small volumes of unbuffered samples are used, the indicator error results in a biased pH measurement. The effect also can be critical (a) in case of unstirred and viscous samples where diffusion of protons and pH equilibration are slow and (b) in intracellular measurements where sample volumes are quite small. One should be aware of the fact that at pH 7.0 a cell with a typical diameter of 1 μm contains around 30 protons only. By ignoring intracellular buffer capacity, one may state that a substantial fraction of protons will be bound by adding a nanosensor containing only a few transducer molecules.
Indicator-based sensors suffer from leaching unless the indicator is firmly retained. However, excellent methods are known to prevent this. Hence, it is not a major challenge any longer. However, all indicator based sensors (unlike swellable polymer based sensors) also suffer from some bleaching, and this can be problematic if sensors are supposed to work over long time or are optically interrogated in short intervals. Bleaching can only be retarded but not suppressed. Organic dyes are more prone to bleaching than inorganic fluorophores like, for example, many quantum dots. Stabilizers, such as diazabicyclooctane (DABCO) or carotene, that are capable of decomposing singlet oxygen formed by the action of some indicators are useful (see section 9.5). Indicators like fluorescein are hardly useful in sensors because they photobleach rather quickly.
On the other hand, optical sensors based on the use of swellable polymers suffer from other disadvantages. Such polymers usually contain numerous protonable sites, and this makes them particularly sensitive to changes in ionic strength (IS) for two reasons: First, the pKa value of the system changes with IS, depending on whether charges change from cationic to neutral (for example ammonium groups in polyethyleneimine), or from neutral to anionic (such as in polyacrylic acid). Hence, titration plots strongly shift with IS. Secondly, the extent of swelling also depends on IS. In case of sensors based on measurement of refractive index (SPR included), this is a disastrous interference. Unfortunately, most studies on such sensors ignore such potential effects. The same is true for the effect of organic solvents on refractive index (RI), less so on pKa values. For example, ethanol — even if present in fractions of only 0.1% — affects the RI such that it fakes a change in local pH value even if it remains constant. These are major reasons why practically all optical sensors based on the use of swellable polymers are not suited for general purpose pH sensing but limited to highly specific situations. Sensors based on the use of optical indicator probes are much less interfered by sample IS or RI.
Sterilization is an issue that relates to all pH sensors for use in vivo and in biotechnology. No perfect method is known for sterilization but heat treatment (autoclaving) is most common. However, many sensors undergo a change in their calibration plot if exposed to steam of temperatures near 130 °C, which is typical for heat sterilization. Sterilization with ethylene oxide (EO) is not recommended because EO is carcinogenic and also can react with hydroxy groups of indicators. The stability of many published pH indicators to sterilization with β- or γ-radiation is unknown.
If intended for later use, sensors usually are stored in buffers containing azide or thimerosal. This also prevents biofouling. In case of biotechnology, the option for contactless sensing turns out to be a unique feature of optical sensors. The sensor membrane can be placed on the inner wall of the window of a reactor and then interrogated through the window. Sterilization, calibration (with sterile buffers) and optical readout then be performed without the need for displacement of the sensors. The same is true for T-shaped sensors in flow-through cells as shown in Figure 2. A commercially available pH sensor membrane is available that is claimed to be sterilizable without the need for subsequent recalibration and yet retaining high precision and accuracy. However, most sensors described in the literature have not been studied in this respect even if intended for use in medicine or bioprocess monitoring.
16.2. Challenges of Specific Nature
Optical sensors for use in blood and serum work well because samples are well buffered and the effect of ionic strength can be compensated for as described above. Rather, sensors for blood pH values suffer from blood clotting, coating with protein and fouling, the latter two in case of online use. Clotting can be widely eliminated by modifying the surface of sensors with heparin. Proteinous coatings can only be removed by treatment with protease but this implies the need for recalibration and resterilization of sensors. Fouling kills sensors.
Optical sensors for intracellular pH values face numerous limitations that are hardly discussed in depth in recent reviews. It may be stated first that most early measurements of intracellular pH values are biased. This has several reasons: (a) Many studies presented so far report average pH value of cells or tissue, ignoring the fact that pH values inside cells vary from site to site. (b) Most earlier studies using optical molecular probes were performed by calibrating the indicator probe in buffers, and pH values were then calculated from data obtained with cells. These contain proteins and other biomolecules that bind indicator probes and thereby change their pKa values. This introduces a systematic error. It may be reminded here that the level of albumin in urine is determined by adding, to a buffered urine sample, a pH probe whose color changes because it is bound by albumin. Many of these interferences can be compensated by performing an in situ calibration, which, however, is not always feasible. Nanoparticle-based sensing can overcome such deficiencies. However, many challenges have yet to be addressed to demonstrate superiority of nanoparticles for these applications. The first challenge is to make the NPs membrane-permeable. Another challenge results from the need to place sensors at specific sites such as in the cytosol or near mitochondria. If both are to be measured at the same time, differently modified probes have to be used whose signals can be optically differentiated. The same is true if extracellular acidification is to be determined. In the worst case, sensor NPs are placed in both the intracellular and extracellular space (that is, in the interstitial fluid), and then, an average pH value is recorded.
Site-specific sensing in cells is highly desirable but requires site-specific positioning of sensor NPs. If this is accomplished, it is mandatory that ratiometric methods are used because the plain intensity of fluorescence (at a fixed combination of one excitation and one emission wavelength or of bands) not only depends on the local pH value but also on the local concentration of the sensor probe. Some researchers appear not to be aware of this. Various kind of ratiometric methods have been discussed in previous sections, and any of them may be used. High (nm) resolution imaging (nanoscopy) based on methods, such as STED, PALM, or STORM (that work in the fluorometric mode only), also require special fluorescent probes to work best. No systematic study has been presented so far in terms of their uses in sensor NPs. Finally, to become reliable analytical tools, the reported and new nanoparticle-based sensors have yet to be thoroughly characterized in respect to their selectivity, toxicity, and batch-to-batch reproducibility (evidently more critical compared to molecular probes) that so far was not the case in most studies.
Sensing of pH values in the marine environment and in surface waters faces other challenges. Such sensors usually are operated over prolonged periods of time, and (bio)fouling has become a major challenge that still has to be fully overcome. In addition, most plain water samples are weakly buffered if at all. The effects of varying temperature, ionic strength, and heavy metal ions and of contaminants, such as detergents, oil, or lubricants, can be detrimental. No adequate solution has been found so far (which is also true for pH electrodes). Literature does not offer solutions on how to overcome the problem of biofouling in case of continuously operating pH optodes, but methods based on the use of antifouling agents as used for vessels may be an option. Unfortunately, the most efficient of them (out of the tributyltin group) are very toxic for marine organisms and have been banned by law. Other methods (sterilization with UV light or electrochemically generated chlorine) require extra energy and place a risk of accelerated sensor drift due to photobleaching and chemical reaction, respectively.
Sensing of the (quite high) pH values in concrete has other and partially unsolved challenges. The main issue here is long-term functionality. Such sensors are expected to have life spans exceeding 30 years, which is difficult to test and to achieve. Such sensors preferably are prepared from inorganic sensor materials (such as pH-sensing quantum dots), which decompose quite slowly even at high pH values. Recalibration is virtually impossible. Sol–gel coatings deteriorate with time. Bacterial attack and fouling are not an issue, on the other hand, and accuracies of less than ±0.1 pH unit are not required.
Optical fiber sensors are affected by bending effects, and this has to be taken into consideration when using certain configurations. Plastic fibers can become slightly turbid over extended periods of time, which prevents their use, at present, for many long-time applications.
17. Conclusions and Outlook
The past years have seen enormous progress in the design of methods other than electrochemical for sensing pH values. Among those, optical approaches have been most successful and have become dominant. This is the result of two attractive features of optical sensors that go far beyond the potential of electrochemical sensors. The first is imaging, and the second is the option of performing measurements on a nanoscale. The results presented in this Review show the impressive progress that has been made in these two fields. Other single features that make such “opt(r)odes” attractive in certain fields include the inertness to interferences by electromagnetic fields, the option to perform remote measurements with even μm-resolution by using fiber optical waveguides and comparably simple design and competitive price of the sensing materials making them attractive for application in disposable sensors.
Progress in pH sensor technology is driven by progress in mainly four fields, namely, (a) new materials, (b) new spectroscopies, (c) new optoelectronic and microelectronic components, and (d) in data processing. This Review covers the first two. Indirectly, progress is also driven by the need for new pH sensors in fields where classical electrodes cannot be applied easily or not at all. The number of publications on the subject is entangling. One additional aim of this Review is to identify the methods that are best suited for a specific problem. Several kinds of sensors have become commercially available. On the other hand, numerous sensing schemes that are also known from literature are interesting from a scientific viewpoint only but unlikely ever to be used in practice or to result in sensors manufactured on a large scale.
Where are we going to? The problem of sensing pH values of various kinds of surface and marine waters, and of blood or urine is solved, in essence. The limitations encountered at present are not related to sensor performance but to limitations resulting from fouling, deterioration, biocompatibility, and calibration. Many authors claiming excellent performance of any new sensors (“new” in terms of indicators and sensors materials; polymers included) ignore the state of the art of commercially available sensors, some intended for measurement of pH values in general, some for use in highly specific situations. Essential progress or fundamentally new ideas cannot be seen here.12
The main challenges are of a different kind. All the areas listed below are potentially large markets but unfortunately current research does not focus on these in adequate depth. There is a need for (a) sterilizable sensors, (b) self-calibrated sensors, (c) self-referenced sensors, (d) sensors for pH ranges at which electrochemical sensors do not perform well (or at all), for example at pH values of >12 or at high acidities as defined by the Hammett scale, (e) sensors that reliably work at temperatures between 50 and 150 °C, for example for sensing pH values of hot waters under high external pressure (such as in industry and in the deep sea, or in oil drilling), (f) sensors with very long operational lifetime, for instance for monitoring the pH value of concrete at pH values above 10.5 over the whole lifetime of the construction, (g) sensors for measurement of acidity in nonaqueous systems such as in used machine oil (which turns acidic at the end of its lifetime), and (h) fast and disposable sensors for rapid testing of all numerous kinds of food and drinks (such as high-priced wines) which undergo changes in pH value when getting spoiled, to mention a few only and ignoring niche markets. In many cases, it will be desirable to integrate sensors for temperature to compensate for its often strong effects on pH values.
In terms of instrumentation, there is a need for approaches and instruments that are inexpensive. Sensors based on the indicator probes already became more affordable due to the availability of optoelectronic components at low costs, examples being LEDs, laser diodes, photodiodes, and optical filters. This is not the case for other methods such as SERS or SPR at present. Refractive index based sensors, fiber optic systems included, seemingly simple and low-cost, still are too expensive at present to enter the pH sensor market on a large scale. This, however, it not a matter of sensing chemistry but of engineering.
Acknowledgments
Financial support was provided by the Austrian Academy of Science (ÖAW) at the Institute of Analytical Chemistry and Food Chemistry, Graz University of Technology (DOC-Fellowship #24945 of A.S.).
Glossary
List of Abbreviations
- 2P
two photon
- 2λR
two-wavelength ratiometry
- AA
acrylic acid
- AChE
acetylcholinesterase
- AIE
aggregation-induced emission
- ALP
alkaline phosphatase
- AMPMS
aminopropyltrimethoxysilane
- APTS
aminopropyltriethoxysilane
- ATR-FTIR
attenuated total reflection FTIR
- AuNCs
gold nanoclusters
- AuNPs
gold nanoparticles
- aza-BODIPY
BF2-chelated tetraarylazadipyrromethene
- BODIPY
boron-dipyrromethene
- Bs
brightness
- BSA
bovine serum albumin
- BTB
bromothymol blue
- BTPE
2-((E)-2-(pyridin-2-yl)vinyl)benzo[d]thiazole
- CCA
colloidal crystalline array
- CD
carbon dot
- CHFODE
2′-chloro-7′-hexylfluorescein
- CIP
cleaning-in-place
- Cr-GAB
chromium(III)-doped gadolinium aluminum borate
- CTAB
cetyltrimethylammonium bromide
- DABCO
1,4-diazabicyclo-[2.2.2]octane
- DAOTA
diazaoxotriangulenium
- DCC
N,N′-dicyclohexylcarbodiimide
- DCFODE
octadecyl ester of 2′,7′-dichlorofluorescein
- DClFA
2′,7′-dichloro-5(6)-N-octadecyl-carboxamidofluorescein
- Dexter ET
Dexter energy transfer
- DHFODE
2′,7′-dihexylfluorescein
- DHPDS
6,8-dihydroxypyrene-1,3-disulfonic acid
- DLR
dual lifetime referencing
- DNA
DNA
- DPPs
diketopyrrolopyrroles
- ECFP
enhanced cyan fluorescent protein
- EDC
1-ethyl-3-(3-(dimethylamino)propyl)carbodiimide
- ELISA
enzyme-linked immunosorbent assay
- EPR
enhanced permeability and retention effect
- FA
fluoresceinamine
- FBG
fiber Bragg grating
- FIA
flow-injection analysis
- FISH
fluorescence in situ hybridization
- FITC
fluorescein isothiocyanate
- FLIM
fluorescence lifetime imaging
- FRET
Förster resonance energy transfer
- FTIR
Fourier transform IR
- GEFPs
genetically encoded fluorescent proteins
- GFP
green fluorescent proteins
- GM
Goeppert Mayer
- GODs
graphite oxide dots
- GPTMS
3-glycidoxypropyltrimethoxysilane
- HEMA
2-hydroxyethyl methacrylate
- HMS
hollow mesoporous nanoparticles
- HPTS
8-hydroxypyrene-1,3,6-trisulfonic acid
- HSV
hue, saturation, value
- IFE
inner filter effect
- IFS
interferometric sensing
- IOHs
inverse opal photonic crystal hydrogels
- IR
infrared
- IS
ionic strength
- ITO
indium tin oxide
- LB
Langmuir–Blodgett
- LbL
layer-by-layer
- LED
light emitting diode
- LMR
lossy-mode resonance
- LSPR
localized surface plasmon resonance
- MCFODE
2′-monochlorofluorescein
- MLC
metal–ligand complex
- MOF
metal–organic framework
- MRI
magnetic resonance imaging
- MSN
mesoporous silica nanoparticles
- MTEOS
methyltriethoxysilane
- MTMOS
methyltrimethoxysilane
- NFC
near field communication
- NHS
N-hydroxysuccinimide
- NIR
near-infrared
- NP
nanoparticle
- NR
neutral red
- ormosil
organically modified silica
- PAA
poly(acrylic acid)
- PAEMA
poly(aminoethyl methacrylate)
- PAH
polyallylamine
- PALM
photoactivated localization microscopy
- PAM
poly(acrylamide)
- PAMAM
polyamidoamine
- PAMP
polyacryloylmorpholine
- PAN
polyacrylonitrile
- PANI
polyaniline
- PANI@AuNPs
polyaniline and gold nanoparticles
- PB
Prussian Blue
- PCB
polycarboxybetaine
- PD
photodiode
- PDI
perylene diimide
- PDMS
polydimethylsiloxane
- PEBBLEs
probes encapsulated by biologically localized embedding
- PET effect, group, receptor, quenching, etc.
photoinduced electron transfer
- PET foil, support, etc.
poly(ethylene terephthalate)
- PFlPy
alternating oligomer 9,9-dihexylfluorene and pyridine
- PFPDA
copolymer of fluorene and thiophene
- PhC-Fs
photonic crystal fibers
- PhCs
photonic crystals
- pHe
extracellular pH values
- pHEMA
poly(2-hydroxyethyl methacrylate)
- pHi
intracellular pH values
- Ph-TEOS
phenyltriethoxysilane
- Ph-TMOS
phenyltrimethoxysilane
- PIPT
photoinduced proton transfer
- PMMA
poly(methyl methacrylate)
- PPE
poly(2,5-di(3′,7′-dimethyloctyl)phenylene-1,4-ethynylene)
- PPE
polyphenylene-based polymer
- PPMI
poly(N-phenylmaleimides)
- PPyPE
poly(p-pyridinium phenylene ethynylene)
- PrTEOS
propyltriethoxysilane
- PSU
practical salinity units
- PtTFPP
Pt(II) meso-tetrapentafluorophenylporphyrin
- PtTFPPL
Pt(II) meso-tetrapentafluorophenylporphyrinlactone
- PtTPTBPF
platinum(II) meso-tetra(4-fluorophenyl) tetrabenzoporphyrin)
- PVA
poly(vinyl alcohol)
- PVC
poly(vinyl chloride)
- PVP
poly(2-vinylpyridine)
- PWM
pulse width modulation
- QD
quantum dot
- RFID
radio frequency identification
- RGB
red, green, blue
- RI
refractive index
- RLD
rapid lifetime determination
- SERS
surface-enhanced Raman scattering
- SET
surface energy transfer
- SNAFL
seminaphthofluorescein
- SNARF
seminaphthorhodafluor
- SPR
surface plasmon resonance
- STED
stimulated emission depletion microscopy
- STORM
stochastic optical reconstruction microscopy
- T
temperature
- TCSPC
time-correlated single photon counting
- TEOS
tetraethoxysilane
- TGHs
thermogelating hydrogels
- TMOS
tetramethoxysilane
- TTA
2-thenoyltrifluoroacetone
- TTAU
triplet–triplet annihilation based upconversion
- TXH
Texas Red hydrazide
- UCNP
upconverting nanoparticle
- UPMs
unimolecular polymeric micelles
- UV
ultraviolet
- YFP
yellow fluorescent protein
Biographies
Andreas Steinegger studied chemistry at the Graz University of Technology and obtained his diploma in 2016. Currently, he is a PhD student at the Institute of Analytical Chemistry and Food Chemistry, Graz University of Technology within a “DOC” fellowship of the Austrian Academy of Sciences (ÖAW). His research interests include optical chemical sensors, optical thermometry, and indicator synthesis.
Otto S. Wolfbeis was a Full Professor of Analytical and Interface Chemistry at the University of Regensburg, Germany, from 1995–2012. He has authored numerous papers and reviews on optical (fiber) chemical sensors, fluorescent probes, labels, and bioassays, on advanced polymers for use in sensing schemes, on photonic crystals and upconversion particles, and in spectroscopic methods including fluorescence (lifetime) and RGB-based digital imaging. He has (co)edited several books, and acted as the (co)organizer of several conferences related to fluorescence spectroscopy (MAF) and to chemical sensors and biosensors (Europtrode). His current h-index is 107 (June 2020). He was one of the 10 curators of Angewandte Chemie (VCH-Wiley, Weinheim), the Editor-in-chief of Microchimica Acta (Springer-Nature, Vienna), and one of the three founding editors of Methods and Applications in Fluorescence (Inst. Physics Publ., London).
Sergey M. Borisov received his PhD degree in chemistry from Herzen State Pedagogical University (St. Petersburg, Russia) in 2003. From 2004–2006, he was a postdoctoral fellow at the University of Regensburg in the group of Prof. O.S. Wolfbeis. He, then, joined the Institute of Analytical Chemistry and Food Chemistry at the University of Technology in Graz in 2006, where he is currently an associate professor. His research interests are in the chemistry of porphyrins and related systems, synthesis of new luminescent dyes and their application in optical sensing, and in the use of luminescent micro- and nanomaterials in bioanalytical methods.
Supporting Information Available
The Supporting Information is available free of charge at https://pubs.acs.org/doi/10.1021/acs.chemrev.0c00451.
(S1) Examples of pH sensors based on dual-lifetime based referencing; (S2) Absorptiometric pH sensors, their pKa values, polymer matrices, analytical ranges, analytical wavelengths, and the method for immobilization; (S3) Spectral and sensing properties of pH sensors based on luminescent pH probes; (S4) Spectral and sensing properties of pH optodes based on luminescent metal-ligand complexes; (S5) Representative examples of polymers for indicator immobilization; (S6) Overview on pH sensing materials based on conjugated polymers; (S7) Properties of pH nanosensors prepared from various other materials; (S8) Overview on nanosensors based on the use of quantum dots; (S9) Overview on optical pH probes exploring conformational changes in polymers; (S10) Spectral properties of common ratiometric fluorescent pH indicators in aqueous media; (S11) Selected examples of lifetime-based sensors and nanosensors; (S12) Spectral and sensing properties of optical pH sensors based on Förster resonance-energy transfer; (S13) Summary of pH probes based on the use of lanthanide upconversion particles; (S14) Composition and read-out methods of optodes for simultaneous monitoring of pH values and other analytes; (S15) Overview on planar optodes for use in imaging via fluorescence intensity; (S16) Lifetime-based imaging of pH values with planar optodes; (S17) Composition and properties of optical pH sensors for measurements under highly alkaline conditions; (S18) Composition and properties of optical pH sensors for measurements under highly acidic conditions; (S19) Composition and properties of wide dynamic range pH (nano)sensors; (S20) Representative materials for use in pH-sensitive photonic crystals, spectral ranges of optical changes and linear range of their response to pH values; (S21) Overview on optical pH sensors used as transducers in sensors for acidic or basic gases and for ions. (PDF)
Author Contributions
All authors have given approval to the final version of the manuscript.
The authors declare no competing financial interest.
Supplementary Material
References
- Prichard F. E.; Lawn R.; Royal Society of Chemistry (Great Britain) . Measurement of pH: A Practical Handbook; Royal Society of Chemistry: London, 2003. [Google Scholar]
- Wolfbeis O. S.Fiber Optic Chemical Sensors and Biosensors, Vol. 1 and 2; Wolfbeis O. S., Ed.; CRC Press: Boca Raton, FL, 1991. [Google Scholar]
- Wencel D.; Abel T.; McDonagh C. Optical Chemical pH Sensors. Anal. Chem. 2014, 86, 15–29. 10.1021/ac4035168. [DOI] [PubMed] [Google Scholar]
- Shi W.; Li X.; Ma H. Fluorescent Probes and Nanoparticles for Intracellular Sensing of pH Values. Methods Appl. Fluoresc. 2014, 2, 042001 10.1088/2050-6120/2/4/042001. [DOI] [PubMed] [Google Scholar]
- Lian Y.; Zhang W.; Ding L.; Zhang X.; Zhang Y.; Wang X.. Chapter 8: Nanomaterials for Intracellular pH Sensing and Imaging. In Novel Nanomaterials for Biomedical, Environmental and Energy Applications; Wang X., Chen X., Eds.; Elsevier, 2019; pp 241–273. [Google Scholar]
- Shamsipur M.; Barati A.; Nematifar Z. Fluorescent pH Nanosensors: Design Strategies and Applications. J. Photochem. Photobiol., C 2019, 39, 76–141. 10.1016/j.jphotochemrev.2019.03.001. [DOI] [Google Scholar]
- Yimit A.; Rossberg A. G.; Amemiya T.; Itoh K. Thin Film Composite Optical Waveguides for Sensor Applications: A Review. Talanta 2005, 65, 1102–1109. 10.1016/j.talanta.2004.06.045. [DOI] [PubMed] [Google Scholar]
- Wolfbeis O. S.; Dakin J.; Culshaw B.. Optical Fiber Sensors, Vol. IV.; Artech House: Boston, 1997. [Google Scholar]
- Horak E.; Vianello R.; Murković Steinberg I.. Optical Sensing (Nano)Materials Based on Benzimidazole Derivatives. In Chemistry and Applications of Benzimidazole and its Derivatives; Marinescu M., Ed.; IntechOpen, 2019. [Google Scholar]
- Li Z.; Askim J. R.; Suslick K. S. The Optoelectronic Nose: Colorimetric and Fluorometric Sensor Arrays. Chem. Rev. 2019, 119, 231–292. 10.1021/acs.chemrev.8b00226. [DOI] [PubMed] [Google Scholar]
- Cammann K.; Guibault E.; Hall H.; Kellner R.; Wolfbeis O.. Proceedings of the Cambridge Workshop on Chemical Sensors and Biosensors, 1996. [Google Scholar]
- Wolfbeis O.; Editorial S. Probes, Sensors, and Labels: Why Is Real Progress Slow?. Angew. Chem., Int. Ed. 2013, 52, 9864–9865. 10.1002/anie.201305915. [DOI] [PubMed] [Google Scholar]
- Walter B. Dry Reagent Chemistries in Clinical Analysis. Anal. Chem. 1983, 55, 498A–514A. 10.1021/ac00255a001. [DOI] [PubMed] [Google Scholar]
- Free H. M.; Collins G. F.; Free A. H. Triple-Test Strip for Urinary Glucose, Protein, and pH. Clin. Chem. 1960, 6, 352–361. 10.1093/clinchem/6.4.352. [DOI] [PubMed] [Google Scholar]
- Harper G. B. Reusable Glass-Bound pH Indicators. Anal. Chem. 1975, 47, 348–351. 10.1021/ac60352a030. [DOI] [Google Scholar]
- Mohr G. J.; Wolfbeis O. S. Optical Sensors for a Wide pH Range Based on Azo Dyes Immobilized on a Novel Support. Anal. Chim. Acta 1994, 292, 41–48. 10.1016/0003-2670(94)00096-4. [DOI] [Google Scholar]
- Mohr G. J.; Werner T.; Wolfbeis O. S.; Janoschek R. Synthesis of Reactive Vinylsulphonyl Azo Dyes for Application in Optical pH Sensing. Dyes Pigm. 1994, 24, 223–240. 10.1016/0143-7208(94)80011-1. [DOI] [Google Scholar]
- Kubelka V. P.; Munk F. Ein Beitrag Zur Optik Der Farbanstriche. Zeits Techn Phys. 1931, 12, 593–601. [Google Scholar]; A translation of this frequently cited paper to the English (Contribution to the Optics of Paints) can be found at http://opticalbioimaging.sbu.ac.ir/wp-content/uploads/2015/10/kubelka_munk.pdf.
- Kirkbright G. F.; Narayanaswamy R.; Welti N. A. Fibre-Optic pH Probe Based on the Use of an Immobilised Colorimetric Indicator. Analyst 1984, 109, 1025–1028. 10.1039/an9840901025. [DOI] [Google Scholar]
- Edmonds T. E.; Ross I. D. Low-Cost Fibre Optic Chemical Sensors. Anal. Proc. 1985, (22), 206–207. [Google Scholar]
- Grattan K. T. V.; Mouaziz Z.; Palmer A. W. Dual Wavelength Optical Fibre Sensor for pH Measurement. Biosensors 1987, 3, 17–25. 10.1016/0265-928X(87)80010-X. [DOI] [Google Scholar]
- Bacci M.; Baldini F.; Scheggi A. M. Spectrophotometric Investigations on Immobilized Acid-Base Indicators. Anal. Chim. Acta 1988, 207, 343–348. 10.1016/S0003-2670(00)80812-0. [DOI] [Google Scholar]
- Jones T. P.; Porter M. D. Optical pH Sensor Based on the Chemical Modification of a Porous Polymer Film. Anal. Chem. 1988, 60, 404–406. 10.1021/ac00156a006. [DOI] [Google Scholar]
- Saari L. A.; Seitz W. R. pH Sensor Based on Immobilized Fluoresceinamine. Anal. Chem. 1982, 54, 821–823. 10.1021/ac00241a052. [DOI] [Google Scholar]
- Offenbacher H.; Wolfbeis O. S.; Fürlinger E. Fluorescence Optical Sensors for Continuous Determination of Near-Neutral pH Values. Sens. Actuators 1986, 9, 73–84. 10.1016/0250-6874(86)80008-7. [DOI] [Google Scholar]
- Zhujun Z.; Seitz W. R. A Carbon Dioxide Sensor Based on Fluorescence. Anal. Chim. Acta 1984, 160, 305–309. 10.1016/S0003-2670(00)84536-5. [DOI] [Google Scholar]
- Janata J. Do Optical Sensors Really Measure pH?. Anal. Chem. 1987, 59, 1351–1356. 10.1021/ac00136a019. [DOI] [Google Scholar]
- Opitz N.; Lübbers D. New Fluorescence Photometrical Techniques for Simultaneous and Continuous Measurements of Ionic Strength and Hydrogen Ion Activities. Sens. Actuators 1983, 4, 473–479. 10.1016/0250-6874(83)85059-8. [DOI] [Google Scholar]
- Wolfbeis O. S.; Offenbacher H. Fluorescence Sensor for Monitoring Ionic Strength and Physiological pH Values. Sens. Actuators 1986, 9, 85–91. 10.1016/0250-6874(86)80009-9. [DOI] [Google Scholar]
- Wolfbeis O. S.; Rodriguez N. V.; Werner T. LED-Compatible Fluorosensor for Measurement of near-Neutral pH Values. Microchim. Acta 1992, 108, 133–141. 10.1007/BF01242422. [DOI] [Google Scholar]
- Lübbers D.; Opitz N.; Speiser P.; Bisson H. Nanoencapsulated Fluorescence Indicator Molecules Measuring pH and pO2 down to Submicroscopical Regions on the Basis of the Optode-Principle. Z. Naturforsch., C: J. Biosci. 1977, 32, 133–134. 10.1515/znc-1977-1-221. [DOI] [PubMed] [Google Scholar]
- Peterson J. I.; Goldstein S. R.; Fitzgerald R. V.; et al. Fiber Optic pH Probe for Physiological Use. Anal. Chem. 1980, 52, 864–869. 10.1021/ac50056a022. [DOI] [PubMed] [Google Scholar]
- Goldstein S. R.; Peterson J. I.; Fitzgerald R. V. A Miniature Fiber Optic pH Sensor for Physiological Use. J. Biomech. Eng. 1980, 102, 141–146. 10.1115/1.3138210. [DOI] [PubMed] [Google Scholar]
- Tait G. A.; Young R. B.; Wilson G. J.; Steward D. J.; MacGregor D. C. Myocardial pH during Regional Ischemia: Evaluation of a Fiber-Optic Photometric Probe. Am. J. Physiol.-Heart Circ. Physiol. 1982, 243, H1027–H1031. 10.1152/ajpheart.1982.243.6.H1027. [DOI] [PubMed] [Google Scholar]
- Suidan J. S.; Young B. K.; Hetzel F. W.; Seal H. R. pH Measurement with a Fiber-Optic Tissue-pH Monitor and a Standard Blood-pH Meter. Clin. Chem. 1983, 29, 1566–1566. 10.1093/clinchem/29.8.1566. [DOI] [PubMed] [Google Scholar]
- Wolfbeis O. S.; Fürlinger E.; Kroneis H.; Marsoner H. Fluorimetric Analysis. Fresenius' Z. Anal. Chem. 1983, 314, 119–124. 10.1007/BF00482235. [DOI] [Google Scholar]
- Zhujun Z.; Seitz W. R. A Fluorescence Sensor for Quantifying pH in the Range from 6.5 to 8.5. Anal. Chim. Acta 1984, 160, 47–55. 10.1016/S0003-2670(00)84507-9. [DOI] [Google Scholar]
- Goldfinch M. J.; Lowe C. R. Solid-Phase Optoelectronic Sensors for Biochemical Analysis. Anal. Biochem. 1984, 138, 430–436. 10.1016/0003-2697(84)90834-0. [DOI] [PubMed] [Google Scholar]
- Scheggi A. M.; Baldini F. pH Sensing by Fibre Optics. Opt. Acta 1986, 33, 1587–1597. 10.1080/713821908. [DOI] [Google Scholar]
- Woods B. A.; Ruzicka J.; Christian G. D.; Charlson R. J. Measurement of pH in Solutions of Low Buffering Capacity and Low Ionic Strength by Optosensing Flow Injection Analysis. Anal. Chem. 1986, 58, 2496–2502. 10.1021/ac00125a031. [DOI] [Google Scholar]
- Gehrich J. L.; Lubbers D. W.; Opitz N.; Hansmann D. R.; Miller W. W.; Tusa J. K.; Yafuso M. Optical Fluorescence and Its Application to an Intravascular Blood Gas Monitoring System. IEEE Trans. Biomed. Eng. 1986, BME-33 (2), 117–132. 10.1109/TBME.1986.325886. [DOI] [PubMed] [Google Scholar]
- Kawabata Y.; Tsuchida K.; Imasaka T.; Ishibashi N. Fiber-Optic pH Sensor with Monolayer Indicator. Anal. Sci. 1987, 3, 7–9. 10.2116/analsci.3.7. [DOI] [Google Scholar]
- Boisde G.; Perez J. J. Miniature Chemical Optical Fiber Sensors for pH Measurements. Proc. SPIE 1987, 798, 238. 10.1117/12.941112. [DOI] [Google Scholar]
- Jordan D. M.; Walt D. R.; Milanovich F. P. Physiological pH Fiber-Optic Chemical Sensor Based on Energy Transfer. Anal. Chem. 1987, 59, 437–439. 10.1021/ac00130a013. [DOI] [Google Scholar]
- Monici M.; Roniforti R.; Buzziyoli G.; De Rossi B.; Nannini A.. Fibre-Optic pH Sensor for Seawater Monitoring. In Fiber Optic Sensors II; International Society for Optics and Photonics, 1987; Vol. 798, pp 294–301. [Google Scholar]
- Wolfbeis O. S.; Marhold H. A New Group of Fluorescent pH-Indicators for an Extended pH-Range. Fresenius' Z. Anal. Chem. 1987, 327, 347–350. 10.1007/BF00491840. [DOI] [Google Scholar]
- Attridge J. W.; Leaver K. D.; Cozens J. R. Design of a Fibre-Optic pH Sensor with Rapid Response. J. Phys. E: Sci. Instrum. 1987, 20, 548. 10.1088/0022-3735/20/5/016. [DOI] [Google Scholar]
- Knobbe E.; Dunn B.; Gold M. Organic Molecules Entrapped in a Silica Host for Use as Biosensor Probe Materials. Proc. SPIE 1988, 906, 39–41. 10.1117/12.945252. [DOI] [Google Scholar]
- Posch H. E.; Leiner M. J.; Wolfbeis O. S. Towards a Gastric pH-Sensor: An Optrode for the pH 0–7 Range. Fresenius' Z. Anal. Chem. 1989, 334, 162–165. 10.1007/BF00476679. [DOI] [Google Scholar]
- Carey W. P.; DeGrandpre M. D.; Jorgensen B. S. Polymer-Coated Cylindrical Waveguide Absorption Sensor for High Acidities. Anal. Chem. 1989, 61, 1674–1678. 10.1021/ac00190a018. [DOI] [Google Scholar]
- Carey W. P.; Jorgensen B. S. Optical Sensors for High Acidities Based on Fluorescent Polymers. Appl. Spectrosc. 1991, 45, 834–838. 10.1366/0003702914336688. [DOI] [Google Scholar]
- Gabor G.; Walt D. R. Sensitivity Enhancement of Fluorescent pH Indicators by Inner Filter Effects. Anal. Chem. 1991, 63, 793–796. 10.1021/ac00008a011. [DOI] [Google Scholar]
- Tan W.; Shi Z.-Y.; Smith S.; Birnbaum D.; Kopelman R. Submicrometer Intracellular Chemical Optical Fiber Sensors. Science 1992, 258, 778–781. 10.1126/science.1439785. [DOI] [PubMed] [Google Scholar]
- Werner T.; Wolfbeis O. S. Optical Sensor for the pH 10–13 Range Using a New Support Material. Fresenius' J. Anal. Chem. 1993, 346, 564–568. 10.1007/BF00321245. [DOI] [Google Scholar]
- Ge Z.; Brown C. W.; Sun L.; Yang S. C. Fiber-Optic pH Sensor Based on Evanescent Wave Absorption Spectroscopy. Anal. Chem. 1993, 65, 2335–2338. 10.1021/ac00065a028. [DOI] [Google Scholar]
- Parker J. W.; Laksin O.; Yu C.; Lau M. L.; Klima S.; Fisher R.; Scott I.; Atwater B. W. Fiber-Optic Sensors for pH and Carbon Dioxide Using a Self-Referencing Dye. Anal. Chem. 1993, 65, 2329–2334. 10.1021/ac00065a027. [DOI] [Google Scholar]
- McCurley M. F. An Optical Biosensor Using a Fluorescent, Swelling Sensing Element. Biosens. Bioelectron. 1994, 9, 527–533. 10.1016/0956-5663(94)90015-9. [DOI] [Google Scholar]
- Bronk K. S.; Walt D. R. Fabrication of Patterned Sensor Arrays with Aryl Azides on a Polymer-Coated Imaging Optical Fiber Bundle. Anal. Chem. 1994, 66, 3519–3520. 10.1021/ac00092a035. [DOI] [PubMed] [Google Scholar]
- Michie W.; Culshaw B.; McKenzie I.; Konstantakis M.; Graham N.; Moran C.; Santos F.; Bergqvist E.; Carlstrom B. Distributed Sensor for Water and pH Measurements Using Fiber Optics and Swellable Polymeric Systems. Opt. Lett. 1995, 20, 103–105. 10.1364/OL.20.000103. [DOI] [PubMed] [Google Scholar]
- Koncki R.; Mohr G. J.; Wolfbeis O. S. Enzyme Biosensor for Urea Based on a Novel pH Bulk Optode Membrane. Biosens. Bioelectron. 1995, 10, 653–659. 10.1016/0956-5663(95)96955-X. [DOI] [PubMed] [Google Scholar]
- Schulman S. G.; Chen S.; Bai F.; Leiner M. J. P.; Weis L.; Wolfbeis O. S. Dependence of the Fluorescence of Immobilized 1-Hydroxypyrene-3,6,8-Trisulfonate on Solution pH: Extension of the Range of Applicability of a pH Fluorosensor. Anal. Chim. Acta 1995, 304, 165–170. 10.1016/0003-2670(94)00631-U. [DOI] [Google Scholar]
- Zhang Z.; Shakhsher Z.; Seitz W. R. Aminated Polystyrene Membranes for a Fiber Optic pH Sensor Based on Reflectance Changes Accompanying Polymer Swelling. Microchim. Acta 1995, 121, 41–50. 10.1007/BF01248239. [DOI] [Google Scholar]
- Taib M. N.; Andres R.; Narayanaswamy R. Extending the Response Range of an Optical Fibre pH Sensor Using an Artificial Neural Network. Anal. Chim. Acta 1996, 330, 31–40. 10.1016/0003-2670(96)00149-3. [DOI] [Google Scholar]
- de Marcos S.; Wolfbeis O. S. Optical Sensing of pH Based on Polypyrrole Films. Anal. Chim. Acta 1996, 334, 149–153. 10.1016/S0003-2670(96)00290-5. [DOI] [Google Scholar]
- Werner T.; Huber C.; Heinl S.; Kollmannsberger M.; Daub J.; Wolfbeis O. S. Novel Optical pH-Sensor Based on a Boradiaza-Indacene Derivative. Fresenius' J. Anal. Chem. 1997, 359, 150–154. 10.1007/s002160050552. [DOI] [Google Scholar]
- Draxler S.; Lippitsch M. E. pH Sensors Using Fluorescence Decay Time. Sens. Actuators, B 1995, 29, 199–203. 10.1016/0925-4005(95)01683-X. [DOI] [Google Scholar]
- Draxler S.; Lippitsch M. E. Lifetime-Based Sensing: Influence of the Microenvironment. Anal. Chem. 1996, 68, 753–757. 10.1021/ac9507092. [DOI] [PubMed] [Google Scholar]
- Pringsheim E.; Terpetschnig E.; Wolfbeis O. S. Optical Sensing of pH Using Thin Films of Substituted Polyanilines. Anal. Chim. Acta 1997, 357, 247–252. 10.1016/S0003-2670(97)00563-1. [DOI] [Google Scholar]
- Papkovsky D. B.; Ponomarev G. V.; Wolfbeis O. S. Protonation of Porphyrins in Liquid PVC Membranes: Effects of Anionic Additives and Application to pH-Sensing. J. Photochem. Photobiol., A 1997, 104, 151–158. 10.1016/S1010-6030(97)04592-9. [DOI] [Google Scholar]
- Safavi A.; Abdollahi H. Optical Sensor for High pH Values. Anal. Chim. Acta 1998, 367, 167–173. 10.1016/S0003-2670(98)00079-8. [DOI] [Google Scholar]
- Baldini F.; Bechi P.; Bracci S.; Cosi F.; Pucciani F. In Vivo Optical-Fibre pH Sensor for Gastro-Oesophageal Measurements. Sens. Actuators, B 1995, 29, 164–168. 10.1016/0925-4005(95)01678-3. [DOI] [Google Scholar]
- Boisde G.; Perez J. J.. Dispositif d’analyse Des Constituants d’une Solution Par Mesure Photometrique. FR2317638B1, December 16, 1977.
- Perez J.; Boisdé G.; Goujon de B.; Chevalier G.; Isaac M. Automation of Plutonium Spectrophotometry. Analusis 1980, 8, 344–351. [Google Scholar]
- Campbell M.; Yang Y.; Wallace P. A.; HOLMES–SMITH A. S. A Multipoint Quasi-Distributed Optical Fiber pH Sensor.. Opt. Rev. 1997, 4, A111–A113. 10.1007/BF02936006. [DOI] [Google Scholar]
- MIller W. W.; Yafuso M.; Yan C. F.; Hui H.; Arick S. Performance of an In-Vivo, Continuous Blood-Gas Monitor with Disposable Probe. Clin. Chem. 1987, 33, 1538–1542. 10.1093/clinchem/33.9.1538. [DOI] [PubMed] [Google Scholar]
- Weigl B. H.; Holobar A.; Trettnak W.; Klimant I.; Kraus H.; O’Leary P.; Wolfbeis O. S. Optical Triple Sensor for Measuring pH, Oxygen and Carbon Dioxide. J. Biotechnol. 1994, 32, 127–138. 10.1016/0168-1656(94)90175-9. [DOI] [PubMed] [Google Scholar]
- Steemers F. J.; Ferguson J. A.; Walt D. R. Screening Unlabeled DNA Targets with Randomly Ordered Fiber-Optic Gene Arrays. Nat. Biotechnol. 2000, 18, 91–95. 10.1038/72006. [DOI] [PubMed] [Google Scholar]
- Klimant I.; Meyer V.; Kühl M. Fiber-optic Oxygen Microsensors, a New Tool in Aquatic Biology. Limnol. Oceanogr. 1995, 40, 1159–1165. 10.4319/lo.1995.40.6.1159. [DOI] [Google Scholar]
- Wolfbeis O. S.; Weis L. J.; Leiner M. J.; Ziegler W. E. Fiber-Optic Fluorosensor for Oxygen and Carbon Dioxide. Anal. Chem. 1988, 60, 2028–2030. 10.1021/ac00170a009. [DOI] [Google Scholar]
- Leiner M. J. Optical Sensors for in Vitro Blood Gas Analysis. Sens. Actuators, B 1995, 29, 169–173. 10.1016/0925-4005(95)01679-1. [DOI] [Google Scholar]
- Wangbai M.; Zhujun Z.; Seitz W.. R. Poly(Vinyl Alcohol)-Based Indicators for Optical pH and Mg(II) Sensing. In Chemical Sensors and Microinstrumentation; ACS Symposium Series; American Chemical Society, 1989; Vol. 403, pp 273–282. [Google Scholar]
- Ben-David O.; Shafir E.; Gilath I.; Prior Y.; Avnir D. Simple Absorption Optical Fiber pH Sensor Based on Doped Sol–Gel Cladding Material. Chem. Mater. 1997, 9, 2255–2257. 10.1021/cm9703334. [DOI] [Google Scholar]
- MacCraith B. D.; Ruddy V.; Potter C.; O’Kelly B.; McGilp J. F. Optical Waveguide Sensor Using Evanescent Wave Excitation of Fluorescent Dye in Sol-Gel Glass. Electron. Lett. 1991, 27, 1247–1248. 10.1049/el:19910781. [DOI] [Google Scholar]
- Meier B.; Werner T.; Klimant I.; Wolfbeis O. S. Novel Oxygen Sensor Material Based on a Ruthenium Bipyridyl Complex Encapsulated in Zeolite Y: Dramatic Differences in the Efficiency of Luminescence Quenching by Oxygen on Going from Surface-Adsorbed to Zeolite-Encapsulated Fluorophores. Sens. Actuators, B 1995, 29, 240–245. 10.1016/0925-4005(95)01689-9. [DOI] [Google Scholar]
- Schaffar B. B. P.; Wolfbeis O. S.; Lieberman R. A.; Wlodarczyk M. T. New Optical Chemical Sensors Based On The Langmuir-Blodgett Technique. Proc. SPIE (Soc. Photo-instrum. Eng.) 1989, 990, 122. [Google Scholar]
- Seiler K.; Morf W. E.; Rusterholz B.; Simon W. Design and Characterization of a Novel Ammonium Ion Selective Optical Sensor Based on Neutral Ionophores. Anal. Sci. 1989, 5, 557–561. 10.2116/analsci.5.557. [DOI] [Google Scholar]
- Spichiger-Keller U. E.; Seiler K.; Wang K.; Suter G.; Morf W. E.; Simon W. Optical Quantification of Sodium, Potassium, and Calcium Ions in Diluted Human Plasma Based on Ion-Selective Liquid Membranes. Proc. SPIE 1510, Chemical and Medical Sensors 1991, 118–130. [Google Scholar]
- Song A.; Parus S.; Kopelman R. High-Performance Fiber-Optic pH Microsensors for Practical Physiological Measurements Using a Dual-Emission Sensitive Dye. Anal. Chem. 1997, 69, 863–867. 10.1021/ac960917+. [DOI] [PubMed] [Google Scholar]
- Lippitsch M. E.; Pusterhofer J.; Leiner M. J.; Wolfbeis O. S. Fibre-Optic Oxygen Sensor with the Fluorescence Decay Time as the Information Carrier. Anal. Chim. Acta 1988, 205, 1–6. 10.1016/S0003-2670(00)82310-7. [DOI] [Google Scholar]
- Lübbers D.; Opitz N. The pCO2/pO2 Optrode: A New Probe for Measuring pCO2 and pO2 of Gases and Liquids. Z. Naturforsch., C: J. Biosci. 1975, 30, 532–533. 10.1515/znc-1975-7-819. [DOI] [PubMed] [Google Scholar]
- Wolfbeis O. S.; Posch H. E. Fibre-Optic Fluorescing Sensor for Ammonia. Anal. Chim. Acta 1986, 185, 321–327. 10.1016/0003-2670(86)80060-5. [DOI] [Google Scholar]
- Trettnak W.; Leiner M. J.; Wolfbeis O. S. Fibre-Optic Glucose Sensor with a pH Optrode as the Transducer. Biosensors 1989, 4, 15–26. 10.1016/0265-928X(89)80031-8. [DOI] [PubMed] [Google Scholar]
- Kocincová A. S.; Nagl S.; Arain S.; Krause C.; Borisov S. M.; Arnold M.; Wolfbeis O. S. Multiplex Bacterial Growth Monitoring in 24-Well Microplates Using a Dual Optical Sensor for Dissolved Oxygen and pH. Biotechnol. Bioeng. 2008, 100, 430–438. 10.1002/bit.21793. [DOI] [PubMed] [Google Scholar]
- Liebsch G.; Klimant I.; Frank B.; Holst G.; Wolfbeis O. S. Luminescence Lifetime Imaging of Oxygen, pH, and Carbon Dioxide Distribution Using Optical Sensors. Appl. Spectrosc. 2000, 54, 548–559. 10.1366/0003702001949726. [DOI] [Google Scholar]
- Kopelman R.; Tan W.; Shi Z.-Y.. Nanometer Optical Fiber pH Sensor; Lieberman R. A., Ed.; 1993; pp 157–162. [Google Scholar]
- Narayanaswamy R.; Wolfbeis O. S.. Optical Sensors: Industrial, Environmental, and Diagnostic Applications; Springer Series on Chemical Sensors and Biosensors; Springer: Berlin, 2004. [Google Scholar]
- Kostov Y.; Tzonkov S.; Yotova L. Dynamic Model of an Optical Absorption-Based pH Sensor. Analyst 1993, 118, 987–990. 10.1039/an9931800987. [DOI] [Google Scholar]
- Kochmann S.; Hirsch T.; Wolfbeis O. S. The pH Dependence of the Total Fluorescence of Graphite Oxide. J. Fluoresc. 2012, 22, 849–855. 10.1007/s10895-011-1019-8. [DOI] [PubMed] [Google Scholar]
- Han J.; Burgess K. Fluorescent Indicators for Intracellular pH. Chem. Rev. 2010, 110, 2709–2728. 10.1021/cr900249z. [DOI] [PubMed] [Google Scholar]
- Hanson M. A.; Ge X.; Kostov Y.; Brorson K. A.; Moreira A. R.; Rao G. Comparisons of Optical pH and Dissolved Oxygen Sensors with Traditional Electrochemical Probes during Mammalian Cell Culture. Biotechnol. Bioeng. 2007, 97, 833–841. 10.1002/bit.21320. [DOI] [PubMed] [Google Scholar]
- Cox B. G.Acids and Bases: Solvent Effects on Acid-Base Strength; Oxford University Press: Oxford, 2013. [Google Scholar]
- Narayanaswamy R.; Sevilla F. Reflectometric Study of the Acid-Base Quilibria of Indicators Immobilised on a Styrene/Divinylbenzene Copolymer. Anal. Chim. Acta 1986, 189, 365–369. 10.1016/S0003-2670(00)83739-3. [DOI] [Google Scholar]
- Albert A.; Serjeant E. P.; The Determination of Ionization Constants: A Laboratory Manual; 3rd ed.; Springer: Berlin, 2012. [Google Scholar]
- Eistert B.; Merkel E.; Reiss W. Halochromie Und Basizität Enolisierbarer Β-Diketone. Chem. Ber. 1954, 87, 1513–1540. 10.1002/cber.19540871022. [DOI] [Google Scholar]
- Reijenga J. C.; Gagliardi L. G.; Kenndler E. Temperature Dependence of Acidity Constants, a Tool to Affect Separation Selectivity in Capillary Electrophoresis. J. Chromatogr. A 2007, 1155, 142–145. 10.1016/j.chroma.2006.09.084. [DOI] [PubMed] [Google Scholar]
- Rayer A. V.; Sumon K. Z.; Jaffari L.; Henni A. Dissociation Constants (pKa) of Tertiary and Cyclic Amines: Structural and Temperature Dependences. J. Chem. Eng. Data 2014, 59, 3805–3813. 10.1021/je500680q. [DOI] [Google Scholar]
- Hammett L. P.Physical Organic Chemistry Reaction Rates, Equilibria, and Mechanisms; McGraw-Hill: New York, 1970. [Google Scholar]
- Swindlehurst B. R.; Narayanaswamy R.. Optical Sensing of pH in Low Ionic Strength Waters. In Optical Sensors; Springer, 2004; pp 281–308. [Google Scholar]
- Edmonds T. Determination of pH with Acid-Base Indicators: Implications for Optical Fibre Probes. Talanta 1988, 35, 103–107. 10.1016/0039-9140(88)80046-8. [DOI] [PubMed] [Google Scholar]
- Schröder C. R.; Weidgans B. M.; Klimant I. pH Fluorosensors for Use in Marine Systems. Analyst 2005, 130, 907–916. 10.1039/b501306b. [DOI] [PubMed] [Google Scholar]
- Holobar A.; Weigl B. H.; Trettnak W.; Benes̆ R.; Lehmann H.; Rodriguez N. V.; Wollschlager A.; O’Leary P.; Raspor P.; Wolfbeis O. S. Experimental Results on an Optical pH Measurement System for Bioreactors. Sens. Actuators, B 1993, 11, 425–430. 10.1016/0925-4005(93)85283-G. [DOI] [Google Scholar]
- Robert-Baldo G. L.; Morris M. J.; Byrne R. H. Spectrophotometric Determination of Seawater pH Using Phenol Red. Anal. Chem. 1985, 57, 2564–2567. 10.1021/ac00290a030. [DOI] [Google Scholar]
- Bockmon E. E.; Dickson A. G. An Inter-Laboratory Comparison Assessing the Quality of Seawater Carbon Dioxide Measurements. Mar. Chem. 2015, 171, 36–43. 10.1016/j.marchem.2015.02.002. [DOI] [Google Scholar]
- DeGrandpre M. D.; Spaulding R. S.; Newton J. O.; Jaqueth E. J.; Hamblock S. E.; Umansky A. A.; Harris K. E. Considerations for the Measurement of Spectrophotometric pH for Ocean Acidification and Other Studies. Limnol. Oceanogr.: Methods 2014, 12, 830–839. 10.4319/lom.2014.12.830. [DOI] [Google Scholar]
- Clayton T. D.; Byrne R. H. Spectrophotometric Seawater pH Measurements: Total Hydrogen Ion Concentration Scale Calibration of m-Cresol Purple and at-Sea Results. Deep Sea Res., Part I 1993, 40, 2115–2129. 10.1016/0967-0637(93)90048-8. [DOI] [Google Scholar]
- Mosley L. M.; Husheer S. L.; Hunter K. A. Spectrophotometric pH Measurement in Estuaries Using Thymol Blue and M-Cresol Purple. Mar. Chem. 2004, 91, 175–186. 10.1016/j.marchem.2004.06.008. [DOI] [Google Scholar]
- Liu X.; Patsavas M. C.; Byrne R. H. Purification and Characterization of Meta-Cresol Purple for Spectrophotometric Seawater pH Measurements. Environ. Sci. Technol. 2011, 45, 4862–4868. 10.1021/es200665d. [DOI] [PMC free article] [PubMed] [Google Scholar]
- He H.; Mortellaro M. A.; Leiner M. J. P.; Young S. T.; Fraatz R. J.; Tusa J. K. A Fluorescent Chemosensor for Sodium Based on Photoinduced Electron Transfer. Anal. Chem. 2003, 75, 549–555. 10.1021/ac0205107. [DOI] [PubMed] [Google Scholar]
- He H.; Mortellaro M. A.; Leiner M. J. P.; Fraatz R. J.; Tusa J. K. A Fluorescent Sensor with High Selectivity and Sensitivity for Potassium in Water. J. Am. Chem. Soc. 2003, 125, 1468–1469. 10.1021/ja0284761. [DOI] [PubMed] [Google Scholar]
- Clarke J. S.; Achterberg E. P.; Rérolle V. M. C.; Abi Kaed Bey S.; Floquet C. F. A.; Mowlem M. C. Characterisation and Deployment of an Immobilised pH Sensor Spot towards Surface Ocean pH Measurements. Anal. Chim. Acta 2015, 897, 69–80. 10.1016/j.aca.2015.09.026. [DOI] [PubMed] [Google Scholar]
- Weidgans B. M.; Krause C.; Klimant I.; Wolfbeis O. S. Fluorescent pH Sensors with Negligible Sensitivity to Ionic Strength. Analyst 2004, 129, 645–650. 10.1039/b404098h. [DOI] [PubMed] [Google Scholar]
- Aigner D.; Borisov S. M.; Klimant I. New Fluorescent Perylene Bisimide Indicators—a Platform for Broadband pH Optodes. Anal. Bioanal. Chem. 2011, 400, 2475–2485. 10.1007/s00216-010-4647-y. [DOI] [PMC free article] [PubMed] [Google Scholar]
- Aigner D.; Borisov S. M.; Petritsch P.; Klimant I. Novel near Infra-Red Fluorescent pH Sensors Based on 1-Aminoperylene Bisimides Covalently Grafted onto Poly(Acryloylmorpholine). Chem. Commun. 2013, 49, 2139–2141. 10.1039/c3cc39151e. [DOI] [PubMed] [Google Scholar]
- Staudinger C.; Strobl M.; Breininger J.; Klimant I.; Borisov S. M. Fast and Stable Optical pH Sensor Materials for Oceanographic Applications. Sens. Actuators, B 2019, 282, 204–217. 10.1016/j.snb.2018.11.048. [DOI] [Google Scholar]
- Wang X.; Wolfbeis O. S.; Meier R. J. Luminescent Probes and Sensors for Temperature. Chem. Soc. Rev. 2013, 42, 7834–7869. 10.1039/c3cs60102a. [DOI] [PubMed] [Google Scholar]
- Wang X.; Meier R. J.; Wolfbeis O. S. A Fluorophore-Doped Polymer Nanomaterial for Referenced Imaging of pH and Temperature with Sub-Micrometer Resolution. Adv. Funct. Mater. 2012, 22, 4202–4207. 10.1002/adfm.201200813. [DOI] [Google Scholar]
- Wang X.; Meier R. J.; Schmittlein C.; Schreml S.; Schäferling M.; Wolfbeis O. S. A Water-Sprayable, Thermogelating and Biocompatible Polymer Host for Use in Fluorescent Chemical Sensing and Imaging of Oxygen, pH Values and Temperature. Sens. Actuators, B 2015, 221, 37–44. 10.1016/j.snb.2015.05.082. [DOI] [Google Scholar]
- Handbook of Applied Photometry; DeCusatis C., Optical Society of America , Eds.; AIP Press, Optical Society of America: Woodbury, N.Y., 1997. [Google Scholar]
- Yang L.; Kruse B. Revised Kubelka–Munk Theory. I. Theory and Application. J. Opt. Soc. Am. A 2004, 21, 1933–1941. 10.1364/JOSAA.21.001933. [DOI] [PubMed] [Google Scholar]
- Meier R. J.; Fischer L. H.; Wolfbeis O. S.; Schäferling M. Referenced Luminescent Sensing and Imaging with Digital Color Cameras: A Comparative Study. Sens. Actuators, B 2013, 177, 500–506. 10.1016/j.snb.2012.11.041. [DOI] [Google Scholar]
- Principles of Fluorescence Spectroscopy; Lakowicz J. R., Ed.; Springer US: Boston, MA, 2006. [Google Scholar]
- Wang X.; Wolfbeis O. S. Optical Methods for Sensing and Imaging Oxygen: Materials, Spectroscopies and Applications. Chem. Soc. Rev. 2014, 43, 3666–3761. 10.1039/C4CS00039K. [DOI] [PubMed] [Google Scholar]
- Tomasulo M.; Yildiz I.; Raymo F. M. pH-Sensitive Quantum Dots. J. Phys. Chem. B 2006, 110, 3853–3855. 10.1021/jp060185h. [DOI] [PubMed] [Google Scholar]
- de Silva A. P.; Gunaratne H. Q. N.; Habib-Jiwan J.-L.; McCoy C. P.; Rice T. E.; Soumillion J.-P. New Fluorescent Model Compounds for the Study of Photoinduced Electron Transfer: The Influence of a Molecular Electric Field in the Excited State. Angew. Chem., Int. Ed. Engl. 1995, 34, 1728–1731. 10.1002/anie.199517281. [DOI] [Google Scholar]
- Gotor R.; Ashokkumar P.; Hecht M.; Keil K.; Rurack K. Optical pH Sensor Covering the Range from pH 0–14 Compatible with Mobile-Device Readout and Based on a Set of Rationally Designed Indicator Dyes. Anal. Chem. 2017, 89, 8437–8444. 10.1021/acs.analchem.7b01903. [DOI] [PubMed] [Google Scholar]
- Weller A. Electron-Transfer and Complex Formation in the Excited State. Pure Appl. Chem. 1968, 16, 115–124. 10.1351/pac196816010115. [DOI] [Google Scholar]
- Bissell R. A.; de Silva A. P.; Thilak W.; Fernando M.; Patuwathavithana S. T.; Shantha T.; Samarasinghe D. Fluorescent PET (Photoinduced Electron Transfer) Indicators for Solvent Polarity with Quasi-Step Functional Response. Tetrahedron Lett. 1991, 32, 425–428. 10.1016/S0040-4039(00)92645-5. [DOI] [Google Scholar]
- Bissell R. A.; de Silva A. P.; Gunaratne H. Q. N.; Lynch P. L. M.; Maguire G. E. M.; Sandanayake K. R. A. S. Molecular Fluorescent Signalling with ‘Fluor–Spacer–Receptor’ Systems: Approaches to Sensing and Switching Devices via Supramolecular Photophysics. Chem. Soc. Rev. 1992, 21, 187–195. 10.1039/CS9922100187. [DOI] [Google Scholar]
- Daffy L. M.; de Silva A. P.; Gunaratne H. N.; Huber C.; Lynch P. M.; Werner T.; Wolfbeis O. S. Arenedicarboximide Building Blocks for Fluorescent Photoinduced Electron Transfer pH Sensors Applicable with Different Media and Communication Wavelengths. Chem. - Eur. J. 1998, 4, 1810–1815. 10.1002/(SICI)1521-3765(19980904)4:9<1810::AID-CHEM1810>3.0.CO;2-Y. [DOI] [Google Scholar]
- de Silva A. P.; Gunnlaugsson T.; Rice T. E. Recent Evolution of Luminescent Photoinduced Electron Transfer Sensors. A Review. Analyst 1996, 121, 1759–1762. 10.1039/an9962101759. [DOI] [Google Scholar]
- Marín M. J.; Galindo F.; Thomas P.; Russell D. A. Localized Intracellular pH Measurement Using a Ratiometric Photoinduced Electron-Transfer-Based Nanosensor. Angew. Chem., Int. Ed. 2012, 51, 9657–9661. 10.1002/anie.201203866. [DOI] [PubMed] [Google Scholar]
- Klimant I.; Huber C.; Liebsch G.; Neurauter G.; Stangelmayer A.; Wolfbeis O. S.. Dual Lifetime Referencing (DLR)—A New Scheme for Converting Fluorescence Intensity into a Frequency-Domain or Time-Domain Information. In New Trends in Fluorescence Spectroscopy: Applications to Chemical and Life Sciences; Valeur B., Brochon J.-C., Eds.; Springer: Berlin, 2001; pp 257–274. [Google Scholar]
- Liebsch G.; Klimant I.; Krause C.; Wolfbeis O. S. Fluorescent Imaging of pH with Optical Sensors Using Time Domain Dual Lifetime Referencing. Anal. Chem. 2001, 73, 4354–4363. 10.1021/ac0100852. [DOI] [PubMed] [Google Scholar]
- Begemann J.; Spiess A. C. Dual Lifetime Referencing Enables pH-Control for Oxidoreductions in Hydrogel-Stabilized Biphasic Reaction Systems. Biotechnol. J. 2015, 10, 1822–1829. 10.1002/biot.201500198. [DOI] [PubMed] [Google Scholar]
- Schreml S.; Meier R. J.; Wolfbeis O. S.; Landthaler M.; Szeimies R.-M.; Babilas P. 2D Luminescence Imaging of pH in Vivo. Proc. Natl. Acad. Sci. U. S. A. 2011, 108, 2432–2437. 10.1073/pnas.1006945108. [DOI] [PMC free article] [PubMed] [Google Scholar]
- Stahl H.; Glud A.; Schröder C. R.; Klimant I.; Tengberg A.; Glud R. N. Time-Resolved pH Imaging in Marine Sediments with a Luminescent Planar Optode. Limnol. Oceanogr.: Methods 2006, 4, 336–345. 10.4319/lom.2006.4.336. [DOI] [Google Scholar]
- Boniello C.; Mayr T.; Bolivar J. M.; Nidetzky B. Dual-Lifetime Referencing (DLR): A Powerful Method for on-Line Measurement of Internal pH in Carrier-Bound Immobilized Biocatalysts. BMC Biotechnol. 2012, 12, 11 10.1186/1472-6750-12-11. [DOI] [PMC free article] [PubMed] [Google Scholar]
- Poehler E.; Herzog C.; Suendermann M.; Pfeiffer S. A.; Nagl S. Development of Microscopic Time-Domain Dual Lifetime Referencing Luminescence Detection for pH Monitoring in Microfluidic Free-Flow Isoelectric Focusing. Eng. Life Sci. 2015, 15, 276–285. 10.1002/elsc.201400081. [DOI] [Google Scholar]
- Bare W. D.; Mack N. H.; Xu W.; Demas J. N.; DeGraff B. A. Multicomponent Lifetime-Based pH Sensors Utilizing Constant-Lifetime Probes. Anal. Chem. 2002, 74, 2198–2209. 10.1021/ac0110799. [DOI] [PubMed] [Google Scholar]
- Borisov S. M.; Gatterer K.; Klimant I. Red Light-Excitable Dual Lifetime Referenced Optical pH Sensors with Intrinsic Temperature Compensation. Analyst 2010, 135, 1711. 10.1039/c0an00180e. [DOI] [PubMed] [Google Scholar]
- Jokic T.; Borisov S. M.; Saf R.; Nielsen D. A.; Kühl M.; Klimant I. Highly Photostable Near-Infrared Fluorescent pH Indicators and Sensors Based on BF2 -Chelated Tetraarylazadipyrromethene Dyes. Anal. Chem. 2012, 84, 6723–6730. 10.1021/ac3011796. [DOI] [PMC free article] [PubMed] [Google Scholar]
- Aigner D.; Borisov S. M.; Orriach Fernández F. J.; Fernández Sánchez J. F.; Saf R.; Klimant I. New Fluorescent pH Sensors Based on Covalently Linkable PET Rhodamines. Talanta 2012, 99, 194–201. 10.1016/j.talanta.2012.05.039. [DOI] [PMC free article] [PubMed] [Google Scholar]
- Borisov S. M.; Würth C.; Resch-Genger U.; Klimant I. New Life of Ancient Pigments: Application in High-Performance Optical Sensing Materials. Anal. Chem. 2013, 85, 9371–9377. 10.1021/ac402275g. [DOI] [PubMed] [Google Scholar]
- Corres J. M.; Matias I. R.; del Villar I.; Arregui F. J. Design of pH Sensors in Long-Period Fiber Gratings Using Polymeric Nanocoatings. IEEE Sens. J. 2007, 7, 455–463. 10.1109/JSEN.2007.891933. [DOI] [Google Scholar]
- Zamarreño C.; Hernáez M.; Del Villar I.; Matías I.; Arregui F. Optical Fiber pH Sensor Based on Lossy-Mode Resonances by Means of Thin Polymeric Coatings. Sens. Actuators, B 2011, 155, 290–297. 10.1016/j.snb.2010.12.037. [DOI] [Google Scholar]
- Zubiate P.; Zamarreño C.; Del Villar I.; Matias I.; Arregui F. Tunable Optical Fiber pH Sensors Based on TE and TM Lossy Mode Resonances (LMRs). Sens. Actuators, B 2016, 231, 484–490. 10.1016/j.snb.2016.03.024. [DOI] [Google Scholar]
- Suzuki A.; Suzuki H. Hysteretic Behavior and Irreversibility of Polymer Gels by pH Change. J. Chem. Phys. 1995, 103, 4706–4710. 10.1063/1.470608. [DOI] [Google Scholar]
- Richter A.; Paschew G.; Klatt S.; Lienig J.; Arndt K.-F.; Adler H.-J. P. Review on Hydrogel-Based pH Sensors and Microsensors. Sensors 2008, 8, 561–581. 10.3390/s8010561. [DOI] [PMC free article] [PubMed] [Google Scholar]
- Paynter S.; Russell D. A. Surface Plasmon Resonance Measurement of pH-Induced Responses of Immobilized Biomolecules: Conformational Change or Electrostatic Interaction Effects?. Anal. Biochem. 2002, 309, 85–95. 10.1016/S0003-2697(02)00255-5. [DOI] [PubMed] [Google Scholar]
- Yanase Y.; Hiragun T.; Ishii K.; Kawaguchi T.; Yanase T.; Kawai M.; Sakamoto K.; Hide M. Surface Plasmon Resonance for Cell-Based Clinical Diagnosis. Sensors 2014, 14, 4948–4959. 10.3390/s140304948. [DOI] [PMC free article] [PubMed] [Google Scholar]
- Kozlovskaya V.; Kharlampieva E.; Khanal B. P.; Manna P.; Zubarev E. R.; Tsukruk V. V. Ultrathin Layer-by-Layer Hydrogels with Incorporated Gold Nanorods as pH-Sensitive Optical Materials. Chem. Mater. 2008, 20, 7474–7485. 10.1021/cm8023633. [DOI] [Google Scholar]
- Rivero P. J.; Goicoechea J.; Hernaez M.; Socorro A. B.; Matias I. R.; Arregui F. J. Optical Fiber Resonance-Based pH Sensors Using Gold Nanoparticles into Polymeric Layer-by-Layer Coatings. Microsyst. Technol. 2016, 22, 1821–1829. 10.1007/s00542-016-2857-8. [DOI] [Google Scholar]
- Fenzl C.; Hirsch T.; Wolfbeis O. S. Photonic Crystals for Chemical Sensing and Biosensing. Angew. Chem., Int. Ed. 2014, 53, 3318–3335. 10.1002/anie.201307828. [DOI] [PubMed] [Google Scholar]
- Harmon M. E.; Kuckling D.; Frank C. W. Photo-Cross-Linkable PNIPAAm Copolymers. 2. Effects of Constraint on Temperature and pH-Responsive Hydrogel Layers. Macromolecules 2003, 36, 162–172. 10.1021/ma021025g. [DOI] [Google Scholar]
- Shakhsher Z. M.; Odeh I.; Jabr S.; Rudolf Seitz W. An Optical Chemical Sensor Based on Swellable Dicarboxylate Functionalized Polymer Microspheres for pH Copper and Calcium Determination. Microchim. Acta 2004, 144, 147–153. 10.1007/s00604-003-0077-2. [DOI] [Google Scholar]
- Oktar O.; Caglar P.; Seitz W. R. Chemical Modulation of Thermosensitive Poly(N-Isopropylacrylamide) Microsphere Swelling: A New Strategy for Chemical Sensing. Sens. Actuators, B 2005, 104, 179–185. 10.1016/j.snb.2004.04.033. [DOI] [Google Scholar]
- Rooney M. T. V.; Rudolf Seitz W. An Optically Sensitive Membrane for pH Based on Swellable Polymer Microspheres in a Hydrogel. Anal. Commun. 1999, 36, 267–270. 10.1039/a902183c. [DOI] [Google Scholar]
- Müller M.; Kessler B.; Houbenov N.; Bohata K.; Pientka Z.; Brynda E. pH Dependence and Protein Selectivity of Poly (Ethyleneimine)/Poly (Acrylic Acid) Multilayers Studied by in Situ ATR-FTIR Spectroscopy. Biomacromolecules 2006, 7, 1285–1294. 10.1021/bm050631r. [DOI] [PubMed] [Google Scholar]
- Jensen R. A.; Sherin J.; Emory S. R. Single Nanoparticle Based Optical pH Probe. Appl. Spectrosc. 2007, 61, 832–838. 10.1366/000370207781540105. [DOI] [PubMed] [Google Scholar]
- Wang J.; Geng Y.; Shen Y.; Shi W.; Xu W.; Xu S. SERS-Active Fiber Tip for Intracellular and Extracellular pH Sensing in Living Single Cells. Sens. Actuators, B 2019, 290, 527–534. 10.1016/j.snb.2019.03.149. [DOI] [Google Scholar]
- Li Z.; Xia L.; Li G.; Hu Y. Raman Spectroscopic Imaging of pH Values in Cancerous Tissue by Using Polyaniline@gold Nanoparticles. Microchim. Acta 2019, 10.1007/s00604-019-3265-4. [DOI] [PubMed] [Google Scholar]
- Liu X.; Zhang X.; Cong J.; Xu J.; Chen K. Demonstration of Etched Cladding Fiber Bragg Grating-Based Sensors with Hydrogel Coating. Sens. Actuators, B 2003, 96, 468–472. 10.1016/S0925-4005(03)00605-1. [DOI] [Google Scholar]
- Rudolf Seitz W. New Directions in Fiber Optic Chemical Sensors: Sensors Based on Polymer Swelling. J. Mol. Struct. 1993, 292, 105–113. 10.1016/0022-2860(93)80093-B. [DOI] [Google Scholar]
- Zhang Y.; Ji H.; Snow D.; Sterling R.; Brown G. M. A pH Sensor Based on a Microcantilever Coated with Intelligent Hydrogel. Instrum. Sci. Technol. 2004, 32, 361–369. 10.1081/CI-120037668. [DOI] [Google Scholar]
- Bashir R.; Hilt J.; Elibol O.; Gupta A.; Peppas N. Micromechanical Cantilever as an Ultrasensitive pH Microsensor. Appl. Phys. Lett. 2002, 81, 3091–3093. 10.1063/1.1514825. [DOI] [Google Scholar]
- Gerlach G.; Guenther M.; Suchaneck G.; Sorber J.; Arndt K.-F.; Richter A. Application of Sensitive Hydrogels in Chemical and pH Sensors. Macromol. Symp. 2004, 210, 403–410. 10.1002/masy.200450645. [DOI] [Google Scholar]
- Schalkhammer T.; Lobmaier C.; Pittner F.; Leitner A.; Brunner H.; Aussenegg F. The Use of Metal-Island-Coated pH-Sensitive Swelling Polymers for Biosensor Applications. Sens. Actuators, B 1995, 24, 166–172. 10.1016/0925-4005(95)85036-8. [DOI] [Google Scholar]
- Zhang L.; Langmuir M. E.; Bai M.; Seitz W. R. A Sensor for pH Based on an Optical Reflective Device Coupled to the Swelling of an Aminated Polystyrene Membrane. Talanta 1997, 44, 1691–1698. 10.1016/S0039-9140(97)00080-5. [DOI] [PubMed] [Google Scholar]
- Shakhsher Z.; Seitz W. R.; Legg K. D. Single Fiber-Optic pH Sensor Based on Changes in Reflection Accompanying Polymer Swelling. Anal. Chem. 1994, 66, 1731–1735. 10.1021/ac00082a021. [DOI] [PubMed] [Google Scholar]
- Shivananju B. N.; Priydarshi M. Kr.; Roy Mahapatra D.; Hegde G. M.; Asokan S.. pH Sensing =y Single and Multi-Layer Hydrogel Coated Fiber Bragg Grating. In 2012 1st International Symposium on Physics and Technology of Sensors (ISPTS-1); IEEE: Pune, India, 2012; pp 74–78. [Google Scholar]
- Schenato L. A Review of Distributed Fibre Optic Sensors for Geo-Hydrological Applications. Appl. Sci. 2017, 7 (896), 896. 10.3390/app7090896. [DOI] [Google Scholar]
- Wong W. C.; Chan C. C.; Hu P.; Chan J. R.; Low Y. T.; Dong X.; Leong K. C. Miniature pH Optical Fiber Sensor Based on Waist-Enlarged Bitaper and Mode Excitation. Sens. Actuators, B 2014, 191, 579–585. 10.1016/j.snb.2013.10.045. [DOI] [Google Scholar]
- Hu P.; Dong X.; Wong W. C.; Chen L. H.; Ni K.; Chan C. C. Photonic Crystal Fiber Interferometric pH Sensor Based on Polyvinyl Alcohol/Polyacrylic Acid Hydrogel Coating. Appl. Opt. 2015, 54, 2647–2652. 10.1364/AO.54.002647. [DOI] [PubMed] [Google Scholar]
- Chang C.-L.; Ding Z.; Patchigolla V. N.; Ziaie B.; Savran C. A. Reflective Diffraction Gratings from Hydrogels as Biochemical Sensors. IEEE Sens. J. 2012, 12, 2374–2379. 10.1109/JSEN.2012.2189382. [DOI] [Google Scholar]
- Liang X.; Huang H.; Liu W.; et al. Study on Sensitivity Improving of Fiber Bragg Grating Based pH Sensor. Photonic Sens. 2014, 4, 28–33. 10.1007/s13320-013-0124-5. [DOI] [Google Scholar]
- Corres J. M.; Del Villar I.; Matias I. R.; Arregui F. J. Fiber-Optic pH-Sensors in Long-Period Fiber Gratings Using Electrostatic Self-Assembly. Opt. Lett. 2007, 32, 29–31. 10.1364/OL.32.000029. [DOI] [PubMed] [Google Scholar]
- Zheng Y.; Chen L. H.; Dong X.; Yang J.; Long H. Y.; So P. L.; Chan C. C. Miniature pH Optical Fiber Sensor Based on Fabry–Perot Interferometer. IEEE J. Sel. Top. Quantum Electron. 2016, 22, 331–335. 10.1109/JSTQE.2015.2497438. [DOI] [Google Scholar]
- Zhou M.; Dong X.; Ma Q.; Chan C. C.. Miniature pH Sensor Based on Thin-Core Fiber Mach-Zehnder Interferometer. In 2017 16th International Conference on Optical Communications and Networks (ICOCN); IEEE: Wuzhen, 2017; pp 1–3. [Google Scholar]
- Tou Z. Q.; Chan C. C.; Hong J.; Png S.; Eddie K. M. T.; Tan T. A. H. Double-Pass Mach–Zehnder Fiber Interferometer pH Sensor. J. Biomed. Opt. 2014, 19, 047002 10.1117/1.JBO.19.4.047002. [DOI] [PubMed] [Google Scholar]
- Lei M.; Zhang Y.-N.; Han B.; Zhao Q.; Zhang A.; Fu D. In-Line Mach–Zehnder Interferometer and FBG with Smart Hydrogel for Simultaneous pH and Temperature Detection. IEEE Sens. J. 2018, 18, 7499–7504. 10.1109/JSEN.2018.2862426. [DOI] [Google Scholar]
- Mohammed A. Z. Photonic Crystal Fiber Mach-Zehnder Interferometer pH Sensing. AIP Conf. Proc. 2018, 2045, 020010 10.1063/1.5080823. [DOI] [Google Scholar]
- Arregui F. J.A Ph Sensor Made Using Cellulosic Coating on a Biconically Tapered Singlemode Optical Fiber. In Fourteenth International Conference on Optical Fiber Sensors; Mignani A. G., Lefèvre H. C., Eds.; SPIE: Venice, Italy, 2000; p 90. [Google Scholar]
- Zamarreño C.; Goicoechea J.; Matias I.; Arregui F. Laterally Selective Adsorption of pH Sensing Coatings Based on Neutral Red by Means of the Electric Field Directed Layer-by-Layer Self Assembly Method. Thin Solid Films 2009, 517, 3776–3780. 10.1016/j.tsf.2008.12.055. [DOI] [Google Scholar]
- Arregui F. J.; Otano M.; Fernandez-Valdivielso C.; Matias I. R. An Experimental Study about the Utilization of Liquicoat® Solutions for the Fabrication of pH Optical Fiber Sensors. Sens. Actuators, B 2002, 87, 289–295. 10.1016/S0925-4005(02)00248-4. [DOI] [Google Scholar]
- Zamarreño C. R.; Bravo J.; Goicoechea J.; Matias I.; Arregui F. Response Time Enhancement of pH Sensing Films by Means of Hydrophilic Nanostructured Coatings. Sens. Actuators, B 2007, 128, 138–144. 10.1016/j.snb.2007.05.046. [DOI] [Google Scholar]
- Bishop E.Indicators, 1st ed.; International Series of Monographs in Analytical Chemistry, Vol. 51; Pergamon Press: Oxford, NY, 1972. [Google Scholar]
- Sabnis R. W.Handbook of Acid-Base Indicators; CRC Press: Boca Raton, 2008. [Google Scholar]
- Kolthoff I. M.; Rosenblum C.. Acid-Base Indicators; Lancaster Press, Inc.: Lancaster, PA, 2011. [Google Scholar]
- Sabnis R. W.; Ross E.; Köthe J.; Naumann R.; Fischer W.; Mayer W.-D.; Wieland G.; Newman E. J.; Wilson C. M.. Indicator Reagents. In Ullmann’s Encyclopedia of Industrial Chemistry; Wiley-VCH Verlag GmbH & Co., KGaA: Weinheim, Germany, 2009. [Google Scholar]
- Dictionary of Analytical Reagents; Springer US: Boston, MA, 1993. [Google Scholar]
- Allain L. R.; Xue Z. Optical Sensors for the Determination of Concentrated Hydroxide. Anal. Chem. 2000, 72, 1078–1083. 10.1021/ac990908b. [DOI] [PubMed] [Google Scholar]
- Canada T. A.; Beach D. B.; Xue Z.-L. Optical Sensors for the Determination of Concentrated Hydroxide. Characterization of the Sensor Materials and Evaluation of the Sensor Performance. Anal. Chem. 2005, 77, 2842–2851. 10.1021/ac0485839. [DOI] [PubMed] [Google Scholar]
- Ensafi A. A.; Kazemzadeh A. Optical pH Sensor Based On Chemical Modification of Polymer Film. Microchem. J. 1999, 63, 381–388. 10.1006/mchj.1999.1757. [DOI] [Google Scholar]
- Rouhani S.; Salimi S.; Haghbeen K. Development of Optical pH Sensors Based on Derivatives of Hydroxyazobenzene, and the Extended Linear Dynamic Range Using Mixture of Dyes. Dyes Pigm. 2008, 77, 363–368. 10.1016/j.dyepig.2007.06.010. [DOI] [Google Scholar]
- Cardwell T. J.; Cattrall R. W.; Deady L. W.; Dorkos M.; O’Connell G. R. A Fast Response Membrane-Based pH Indicator Optode. Talanta 1993, 40, 765–768. 10.1016/0039-9140(93)80293-Z. [DOI] [PubMed] [Google Scholar]
- Wolthuis R.; McCrae D.; Saaski E.; Hartl J.; Mitchell G. Development of a Medical Fiber-Optic pH Sensor Based on Optical Absorption. IEEE Trans. Biomed. Eng. 1992, 39, 531–537. 10.1109/10.135548. [DOI] [PubMed] [Google Scholar]
- Makedonski P.; Brandes M.; Grahn W.; Kowalsky W.; Wichern J.; Wiese S.; Johannes H.-H. Synthesis of New Kinds of Reactive Azo Dyes and Their Application for Fibre-Optical pH-Measurements. Dyes Pigm. 2004, 61, 109–119. 10.1016/j.dyepig.2003.10.005. [DOI] [Google Scholar]
- Grahn W.; Makedonski P.; Wichern J.; Kowalsky W.; Wiese S. Fiber Optic Sensors for an In-Situ Monitoring of Moisture and pH Value in Reinforced Concrete. Proc. SPIE 2001, 4480, 395–404. 10.1117/12.453362. [DOI] [Google Scholar]
- Trupp S.; Alberti M.; Carofiglio T.; Lubian E.; Lehmann H.; Heuermann R.; Yacoub-George E.; Bock K.; Mohr G. J. Development of pH-Sensitive Indicator Dyes for the Preparation of Micro-Patterned Optical Sensor Layers. Sens. Actuators, B 2010, 150, 206–210. 10.1016/j.snb.2010.07.015. [DOI] [Google Scholar]
- Egawa Y.; Hayashida R.; Anzai J. Multilayered Assemblies Composed of Brilliant Yellow and Poly (Allylamine) for an Optical pH Sensor. Anal. Sci. 2006, 22, 1117–1119. 10.2116/analsci.22.1117. [DOI] [PubMed] [Google Scholar]
- Raoufi N.; Surre F.; Sun T.; Rajarajan M.; Grattan K. T. V. Wavelength Dependent pH Optical Sensor Using the Layer-by-Layer Technique. Sens. Actuators, B 2012, 169, 374–381. 10.1016/j.snb.2012.05.024. [DOI] [Google Scholar]
- Sansubrino A.; Mascini M. Development of an Optical Fibre Sensor for Ammonia, Urea, Urease and IgG. Biosens. Bioelectron. 1994, 9, 207–216. 10.1016/0956-5663(94)80123-1. [DOI] [PubMed] [Google Scholar]
- Wróblewski W.; Roźniecka E.; Dybko A.; Brzózka Z. Cellulose Based Bulk pH Optomembranes. Sens. Actuators, B 1998, 48, 471–475. 10.1016/S0925-4005(98)00087-2. [DOI] [Google Scholar]
- Hashemi P.; Abolghasemi M. M. Preparation of a Novel Optical Sensor for Low pH Values Using Agarose Membranes as Support. Sens. Actuators, B 2006, 115, 49–53. 10.1016/j.snb.2005.08.046. [DOI] [Google Scholar]
- Salmani G K M.; Rounaghi G. H.; Chamsaz M. An Optical Sensor for Determination of Low pH Values Based on Covalent Immobilization of Congo Red on Triacetyl Cellulose Films via Epichlorohydrin. Sens. Actuators, B 2018, 254, 177–181. 10.1016/j.snb.2017.07.027. [DOI] [Google Scholar]
- Dybko A.; Wróblewski W.; Maciejewski J.; Romaniuk R.; Brzózka Z. Efficient Reagent Immobilization Procedure for Ion-Sensitive Optomembranes. Sens. Actuators, B 1997, 39, 207–211. 10.1016/S0925-4005(97)80205-5. [DOI] [Google Scholar]
- Hisamoto H.; Tsubuku M.; Enomoto T.; Watanabe K.; Kawaguchi H.; Koike Y.; Suzuki K. Theory and Practice of Rapid Flow-through Analysis Based on Optode Detection and Its Application to pH Measurement as a Model Case. Anal. Chem. 1996, 68, 3871–3878. 10.1021/ac951149+. [DOI] [PubMed] [Google Scholar]
- Kostov Y.; Tzonkov S.; Yotova L.; Krysteva M. Membranes for Optical pH Sensors. Anal. Chim. Acta 1993, 280, 15–19. 10.1016/0003-2670(93)80235-D. [DOI] [Google Scholar]
- Ganesh A. B.; Radhakrishnan T. K. Fiber-Optic pH Sensor. Fiber Integr. Opt. 2006, 25, 403–409. 10.1080/01468030600914592. [DOI] [Google Scholar]
- Ganesh A. B.; Radhakrishnan T. K. Fiber-Optic Sensors for the Estimation of pH within Natural Biofilms on Metals. Sens. Actuators, B 2007, 123, 1107–1112. 10.1016/j.snb.2006.11.027. [DOI] [Google Scholar]
- Liu J. N.; Shahriari M. R.; Sigel G. H. Development of a Porous Polymer pH Optrode. Opt. Lett. 1992, 17, 1815–1817. 10.1364/OL.17.001815. [DOI] [PubMed] [Google Scholar]
- Bacci M.; Baldini F.; Bracci S. Spectroscopic Behavior of Acid-Base Indicators after Immobilization on Glass Supports. Appl. Spectrosc. 1991, 45, 1508–1515. 10.1366/0003702914335472. [DOI] [Google Scholar]
- Mimms L. T.; McKnight M. A.; Murray R. W. Spectrophotometric Study of Coverage and Acid-Base Equilibrium of a Chemically Bonded Base. Anal. Chim. Acta 1977, 89, 355–361. 10.1016/S0003-2670(01)84732-2. [DOI] [Google Scholar]
- Wong L. S.; Bradley M. Immobilisation and Assessment of Aniline Dyes for Non-Fluorescent pH Sensing Applications. Tetrahedron Lett. 2005, 46, 5731–5734. 10.1016/j.tetlet.2005.06.081. [DOI] [Google Scholar]
- Li G.; Xiao J.; Zhang W. A Novel Dual Colorimetric Fiber Based on Two Acid–Base Indicators. Dyes Pigm. 2012, 92, 1091–1099. 10.1016/j.dyepig.2011.08.015. [DOI] [Google Scholar]
- Rottman C.; Ottolenghi M.; Zusman R.; Lev O.; Smith M.; Gong G.; Kagan M. L.; Avnir D. Doped Sol-Gel Glasses as pH Sensors. Mater. Lett. 1992, 13, 293–298. 10.1016/0167-577X(92)90055-O. [DOI] [Google Scholar]
- García-Heras M.; Gil C.; Carmona N.; Faber J.; Kromka K.; Villegas M. A. Optical Behaviour of pH Detectors Based on Sol–Gel Technology. Anal. Chim. Acta 2005, 540, 147–152. 10.1016/j.aca.2004.09.031. [DOI] [Google Scholar]
- Rottman C.; Turniansky A.; Avnir D. Sol-Gel Physical and Covalent Entrapment of Three Methyl Red Indicators: A Comparative Study. J. Sol-Gel Sci. Technol. 1998, 13, 17–25. 10.1023/A:1008630701220. [DOI] [Google Scholar]
- Van der Schueren L.; De Meyer T.; Steyaert I.; Ceylan Ö.; Hemelsoet K.; Van Speybroeck V.; De Clerck K. Polycaprolactone and Polycaprolactone/Chitosan Nanofibres Functionalised with the pH-Sensitive Dye Nitrazine Yellow. Carbohydr. Polym. 2013, 91, 284–293. 10.1016/j.carbpol.2012.08.003. [DOI] [PubMed] [Google Scholar]
- Van der Schueren L.; Hemelsoet K.; Van Speybroeck V.; De Clerck K. The Influence of a Polyamide Matrix on the Halochromic Behaviour of the pH-Sensitive Azo Dye Nitrazine Yellow. Dyes Pigm. 2012, 94, 443–451. 10.1016/j.dyepig.2012.02.013. [DOI] [Google Scholar]
- Sakurai T.; Kurata S.; Ogino K. Development of a Novel Optical Sensing Method for Acid Solution Using Oil Red O Supported by Florisil. Anal. Sci. 2015, 31, 51–54. 10.2116/analsci.31.51. [DOI] [PubMed] [Google Scholar]
- Capel-Cuevas S.; Cuéllar M. P.; de Orbe-Payá I.; Pegalajar M. C.; Capitán-Vallvey L. F. Full-Range Optical pH Sensor Based on Imaging Techniques. Anal. Chim. Acta 2010, 681, 71–81. 10.1016/j.aca.2010.09.033. [DOI] [PubMed] [Google Scholar]
- Capel-Cuevas S.; Cuéllar M. P.; de Orbe-Payá I.; Pegalajar M. C.; Capitán-Vallvey L. F. Full-Range Optical pH Sensor Array Based on Neural Networks. Microchem. J. 2011, 97, 225–233. 10.1016/j.microc.2010.09.008. [DOI] [Google Scholar]
- Martinez-Olmos A.; Capel-Cuevas S.; López-Ruiz N.; Palma A. J.; de Orbe I.; Capitán-Vallvey L. F. Sensor Array-Based Optical Portable Instrument for Determination of pH. Sens. Actuators, B 2011, 156, 840–848. 10.1016/j.snb.2011.02.052. [DOI] [Google Scholar]
- Wong L. S.; Brocklesby W. S.; Bradley M. Fibre Optic pH Sensors Employing Tethered Non-Fluorescent Indicators on Macroporous Glass. Sens. Actuators, B 2005, 107, 957–962. 10.1016/j.snb.2004.11.040. [DOI] [Google Scholar]
- Safavi A.; Banazadeh A. R. Dynamic Method as a Simple Approach for Wide Range pH Measurements Using Optodes. Anal. Chim. Acta 2007, 583, 326–331. 10.1016/j.aca.2006.10.063. [DOI] [PubMed] [Google Scholar]
- Mohr G. J.; Müller H. Tailoring Colour Changes of Optical Sensor Materials by Combining Indicator and Inert Dyes and Their Use in Sensor Layers, Textiles and Non-Wovens. Sens. Actuators, B 2015, 206, 788–793. 10.1016/j.snb.2014.09.104. [DOI] [Google Scholar]
- Mohr G. J.; Müller H.; Bussemer B.; Stark A.; Carofiglio T.; Trupp S.; Heuermann R.; Henkel T.; Escudero D.; González L. Design of Acidochromic Dyes for Facile Preparation of pH Sensor Layers. Anal. Bioanal. Chem. 2008, 392, 1411–1418. 10.1007/s00216-008-2428-7. [DOI] [PubMed] [Google Scholar]
- Carofiglio T.; Fregonese C.; Mohr G. J.; Rastrelli F.; Tonellato U. Optical Sensor Arrays: One-Pot, Multiparallel Synthesis and Cellulose Immobilization of pH and Metal Ion Sensitive Azo-Dyes. Tetrahedron 2006, 62, 1502–1507. 10.1016/j.tet.2005.11.016. [DOI] [Google Scholar]
- Liu Z.; Liu J.; Chen T. Facile Synthesis, Characterization, and Potential Applications of Two Kinds of Polymeric pH Indicators: Phenolphthalein Formaldehyde Ando-Cresolphthalein Formaldehyde. J. Polym. Sci., Part A: Polym. Chem. 2005, 43, 1019–1027. 10.1002/pola.20576. [DOI] [Google Scholar]
- Agarwal A.; Raheja A.; Natarajan T. S.; Chandra T. S. Development of Universal pH Sensing Electrospun Nanofibers. Sens. Actuators, B 2012, 161, 1097–1101. 10.1016/j.snb.2011.12.027. [DOI] [Google Scholar]
- Zhang L.; Li Z.; Chang R.; Chen Y.; Zhang W. Synthesis and Characterization of Novel Phenolphthalein Immobilized Halochromic Fiber. React. Funct. Polym. 2009, 69, 234–239. 10.1016/j.reactfunctpolym.2009.01.001. [DOI] [Google Scholar]
- Zhang C.; Li Y.; Wang W.; Zhan N.; Xiao N.; Wang S.; Li Y.; Yang Q. A Novel Two-Nozzle Electrospinning Process for Preparing Microfiber Reinforced pH-Sensitive Nano-Membrane with Enhanced Mechanical Property. Eur. Polym. J. 2011, 47, 2228–2233. 10.1016/j.eurpolymj.2011.09.015. [DOI] [Google Scholar]
- Liu Z.; Luo F.; Chen T. Phenolphthalein Immobilized Membrane for an Optical pH Sensor. Anal. Chim. Acta 2004, 510, 189–194. 10.1016/j.aca.2004.01.019. [DOI] [Google Scholar]
- Kirkbright G. F.; Narayanaswamy R.; Welti N. A. Studies with Immobilised Chemical Reagents Using a Flow-Cell for the Development of Chemically Sensitive Fibre-Optic Devices. Analyst 1984, 109, 15. 10.1039/an9840900015. [DOI] [Google Scholar]
- Islam S.; Rahman R. A.; Othaman Z. B.; Riaz S.; Naseem S. Synthesis and Characterization of Multilayered Sol–Gel Based Plastic-Clad Fiber Optic pH Sensor. J. Ind. Eng. Chem. 2015, 23, 140–144. 10.1016/j.jiec.2014.08.007. [DOI] [Google Scholar]
- Islam S.; Bidin N.; Riaz S.; Rahman R. A.; Naseem S.; Marsin F. M. Mesoporous SiO2 – TiO2 Nanocomposite for pH Sensing. Sens. Actuators, B 2015, 221, 993–1002. 10.1016/j.snb.2015.06.095. [DOI] [Google Scholar]
- Islam S.; Bidin N.; Riaz S.; Naseem S.; Marsin F. M. Correlation between Structural and Optical Properties of Surfactant Assisted Sol–Gel Based Mesoporous SiO2–TiO2 Hybrid Nanoparticles for pH Sensing/Optochemical Sensor. Sens. Actuators, B 2016, 225, 66–73. 10.1016/j.snb.2015.11.016. [DOI] [Google Scholar]
- Islam S.; Bidin N.; Riaz S.; Naseem S. Sol–Gel Based Phenolphthalein Encapsulated Heterogeneous Silica–Titania Optochemical pH Nanosensor. J. Ind. Eng. Chem. 2016, 34, 258–268. 10.1016/j.jiec.2015.11.022. [DOI] [Google Scholar]
- Islam S.; Bidin N.; Riaz S.; Naseem S. Self-Assembled Hierarchical Phenolphthalein Encapsulated Silica Nanoparticles: Structural, Optical and Sensing Response. Sens. Actuators, A 2017, 266, 111–121. 10.1016/j.sna.2017.09.020. [DOI] [Google Scholar]
- Wong L. S.; Birembaut F.; Brocklesby W. S.; Frey J. G.; Bradley M. Resin Bead Micro-UV–Visible Absorption Spectroscopy. Anal. Chem. 2005, 77, 2247–2251. 10.1021/ac049319i. [DOI] [PubMed] [Google Scholar]
- Allain L. R.; Canada T. A.; Xue Z. Optical Sensors and the Salt Effect: A Dual-Transducer Approach to Acidity Determination in a Salt-Containing Concentrated Strong Acid. Anal. Chem. 2001, 73, 4592–4598. 10.1021/ac010166y. [DOI] [PubMed] [Google Scholar]
- Motellier S.; Michels M. H.; Duréault B.; Toulhoat P. Fiber-Optic pH Sensor for in Situ Applications. Sens. Actuators, B 1993, 11, 467–473. 10.1016/0925-4005(93)85289-M. [DOI] [Google Scholar]
- Ismail F.; Malins C.; Goddard N. J. Alkali Treatment of Dye-Doped Sol–Gel Glass Films for Rapid Optical pH Sensing. Analyst 2002, 127, 253–257. 10.1039/b108370h. [DOI] [Google Scholar]
- Wu S.; Cheng W.; Qiu Y.; Li Z.; Shuang S.; Dong C. Fiber Optic pH Sensor Based on Mode-Filtered Light Detection. Sens. Actuators, B 2010, 144, 255–259. 10.1016/j.snb.2009.10.058. [DOI] [Google Scholar]
- Makote R.; Collinson M. M. Organically Modified Silicate Films for Stable pH Sensors. Anal. Chim. Acta 1999, 394, 195–200. 10.1016/S0003-2670(99)00305-0. [DOI] [Google Scholar]
- Lin J.; Liu D. An Optical pH Sensor with a Linear Response over a Broad Range. Anal. Chim. Acta 2000, 408, 49–55. 10.1016/S0003-2670(99)00840-5. [DOI] [Google Scholar]
- Zaggout F. R. Encapsulation of Bromocresol Green pH Indicator into a Sol-Gel Matrix. J. Dispersion Sci. Technol. 2005, 26, 757–761. 10.1081/DIS-200063087. [DOI] [Google Scholar]
- Canada T. A.; Allain L. R.; Beach D. B.; Xue Z. High-Acidity Determination in Salt-Containing Acids by Optical Sensors. The Scope of a Dual-Transducer Approach and the Hammett Acidity Function. Anal. Chem. 2002, 74, 2535–2540. 10.1021/ac0200623. [DOI] [PubMed] [Google Scholar]
- Lee S. T.; Gin J.; Nampoori V. P. N.; Vallabhan C. P. G.; Unnikrishnan N. V.; Radhakrishnan P. A Sensitive Fibre Optic pH Sensor Using Multiple Sol-Gel Coatings. J. Opt. A: Pure Appl. Opt. 2001, 3, 355–359. 10.1088/1464-4258/3/5/307. [DOI] [Google Scholar]
- Ding J. Y.; Shahriari M. R.; Sigel G. H. Fibre Optic pH Sensors Prepared by Sol-Gel Immobilisation Technique. Electron. Lett. 1991, 27, 1560–1562. 10.1049/el:19910978. [DOI] [Google Scholar]
- Thomas Lee S.; Aneeshkumar B.; Radhakrishnan P.; Vallabhan C.P.G.; Nampoori V.P.N. A Microbent Fiber Optic pH Sensor. Opt. Commun. 2002, 205, 253–256. 10.1016/S0030-4018(02)01406-2. [DOI] [Google Scholar]
- Noroozifar M.; Motlagh M. K.; Bahmanzadeh S.; Boroon S. A Novel Optical Membrane with Extended Detection Range of pH. Turk. J. Chem. 2010, 34, 719–730. [Google Scholar]
- Kowada Y.; Ozeki T.; Minami T. Preparation of Silica-Gel Film with pH Indicators by the Sol-Gel Method. J. Sol-Gel Sci. Technol. 2005, 33, 175–185. 10.1007/s10971-005-5612-7. [DOI] [Google Scholar]
- Motellier S.; Toulhoat P. Modified Acid-Base Behaviour of Resin-Bound pH Indicators. Anal. Chim. Acta 1993, 271, 323–329. 10.1016/0003-2670(93)80062-P. [DOI] [Google Scholar]
- Yang L.; Saavedra S. S. Chemical Sensing Using Sol-Gel Derived Planar Waveguides and Indicator Phases. Anal. Chem. 1995, 67, 1307–1314. 10.1021/ac00104a002. [DOI] [Google Scholar]
- Allain L. R.; Sorasaenee K.; Xue Z. Doped Thin-Film Sensors via a Sol–Gel Process for High-Acidity Determination. Anal. Chem. 1997, 69, 3076–3080. 10.1021/ac970258g. [DOI] [PubMed] [Google Scholar]
- Andreou V. G.; Clonis Y. D. A Portable Fiber-Optic Pesticide Biosensor Based on Immobilized Cholinesterase and Sol–Gel Entrapped Bromcresol Purple for in-Field Use. Biosens. Bioelectron. 2002, 17, 61–69. 10.1016/S0956-5663(01)00261-5. [DOI] [PubMed] [Google Scholar]
- El-Ashgar N. M.; El-Basioni A. I.; El-Nahhal I. M.; Zourob S. M.; El-Agez T. M.; Taya S. A. Sol-Gel Thin Films Immobilized with Bromocresol Purple pH-Sensitive Indicator in Presence of Surfactants. ISRN Anal. Chem. 2012, 2012, 1–11. 10.5402/2012/604389. [DOI] [Google Scholar]
- Polerecky L.; Burke C. S.; MacCraith B. D. Optimization of Absorption-Based Optical Chemical Sensors That Employ a Single-Reflection Configuration. Appl. Opt. 2002, 41, 2879–2887. 10.1364/AO.41.002879. [DOI] [PubMed] [Google Scholar]
- Burke C. S.; Polerecky L.; MacCraith B. D. Design and Fabrication of Enhanced Polymer Waveguide Platforms for Absorption-Based Optical Chemical Sensors. Meas. Sci. Technol. 2004, 15, 1140–1145. 10.1088/0957-0233/15/6/014. [DOI] [Google Scholar]
- Butler T. M.; MacCraith B. D.; McDonagh C. M. Development of an Extended-Range Fiber Optic pH Sensor Using Evanescent Wave Absorption of Sol-Gel-Entrapped pH Indicators. Proc. SPIE 2508, Chemical, Biochemical, and Environmental Fiber Sensors VII 1995, 168–178. [Google Scholar]
- Andres R. T.; Sevilla F. Fibre-Optic Reflectometric Study on Acid—Base Equilibria of Immobilized Indicators: Effect of the Nature of Immobilizing Agents. Anal. Chim. Acta 1991, 251, 165–168. 10.1016/0003-2670(91)87130-Y. [DOI] [Google Scholar]
- Morris D.; Coyle S.; Wu Y.; Lau K. T.; Wallace G.; Diamond D. Bio-Sensing Textile Based Patch with Integrated Optical Detection System for Sweat Monitoring. Sens. Actuators, B 2009, 139, 231–236. 10.1016/j.snb.2009.02.032. [DOI] [Google Scholar]
- Sotomayor P. T.; Raimundo I. M. Jr; de Oliveira Neto G.; de Oliveiira W. A. Evaluation of Fibre Optical Chemical Sensors for Flow Analysis Systems. Sens. Actuators, B 1998, 51, 382–390. 10.1016/S0925-4005(98)00225-1. [DOI] [Google Scholar]
- Kostov Y. V. Immobilized Bromophenol Blue as Sensing Element in Optical pH Sensor. Sens. Actuators, B 1992, 8, 99–101. 10.1016/0925-4005(92)85015-O. [DOI] [Google Scholar]
- Lee J. E.; Saavedra S. S. Evanescent Sensing in Doped Sol-Gel Glass Films. Anal. Chim. Acta 1994, 285, 265–269. 10.1016/0003-2670(94)80064-2. [DOI] [Google Scholar]
- Baldini F.; Bracci S.; Cosi F.; Bechi P.; Pucciani F. Controlled-Pore Glasses Embedded in Plastic Optical Fibers for Gastric pH Sensing Purposes. Appl. Spectrosc. 1994, 48, 549–552. 10.1366/0003702944924871. [DOI] [Google Scholar]
- Butler T. M.; MacCraith B. D.; McDonagh C. Leaching in Sol–Gel-Derived Silica Films for Optical pH Sensing. J. Non-Cryst. Solids 1998, 224, 249–258. 10.1016/S0022-3093(97)00481-X. [DOI] [Google Scholar]
- Schyrr B.; Pasche S.; Scolan E.; Ischer R.; Ferrario D.; Porchet J.-A.; Voirin G. Development of a Polymer Optical Fiber pH Sensor for On-Body Monitoring Application. Sens. Actuators, B 2014, 194, 238–248. 10.1016/j.snb.2013.12.032. [DOI] [Google Scholar]
- Gupta B. D.; Sharma S. A Long-Range Fiber Optic pH Sensor Prepared by Dye Doped Sol-Gel Immobilization Technique. Opt. Commun. 1998, 154, 282–284. 10.1016/S0030-4018(98)00321-6. [DOI] [Google Scholar]
- Gupta B. D.; Sharma N. K. Fabrication and Characterization of U-Shaped Fiber-Optic pH Probes. Sens. Actuators, B 2002, 82, 89–93. 10.1016/S0925-4005(01)00995-9. [DOI] [Google Scholar]
- Dong S.; Luo M.; Peng G.; Cheng W. Broad Range pH Sensor Based on Sol–Gel Entrapped Indicators on Fibre Optic. Sens. Actuators, B 2008, 129, 94–98. 10.1016/j.snb.2007.07.078. [DOI] [Google Scholar]
- Gupta B. D.; Sharma D. K. Evanescent Wave Absorption Based Fiber Optic pH Sensor Prepared by Dye Doped Sol-Gel Immobilization Technique. Opt. Commun. 1997, 140, 32–35. 10.1016/S0030-4018(97)00162-4. [DOI] [Google Scholar]
- Netto E. J.; Peterson J. I.; McShane M.; Hampshire V. A Fiber-Optic Broad-Range pH Sensor System for Gastric Measurements. Sens. Actuators, B 1995, 29, 157–163. 10.1016/0925-4005(95)01677-5. [DOI] [Google Scholar]
- Li W.; Cheng H.; Xia M.; Yang K. An Experimental Study of pH Optical Sensor Using a Section of No-Core Fiber. Sens. Actuators, A 2013, 199, 260–264. 10.1016/j.sna.2013.06.004. [DOI] [Google Scholar]
- Boisde G.; Sebille B. Co-Immobilization of Several Dyes on Optodes for pH Measurements; Proc. SPIE 1510. Proc. SPIE 1991, 1510, 80–94. 10.1117/12.47127. [DOI] [Google Scholar]
- Boisde G.; Biatry B.; Magny B.; Dureault B.; Blanc F.; Sebille B. Comparisons Between Two Dye-Immobilization Techniques On Optodes For The pH - Measurement By Absorption And Reflectance. Proc. SPIE 1172, Chemical, Biochemical, and Environmental Fiber Sensors 1990, 1172, 239–250. [Google Scholar]
- Boisde G.; Blanc F.; Machuron-Mandard X. pH Measurements with Dyes Co-Immobilization on Optodes: Principles and Associated Instrumentation. Intern J. Optoelectr 1991, 6, 407. [Google Scholar]
- Alabbas S.; Ashworth D.; Narayanaswamy R. Design and Performance Features of an Optical-Fibre Reflectance pH Sensor. Analytical Proceeding 1989, 26, 373–380. [Google Scholar]
- Dybko A.; Maciejewski J.; Romaniuk R. S.; Wroblewski W.. Colorimetric Sensor Based on Two Optical Fiber Couplers. In Biochemical and Medical Sensors; International Society for Optics and Photonics, 1994; Vol. 2085, pp 131–137. [Google Scholar]
- Takai N.; Hirai T.; Sakuma I.; Fukui Y.; Kaneko A.; Fujie T. Development of an Optical-Fibre Sensor Using a Functional Membrane. Sens. Actuators, B 1993, 13, 427–428. 10.1016/0925-4005(93)85418-A. [DOI] [Google Scholar]
- Belhadj Miled O.; Grosso D.; Sanchez C.; Livage J. An Optical Fibre pH Sensor Based on Dye Doped Mesostructured Silica. J. Phys. Chem. Solids 2004, 65, 1751–1755. 10.1016/j.jpcs.2004.05.005. [DOI] [Google Scholar]
- El Nahhal I. M.; Zourab S. M.; Kodeh F. S.; Qudaih A. I. Thin Film Optical BTB pH Sensors Using Sol–Gel Method in Presence of Surfactants. Int. Nano Lett. 2012, 2, 16. 10.1186/2228-5326-2-16. [DOI] [Google Scholar]
- Xie X.; Suleiman A. A.; Guilbault G. G. A Urea Fiber Optic Biosensor Based on Absorption Measurement. Anal. Lett. 1990, 23, 2143–2153. 10.1080/00032719008052556. [DOI] [Google Scholar]
- Kim J.; Cho T. N.; Valdés-Ramírez G.; Wang J. A Wearable Fingernail Chemical Sensing Platform: pH Sensing at Your Fingertips. Talanta 2016, 150, 622–628. 10.1016/j.talanta.2015.12.083. [DOI] [PubMed] [Google Scholar]
- Dafu C.; Qiang C.; Jinghong H.; Jinge C.; Yating L.; Zemin Z. Optical-Fibre pH Sensor. Sens. Actuators, B 1993, 12, 29–32. 10.1016/0925-4005(93)85008-X. [DOI] [Google Scholar]
- Bacci M.; Baldini F.; Scheggi A. M. Chemical Studies On Acid-Base Indicators For The Development Of An Extrinsic Optical Fiber pH Sensor. Proc. SPIE 0990, Chemical, Biochemical, and Environmental Applications of Fibers 1989, 0990, 84–87. [Google Scholar]
- Moreno M. C.; Martinez A.; Millan P.; Camara C. Study of a pH Sensitive Optical Fibre Sensor Based on the Use of Cresol Red. J. Mol. Struct. 1986, 143, 553–556. 10.1016/0022-2860(86)85323-6. [DOI] [Google Scholar]
- Cruz Moreno M.; Jiménez M.; Conde C. P.; Cámara C. Analytical Performance of an Optical pH Sensor for Acid-Base Titration. Anal. Chim. Acta 1990, 230, 35–40. 10.1016/S0003-2670(00)82758-0. [DOI] [Google Scholar]
- Seki A.; Katakura H.; Kai T.; Iga M.; Watanabe K. A Hetero-Core Structured Fiber Optic pH Sensor. Anal. Chim. Acta 2007, 582, 154–157. 10.1016/j.aca.2006.08.061. [DOI] [PubMed] [Google Scholar]
- Safavi A.; Maleki N.; Rostamzadeh A.; Maesum S. CCD Camera Full Range pH Sensor Array. Talanta 2007, 71, 498–501. 10.1016/j.talanta.2006.04.030. [DOI] [PubMed] [Google Scholar]
- Abraham E.; Markle D. R.; Fink S.; Ehrlich H.; Tsang M.; Smith M.; Meyer A. Continuous Measurement of Intravascular pH with a Fiberoptic Sensor. Anesth. Analg. 1985, 64, 731–736. 10.1213/00000539-198507000-00013. [DOI] [PubMed] [Google Scholar]
- Watson R.; Markle D.; Ro Y.; Goldstein S.; McGuire D.; Peterson J.; Patterson R. Transmural pH Gradient in Canine Myocardial Ischemia. Am. J. Physiol.-Heart Circ. Physiol. 1984, 246, H232–H238. 10.1152/ajpheart.1984.246.2.H232. [DOI] [PubMed] [Google Scholar]
- Markle D.; McGuire D.; Goldstein S.; Patterson R.; Watson R.. A pH Measurement System for Use in Tissue and Blood, Employing Miniature Fiber Optic Probes. In Advances in Bioengineering; American Society of Mechanical Engineers: New York, 1981, p 123. [Google Scholar]
- Serra G.; Schirone A.; Boniforti R. Fibre-Optic pH Sensor for Sea-Water Monitoring Using a Single Dye. Anal. Chim. Acta 1990, 232, 337–344. 10.1016/S0003-2670(00)81251-9. [DOI] [Google Scholar]
- Motellier S.; Noiré M. H.; Pitsch H.; Duréault B. pH Determination of Clay Interstitial Water Using a Fiber-Optic Sensor. Sens. Actuators, B 1995, 29, 345–352. 10.1016/0925-4005(95)01705-4. [DOI] [Google Scholar]
- Gauglitz G.; Reichert M. Spectral Investigation and Optimization of pH and Urea Sensors. Sens. Actuators, B 1992, 6, 83–86. 10.1016/0925-4005(92)80035-V. [DOI] [Google Scholar]
- Hao T.; Xing X.; Liu C.-C. A pH Sensor Constructed with Two Types of Optical Fibers: The Configuration and the Initial Results. Sens. Actuators, B 1993, 10, 155–159. 10.1016/0925-4005(93)80040-I. [DOI] [Google Scholar]
- Liu Z.; Liu J.; Chen T. Phenol Red Immobilized PVA Membrane for an Optical pH Sensor with Two Determination Ranges and Long-Term Stability. Sens. Actuators, B 2005, 107, 311–316. 10.1016/j.snb.2004.10.017. [DOI] [Google Scholar]
- Baldini F.; Giannetti A.; Mencaglia A. A. Optical Sensor for Interstitial pH Measurements. J. Biomed. Opt. 2007, 12, 024024 10.1117/1.2714807. [DOI] [PubMed] [Google Scholar]
- El-Nahhal I. M.; Zourab S. M.; Kodeh F. S.; Al-Bawab A. Behaviour of Phenol Red pH-Sensors in the Presence of Different Surfactants Using the Sol-Gel Process. Int. J. Environ. Anal. Chem. 2010, 90, 644–656. 10.1080/03067310902903738. [DOI] [Google Scholar]
- Chauhan S. S.; Jasra R. V.; Sharma A. L. Phenol Red Dye Functionalized Nanostructured Silica Films as Optical Filters and pH Sensors. Ind. Eng. Chem. Res. 2012, 51, 10381–10389. 10.1021/ie201701t. [DOI] [Google Scholar]
- El-Nahhal I. M.; Livage J.; Zourab S. M.; Kodeh F. S.; Al swearky A. Entrapment of Phenol Red (PR) pH Indicator into Sol–Gel Matrix in Presence of Some Surfactants. J. Sol-Gel Sci. Technol. 2015, 75, 313–322. 10.1007/s10971-015-3702-8. [DOI] [Google Scholar]
- Rovati L.; Fabbri P.; Ferrari L.; Pilati F. Construction and Evaluation of a Disposable p H Sensor Based on a Large Core Plastic Optical Fiber. Rev. Sci. Instrum. 2011, 82, 023106 10.1063/1.3541795. [DOI] [PubMed] [Google Scholar]
- Islam S.; Bidin N.; Riaz S.; Krishnan G.; Naseem S. Sol–Gel Based Fiber Optic pH Nanosensor: Structural and Sensing Properties. Sens. Actuators, A 2016, 238, 8–18. 10.1016/j.sna.2015.12.003. [DOI] [Google Scholar]
- Baker M. E. J.; Narayanaswamy R. The Modelling and Control of the pH Response of an Immobilised Indicator. Sens. Actuators, B 1995, 29, 368–373. 10.1016/0925-4005(95)01709-7. [DOI] [Google Scholar]
- Takai N.; Sakuma I.; Fukui Y.; Kaneko A.; Fujie T.; Taguchi K.; Nagaoka S. Studies of the Development of Optical Fiber Sensors for Biochemical Analysis. Artif. Organs 1991, 15, 86–89. 10.1111/j.1525-1594.1991.tb00765.x. [DOI] [PubMed] [Google Scholar]
- Kuswandi B.; Narayanaswamy R. Polymeric Encapsulated Membrane for Optrodes. Fresenius' J. Anal. Chem. 1999, 364, 605–607. 10.1007/s002160051394. [DOI] [Google Scholar]
- Rao B. S.; Puschett J. B.; Matyjaszewski K. Preparation of pH Sensors by Covalent Linkage of Dye Molecules to the Surface of Polystyrene Optical Fibers. J. Appl. Polym. Sci. 1991, 43, 925–928. 10.1002/app.1991.070430510. [DOI] [Google Scholar]
- Wang E.; Chow K.-F.; Kwan V.; Chin T.; Wong C.; Bocarsly A. Fast and Long Term Optical Sensors for pH Based on Sol–Gels. Anal. Chim. Acta 2003, 495, 45–50. 10.1016/S0003-2670(03)00904-8. [DOI] [Google Scholar]
- Safavi A.; Sadeghi M. Development of an Optode Membrane for High pH Values. Spectrochim. Acta, Part A 2007, 66, 575–577. 10.1016/j.saa.2006.03.034. [DOI] [PubMed] [Google Scholar]
- Noire M. H.; Bouzon C.; Couston L.; Gontier J.; Marty P.; Pouyat D. Optical Sensing of High Acidity Using a Sol–Gel Entrapped Indicator. Sens. Actuators, B 1998, 51, 214–219. 10.1016/S0925-4005(98)00193-2. [DOI] [Google Scholar]
- Noiré M. H.; Couston L.; Douarre E.; Pouyat D.; Bouzon C.; Marty P. A New Sol-Gel Derived Optical Fiber Sensor for High Acidity Measurements: Application in Nuclear Fuel Reprocessing. J. Sol-Gel Sci. Technol. 2000, 17, 131–136. 10.1023/A:1008791317203. [DOI] [Google Scholar]
- Safavi A.; Bagheri M. Novel Optical pH Sensor for High and Low pH Values. Sens. Actuators, B 2003, 90, 143–150. 10.1016/S0925-4005(03)00039-X. [DOI] [Google Scholar]
- Rivera L.; Puyol M.; Miltsov S.; Alonso J. New Hexamethine–Hemicyanine Dyes for the Development of Integrated Optochemical Sensors. Anal. Bioanal. Chem. 2007, 387, 2111–2119. 10.1007/s00216-006-1068-z. [DOI] [PubMed] [Google Scholar]
- Puyol M.; Miltsov S.; Salinas Í.; Alonso J. Ketocyanine Dyes: H+ -Selective Ionophores for Use in Integrated Waveguides Absorbance Optodes. Anal. Chem. 2002, 74, 570–576. 10.1021/ac0107960. [DOI] [PubMed] [Google Scholar]
- Hisamoto H.; Manabe Y.; Yanai H.; Tohma H.; Yamada T.; Suzuki K. Molecular Design, Characterization, and Application of Multiinformation Dyes for Multidimensional Optical Chemical Sensings. 2. Preparation of the Optical Sensing Membranes for the Simultaneous Measurements of pH and Water Content in Organic Media. Anal. Chem. 1998, 70, 1255–1261. 10.1021/ac970637+. [DOI] [PubMed] [Google Scholar]
- Puyol M.; Encinas C.; Rivera L.; Miltsov S.; Alonso J. Nortricarbocyanine Dyes as Suitable Long Wavelength pH Indicators for Chemical Sensing. Sens. Actuators, B 2007, 122, 53–59. 10.1016/j.snb.2006.05.003. [DOI] [Google Scholar]
- Igarashi S.; Kuwae K.; Yotsuyanagi T. Optical pH Sensor of Electrostatically Immobilized Porphyrin on the Surface of Sulfonated-Polystyrene. Anal. Sci. 1994, 10, 821–822. 10.2116/analsci.10.821. [DOI] [Google Scholar]
- Khalil G. E.; Daddario P.; Lau K. S. F.; Imtiaz S.; King M.; Gouterman M.; Sidelev A.; Puran N.; Ghandehari M.; Brückner C. Meso-Tetraarylporpholactones as High pH Sensors. Analyst 2010, 135, 2125–2131. 10.1039/c0an00018c. [DOI] [PubMed] [Google Scholar]
- Worlinsky J. L.; Halepas S.; Ghandehari M.; Khalil G.; Brückner C. High pH Sensing with Water-Soluble Porpholactone Derivatives and Their Incorporation into a Nafion® Optode Membrane. Analyst 2015, 140, 190–196. 10.1039/C4AN01462F. [DOI] [PubMed] [Google Scholar]
- Liu E.; Ghandehari M.; Brückner C.; Khalil G.; Worlinsky J.; Jin W.; Sidelev A.; Hyland M. A. Mapping High pH Levels in Hydrated Calcium Silicates. Cem. Concr. Res. 2017, 95, 232–239. 10.1016/j.cemconres.2017.02.001. [DOI] [Google Scholar]
- Blair T. L.; Allen J. R.; Daunert S.; Bachas L. G. Potentiometric and Fiber Optic Sensors for pH Based on an Electropolymerized Cobalt Porphyrin. Anal. Chem. 1993, 65, 2155–2158. 10.1021/ac00063a039. [DOI] [Google Scholar]
- Gulino A.; Mineo P.; Bazzano S.; Vitalini D.; Fragalà I. Optical pH Meter by Means of a Porphyrin Monolayer Covalently Assembled on a Molecularly Engineered Silica Surface. Chem. Mater. 2005, 17, 4043–4045. 10.1021/cm051118n. [DOI] [Google Scholar]
- Gulino A.; Mineo P.; Scamporrino E.; Vitalini D.; Fragalà I. Spectroscopic and Microscopic Characterization and Behavior of an Optical pH Meter Based on a Functional Hybrid Monolayer Molecular System: Porphyrin Molecules Covalently Assembled on a Molecularly Engineered Silica Surface. Chem. Mater. 2006, 18, 2404–2410. 10.1021/cm060086g. [DOI] [Google Scholar]
- Gulino A.; Mineo P.; Fragalà I. Spectroscopic and Morphological Investigation of an Optical pH Meter Based on a Porphyrin Monolayer Covalently Assembled on a Engineered Silica Surface. J. Phys. Chem. C 2007, 111, 1373–1377. 10.1021/jp066523w. [DOI] [Google Scholar]
- Delmarre D.; Méallet-Renault R.; Bied-Charreton C.; Pasternack R. F. Incorporation of Water-Soluble Porphyrins in Sol–Gel Matrices and Application to pH Sensing. Anal. Chim. Acta 1999, 401, 125–128. 10.1016/S0003-2670(99)00515-2. [DOI] [Google Scholar]
- Umemura T.; Hotta H.; Abe T.; Takahashi Y.; Takiguchi H.; Uehara M.; Odake T.; Tsunoda K. Slab Optical Waveguide High-Acidity Sensor Based on an Absorbance Change of Protoporphyrin IX. Anal. Chem. 2006, 78, 7511–7516. 10.1021/ac0606150. [DOI] [PubMed] [Google Scholar]
- Veiga-Santos P.; Ditchfield C.; Tadini C. C. Development and Evaluation of a Novel pH Indicator Biodegradable Film Based on Cassava Starch. J. Appl. Polym. Sci. 2011, 120, 1069–1079. 10.1002/app.33255. [DOI] [Google Scholar]
- Yoshida C. M. P.; Maciel V. B. V.; Mendonça M. E. D.; Franco T. T. Chitosan Biobased and Intelligent Films: Monitoring pH Variations. LWT - Food Sci. Technol. 2014, 55, 83–89. 10.1016/j.lwt.2013.09.015. [DOI] [Google Scholar]
- Abolghasemi M. M.; Sobhi M.; Piryaei M. Preparation of a Novel Green Optical pH Sensor Based on Immobilization of Red Grape Extract on Bioorganic Agarose Membrane. Sens. Actuators, B 2016, 224, 391–395. 10.1016/j.snb.2015.10.038. [DOI] [Google Scholar]
- Zhang X.; Lu S.; Chen X. A Visual pH Sensing Film Using Natural Dyes from Bauhinia Blakeana Dunn. Sens. Actuators, B 2014, 198, 268–273. 10.1016/j.snb.2014.02.094. [DOI] [Google Scholar]
- Kuswandi B.; Jayus; Larasati T. S.; Abdullah A.; Heng L. Y. Real-Time Monitoring of Shrimp Spoilage Using On-Package Sticker Sensor Based on Natural Dye of Curcumin. Food Anal. Methods 2012, 5, 881–889. 10.1007/s12161-011-9326-x. [DOI] [Google Scholar]
- Giachet F. T.; Vineis C.; Sanchez Ramirez D. O.; Carletto R. A.; Varesano A.; Mazzuchetti G. Reversible and Washing Resistant Textile-Based Optical pH Sensors by Dyeing Fabrics with Curcuma. Fibers Polym. 2017, 18, 720–730. 10.1007/s12221-017-6757-z. [DOI] [Google Scholar]
- Hashemi P.; Zarjani R. A.; Abolghasemi M. M.; Olin Å. Agarose Film Coated Glass Slides for Preparation of pH Optical Sensors. Sens. Actuators, B 2007, 121, 396–400. 10.1016/j.snb.2006.04.002. [DOI] [Google Scholar]
- Goicoechea J.; Zamarreño C. R.; Matías I. R.; Arregui F. J. Optical Fiber pH Sensors Based on Layer-by-Layer Electrostatic Self-Assembled Neutral Red. Sens. Actuators, B 2008, 132, 305–311. 10.1016/j.snb.2008.01.056. [DOI] [Google Scholar]
- Jeon D.; Yoo W. J.; Seo J. K.; Shin S. H.; Han K.-T.; Kim S. G.; Park J.-Y.; Lee B. Fiber-Optic pH Sensor Based on Sol–Gel Film Immobilized with Neutral Red. Opt. Rev. 2013, 20, 209–213. 10.1007/s10043-013-0037-y. [DOI] [Google Scholar]
- Lehmann H.; Schwotzer G.; Czerney P.; Mohr G. J. Fiber-Optic pH Meter Using NIR Dye. Sens. Actuators, B 1995, 29, 392–400. 10.1016/0925-4005(95)01713-5. [DOI] [Google Scholar]
- Koncki R.; Wolfbeis O. S. Composite Films of Prussian Blue and N-Substituted Polypyrroles: Fabrication and Application to Optical Determination of pH. Anal. Chem. 1998, 70, 2544–2550. 10.1021/ac9712714. [DOI] [PubMed] [Google Scholar]
- Kuznetsov V. V.; Yakunina I. V. The Application of Specific Interaction Theory for Describing the Behaviour of Free and Immobilized Acid–Base Indicators. Mendeleev Commun. 1995, 5, 52–53. 10.1070/MC1995v005n02ABEH000453. [DOI] [Google Scholar]
- Wang H.; Liu B.; Li Z.; Yang L. Multi-Wavelength Spectrophotometric Determination of pH Using Phenol Red–Doped Sol–Gel Film Sensors. Spectrosc. Lett. 2017, 50, 307–315. 10.1080/00387010.2017.1321019. [DOI] [Google Scholar]
- Hochberg S.; LaMer V. K. Rate and Equilibrium Studies of Carbinol Formation in the Triphenylmethane and Sulfonphthalein Dyes. J. Am. Chem. Soc. 1941, 63, 3110–3120. 10.1021/ja01856a065. [DOI] [Google Scholar]
- Mohr G. J.; Werner T.; Oehme I.; Preininger C.; Klimant I.; Kovacs B.; Wolfbeis O. S. Novel Optical Sensor Materials Based on Solubilization of Polar Dyes in Apolar Polymers. Adv. Mater. 1997, 9, 1108–1113. 10.1002/adma.19970091410. [DOI] [Google Scholar]
- Klimant I.; Wolfbeis O. S. Oxygen-Sensitive Luminescent Materials Based on Silicone-Soluble Ruthenium Diimine Complexes. Anal. Chem. 1995, 67, 3160–3166. 10.1021/ac00114a010. [DOI] [Google Scholar]
- Weigl B. H.; Wolfbeis O. S. New Hydrophobic Materials for Optical Carbon Dioxide Sensors Based on Ion Pairing. Anal. Chim. Acta 1995, 302, 249–254. 10.1016/0003-2670(94)00473-Y. [DOI] [Google Scholar]
- Wolfbeis O. S.; Klimant I.; Werner T.; Huber C.; Kosch U.; Krause C.; Neurauter G.; Dürkop A. Set of Luminescence Decay Time Based Chemical Sensors for Clinical Applications. Sens. Actuators, B 1998, 51, 17–24. 10.1016/S0925-4005(98)00181-6. [DOI] [Google Scholar]
- Zollinger H.Color Chemistry: Syntheses, Properties, and Applications of Organic Dyes and Pigments, 3rd rev. ed.; Verlag Helvetica Chimica Acta, Wiley-VCH: Zürich, 2003. [Google Scholar]
- Van der Schueren L.; De Clerck K. Coloration and Application of pH-Sensitive Dyes on Textile Materials: Coloration and Application of pH-Sensitive Dyes. Color. Technol. 2012, 128, 82–90. 10.1111/j.1478-4408.2011.00361.x. [DOI] [Google Scholar]
- Kassal P.; Zubak M.; Scheipl G.; Mohr G. J.; Steinberg M. D.; Murković Steinberg I. Smart Bandage with Wireless Connectivity for Optical Monitoring of pH. Sens. Actuators, B 2017, 246, 455–460. 10.1016/j.snb.2017.02.095. [DOI] [Google Scholar]
- Rastegarzadeh S.; Moradpour Z. Optical pH Sensor Based on Calcon Immobilization Membrane. J. Iran. Chem. Soc. 2009, 6, 858–862. 10.1007/BF03246180. [DOI] [Google Scholar]
- Hashemi P.; Zarjani R. A. A Wide Range pH Optical Sensor with Mixture of Neutral Red and Thionin Immobilized on an Agarose Film Coated Glass Slide. Sens. Actuators, B 2008, 135, 112–115. 10.1016/j.snb.2008.08.010. [DOI] [Google Scholar]
- Vishnoi G.; Goel T. C.; Pillai P. K. C. pH Optrode for the Complete Working Range. Proc. SPIE 3538, Process Monitoring with Optical Fibers and Harsh Environment Sensors 1999, 3538, 319. [Google Scholar]
- Safavi A.; Pakniat M. Dipicrylamine-Modified Triacetylcellulose Membrane for Optical pH and Potassium Ion Measurement. Anal. Chim. Acta 1996, 335, 227–233. 10.1016/S0003-2670(96)00357-1. [DOI] [Google Scholar]
- Hazneci C.; Ertekin K.; Yenigul B.; Cetinkaya E. Optical pH Sensor Based on Spectral Response of Newly Synthesized Schiff Bases. Dyes Pigm. 2004, 62, 35–41. 10.1016/j.dyepig.2003.11.006. [DOI] [Google Scholar]
- Borchert N. B.; Ponomarev G. V.; Kerry J. P.; Papkovsky D. B. O2/pH Multisensor Based on One Phosphorescent Dye. Anal. Chem. 2011, 83, 18–22. 10.1021/ac1025754. [DOI] [PubMed] [Google Scholar]
- Mishra A.; Behera R. K.; Behera P. K.; Mishra B. K.; Behera G. B. Cyanines during the 1990s: A Review. Chem. Rev. 2000, 100, 1973–2012. 10.1021/cr990402t. [DOI] [PubMed] [Google Scholar]
- Sun W.; Guo S.; Hu C.; Fan J.; Peng X. Recent Development of Chemosensors Based on Cyanine Platforms. Chem. Rev. 2016, 116, 7768–7817. 10.1021/acs.chemrev.6b00001. [DOI] [PubMed] [Google Scholar]
- Zen J. M.; Patonay G. Near-Infrared Fluorescence Probe for pH Determination. Anal. Chem. 1991, 63, 2934–2938. 10.1021/ac00024a024. [DOI] [Google Scholar]
- Hasanah U.; Setyowati M.; Efendi R.; Muslem M.; Md Sani N. D.; Safitri E.; Yook Heng L.; Idroes R. Preparation and Characterization of a Pectin Membrane-Based Optical pH Sensor for Fish Freshness Monitoring. Biosensors 2019, 9, 60. 10.3390/bios9020060. [DOI] [PMC free article] [PubMed] [Google Scholar]
- Koncki R.; Wolfbeis O. S. Optical Chemical Sensing Based on Thin Films of Prussian Blue. Sens. Actuators, B 1998, 51, 355–358. 10.1016/S0925-4005(98)00287-1. [DOI] [Google Scholar]
- Koren K.; Jensen P. Ø.; Kühl M. Development of a Rechargeable Optical Hydrogen Peroxide Sensor – Sensor Design and Biological Application. Analyst 2016, 141, 4332–4339. 10.1039/C6AN00864J. [DOI] [PubMed] [Google Scholar]
- Aigner D.; Freunberger S. A.; Wilkening M.; Saf R.; Borisov S. M.; Klimant I. Enhancing Photoinduced Electron Transfer Efficiency of Fluorescent pH-Probes with Halogenated Phenols. Anal. Chem. 2014, 86, 9293–9300. 10.1021/ac502513g. [DOI] [PMC free article] [PubMed] [Google Scholar]
- Larsen M.; Borisov S. M.; Grunwald B.; Klimant I.; Glud R. N. A Simple and Inexpensive High Resolution Color Ratiometric Planar Optode Imaging Approach: Application to Oxygen and pH Sensing. Limnol. Oceanogr.: Methods 2011, 9, 348–360. 10.4319/lom.2011.9.348. [DOI] [Google Scholar]
- Hulth S.; Aller R. C.; Engström P.; Selander E. A pH Plate Fluorosensor (Optode) for Early Diagenetic Studies of Marine Sediments. Limnol. Oceanogr. 2002, 47, 212–220. 10.4319/lo.2002.47.1.0212. [DOI] [Google Scholar]
- Strömberg N.; Mattsson E.; Hakonen A. An Imaging pH Optode for Cell Studies Based on Covalent Attachment of 8-Hydroxypyrene-1,3,6-Trisulfonate to Amino Cellulose Acetate Films. Anal. Chim. Acta 2009, 636, 89–94. 10.1016/j.aca.2009.01.045. [DOI] [PubMed] [Google Scholar]
- Zhu Q.; Aller R. C.; Fan Y. High-Performance Planar pH Fluorosensor for Two-Dimensional pH Measurements in Marine Sediment and Water. Environ. Sci. Technol. 2005, 39, 8906–8911. 10.1021/es051023m. [DOI] [PubMed] [Google Scholar]
- Hakonen A.; Hulth S.; Dufour S. Analytical Performance during Ratiometric Long-Term Imaging of pH in Bioturbated Sediments. Talanta 2010, 81, 1393–1401. 10.1016/j.talanta.2010.02.041. [DOI] [PubMed] [Google Scholar]
- Kermis H. R.; Kostov Y.; Rao G. Rapid Method for the Preparation of a Robust Optical pH Sensor. Analyst 2003, 128, 1181–1186. 10.1039/b304902g. [DOI] [PubMed] [Google Scholar]
- Kermis H. R.; Kostov Y.; Harms P.; Rao G. Dual Excitation Ratiometric Fluorescent pH Sensor for Noninvasive Bioprocess Monitoring: Development and Application. Biotechnol. Prog. 2002, 18, 1047–1053. 10.1021/bp0255560. [DOI] [PubMed] [Google Scholar]
- Kocincova A. S.; Borisov S. M.; Krause C.; Wolfbeis O. S. Fiber-Optic Microsensors for Simultaneous Sensing of Oxygen and pH, and of Oxygen and Temperature. Anal. Chem. 2007, 79, 8486–8493. 10.1021/ac070514h. [DOI] [PubMed] [Google Scholar]
- Borisov S. M.; Herrod D. L.; Klimant I. Fluorescent Poly (Styrene-Block-Vinylpyrrolidone) Nanobeads for Optical Sensing of pH. Sens. Actuators, B 2009, 139, 52–58. 10.1016/j.snb.2008.08.028. [DOI] [Google Scholar]
- Wencel D.; MacCraith B. D.; McDonagh C. High Performance Optical Ratiometric Sol–Gel-Based pH Sensor. Sens. Actuators, B 2009, 139, 208–213. 10.1016/j.snb.2008.12.066. [DOI] [Google Scholar]
- Stich M. I. J.; Schaeferling M.; Wolfbeis O. S. Multicolor Fluorescent and Permeation-Selective Microbeads Enable Simultaneous Sensing of pH, Oxygen, and Temperature. Adv. Mater. 2009, 21, 2216–2220. 10.1002/adma.200803575. [DOI] [Google Scholar]
- Nivens D. A.; Schiza M. V.; Angel S. M. Multilayer Sol–Gel Membranes for Optical Sensing Applications: Single Layer pH and Dual Layer CO2 and NH3 Sensors. Talanta 2002, 58, 543–550. 10.1016/S0039-9140(02)00323-5. [DOI] [PubMed] [Google Scholar]
- Ge X.; Kostov Y.; Tolosa L.; Rao G. Study on Low-Cost Calibration-Free pH Sensing with Disposable Optical Sensors. Anal. Chim. Acta 2012, 734, 79–87. 10.1016/j.aca.2012.05.021. [DOI] [PubMed] [Google Scholar]
- Samuel J.; Strinkovski A.; Shalom S.; Lieberman K.; Ottolenghi M.; Avnir D.; Lewis A. Miniaturization of Organically Doped Sol-Gel Materials: A Microns-Size Fluorescent pH Sensor. Mater. Lett. 1994, 21, 431–434. 10.1016/0167-577X(94)90254-2. [DOI] [Google Scholar]
- Zhang S.; Tanaka S.; Wickramasinghe Y.; Rolfe P. Fibre-Optical Sensor Based on Fluorescent Indicator for Monitoring Physiological pH Values. Med. Biol. Eng. Comput. 1995, 33, 152–156. 10.1007/BF02523033. [DOI] [PubMed] [Google Scholar]
- Hakonen A.; Hulth S. A High-Performance Fluorosensor for pH Measurements between 6 and 9. Talanta 2010, 80, 1964–1969. 10.1016/j.talanta.2009.10.055. [DOI] [PubMed] [Google Scholar]
- Borisov S. M.; Mayr T.; Klimant I. Poly(Styrene- Block -Vinylpyrrolidone) Beads as a Versatile Material for Simple Fabrication of Optical Nanosensors. Anal. Chem. 2008, 80, 573–582. 10.1021/ac071374e. [DOI] [PubMed] [Google Scholar]
- Wencel D.; Kaworek A.; Abel T.; Efremov V.; Bradford A.; Carthy D.; Coady G.; McMorrow R. C. N.; McDonagh C. Optical Sensor for Real-Time pH Monitoring in Human Tissue. Small 2018, 14, 1803627. 10.1002/smll.201803627. [DOI] [PubMed] [Google Scholar]
- Duong H. D.; Shin Y.; Rhee J. I. Development of Fluorescent pH Sensors Based on a Sol-Gel Matrix for Acidic and Neutral pH Ranges in a Microtiter Plate. Microchem. J. 2019, 147, 286–295. 10.1016/j.microc.2019.03.036. [DOI] [Google Scholar]
- Ulrich S.; Osypova A.; Panzarasa G.; Rossi R. M.; Bruns N.; Boesel L. F. Pyranine-Modified Amphiphilic Polymer Conetworks as Fluorescent Ratiometric pH Sensors. Macromol. Rapid Commun. 2019, 40, 1900360. 10.1002/marc.201900360. [DOI] [PubMed] [Google Scholar]
- Ge X.; Hanson M.; Shen H.; Kostov Y.; Brorson K. A.; Frey D. D.; Moreira A. R.; Rao G. Validation of an Optical Sensor-Based High-Throughput Bioreactor System for Mammalian Cell Culture. J. Biotechnol. 2006, 122, 293–306. 10.1016/j.jbiotec.2005.12.009. [DOI] [PubMed] [Google Scholar]
- Mohr G. J.; Werner T.; Wolfbeis O. S. Application of a Novel Lipophilized Fluorescent Dye in an Optical Nitrate Sensor. J. Fluoresc. 1995, 5, 135–138. 10.1007/BF00727530. [DOI] [PubMed] [Google Scholar]
- Vasylevska A. S.; Karasyov A. A.; Borisov S. M.; Krause C. Novel Coumarin-Based Fluorescent pH Indicators, Probes and Membranes Covering a Broad pH Range. Anal. Bioanal. Chem. 2007, 387, 2131–2141. 10.1007/s00216-006-1061-6. [DOI] [PubMed] [Google Scholar]
- Xu Z.; Rollins A.; Alcala R.; Marchant R. E. A Novel Fiber-Optic pH Sensor Incorporating Carboxy SNAFL-2 and Fluorescent Wavelength-Ratiometric Detection. J. Biomed. Mater. Res. 1998, 39, 9–15. 10.1002/(SICI)1097-4636(199801)39:1<9::AID-JBM2>3.0.CO;2-U. [DOI] [PubMed] [Google Scholar]
- Borisov S. M.; Seifner R.; Klimant I. A Novel Planar Optical Sensor for Simultaneous Monitoring of Oxygen, Carbon Dioxide, pH and Temperature. Anal. Bioanal. Chem. 2011, 400, 2463–2474. 10.1007/s00216-010-4617-4. [DOI] [PMC free article] [PubMed] [Google Scholar]
- Grant S. A.; Glass R. S. A Sol–Gel Based Fiber Optic Sensor for Local Blood pH Measurements. Sens. Actuators, B 1997, 45, 35–42. 10.1016/S0925-4005(97)00263-3. [DOI] [Google Scholar]
- Bronk K. S.; Michael K. L.; Pantano P.; Walt D. R. Combined Imaging and Chemical Sensing Using a Single Optical Imaging Fiber. Anal. Chem. 1995, 67, 2750–2757. 10.1021/ac00113a005. [DOI] [PubMed] [Google Scholar]
- Duong H. D.; Sohn O.-J.; Lam H. T.; Rhee J. I. An Optical pH Sensor with Extended Detection Range Based on Fluoresceinamine Covalently Bound to Sol–Gel Support. Microchem. J. 2006, 84, 50–55. 10.1016/j.microc.2006.04.013. [DOI] [Google Scholar]
- Chen H.; Wang X.; Song X.; Zhou T.; Jiang Y.; Chen X. Colorimetric Optical pH Sensor Production Using a Dual-Color System. Sens. Actuators, B 2010, 146, 278–282. 10.1016/j.snb.2010.01.068. [DOI] [Google Scholar]
- Manyam U.; Shahriari M. R.; Morris M. J.. Complete Spectrum Fiber Optic pH Sensor Based on a Novel Fluorescent Indicator Doped Porous Sol-Gel Material; International Society for Optics and Photonics, 1999; Vol. 3540, pp 10–19. [Google Scholar]
- Burns A.; Sengupta P.; Zedayko T.; Baird B.; Wiesner U. Core/Shell Fluorescent Silica Nanoparticles for Chemical Sensing: Towards Single-Particle Laboratories. Small 2006, 2, 723–726. 10.1002/smll.200600017. [DOI] [PubMed] [Google Scholar]
- Allard E.; Larpent C. Core-Shell Type Dually Fluorescent Polymer Nanoparticles for Ratiometric pH-Sensing. J. Polym. Sci., Part A: Polym. Chem. 2008, 46, 6206–6213. 10.1002/pola.22931. [DOI] [Google Scholar]
- Medina-Castillo A. L.; Fernandez-Sanchez J. F.; Segura-Carretero A.; Fernandez-Gutierrez A. Design and Synthesis by ATRP of Novel, Water-Insoluble, Lineal Copolymers and Their Application in the Development of Fluorescent and pH-Sensing Nanofibres Made by Electrospinning. J. Mater. Chem. 2011, 21, 6742–6750. 10.1039/c1jm10209e. [DOI] [Google Scholar]
- Ferrero Martín F. J.; Campo Rodriguez J. C.; Alvarez Anton J. C.; Viera Perez J. C.; Sánchez-Barragán I.; Costa-Fernández J. M.; Sanz-Medel A. Design of a Low-Cost Optical Instrument for pH Fluorescence Measurements. IEEE Trans. Instrum. Meas. 2006, 55, 1215–1221. 10.1109/TIM.2006.877750. [DOI] [Google Scholar]
- Tan W.; Shi Z. Y.; Kopelman R. Development of Submicron Chemical Fiber Optic Sensors. Anal. Chem. 1992, 64, 2985–2990. 10.1021/ac00047a019. [DOI] [Google Scholar]
- Ferrari L.; Rovati L.; Fabbri P.; Pilati F. Disposable Fluorescence Optical pH Sensor for near Neutral Solutions. Sensors 2013, 13, 484–499. 10.3390/s130100484. [DOI] [PMC free article] [PubMed] [Google Scholar]
- Wu S.; Li Z.; Han J.; Han S. Dual Colored Mesoporous Silica Nanoparticles with pH Activable Rhodamine-Lactam for Ratiometric Sensing of Lysosomal Acidity. Chem. Commun. 2011, 47, 11276. 10.1039/c1cc14627k. [DOI] [PubMed] [Google Scholar]
- Nielsen L. J.; Eyley S.; Thielemans W.; Aylott J. W. Dual Fluorescent Labelling of Cellulose Nanocrystals for pH Sensing. Chem. Commun. 2010, 46, 8929–8931. 10.1039/c0cc03470c. [DOI] [PubMed] [Google Scholar]
- Millar D.; Henderson R.; Keeper A. Electrochemical Immobilization of a pH Sensitive Fluorescein Derivative: Synthesis and Characterization of a Fluorescein-Derivatised Polythiophene. Chem. Commun. 1998, (4), 477–478. 10.1039/a708160j. [DOI] [Google Scholar]
- Shi W.; He S.; Wei M.; Evans D. G.; Duan X. Optical pH Sensor with Rapid Response Based on a Fluorescein-intercalated Layered Double Hydroxide. Adv. Funct. Mater. 2010, 20, 3856–3863. 10.1002/adfm.201001081. [DOI] [Google Scholar]
- Lobnik A.; Oehme I.; Murkovic I.; Wolfbeis O. S. pH Optical Sensors Based on Sol–Gels: Chemical Doping versus Covalent Immobilization. Anal. Chim. Acta 1998, 367, 159–165. 10.1016/S0003-2670(97)00708-3. [DOI] [Google Scholar]
- Bradley M.; Alexander L.; Duncan K.; Chennaoui M.; Jones A. C.; Sánchez-Martín R. M. pH Sensing in Living Cells Using Fluorescent Microspheres. Bioorg. Med. Chem. Lett. 2008, 18, 313–317. 10.1016/j.bmcl.2007.10.075. [DOI] [PubMed] [Google Scholar]
- Aslan K.; Lakowicz J. R.; Szmacinski H.; Geddes C. D. Enhanced Ratiometric pH Sensing Using SNAFL-2 on Silver Island Films: Metal-Enhanced Fluorescence Sensing. J. Fluoresc. 2005, 15, 37–40. 10.1007/s10895-005-0211-0. [DOI] [PMC free article] [PubMed] [Google Scholar]
- Healey B. G.; Walt D. R. Fast Temporal Response Fiber-Optic Chemical Sensors Based on the Photodeposition of Micrometer-Scale Polymer Arrays. Anal. Chem. 1997, 69, 2213–2216. 10.1021/ac961058s. [DOI] [PubMed] [Google Scholar]
- Thompson R. B.; Lakowicz J. R. Fiber Optic pH Sensor Based on Phase Fluorescence Lifetimes. Anal. Chem. 1993, 65, 853–856. 10.1021/ac00055a005. [DOI] [PMC free article] [PubMed] [Google Scholar]
- Ji J.; Rosenzweig Z. Fiber Optic pH/Ca2+ Fluorescence Microsensor Based on Spectral Processing of Sensing Signals. Anal. Chim. Acta 1999, 397, 93–102. 10.1016/S0003-2670(99)00395-5. [DOI] [Google Scholar]
- Kuwana E.; Liang F.; Sevick-Muraca E. M. Fluorescence Lifetime Spectroscopy of a pH-sensitive Dye Encapsulated in Hydrogel Beads. Biotechnol. Prog. 2004, 20, 1561–1566. 10.1021/bp034328i. [DOI] [PubMed] [Google Scholar]
- Panova A. A.; Pantano P.; Walt D. R. In Situ Fluorescence Imaging of Localized Corrosion with a pH-Sensitive Imaging Fiber. Anal. Chem. 1997, 69, 1635–1641. 10.1021/ac961025c. [DOI] [PubMed] [Google Scholar]
- Grant S. A.; Bettencourt K.; Krulevitch P.; Hamilton J.; Glass R. In Vitro and in Vivo Measurements of Fiber Optic and Electrochemical Sensors to Monitor Brain Tissue pH. Sens. Actuators, B 2001, 72, 174–179. 10.1016/S0925-4005(00)00650-X. [DOI] [Google Scholar]
- Vasylevska G. S.; Borisov S. M.; Krause C.; Wolfbeis O. S. Indicator-Loaded Permeation-Selective Microbeads for Use in Fiber Optic Simultaneous Sensing of pH and Dissolved Oxygen. Chem. Mater. 2006, 18, 4609–4616. 10.1021/cm060967n. [DOI] [Google Scholar]
- Hoefer C.; Santner J.; Borisov S. M.; Wenzel W. W.; Puschenreiter M. Integrating Chemical Imaging of Cationic Trace Metal Solutes and pH into a Single Hydrogel Layer. Anal. Chim. Acta 2017, 950, 88–97. 10.1016/j.aca.2016.11.004. [DOI] [PubMed] [Google Scholar]
- Schreml S.; Meier R. J.; Kirschbaum M.; Kong S. C.; Gehmert S.; Felthaus O.; Küchler S.; Sharpe J. R.; Wöltje K.; Weiß K. T.; Albert M.; Seidl U.; Schröder J.; Morsczeck C.; Prantl L.; Duschl C.; Pedersen S. F.; Gosau M.; Berneburg M.; Wolfbeis O. S.; Landthaler M.; Babilas P. Luminescent Dual Sensors Reveal Extracellular pH-Gradients and Hypoxia on Chronic Wounds That Disrupt Epidermal Repair. Theranostics 2014, 4, 721–735. 10.7150/thno.9052. [DOI] [PMC free article] [PubMed] [Google Scholar]
- Carrillo-Carrion C.; Parak W. J. Multiplexed Fluorophore–Nanoparticle Hybrids for Extending the Range of pH Measurements. Small Methods 2017, 1, 1700153. 10.1002/smtd.201700153. [DOI] [Google Scholar]
- Clark H. A.; Kopelman R.; Tjalkens R.; Philbert M. A. Optical Nanosensors for Chemical Analysis inside Single Living Cells. 2. Sensors for pH and Calcium and the Intracellular Application of PEBBLE Sensors. Anal. Chem. 1999, 71, 4837–4843. 10.1021/ac990630n. [DOI] [PubMed] [Google Scholar]
- Yang Q.; Wang H.; Lan X.; Cheng B.; Chen S.; Shi H.; Xiao H.; Ma Y. Reflection-Mode Micro-Spherical Fiber-Optic Probes for in Vitro Real-Time and Single-Cell Level pH Sensing. Sens. Actuators, B 2015, 207, 571–580. 10.1016/j.snb.2014.10.107. [DOI] [PMC free article] [PubMed] [Google Scholar]
- Ferguson J. A.; Healey B. G.; Bronk K. S.; Barnard S. M.; Walt D. R. Simultaneous Monitoring of pH, CO2 and O2 Using an Optical Imaging Fiber. Anal. Chim. Acta 1997, 340, 123–131. 10.1016/S0003-2670(96)00510-7. [DOI] [Google Scholar]
- Rudolph N.; Voss S.; Moradi A. B.; Nagl S.; Oswald S. E. Spatio-Temporal Mapping of Local Soil pH Changes Induced by Roots of Lupin and Soft-Rush. Plant Soil 2013, 369, 669–680. 10.1007/s11104-013-1775-0. [DOI] [Google Scholar]
- Plaschke M.; Czolk R.; Reichert J.; Ache H. J. Stability Improvement of Optochemical Sol-Gel Film Sensors by Immobilisation of Dye-Labeled Dextrans. Thin Solid Films 1996, 279, 233–235. 10.1016/0040-6090(95)08026-0. [DOI] [Google Scholar]
- Cajlakovic M.; Lobnik A.; Werner T. Stability of New Optical pH Sensing Material Based on Cross-Linked Poly(Vinyl Alcohol) Copolymer. Anal. Chim. Acta 2002, 455, 207–213. 10.1016/S0003-2670(01)01598-7. [DOI] [Google Scholar]
- Clark H. A.; Barker S. L.; Brasuel M.; Miller M. T.; Monson E.; Parus S.; Shi Z.-Y.; Song A.; Thorsrud B.; Kopelman R.; et al. Subcellular Optochemical Nanobiosensors: Probes Encapsulated by Biologically Localised Embedding (PEBBLEs). Sens. Actuators, B 1998, 51, 12–16. 10.1016/S0925-4005(98)00212-3. [DOI] [Google Scholar]
- Sanchez-Barragan I.; Costa-Fernandez J.; Sanz-Medel A. Tailoring the pH Response Range of Fluorescent-Based pH Sensing Phases by Sol–Gel Surfactants Co-Immobilization. Sens. Actuators, B 2005, 107, 69–76. 10.1016/j.snb.2004.07.038. [DOI] [Google Scholar]
- Schröder C. R.; Polerecky L.; Klimant I. Time-Resolved pH/PO2Mapping with Luminescent Hybrid Sensors. Anal. Chem. 2007, 79, 60–70. 10.1021/ac0606047. [DOI] [PubMed] [Google Scholar]
- Doussineau T.; Smaïhi M.; Mohr G. J. Two-Dye Core/Shell Zeolite Nanoparticles: A New Tool for Ratiometric pH Measurements. Adv. Funct. Mater. 2009, 19, 117–122. 10.1002/adfm.200800718. [DOI] [Google Scholar]
- Kiryukhin M. V.; Lau H. H.; Goh S. H.; Teh C.; Korzh V.; Sadovoy A. A Membrane Film Sensor with Encapsulated Fluorescent Dyes towards Express Freshness Monitoring of Packaged Food. Talanta 2018, 182, 187–192. 10.1016/j.talanta.2018.01.085. [DOI] [PubMed] [Google Scholar]
- Kenney R. M.; Boyce M. W.; Whitman N. A.; Kromhout B. P.; Lockett M. R. A pH-Sensing Optode for Mapping Spatiotemporal Gradients in 3D Paper-Based Cell Cultures. Anal. Chem. 2018, 90, 2376–2383. 10.1021/acs.analchem.7b05015. [DOI] [PMC free article] [PubMed] [Google Scholar]
- Hornig S.; Biskup C.; Gräfe A.; Wotschadlo J.; Liebert T.; Mohr G. J.; Heinze T. Biocompatible Fluorescent Nanoparticles for pH-Sensoring. Soft Matter 2008, 4, 1169–1172. 10.1039/b800276b. [DOI] [PubMed] [Google Scholar]
- van Graft M.; Oosterhuis B.; van der Werf K. O.; de Grooth B. G.; Greve J. A Simple Optical Fiber Device for Quantitative Fluorescence Microscopy of Single Living Cells. J. Immunol. Methods 1993, 159, 145–151. 10.1016/0022-1759(93)90152-W. [DOI] [PubMed] [Google Scholar]
- Meier R. J.; Schreml S.; Wang X.; Landthaler M.; Babilas P.; Wolfbeis O. S. Simultaneous Photographing of Oxygen and pH In Vivo Using Sensor Films. Angew. Chem., Int. Ed. 2011, 50, 10893–10896. 10.1002/anie.201104530. [DOI] [PubMed] [Google Scholar]
- Nivens D. A.; Zhang Y.; Angel S. M. A Fiber-Optic pH Sensor Prepared Using a Base-Catalyzed Organo-Silica Sol–Gel. Anal. Chim. Acta 1998, 376, 235–245. 10.1016/S0003-2670(98)00505-4. [DOI] [Google Scholar]
- Choudhary S.; Joshi B.; Pandey G.; Joshi A. Application of Single and Dual Fluorophore-Based pH Sensors for Determination of Milk Quality and Shelf Life Using a Fibre Optic Spectrophotometer. Sens. Actuators, B 2019, 298, 126925. 10.1016/j.snb.2019.126925. [DOI] [Google Scholar]
- Whitaker J.; Haugland R.; Prendergast F. Seminaphtho-Fluoresceins and Seminaphtho-Rhodafluors—Dual Fluorescence pH Indicators. Biophys. J. 1988, 53, 197. [Google Scholar]
- Whitaker J. E.; Haugland R. P.; Prendergast F. G. Spectral and Photophysical Studies of Benzo[c]Xanthene Dyes: Dual Emission pH Sensors. Anal. Biochem. 1991, 194, 330–344. 10.1016/0003-2697(91)90237-N. [DOI] [PubMed] [Google Scholar]
- Klonis N.; Sawyer W. H. Spectral Properties of the Prototropic Forms of Fluorescein in Aqueous Solution. J. Fluoresc. 1996, 6, 147–157. 10.1007/BF00732054. [DOI] [PubMed] [Google Scholar]
- Legrum W.Influence of the Degree, Position and Nature of the Halide Substitution on the Rate of Photobleaching of Xanthene Dyes. In Recent Developments in Toxicology: Trends, Methods and Problems; Chambers P. L., Chambers C. M., Wiezorek W. D., Golbs S., Eds.; Springer: Berlin, 1991; Vol. 14, pp 298–302. [DOI] [PubMed] [Google Scholar]
- Kang E.-H.; Ham J.-K.; Shim J.-M.; Lee J.-K.; Kim M.-R. Applications of pH Sensor Using a Covalent Bond Indicator Based on Containing Functional Group Copolymer. Mol. Cryst. Liq. Cryst. 2006, 445, 285–575. 10.1080/15421400500366779. [DOI] [Google Scholar]
- Walt D. R. Fiber Optic Imaging Sensors. Acc. Chem. Res. 1998, 31, 267–278. 10.1021/ar970069k. [DOI] [Google Scholar]
- Huang S.-H.; Huang K.-S.; Liou Y.-M. Simultaneous Monitoring of Oxygen Consumption and Acidification Rates of a Single Zebrafish Embryo during Embryonic Development within a Microfluidic Device. Microfluid. Nanofluid. 2017, 21, 3. 10.1007/s10404-016-1841-z. [DOI] [Google Scholar]
- Beija M.; Afonso C. A. M.; Martinho J. M. G. Synthesis and Applications of Rhodamine Derivatives as Fluorescent Probes. Chem. Soc. Rev. 2009, 38, 2410. 10.1039/b901612k. [DOI] [PubMed] [Google Scholar]
- Koide Y.; Urano Y.; Hanaoka K.; Terai T.; Nagano T. Evolution of Group 14 Rhodamines as Platforms for Near-Infrared Fluorescence Probes Utilizing Photoinduced Electron Transfer. ACS Chem. Biol. 2011, 6, 600–608. 10.1021/cb1002416. [DOI] [PubMed] [Google Scholar]
- Zhou K.; Wang Y.; Huang X.; Luby-Phelps K.; Sumer B. D.; Gao J. Tunable, Ultrasensitive pH-Responsive Nanoparticles Targeting Specific Endocytic Organelles in Living Cells. Angew. Chem., Int. Ed. 2011, 50, 6109–6114. 10.1002/anie.201100884. [DOI] [PMC free article] [PubMed] [Google Scholar]
- Yuan L.; Lin W.; Feng Y. A Rational Approach to Tuning the PKa Values of Rhodamines for Living Cell Fluorescence Imaging. Org. Biomol. Chem. 2011, 9, 1723–1726. 10.1039/c0ob01045f. [DOI] [PubMed] [Google Scholar]
- Li Z.; Wu S.; Han J.; Han S. Imaging of Intracellular Acidic Compartments with a Sensitive Rhodamine Based Fluorogenic pH Sensor. Analyst 2011, 136, 3698–3706. 10.1039/c1an15108h. [DOI] [PubMed] [Google Scholar]
- Best Q. A.; Xu R.; McCarroll M. E.; Wang L.; Dyer D. J. Design and Investigation of a Series of Rhodamine-Based Fluorescent Probes for Optical Measurements of pH. Org. Lett. 2010, 12, 3219–3221. 10.1021/ol1011967. [DOI] [PMC free article] [PubMed] [Google Scholar]
- Zhang W.; Tang B.; Liu X.; Liu Y.; Xu K.; Ma J.; Tong L.; Yang G. A Highly Sensitive Acidic pH Fluorescent Probe and Its Application to HepG2 Cells. Analyst 2009, 134, 367–371. 10.1039/B807581F. [DOI] [PubMed] [Google Scholar]
- Kim H. N.; Lee M. H.; Kim H. J.; Kim J. S.; Yoon J. A New Trend in Rhodamine-Based Chemosensors: Application of Spirolactam Ring-Opening to Sensing Ions. Chem. Soc. Rev. 2008, 37, 1465–1472. 10.1039/b802497a. [DOI] [PubMed] [Google Scholar]
- Di Paolo M.; Roberti M. J.; Bordoni A. V.; Aramendía P. F.; Wolosiuk A.; Bossi M. L. Nanoporous Silica Nanoparticles Functionalized with a Fluorescent Turn-on Spirorhodamineamide as pH Indicators. Photochem. Photobiol. Sci. 2019, 18, 155–165. 10.1039/C8PP00133B. [DOI] [PubMed] [Google Scholar]
- Taweetanavanich T.; Wanno B.; Tuntulani T.; Pulpoka B.; Kaewtong C. A pH Optical and Fluorescent Sensor Based on Rhodamine Modified on Activated Cellulose Paper. J. Chin. Chem. Soc. 2019, 66, 493–499. 10.1002/jccs.201800327. [DOI] [Google Scholar]
- Stratton S. G.; Taumoefolau G. H.; Purnell G. E.; Rasooly M.; Czaplyski W. L.; Harbron E. J. Tuning the p Ka of Fluorescent Rhodamine pH Probes through Substituent Effects. Chem. - Eur. J. 2017, 23, 14064–14072. 10.1002/chem.201703176. [DOI] [PubMed] [Google Scholar]
- Yu K.-K.; Li K.; Hou J.-T.; Yang J.; Xie Y.-M.; Yu X.-Q. Rhodamine Based pH-Sensitive “Intelligent” Polymers as Lysosome Targeting Probes and Their Imaging Applications in Vivo. Polym. Chem. 2014, 5, 5804–5812. 10.1039/C4PY00646A. [DOI] [Google Scholar]
- Ma Q.-J.; Li H.-P.; Yang F.; Zhang J.; Wu X.-F.; Bai Y.; Li X.-F. A Fluorescent Sensor for Low pH Values Based on a Covalently Immobilized Rhodamine–Napthalimide Conjugate. Sens. Actuators, B 2012, 166–167, 68–74. 10.1016/j.snb.2011.12.025. [DOI] [Google Scholar]
- Li Z.-Z.; Niu C.-G.; Zeng G.-M.; Liu Y.-G.; Gao P.-F.; Huang G.-H.; Mao Y.-A. A Novel Fluorescence Ratiometric pH Sensor Based on Covalently Immobilized Piperazinyl −1,8 -Napthalimide and Benzothioxanthene. Sens. Actuators, B 2006, 114, 308–315. 10.1016/j.snb.2005.05.018. [DOI] [Google Scholar]
- Wang X.-Y.; Huang D.-W.; Niu C.-G.; Guo L.-J.; Cui J.-J.; Hu L.-Y.; Zeng G.-M. An Internal Reference Fluorescent pH Sensor with Two pH-Sensitive Fluorophores Carrier. Sens. Actuators, B 2016, 234, 593–601. 10.1016/j.snb.2016.05.036. [DOI] [Google Scholar]
- Qi J.; Liu D.; Liu X.; Guan S.; Shi F.; Chang H.; He H.; Yang G. Fluorescent pH Sensors for Broad-Range pH Measurement Based on a Single Fluorophore. Anal. Chem. 2015, 87, 5897–5904. 10.1021/acs.analchem.5b00053. [DOI] [PubMed] [Google Scholar]
- Tian Y.; Su F.; Weber W.; Nandakumar V.; Shumway B. R.; Jin Y.; Zhou X.; Holl M. R.; Johnson R. H.; Meldrum D. R. A Series of Naphthalimide Derivatives as Intra and Extracellular pH Sensors. Biomaterials 2010, 31, 7411–7422. 10.1016/j.biomaterials.2010.06.023. [DOI] [PMC free article] [PubMed] [Google Scholar]
- Jin W.; Wu L.; Song Y.; Jiang J.; Zhu X.; Yang D.; Bai C. Continuous Intra-Arterial Blood pH Monitoring by a Fiber-Optic Fluorosensor. IEEE Trans. Biomed. Eng. 2011, 58, 1232–1238. 10.1109/TBME.2011.2107514. [DOI] [PubMed] [Google Scholar]
- Kriltz A.; Löser C.; Mohr G. J.; Trupp S. Covalent Immobilization of a Fluorescent pH-Sensitive Naphthalimide Dye in Sol–Gel Films. J. Sol-Gel Sci. Technol. 2012, 63, 23–29. 10.1007/s10971-012-2757-z. [DOI] [Google Scholar]
- Niu C.-G.; Zeng G.-M.; Chen L.-X.; Shen G.-L.; Yu R.-Q. Proton “‘off-on’” Behaviour of Methylpiperazinyl Derivative of Naphthalimide: A pH Sensor Based on Fluorescence Enhancement. Analyst 2004, 129, 20–24. 10.1039/B309594K. [DOI] [PubMed] [Google Scholar]
- Doussineau T.; Trupp S.; Mohr G. J. Ratiometric pH-Nanosensors Based on Rhodamine-Doped Silica Nanoparticles Functionalized with a Naphthalimide Derivative. J. Colloid Interface Sci. 2009, 339, 266–270. 10.1016/j.jcis.2009.07.044. [DOI] [PubMed] [Google Scholar]
- Wan X.; Wang D.; Liu S. Fluorescent pH-Sensing Organic/Inorganic Hybrid Mesoporous Silica Nanoparticles with Tunable Redox-Responsive Release Capability. Langmuir 2010, 26, 15574–15579. 10.1021/la102148x. [DOI] [PubMed] [Google Scholar]
- Trupp S.; Hoffmann P.; Henkel T.; Mohr G. J. Novel pH Indicator Dyes for Array Preparation via NHS Ester Activation or Solid-Phase Organic Synthesis. Org. Biomol. Chem. 2008, 6, 4319–4322. 10.1039/b814683g. [DOI] [PubMed] [Google Scholar]
- Gunnlaugsson T.; McCoy C. P.; Morrow R. J.; Phelan C.; Stomeo F. Towards the Development of Controllable and Reversible ‘on-off’Luminescence Switching in Soft-Matter; Synthesis and Spectroscopic Investigation of 1, 8-Naphthalimide-Based PET (Photoinduced Electron Transfer) Chemosensors for pH in Water-Permeable Hydrogels. Arkivoc 2003, 7, 216–228. 10.3998/ark.5550190.0004.719. [DOI] [Google Scholar]
- Grabchev I.; Qian X.; Xiao Y.; Zhang R. Novel Heterogeneous PET Fluorescent Sensors Selective for Transition Metal Ions or Protons: Polymers Regularly Labelled with Naphthalimide. New J. Chem. 2002, 26, 920–925. 10.1039/b111519g. [DOI] [Google Scholar]
- Tian H.; Gan J.; Chen K.; He J.; Song Q. L.; Hou X. Y. Positive and Negative Fluorescent Imaging Induced by Naphthalimide Polymers. J. Mater. Chem. 2002, 12, 1262–1267. 10.1039/b200509c. [DOI] [Google Scholar]
- Jacquemin D.; Perpète E. A.; Scalmani G.; Ciofini I.; Peltier C.; Adamo C. Absorption and Emission Spectra of 1, 8-Naphthalimide Fluorophores: A PCM-TD-DFT Investigation. Chem. Phys. 2010, 372, 61–66. 10.1016/j.chemphys.2010.04.032. [DOI] [Google Scholar]
- Duke R. M.; Veale E. B.; Pfeffer F. M.; Kruger P. E.; Gunnlaugsson T. Colorimetric and Fluorescent Anion Sensors: An Overview of Recent Developments in the Use of 1,8-Naphthalimide-Based Chemosensors. Chem. Soc. Rev. 2010, 39, 3936–3953. 10.1039/b910560n. [DOI] [PubMed] [Google Scholar]
- Mohr G. J. Synthesis of Naphthalimide-Based Indicator Dyes with a 2-Hydroxyethylsulfonyl Function for Covalent Immobilisation to Cellulose. Sens. Actuators, B 2018, 275, 439–445. 10.1016/j.snb.2018.07.095. [DOI] [Google Scholar]
- Al Kobaisi M.; Bhosale S. V.; Latham K.; Raynor A. M.; Bhosale S. V. Functional Naphthalene Diimides: Synthesis, Properties, and Applications. Chem. Rev. 2016, 116, 11685–11796. 10.1021/acs.chemrev.6b00160. [DOI] [PubMed] [Google Scholar]
- Shen L.; Lu X.; Tian H.; Zhu W. A Long Wavelength Fluorescent Hydrophilic Copolymer Based on Naphthalenediimide as pH Sensor with Broad Linear Response Range. Macromolecules 2011, 44, 5612–5618. 10.1021/ma200736t. [DOI] [Google Scholar]
- Aigner D.; Dmitriev R. I.; Borisov S. M.; Papkovsky D. B.; Klimant I. pH-Sensitive Perylene Bisimide Probes for Live Cell Fluorescence Lifetime Imaging. J. Mater. Chem. B 2014, 2, 6792–6801. 10.1039/C4TB01006J. [DOI] [PubMed] [Google Scholar]
- Pfeifer D.; Klimant I.; Borisov S. M. Ultrabright Red-Emitting Photostable Perylene Bisimide Dyes: New Indicators for Ratiometric Sensing of High pH or Carbon Dioxide. Chem. - Eur. J. 2018, 24, 10711–10720. 10.1002/chem.201800867. [DOI] [PMC free article] [PubMed] [Google Scholar]
- Würthner F.; Stepanenko V.; Chen Z.; Saha-Möller C. R.; Kocher N.; Stalke D. Preparation and Characterization of Regioisomerically Pure 1,7-Disubstituted Perylene Bisimide Dyes. J. Org. Chem. 2004, 69, 7933–7939. 10.1021/jo048880d. [DOI] [PubMed] [Google Scholar]
- Loudet A.; Burgess K. BODIPY Dyes and Their Derivatives: Syntheses and Spectroscopic Properties. Chem. Rev. 2007, 107, 4891–4932. 10.1021/cr078381n. [DOI] [PubMed] [Google Scholar]
- Boens N.; Leen V.; Dehaen W. Fluorescent Indicators Based on BODIPY. Chem. Soc. Rev. 2012, 41, 1130–1172. 10.1039/C1CS15132K. [DOI] [PubMed] [Google Scholar]
- Wood T. E.; Thompson A. Advances in the Chemistry of Dipyrrins and Their Complexes. Chem. Rev. 2007, 107, 1831–1861. 10.1021/cr050052c. [DOI] [PubMed] [Google Scholar]
- Loudet A.; Burgess K.. BODIPY Dyes and Their Derivatives: Syntheses and Spectroscopic Properties. In Handbook of Porphyrin Science, Vol. 8; World Scientific Publishing Company, 2010; Vol. 10, pp 1–164. [Google Scholar]
- Kowada T.; Maeda H.; Kikuchi K. BODIPY-Based Probes for the Fluorescence Imaging of Biomolecules in Living Cells. Chem. Soc. Rev. 2015, 44, 4953–4972. 10.1039/C5CS00030K. [DOI] [PubMed] [Google Scholar]
- Ni Y.; Wu J. Far-Red and near Infrared BODIPY Dyes: Synthesis and Applications for Fluorescent pH Probes and Bio-Imaging. Org. Biomol. Chem. 2014, 12, 3774–3791. 10.1039/c3ob42554a. [DOI] [PubMed] [Google Scholar]
- Baki C. N.; Akkaya E. U. Boradiazaindacene-Appended Calix [4] Arene: Fluorescence Sensing of pH near Neutrality. J. Org. Chem. 2001, 66, 1512–1513. 10.1021/jo005706q. [DOI] [PubMed] [Google Scholar]
- Baruah M.; Qin W.; Basarić N.; De Borggraeve W. M.; Boens N. BODIPY-Based Hydroxyaryl Derivatives as Fluorescent pH Probes. J. Org. Chem. 2005, 70, 4152–4157. 10.1021/jo0503714. [DOI] [PubMed] [Google Scholar]
- Gareis T.; Huber C.; Wolfbeis O. S.; Daub J. Phenol/Phenolate-Dependent on/off Switching of the Luminescence of 4,4-Difluoro-4-Bora-3a,4a-Diaza-s-Indacenes. Chem. Commun. 1997, (18), 1717–1718. 10.1039/a703536e. [DOI] [Google Scholar]
- Tian M.; Peng X.; Feng F.; Meng S.; Fan J.; Sun S. Fluorescent pH Probes Based on Boron Dipyrromethene Dyes. Dyes Pigm. 2009, 81, 58–62. 10.1016/j.dyepig.2008.09.004. [DOI] [Google Scholar]
- Qin W.; Baruah M.; De Borggraeve W. M.; Boens N. Photophysical Properties of an on/off Fluorescent pH Indicator Excitable with Visible Light Based on a Borondipyrromethene-Linked Phenol. J. Photochem. Photobiol., A 2006, 183, 190–197. 10.1016/j.jphotochem.2006.03.015. [DOI] [Google Scholar]
- Qin W.; Baruah M.; Stefan A.; Van der Auweraer M.; Boens N. Photophysical Properties of BODIPY-Derived Hydroxyaryl Fluorescent pH Probes in Solution. ChemPhysChem 2005, 6, 2343–2351. 10.1002/cphc.200500341. [DOI] [PubMed] [Google Scholar]
- Bartelmess J.; Weare W. W.; Latortue N.; Duong C.; Jones D. S. Meso-Pyridyl BODIPYs with Tunable Chemical, Optical and Electrochemical Properties. New J. Chem. 2013, 37, 2663–2668. 10.1039/c3nj00426k. [DOI] [Google Scholar]
- Rurack K.; Kollmannsberger M.; Daub J. A Highly Efficient Sensor Molecule Emitting in the near Infrared (NIR): 3,5-Distyryl-8-(p-Dimethylaminophenyl)Difluoroboradiaza-s-Indacene. New J. Chem. 2001, 25, 289–292. 10.1039/b007379m. [DOI] [Google Scholar]
- Zhang J.; Yang M.; Li C.; Dorh N.; Xie F.; Luo F.-T.; Tiwari A.; Liu H. Near-Infrared Fluorescent Probes Based on Piperazine-Functionalized BODIPY Dyes for Sensitive Detection of Lysosomal pH. J. Mater. Chem. B 2015, 3, 2173–2184. 10.1039/C4TB01878H. [DOI] [PubMed] [Google Scholar]
- Ziessel R.; Ulrich G.; Harriman A.; Alamiry M. A. H.; Stewart B.; Retailleau P. Solid-State Gas Sensors Developed from Functional Difluoroboradiazaindacene Dyes. Chem. - Eur. J. 2009, 15, 1359–1369. 10.1002/chem.200801911. [DOI] [PubMed] [Google Scholar]
- Deniz E.; Isbasar G. C.; Bozdemir Ö. A.; Yildirim L. T.; Siemiarczuk A.; Akkaya E. U. Bidirectional Switching of Near IR Emitting Boradiazaindacene Fluorophores. Org. Lett. 2008, 10, 3401–3403. 10.1021/ol801062h. [DOI] [PubMed] [Google Scholar]
- Baruah M.; Qin W.; Flors C.; Hofkens J.; Vallée R. A. L.; Beljonne D.; Van der Auweraer M.; De Borggraeve W. M.; Boens N. Solvent and pH Dependent Fluorescent Properties of a Dimethylaminostyryl Borondipyrromethene Dye in Solution. J. Phys. Chem. A 2006, 110, 5998–6009. 10.1021/jp054878u. [DOI] [PubMed] [Google Scholar]
- Ando Y.; Iino S.; Yamada K.; Umezawa K.; Iwasawa N.; Citterio D.; Suzuki K. A Ratiometric Fluorescent pH Glass Optode Based on a Boron-Dipyrromethene Derivative. Sens. Actuators, B 2007, 121, 74–82. 10.1016/j.snb.2006.09.004. [DOI] [Google Scholar]
- Hecht M.; Kraus W.; Rurack K. A Highly Fluorescent pH Sensing Membrane for the Alkaline pH Range Incorporating a BODIPY Dye. Analyst 2013, 138, 325–332. 10.1039/C2AN35860C. [DOI] [PubMed] [Google Scholar]
- Strobl M.; Rappitsch T.; Borisov S. M.; Mayr T.; Klimant I. NIR-Emitting Aza-BODIPY Dyes – New Building Blocks for Broad-Range Optical pH Sensors. Analyst 2015, 140, 7150–7153. 10.1039/C5AN01389E. [DOI] [PubMed] [Google Scholar]
- Murtagh J.; Frimannsson D. O.; O’Shea D. F. Azide Conjugatable and pH Responsive Near-Infrared Fluorescent Imaging Probes. Org. Lett. 2009, 11, 5386–5389. 10.1021/ol902140v. [DOI] [PubMed] [Google Scholar]
- McDonnell S. O.; O’Shea D. F. Near-Infrared Sensing Properties of Dimethlyamino-Substituted BF 2 – Azadipyrromethenes. Org. Lett. 2006, 8, 3493–3496. 10.1021/ol061171x. [DOI] [PubMed] [Google Scholar]
- Killoran J.; McDonnell S. O.; Gallagher J. F.; O’Shea D. F. A Substituted BF2 -Chelated Tetraarylazadipyrromethene as an Intrinsic Dual Chemosensor in the 650–850 Nm Spectral Range. New J. Chem. 2008, 32, 483–489. 10.1039/B713020A. [DOI] [Google Scholar]
- Salim M. M.; Owens E. A.; Gao T.; Lee J. H.; Hyun H.; Choi H. S.; Henary M. Hydroxylated Near-Infrared BODIPY Fluorophores as Intracellular pH Sensors. Analyst 2014, 139, 4862–4873. 10.1039/C4AN01104J. [DOI] [PMC free article] [PubMed] [Google Scholar]
- Staudinger C.; Breininger J.; Klimant I.; Borisov S. M. Near-Infrared Fluorescent Aza-BODIPY Dyes for Sensing and Imaging of pH from the Neutral to Highly Alkaline Range. Analyst 2019, 144, 2393–2402. 10.1039/C9AN00118B. [DOI] [PubMed] [Google Scholar]
- Aigner D.; Ungerböck B.; Mayr T.; Saf R.; Klimant I.; Borisov S. M. Fluorescent Materials for pH Sensing and Imaging Based on Novel 1, 4-Diketopyrrolo-[3, 4-c] Pyrrole Dyes. J. Mater. Chem. C 2013, 1, 5685–5693. 10.1039/c3tc31130a. [DOI] [PMC free article] [PubMed] [Google Scholar]
- Schutting S.; Borisov S. M.; Klimant I. Diketo-Pyrrolo-Pyrrole Dyes as New Colorimetric and Fluorescent pH Indicators for Optical Carbon Dioxide Sensors. Anal. Chem. 2013, 85, 3271–3279. 10.1021/ac303595v. [DOI] [PubMed] [Google Scholar]
- Yamagata T.; Kuwabara J.; Kanbara T. Synthesis of Highly Fluorescent Diketopyrrolopyrrole Derivative and Two-Step Response of Fluorescence to Acid. Tetrahedron Lett. 2010, 51, 1596–1599. 10.1016/j.tetlet.2010.01.069. [DOI] [Google Scholar]
- Veselov A.; Thür C.; Efimov A.; Guina M.; Lemmetyinen H.; Tkachenko N. Acidity Sensor Based on Porphyrin Self-Assembled Monolayers Covalently Attached to the Surfaces of Tapered Fibres. Meas. Sci. Technol. 2010, 21, 115205. 10.1088/0957-0233/21/11/115205. [DOI] [Google Scholar]
- Niu C.-G.; Gui X.-Q.; Zeng G.-M.; Guan A.-L.; Gao P.-F.; Qin P.-Z. Fluorescence Ratiometric pH Sensor Prepared from Covalently Immobilized Porphyrin and Benzothioxanthene. Anal. Bioanal. Chem. 2005, 383, 349–357. 10.1007/s00216-005-3422-y. [DOI] [PubMed] [Google Scholar]
- Huang H.; Chauhan S.; Geng J.; Qin Y.; Watson D. F.; Lovell J. F. Implantable Tin Porphyrin-PEG Hydrogels with pH-Responsive Fluorescence. Biomacromolecules 2017, 18, 562–567. 10.1021/acs.biomac.6b01715. [DOI] [PMC free article] [PubMed] [Google Scholar]
- Bosson J.; Gouin J.; Lacour J. Cationic Triangulenes and Helicenes: Synthesis, Chemical Stability, Optical Properties and Extended Applications of These Unusual Dyes. Chem. Soc. Rev. 2014, 43, 2824–2840. 10.1039/c3cs60461f. [DOI] [PubMed] [Google Scholar]
- Rich R. M.; Stankowska D. L.; Maliwal B. P.; Sørensen T. J.; Laursen B. W.; Krishnamoorthy R. R.; Gryczynski Z.; Borejdo J.; Gryczynski I.; Fudala R. Elimination of Autofluorescence Background from Fluorescence Tissue Images by Use of Time-Gated Detection and the AzaDiOxaTriAngulenium (ADOTA) Fluorophore. Anal. Bioanal. Chem. 2013, 405, 2065–2075. 10.1007/s00216-012-6623-1. [DOI] [PMC free article] [PubMed] [Google Scholar]
- Frankær C. G.; Rosenberg M.; Santella M.; Hussain K. J.; Laursen B. W.; Sørensen T. J. Tuning the pKa of a pH Responsive Fluorophore and the Consequences for Calibration of Optical Sensors Based on a Single Fluorophore but Multiple Receptors. ACS Sens. 2019, 4, 764–773. 10.1021/acssensors.9b00148. [DOI] [PubMed] [Google Scholar]
- Frankær C. G.; Hussain K. J.; Rosenberg M.; Jensen A.; Laursen B. W.; Sørensen T. J. Biocompatible Microporous Organically Modified Silicate Material with Rapid Internal Diffusion of Protons. ACS Sens. 2018, 3, 692–699. 10.1021/acssensors.8b00024. [DOI] [PubMed] [Google Scholar]
- Rosenberg M.; Laursen B. W.; Frankaer C. G.; Sørensen T. J. A Fluorescence Intensity Ratiometric Fiber Optics-Based Chemical Sensor for Monitoring pH. Adv. Mater. Technol. 2018, 3, 1800205. 10.1002/admt.201800205. [DOI] [Google Scholar]
- Frankær C. G.; Hussain K. J.; Dörge T. C.; Sørensen T. J. Optical Chemical Sensor Using Intensity Ratiometric Fluorescence Signals for Fast and Reliable pH Determination. ACS Sens. 2019, 4, 26–31. 10.1021/acssensors.8b01485. [DOI] [PubMed] [Google Scholar]
- Sørensen T. J.; Rosenberg M.; Frankær C. G.; Laursen B. W. An Optical pH Sensor Based on Diazaoxatriangulenium and Isopropyl-Bridged Diazatriangulenium Covalently Bound in a Composite Sol–Gel. Adv. Mater. Technol. 2018, 4, 1800561. 10.1002/admt.201800561. [DOI] [Google Scholar]
- Dalfen I.; Dmitriev R. I.; Holst G.; Klimant I.; Borisov S. M. Background-Free Fluorescence Decay Time Sensing and Imaging of pH with Highly Photostable Diazaoxotriangulenium Dyes. Anal. Chem. 2019, 91, 808–816. 10.1021/acs.analchem.8b02534. [DOI] [PubMed] [Google Scholar]
- Horak E.; Kassal P.; Hranjec M.; Steinberg I. M. Benzimidazole Functionalised Schiff Bases: Novel pH Sensitive Fluorescence Turn-on Chromoionophores for Ion-Selective Optodes. Sens. Actuators, B 2018, 258, 415–423. 10.1016/j.snb.2017.11.121. [DOI] [Google Scholar]
- Kim S.; Pudavar H. E.; Prasad P. N. Dye-Concentrated Organically Modified Silica Nanoparticles as a Ratiometric Fluorescent pH Probe by One- and Two-Photon Excitation. Chem. Commun. 2006, (19), 2071–2073. 10.1039/b600926c. [DOI] [PubMed] [Google Scholar]
- Kim D.-Y.; Kim H. J. pH-Sensitive Optode Membrane Covalently Incorporated with an ICT Dye for Low pH Values. Sens. Actuators, B 2015, 206, 508–515. 10.1016/j.snb.2014.09.096. [DOI] [Google Scholar]
- Tian Y.; Fuller E.; Klug S.; Lee F.; Su F.; Zhang L.; Chao S.; Meldrum D. R. A Fluorescent Colorimetric pH Sensor and the Influences of Matrices on Sensing Performances. Sens. Actuators, B 2013, 188, 1–10. 10.1016/j.snb.2013.06.098. [DOI] [PMC free article] [PubMed] [Google Scholar]
- Sreejith S.; Divya K. P.; Ajayaghosh A. A Near-Infrared Squaraine Dye as a Latent Ratiometric Fluorophore for the Detection of Aminothiol Content in Blood Plasma. Angew. Chem., Int. Ed. 2008, 47, 7883–7887. 10.1002/anie.200803194. [DOI] [PubMed] [Google Scholar]
- Chen C.-T.; Marder S. R.; Cheng L.-T. Syntheses and Linear and Nonlinear Optical Properties of Unsymmetrical Squaraines with Extended Conjugation. J. Am. Chem. Soc. 1994, 116, 3117–3118. 10.1021/ja00086a049. [DOI] [Google Scholar]
- Xue L.; Li B.; Fei Q.; Feng G.; Huan Y.; Shi Z. Carboxylate-Modified Squaraine Dye Doped Silica Fluorescent pH Nanosensors. Nanotechnology 2010, 21, 215502. 10.1088/0957-4484/21/21/215502. [DOI] [PubMed] [Google Scholar]
- Badugu R.; Kostov Y.; Rao G.; Tolosa L. Development and Application of an Excitation Ratiometric Optical pH Sensor for Bioprocess Monitoring. Biotechnol. Prog. 2008, 24, 1393–1401. 10.1002/btpr.66. [DOI] [PubMed] [Google Scholar]
- Ryder A. G.; Power S.; Glynn T. J. Evaluation of Acridine in Nafion as a Fluorescence-Lifetime-Based pH Sensor. Appl. Spectrosc. 2003, 57, 73–79. 10.1366/000370203321165232. [DOI] [PubMed] [Google Scholar]
- Sun W.-C.; Gee K. R.; Klaubert D. H.; Haugland R. P. Synthesis of Fluorinated Fluoresceins. J. Org. Chem. 1997, 62, 6469–6475. 10.1021/jo9706178. [DOI] [Google Scholar]
- Mchedlov-Petrossyan N. O.; Rubtsov M. I.; Lukatskaya L. L. Ionization and Tautomerism of Chloro-Derivatives of Fluorescein in Water and Aqueous Acetone. Dyes Pigm. 1992, 18, 179–198. 10.1016/0143-7208(92)87002-I. [DOI] [Google Scholar]
- CRC Handbook of Chemistry and Physics: A Ready-Reference Book of Chemical and Physical Data, 96th ed., 2015–2016; Haynes W. M., Lide D. R., Eds.; CRC Press: Boca Raton, FL, 2015. [Google Scholar]
- Staudinger C.; Strobl M.; Fischer J. P.; Thar R.; Mayr T.; Aigner D.; Müller B. J.; Müller B.; Lehner P.; Mistlberger G.; Fritzsche E.; Ehgartner J.; Zach P. W.; Clarke J. S.; Geißler F.; Mutzberg A.; Müller J. D.; Achterberg E. P.; Borisov S. M.; Klimant I. A Versatile Optode System for Oxygen, Carbon Dioxide, and pH Measurements in Seawater with Integrated Battery and Logger. Limnol. Oceanogr.: Methods 2018, 16, 459–473. 10.1002/lom3.10260. [DOI] [Google Scholar]
- Pfeifer D.; Russegger A.; Klimant I.; Borisov S. M. Green to Red Emitting BODIPY Dyes for Fluorescent Sensing and Imaging of Carbon Dioxide. Sens. Actuators, B 2020, 304, 127312. 10.1016/j.snb.2019.127312. [DOI] [Google Scholar]
- Giordano P.; Bock C.; Wrighton M. Excited-State Proton-Transfer of Ruthenium(Ii) Complexes of 4,7-Dihydroxy-1,10-Phenanthroline - Increased Acidity in Excited-State. J. Am. Chem. Soc. 1978, 100, 6960–6965. 10.1021/ja00490a032. [DOI] [Google Scholar]
- Nazeeruddin M.; Kalyanasundaram K. Acid-Base Behavior in the Ground and Excited-States of Ruthenium(II) Complexes Containing Tetraimines or Dicarboxybipyridines as Protonatable Ligands. Inorg. Chem. 1989, 28, 4251–4259. 10.1021/ic00322a015. [DOI] [Google Scholar]
- Cargill Thompson A. M. W.; Smailes M. C. C.; Jeffery J. C.; Ward M. D. Ruthenium Tris-(Bipyridyl) Complexes with Pendant Protonatable Anddeprotonatable Moieties: pH Sensitivity of Electronic Spectral Andluminescence Properties. J. Chem. Soc., Dalton Trans. 1997, (5), 737–744. 10.1039/a607181c. [DOI] [Google Scholar]
- Wong K. M.-C.; Tang W.-S.; Lu X.-X.; Zhu N.; Yam V. W.-W. Functionalized Platinum(II) Terpyridyl Alkynyl Complexes as Colorimetric and Luminescence pH Sensors. Inorg. Chem. 2005, 44, 1492–1498. 10.1021/ic049079p. [DOI] [PubMed] [Google Scholar]
- Zhang X.; Jiao Y.; Jing X.; Wu H.; He G.; Duan C. pH-Sensitive Fluorescent Sensors Based on Europium(III) Complexes. Dalton Trans. 2011, 40, 2522–2527. 10.1039/c0dt01325k. [DOI] [PubMed] [Google Scholar]
- Gunnlaugsson T.; Leonard J. P.; Sénéchal K.; Harte A. J. pH Responsive Eu(III)-Phenanthroline Supramolecular Conjugate: Novel “off-on-off” Luminescent Signaling in the Physiological pH Range. J. Am. Chem. Soc. 2003, 125, 12062–12063. 10.1021/ja035425a. [DOI] [PubMed] [Google Scholar]
- Bai G.-Y.; Wang K.-Z.; Duan Z.-M.; Gao L.-H. Luminescent pH Sensing and DNA Binding Properties of a Novel Ruthenium(II) Complex. J. Inorg. Biochem. 2004, 98, 1017–1022. 10.1016/j.jinorgbio.2004.02.021. [DOI] [PubMed] [Google Scholar]
- Wong K.-H.; Chan M. C.-W.; Che C.-M. Modular Cyclometalated Platinum(II) Complexes as Luminescent Molecular Sensors for pH and Hydrophobic Binding Regions. Chem. - Eur. J. 1999, 5, 2845–2849. 10.1002/(SICI)1521-3765(19991001)5:10<2845::AID-CHEM2845>3.0.CO;2-G. [DOI] [Google Scholar]
- Liu M.; Ye Z.; Xin C.; Yuan J. Development of a Ratiometric Time-Resolved Luminescence Sensor for pH Based on Lanthanide Complexes. Anal. Chim. Acta 2013, 761, 149–156. 10.1016/j.aca.2012.11.025. [DOI] [PubMed] [Google Scholar]
- Higgins B.; DeGraff B. A.; Demas J. N. Luminescent Transition Metal Complexes as Sensors: Structural Effects on pH Response. Inorg. Chem. 2005, 44, 6662–6669. 10.1021/ic050044e. [DOI] [PubMed] [Google Scholar]
- Hynes J.; O’Riordan T. C.; Zhdanov A. V.; Uray G.; Will Y.; Papkovsky D. B. In Vitro Analysis of Cell Metabolism Using a Long-Decay pH-Sensitive Lanthanide Probe and Extracellular Acidification Assay. Anal. Biochem. 2009, 390, 21–28. 10.1016/j.ab.2009.04.016. [DOI] [PubMed] [Google Scholar]
- Lobnik A.; Majcen N.; Niederreiter K.; Uray G. Optical pH Sensor Based on the Absorption of Antenna Generated Europium Luminescence by Bromothymolblue in a Sol–Gel Membrane. Sens. Actuators, B 2001, 74, 200–206. 10.1016/S0925-4005(00)00734-6. [DOI] [Google Scholar]
- Price J. M.; Xu W. Y.; Demas J. N.; DeGraff B. A. Polymer-Supported pH Sensors Based on Hydrophobically Bound Luminescent Ruthenium(II) Complexes. Anal. Chem. 1998, 70, 265–270. 10.1021/ac9707848. [DOI] [Google Scholar]
- Chan C.-M.; Wong K.-Y. Evaluation of a Luminescent Ruthenium Complex Immobilized inside Nafion as Optical pH Sensor. Analyst 1998, 123, 1843–1847. 10.1039/a802460j. [DOI] [Google Scholar]
- Malins C.; Glever H. G.; Keyes T. E.; Vos J. G.; Dressick W. J.; MacCraith B. D. Sol–Gel Immobilised Ruthenium(II) Polypyridyl Complexes as Chemical Transducers for Optical pH Sensing. Sens. Actuators, B 2000, 67, 89–95. 10.1016/S0925-4005(00)00411-1. [DOI] [Google Scholar]
- Clarke Y.; Xu W.; Demas J. N.; DeGraff B. A. Lifetime-Based pH Sensor System Based on a Polymer-Supported Ruthenium(II) Complex. Anal. Chem. 2000, 72, 3468–3475. 10.1021/ac000111g. [DOI] [PubMed] [Google Scholar]
- Gonçalves H. M. R.; Maule C. D.; Jorge P. A. S.; Esteves da Silva J. C. G. Fiber Optic Lifetime pH Sensing Based on Ruthenium(II) Complexes with Dicarboxybipyridine. Anal. Chim. Acta 2008, 626, 62–70. 10.1016/j.aca.2008.07.044. [DOI] [PubMed] [Google Scholar]
- Blair S.; Lowe M. P.; Mathieu C. E.; Parker D.; Senanayake P. K.; Kataky R. Narrow-Range Optical pH Sensors Based on Luminescent Europium and Terbium Complexes Immobilized in a Sol Gel Glass. Inorg. Chem. 2001, 40, 5860–5867. 10.1021/ic010371w. [DOI] [PubMed] [Google Scholar]
- McCoy C. P.; Stomeo F.; Plush S. E.; Gunnlaugsson T. Soft Matter pH Sensing: From Luminescent Lanthanide pH Switches in Solution to Sensing in Hydrogels. Chem. Mater. 2006, 18, 4336–4343. 10.1021/cm060603v. [DOI] [Google Scholar]
- Al-Qaysi W. W.; Duerkop A. Sensor and Sensor Microtiterplate with Expanded pH Detection Range and Their Use in Real Samples. Sens. Actuators, B 2019, 298, 126848. 10.1016/j.snb.2019.126848. [DOI] [Google Scholar]
- Tormo L.; Bustamante N.; Colmenarejo G.; Orellana G. Can Luminescent Ru(II) Polypyridyl Dyes Measure pH Directly?. Anal. Chem. 2010, 82, 5195–5204. 10.1021/ac1005266. [DOI] [PubMed] [Google Scholar]
- Marx D. Proton Transfer 200 Years after von Grotthuss: Insights from Ab Initio Simulations. ChemPhysChem 2006, 7, 1848–1870. 10.1002/cphc.200600128. [DOI] [PubMed] [Google Scholar]
- Peppas N. A.; Hilt J. Z.; Khademhosseini A.; Langer R. Hydrogels in Biology and Medicine: From Molecular Principles to Bionanotechnology. Adv. Mater. 2006, 18, 1345–1360. 10.1002/adma.200501612. [DOI] [Google Scholar]
- Lee K. Y.; Mooney D. J. Hydrogels for Tissue Engineering. Chem. Rev. 2001, 101, 1869–1880. 10.1021/cr000108x. [DOI] [PubMed] [Google Scholar]
- Gong J.; Venkateswaran S.; Tanner M. G.; Stone J. M.; Bradley M. Polymer Microarrays for the Discovery and Optimization of Robust Optical-Fiber-Based pH Sensors. ACS Comb. Sci. 2019, 21, 417–424. 10.1021/acscombsci.9b00031. [DOI] [PubMed] [Google Scholar]
- Refojo M. F. Hydrophobic Interaction in Poly(2-Hydroxyethyl Methacrylate) Homogeneous Hydrogel. J. Polym. Sci., Part A-1: Polym. Chem. 1967, 5, 3103–3113. 10.1002/pol.1967.150051211. [DOI] [PubMed] [Google Scholar]
- Furukawa M.; Kojio K.; Kugumiya S.; Uchiba Y.; Mitsui Y. Microphase Separation of Bulk and Ultrathin Films of Polyurethane Elastomers. Macromol. Symp. 2008, 267, 9–15. 10.1002/masy.200850702. [DOI] [Google Scholar]
- Petrini P.; Farè S.; Piva A.; Tanzi M. C. Design, Synthesis and Properties of Polyurethane Hydrogels for Tissue Engineering. J. Mater. Sci.: Mater. Med. 2003, 14, 683–686. 10.1023/A:1024955531173. [DOI] [PubMed] [Google Scholar]
- Barnard S.; Beckelmann D.; Berger J.; Rouilly M.; Waldner A.. Optical Sensor System for pH Determination Independently of the Ion Strength Using Fluorescein Bound to a Polymer via a Urethane and/or Urea Group. WO9747966 (A1), December 18, 1997.
- Kjær T.Enzyme Sensor Including a Water-Containing Spacer Layer. US20060275859A1, December 7, 2006.
- Hoare T. R.; Kohane D. S. Hydrogels in Drug Delivery: Progress and Challenges. Polymer 2008, 49, 1993–2007. 10.1016/j.polymer.2008.01.027. [DOI] [Google Scholar]
- HydroMed Products . http://www.advbiomaterials.com/products/hydrophilic/hydromed.html (accessed Jan 31, 2017).
- Wang X.; Meier R. J.; Wolfbeis O. S. Fluorescent pH-Sensitive Nanoparticles in an Agarose Matrix for Imaging of Bacterial Growth and Metabolism. Angew. Chem., Int. Ed. 2013, 52, 406–409. 10.1002/anie.201205715. [DOI] [PubMed] [Google Scholar]
- Stoy V. A. New Type of Hydrogel for Controlled Drug Delivery. J. Biomater. Appl. 1988, 3, 552–604. 10.1177/088532828800300403. [DOI] [PubMed] [Google Scholar]
- Huber C.; Krause C.; Werner T.; Wolfbeis O. S. Serum Chloride Optical Sensors Based on Dynamic Quenching of the Fluorescence of Photo-Immobilized Lucigenin. Microchim. Acta 2003, 142, 245–253. 10.1007/s00604-003-0034-0. [DOI] [Google Scholar]
- Westover D.; Rudolf Seitz W.; Lavine B. K. Synthesis and Evaluation of Nitrated Poly(4-Hydroxystyrene) Microspheres for pH Sensing. Microchem. J. 2003, 74, 121–129. 10.1016/S0026-265X(02)00178-9. [DOI] [Google Scholar]
- Krause C.; Werner T.; Huber C.; Wolfbeis O. S. Emulsion-Based Fluorosensors for Potassium Featuring Improved Stability and Signal Change. Anal. Chem. 1999, 71, 5304–5308. 10.1021/ac9907383. [DOI] [PubMed] [Google Scholar]
- Huber C.; Klimant I.; Krause C.; Werner T.; Wolfbeis O. S. Nitrate-Selective Optical Sensor Applying a Lipophilic Fluorescent Potential-Sensitive Dye. Anal. Chim. Acta 2001, 449, 81–93. 10.1016/S0003-2670(01)01363-0. [DOI] [Google Scholar]
- Papkovsky D. B.; Mohr G. J.; Wolfbeis O. S. New Polar Plasticizers for Luminescence-Based Sensors. Anal. Chim. Acta 1997, 337, 201–205. 10.1016/S0003-2670(96)00409-6. [DOI] [Google Scholar]
- Bakker E.; Bühlmann P.; Pretsch E. Carrier-Based Ion-Selective Electrodes and Bulk Optodes. 1. General Characteristics. Chem. Rev. 1997, 97, 3083–3132. 10.1021/cr940394a. [DOI] [PubMed] [Google Scholar]
- Derinkuyu S.; Ertekin K.; Oter O.; Denizalti S.; Cetinkaya E. Fiber Optic pH Sensing with Long Wavelength Excitable Schiff Bases in the pH Range of 7.0–12.0. Anal. Chim. Acta 2007, 588, 42–49. 10.1016/j.aca.2007.01.070. [DOI] [PubMed] [Google Scholar]
- Hakonen A.; Hulth S. A High-Precision Ratiometric Fluorosensor for pH: Implementing Time-Dependent Non-Linear Calibration Protocols for Drift Compensation. Anal. Chim. Acta 2008, 606, 63–71. 10.1016/j.aca.2007.10.035. [DOI] [PubMed] [Google Scholar]
- Choi M. F. Spectroscopic Behaviour of 8-Hydroxy-1,3,6-Pyrenetrisulphonate Immobilized in Ethyl Cellulose. J. Photochem. Photobiol., A 1997, 104, 207–212. 10.1016/S1010-6030(96)04559-5. [DOI] [Google Scholar]
- Kreuer K. D. On the Development of Proton Conducting Polymer Membranes for Hydrogen and Methanol Fuel Cells. J. Membr. Sci. 2001, 185, 29–39. 10.1016/S0376-7388(00)00632-3. [DOI] [Google Scholar]
- Vasil’ev V. V.; Borisov S. M.; Maldotti A.; Molinari A. Spectral Properties of Cationic Water-Soluble Metallo-Porphyrins Immobilized in a Perfluorosulfonated Ion-Exchange Membrane. J. Porphyrins Phthalocyanines 2003, 07, 780–786. 10.1142/S1088424603000963. [DOI] [Google Scholar]
- Heydari R.; Hosseini M.; Amraei A.; Mohammadzadeh A. Preparation of a Novel pH Optical Sensor Using Orange (II) Based on Agarose Membrane as Support. Mater. Sci. Eng., C 2016, 61, 333–337. 10.1016/j.msec.2015.12.051. [DOI] [PubMed] [Google Scholar]
- Vroman I.; Tighzert L. Biodegradable Polymers. Materials 2009, 2, 307–344. 10.3390/ma2020307. [DOI] [Google Scholar]
- Siracusa V.; Rocculi P.; Romani S.; Rosa M. D. Biodegradable Polymers for Food Packaging: A Review. Trends Food Sci. Technol. 2008, 19, 634–643. 10.1016/j.tifs.2008.07.003. [DOI] [Google Scholar]
- Burczak K.; Fujisato T.; Hatada M.; Ikada Y. Protein Permeation through Poly(Vinyl Alcohol) Hydrogel Membranes. Biomaterials 1994, 15, 231–238. 10.1016/0142-9612(94)90072-8. [DOI] [PubMed] [Google Scholar]
- Herzog C.; Poehler E.; Peretzki A. J.; Borisov S. M.; Aigner D.; Mayr T.; Nagl S. Continuous On-Chip Fluorescence Labelling, Free-Flow Isoelectric Focusing and Marker-Free Isoelectric Point Determination of Proteins and Peptides. Lab Chip 2016, 16, 1565–1572. 10.1039/C6LC00055J. [DOI] [PubMed] [Google Scholar]
- Browning M. B.; Wilems T.; Hahn M.; Cosgriff-Hernandez E. Compositional Control of Poly(Ethylene Glycol) Hydrogel Modulus Independent of Mesh Size. J. Biomed. Mater. Res., Part A 2011, 98A, 268–273. 10.1002/jbm.a.33109. [DOI] [PubMed] [Google Scholar]
- Canal T.; Peppas N. A. Correlation between Mesh Size and Equilibrium Degree of Swelling of Polymeric Networks. J. Biomed. Mater. Res. 1989, 23, 1183–1193. 10.1002/jbm.820231007. [DOI] [PubMed] [Google Scholar]
- Peppas N. A.; Moynihan H. J.; Lucht L. M. The Structure of Highly Crosslinked Poly(2-Hydroxyethyl Methacrylate) Hydrogels. J. Biomed. Mater. Res. 1985, 19, 397–411. 10.1002/jbm.820190405. [DOI] [PubMed] [Google Scholar]
- Herzog C.; Beckert E.; Nagl S. Rapid Isoelectric Point Determination in a Miniaturized Preparative Separation Using Jet-Dispensed Optical pH Sensors and Micro Free-Flow Electrophoresis. Anal. Chem. 2014, 86, 9533–9539. 10.1021/ac501783r. [DOI] [PubMed] [Google Scholar]
- Su F.; Agarwal S.; Pan T.; Qiao Y.; Zhang L.; Shi Z.; Kong X.; Day K.; Chen M.; Meldrum D.; et al. Multifunctional pHPMA-Derived Polymer for Ratiometric pH Sensing, Fluorescence Imaging, and Magnetic Resonance Imaging. ACS Appl. Mater. Interfaces 2018, 10, 1556–1565. 10.1021/acsami.7b15796. [DOI] [PubMed] [Google Scholar]
- Hennink W. E.; van Nostrum C. F. Novel Crosslinking Methods to Design Hydrogels. Adv. Drug Delivery Rev. 2002, 54, 13–36. 10.1016/S0169-409X(01)00240-X. [DOI] [PubMed] [Google Scholar]
- Luo F.; Liu Z.; Chen T.; Gong B. Cross-linked Polyvinyl Alcohol pH Sensitive Membrane Immobilized with Phenol Red for Optical pH Sensors. Chin. J. Chem. 2006, 24, 341–344. 10.1002/cjoc.200690065. [DOI] [Google Scholar]
- Shamansky L. M.; Yang M.; Olteanu M.; Chronister E. L. A Spectroscopic Study of the pH Sensor Response of Fluorescein Doped Silica and Aluminosilica Sol-Gel Glasses. Mater. Lett. 1996, 26, 113–120. 10.1016/0167-577X(95)00214-6. [DOI] [Google Scholar]
- McDonagh C.; Sheridan F.; Butler T.; MacCraith B. D. Characterisation of Sol-Gel-Derived Silica Films. J. Non-Cryst. Solids 1996, 194, 72–77. 10.1016/0022-3093(95)00488-2. [DOI] [Google Scholar]
- Jurmanović S.; Kordić Š.; Steinberg M. D.; Steinberg I. M. Organically Modified Silicate Thin Films Doped with Colourimetric pH Indicators Methyl Red and Bromocresol Green as pH Responsive Sol–Gel Hybrid Materials. Thin Solid Films 2010, 518, 2234–2240. 10.1016/j.tsf.2009.07.158. [DOI] [Google Scholar]
- Villegas M. A.; Pascual L. Sol–Gel Silica Coatings Doped with a pH-Sensitive Chromophore. Thin Solid Films 1999, 351, 103–108. 10.1016/S0040-6090(98)01786-6. [DOI] [Google Scholar]
- Lobnik A.; Wolfbeis O. S. Sol-Gel Based Optical Sensor for Dissolved Ammonia. Sens. Actuators, B 1998, 51, 203–207. 10.1016/S0925-4005(98)00189-0. [DOI] [Google Scholar]
- Innocenzi P.; Brusatin G.; Guglielmi M.; Bertani R. New Synthetic Route to (3-Glycidoxypropyl) Trimethoxysilane-Based Hybrid Organic– Inorganic Materials. Chem. Mater. 1999, 11, 1672–1679. 10.1021/cm980734z. [DOI] [Google Scholar]
- Rottman C.; Grader G.; De Hazan Y.; Melchior S.; Avnir D. Surfactant-Induced Modification of Dopants Reactivity in Sol– Gel Matrixes. J. Am. Chem. Soc. 1999, 121, 8533–8543. 10.1021/ja991269p. [DOI] [Google Scholar]
- Rottman C.; Avnir D. Getting a Library of Activities from a Single Compound: Tunability and Very Large Shifts in Acidity Constants Induced by Sol– Gel Entrapped Micelles. J. Am. Chem. Soc. 2001, 123, 5730–5734. 10.1021/ja004230p. [DOI] [PubMed] [Google Scholar]
- Beltrán-Pérez G.; López-Huerta F.; Muñoz-Aguirre S.; Castillo-Mixcóatl J.; Palomino-Merino R.; Lozada-Morales R.; Portillo-Moreno O. Fabrication and Characterization of an Optical Fiber pH Sensor Using Sol–Gel Deposited TiO2 Film Doped with Organic Dyes. Sens. Actuators, B 2006, 120, 74–78. 10.1016/j.snb.2006.01.048. [DOI] [Google Scholar]
- Nguyen T.; McNamara K. P.; Rosenzweig Z. Optochemical Sensing by Immobilizing Fluorophore-Encapsulating Liposomes in Sol–Gel Thin Films. Anal. Chim. Acta 1999, 400, 45–54. 10.1016/S0003-2670(99)00607-8. [DOI] [Google Scholar]
- Wirnsberger G.; Scott B. J.; Stucky G. D. pH Sensing with Mesoporous Thin Films. Chem. Commun. 2001, (1), 119–120. 10.1039/b003995k. [DOI] [Google Scholar]
- Hiruta Y.; Ando Y.; Citterio D.; Suzuki K. A Fast-Response pH Optode Based on a Fluoroionophore Immobilized to a Mesoporous Silica Thin Film. Anal. Sci. 2010, 26, 297–301. 10.2116/analsci.26.297. [DOI] [PubMed] [Google Scholar]
- Bambot S. B.; Sipior J.; Lakowicz J. R.; Rao G. Lifetime-Based Optical Sensing of pH Using Resonance Energy Transfer in Sol—Gel Films. Sens. Actuators, B 1994, 22, 181–188. 10.1016/0925-4005(94)87019-5. [DOI] [Google Scholar]
- Villegas M. A.; Pascual L.; Paje S. E.; García M. A.; Llopis J. Eriochrome Cyanine Doped Sol–Gel Coatings. Optical Behavior against pH. J. Eur. Ceram. Soc. 2000, 20, 1621–1628. 10.1016/S0955-2219(99)00281-2. [DOI] [Google Scholar]
- Russell R. J.; Axel A. C.; Shields K. L.; Pishko M. V. Mass Transfer in Rapidly Photopolymerized Poly(Ethylene Glycol) Hydrogels Used for Chemical Sensing. Polymer 2001, 42, 4893–4901. 10.1016/S0032-3861(00)00851-X. [DOI] [Google Scholar]
- Tufani A.; Ince G. O. Permeability of Small Molecules through Vapor Deposited Polymer Membranes. J. Appl. Polym. Sci. 2015, 132, 42453. 10.1002/app.42453. [DOI] [Google Scholar]
- Gao F.; Tang L.; Dai L.; Wang L. A Fluorescence Ratiometric Nano-pH Sensor Based on Dual-Fluorophore-Doped Silica Nanoparticles. Spectrochim. Acta, Part A 2007, 67, 517–521. 10.1016/j.saa.2006.08.009. [DOI] [PubMed] [Google Scholar]
- Kotsmar C.; Sells T.; Taylor N.; Liu D. E.; Prausnitz J. M.; Radke C. J. Aqueous Solute Partitioning and Mesh Size in HEMA/MAA Hydrogels. Macromolecules 2012, 45, 9177–9187. 10.1021/ma3018487. [DOI] [Google Scholar]
- Nair D. P.; Podgórski M.; Chatani S.; Gong T.; Xi W.; Fenoli C. R.; Bowman C. N. The Thiol-Michael Addition Click Reaction: A Powerful and Widely Used Tool in Materials Chemistry. Chem. Mater. 2014, 26, 724–744. 10.1021/cm402180t. [DOI] [Google Scholar]
- Schoolaert E.; Steyaert I.; Vancoillie G.; Geltmeyer J.; Lava K.; Hoogenboom R.; De Clerck K. Blend Electrospinning of Dye-Functionalized Chitosan and Poly(ε-Caprolactone): Towards Biocompatible pH-Sensors. J. Mater. Chem. B 2016, 4, 4507–4516. 10.1039/C6TB00639F. [DOI] [PubMed] [Google Scholar]
- Sun H.; Scharff-Poulsen A. M.; Gu H.; Almdal K. Synthesis and Characterization of Ratiometric, pH Sensing Nanoparticles with Covalently Attached Fluorescent Dyes. Chem. Mater. 2006, 18, 3381–3384. 10.1021/cm052750j. [DOI] [Google Scholar]
- Badini G.; Grattan K.; Tseung A. Sol–Gels with Fiber-optic Chemical Sensor Potential: Effects of Preparation, Aging, and Long-term Storage. Rev. Sci. Instrum. 1995, 66, 4034–4040. 10.1063/1.1145413. [DOI] [Google Scholar]
- Lei J.; Wang L.; Zhang J. Ratiometric pH Sensor Based on Mesoporous Silica Nanoparticles and Förster Resonance Energy Transfer. Chem. Commun. 2010, 46, 8445–8447. 10.1039/c0cc03310c. [DOI] [PubMed] [Google Scholar]
- Zhang Z.; Zhang Y.; Ma W.; Russell R.; Shakhsher Z. M.; Grant C. L.; Seitz W. R.; Sundberg D. C. Poly(Vinyl Alcohol) as a Substrate for Indicator Immobilization for Fiber-Optic Chemical Sensors. Anal. Chem. 1989, 61, 202–205. 10.1021/ac00178a003. [DOI] [Google Scholar]
- Chan Y.-H.; Wu C.; Ye F.; Jin Y.; Smith P. B.; Chiu D. T. Development of Ultrabright Semiconducting Polymer Dots for Ratiometric pH Sensing. Anal. Chem. 2011, 83, 1448–1455. 10.1021/ac103140x. [DOI] [PMC free article] [PubMed] [Google Scholar]
- Kreno L. E.; Leong K.; Farha O. K.; Allendorf M.; Van Duyne R. P.; Hupp J. T. Metal–Organic Framework Materials as Chemical Sensors. Chem. Rev. 2012, 112, 1105–1125. 10.1021/cr200324t. [DOI] [PubMed] [Google Scholar]
- Hu Z.; Deibert B. J.; Li J. Luminescent Metal–Organic Frameworks for Chemical Sensing and Explosive Detection. Chem. Soc. Rev. 2014, 43, 5815–5840. 10.1039/C4CS00010B. [DOI] [PubMed] [Google Scholar]
- Harbuzaru B. V.; Corma A.; Rey F.; Jordá J. L.; Ananias D.; Carlos L. D.; Rocha J. A Miniaturized Linear pH Sensor Based on a Highly Photoluminescent Self-Assembled Europium(III) Metal–Organic Framework. Angew. Chem., Int. Ed. 2009, 48, 6476–6479. 10.1002/anie.200902045. [DOI] [PubMed] [Google Scholar]
- Lu Y.; Yan B. A Ratiometric Fluorescent pH Sensor Based on Nanoscale Metal–Organic Frameworks (MOFs) Modified by Europium(III) Complexes. Chem. Commun. 2014, 50, 13323–13326. 10.1039/C4CC05508J. [DOI] [PubMed] [Google Scholar]
- Zhang Y.; Fang D.; Liu R.; Zhao S.; Xiao X.; Wang C.; Cao Y.; Xu W. Synthesis and Fluorescent pH Sensing Properties of Nanoscale Lanthanide Metal-Organic Frameworks with Silk Fibroin Powder as Polymer Ligands. Dyes Pigm. 2016, 130, 129–137. 10.1016/j.dyepig.2016.03.027. [DOI] [Google Scholar]
- Li H.-Y.; Wei Y.-L.; Dong X.-Y.; Zang S.-Q.; Mak T. C. Novel Tb-MOF Embedded with Viologen Species for Multi-Photofunctionality: Photochromism, Photomodulated Fluorescence, and Luminescent pH Sensing. Chem. Mater. 2015, 27, 1327–1331. 10.1021/cm504350q. [DOI] [Google Scholar]
- Li Z.; Li P.; Xu Q.; Li H. Europium(III)−β-Diketonate Complex-Containing Nanohybrid Luminescent pH Detector. Chem. Commun. 2015, 51, 10644–10647. 10.1039/C5CC02074C. [DOI] [PubMed] [Google Scholar]
- Hou S.-L.; Dong J.; Tang M.-H.; Jiang X.-L.; Jiao Z.-H.; Zhao B. Triple-Interpenetrated Lanthanide-Organic Framework as Dual Wave Bands Self-Calibrated pH Luminescent Probe. Anal. Chem. 2019, 91, 5455–5460. 10.1021/acs.analchem.9b00848. [DOI] [PubMed] [Google Scholar]
- Qi Z.; Chen Y. Charge-Transfer-Based Terbium MOF Nanoparticles as Fluorescent pH Sensor for Extreme Acidity. Biosens. Bioelectron. 2017, 87, 236–241. 10.1016/j.bios.2016.08.052. [DOI] [PubMed] [Google Scholar]
- Xia T.; Zhu F.; Jiang K.; Cui Y.; Yang Y.; Qian G. A Luminescent Ratiometric pH Sensor Based on a Nanoscale and Biocompatible Eu/Tb-Mixed MOF. Dalton Trans. 2017, 46, 7549–7555. 10.1039/C7DT01604B. [DOI] [PubMed] [Google Scholar]
- Aguilera-Sigalat J.; Bradshaw D. A Colloidal Water-Stable MOF as a Broad-Range Fluorescent pH Sensor via Post-Synthetic Modification. Chem. Commun. 2014, 50, 4711. 10.1039/C4CC00659C. [DOI] [PubMed] [Google Scholar]
- Wu S.-H.; Wang S.; Fang W.-L.; Guo X.-F.; Wang H. An Exceptionally Stable Zr-Based Fluorescent Metal–Organic Framework for Highly Selective Detection of pH. Anal. Methods 2019, 11, 36–43. 10.1039/C8AY01998C. [DOI] [Google Scholar]
- Jiang H.-L.; Feng D.; Wang K.; Gu Z.-Y.; Wei Z.; Chen Y.-P.; Zhou H.-C. An Exceptionally Stable, Porphyrinic Zr Metal–Organic Framework Exhibiting pH-Dependent Fluorescence. J. Am. Chem. Soc. 2013, 135 (37), 13934–13938. 10.1021/ja406844r. [DOI] [PubMed] [Google Scholar]
- Deibert B. J.; Li J. A Distinct Reversible Colorimetric and Fluorescent Low pH Response on a Water-Stable Zirconium–Porphyrin Metal–Organic Framework. Chem. Commun. 2014, 50, 9636–9639. 10.1039/C4CC01938E. [DOI] [PubMed] [Google Scholar]
- Chen H.; Wang J.; Shan D.; Chen J.; Zhang S.; Lu X. Dual-Emitting Fluorescent Metal–Organic Framework Nanocomposites as a Broad-Range pH Sensor for Fluorescence Imaging. Anal. Chem. 2018, 90, 7056–7063. 10.1021/acs.analchem.8b01455. [DOI] [PubMed] [Google Scholar]
- Wang J.; Li Y.; Jiang M.; Liu Y.; Zhang L.; Wu P. A Highly Chemically Stable Metal–Organic Framework as a Luminescent Probe for the Regenerable Ratiometric Sensing of pH. Chem. - Eur. J. 2016, 22, 13023–13027. 10.1002/chem.201602974. [DOI] [PubMed] [Google Scholar]
- Xu X.-Y.; Yan B. An Efficient and Sensitive Fluorescent pH Sensor Based on Amino Functional Metal–Organic Frameworks in Aqueous Environment. Dalton Trans. 2016, 45, 7078–7084. 10.1039/C6DT00361C. [DOI] [PubMed] [Google Scholar]
- He C.; Lu K.; Lin W. Nanoscale Metal–Organic Frameworks for Real-Time Intracellular pH Sensing in Live Cells. J. Am. Chem. Soc. 2014, 136, 12253–12256. 10.1021/ja507333c. [DOI] [PMC free article] [PubMed] [Google Scholar]
- Lan G.; Ni K.; You E.; Wang M.; Culbert A.; Jiang X.; Lin W. Multifunctional Nanoscale Metal–Organic Layers for Ratiometric pH and Oxygen Sensing. J. Am. Chem. Soc. 2019, 141, 18964–18969. 10.1021/jacs.9b11024. [DOI] [PubMed] [Google Scholar]
- Lv X.-L.; Xie L.-H.; Wang B.; Zhao M.; Cui Y.; Li J.-R. Flexible Metal–Organic Frameworks for the Wavelength-Based Luminescence Sensing of Aqueous pH. J. Mater. Chem. C 2018, 6, 10628–10639. 10.1039/C8TC03036G. [DOI] [Google Scholar]
- Ding Z.; Wang C.; Wang S.; Wu L.; Zhang X. Light-Harvesting Metal-Organic Framework Nanoprobes for Ratiometric Fluorescence Energy Transfer-Based Determination of pH Values and Temperature. Microchim. Acta 2019, 186, 476. 10.1007/s00604-019-3608-1. [DOI] [PubMed] [Google Scholar]
- Grummt U.-W.; Pron A.; Zagorska M.; Lefrant S. Polyaniline Based Optical pH Sensor. Anal. Chim. Acta 1997, 357, 253–259. 10.1016/S0003-2670(97)00572-2. [DOI] [Google Scholar]
- Gicevicius M.; Kucinski J.; Ramanaviciene A.; Ramanavicius A. Tuning the Optical pH Sensing Properties of Polyaniline-Based Layer by Electrochemical Copolymerization of Aniline with o-Phenylenediamine. Dyes Pigm. 2019, 170, 107457. 10.1016/j.dyepig.2019.04.002. [DOI] [Google Scholar]
- Pringsheim E.; Zimin D.; Wolfbeis O. S. Fluorescent Beads Coated with Polyaniline: A Novel Nanomaterial for Optical Sensing of pH. Adv. Mater. 2001, 13, 819–822. 10.1002/1521-4095(200106)13:11<819::AID-ADMA819>3.0.CO;2-D. [DOI] [Google Scholar]
- Del Pilar Taboada Sotomayor M.; De Paoli M.-A.; de Oliveira W. A. Fiber-Optic pH Sensor Based on Poly(o-Methoxyaniline). Anal. Chim. Acta 1997, 353, 275–280. 10.1016/S0003-2670(97)87786-0. [DOI] [Google Scholar]
- Wen Q.; Liu L.; Yang Q.; Lv F.; Wang S. Dopamine-Modified Cationic Conjugated Polymer as a New Platform for pH Sensing and Autophagy Imaging. Adv. Funct. Mater. 2013, 23, 764–769. 10.1002/adfm.201202132. [DOI] [Google Scholar]
- Kappaun S.; Horner S.; Kelterer A.-M.; Waich K.; Grasse F.; Graf M.; Romaner L.; Niedermair F.; Müllen K.; Grimsdale A. C.; Saf R.; List E. J. W.; Zojer E.; Slugovc C. The Effect of Protonation on the Optical Properties of Conjugated Fluorene–Pyridine Copolymers. Macromol. Chem. Phys. 2008, 209, 2122–2134. 10.1002/macp.200800386. [DOI] [Google Scholar]
- Adachi N.; Kaneko Y.; Sekiguchi K.; Sugiyama H.; Sugeno M. pH-Responsive Fluorescence Chemical Sensor Constituted by Conjugated Polymers Containing Pyridine Rings. Luminescence 2015, 30, 1308–1312. 10.1002/bio.2898. [DOI] [PubMed] [Google Scholar]
- Cui H.; Chen Y.; Li L.; Wu Y.; Tang Z.; Fu H.; Tian Z. Hybrid Fluorescent Nanoparticles Fabricated from Pyridine-Functionalized Polyfluorene-Based Conjugated Polymer as Reversible pH Probes over a Broad Range of Acidity-Alkalinity. Microchim. Acta 2014, 181, 1529–1539. 10.1007/s00604-014-1219-4. [DOI] [Google Scholar]
- Ahn H.; Hong J.; Kim S. Y.; Choi I.; Park M. J. A pH-Responsive Molecular Switch with Tricolor Luminescence. ACS Appl. Mater. Interfaces 2015, 7, 704–712. 10.1021/am5070188. [DOI] [PubMed] [Google Scholar]
- Newman R. H.; Fosbrink M. D.; Zhang J. Genetically Encodable Fluorescent Biosensors for Tracking Signaling Dynamics in Living Cells. Chem. Rev. 2011, 111, 3614–3666. 10.1021/cr100002u. [DOI] [PMC free article] [PubMed] [Google Scholar]
- Chudakov D. M.; Matz M. V.; Lukyanov S.; Lukyanov K. A. Fluorescent Proteins and Their Applications in Imaging Living Cells and Tissues. Physiol. Rev. 2010, 90, 1103–1163. 10.1152/physrev.00038.2009. [DOI] [PubMed] [Google Scholar]
- Ibraheem A.; Campbell R. E. Designs and Applications of Fluorescent Protein-Based Biosensors. Curr. Opin. Chem. Biol. 2010, 14, 30–36. 10.1016/j.cbpa.2009.09.033. [DOI] [PubMed] [Google Scholar]
- Miyawaki A.; Niino Y. Molecular Spies for Bioimaging—Fluorescent Protein-Based Probes. Mol. Cell 2015, 58, 632–643. 10.1016/j.molcel.2015.03.002. [DOI] [PubMed] [Google Scholar]
- Fluorescent Protein-Based Biosensors: Methods and Protocols; Zhang J., Ni Q., Newman R. H., Eds.; Methods in Molecular Biology; Humana Press: New York, 2014. [Google Scholar]
- Shcherbakova D. M.; Subach O. M.; Verkhusha V. V. Red Fluorescent Proteins: Advanced Imaging Applications and Future Design. Angew. Chem., Int. Ed. 2012, 51, 10724–10738. 10.1002/anie.201200408. [DOI] [PMC free article] [PubMed] [Google Scholar]
- Rodriguez E. A.; Campbell R. E.; Lin J. Y.; Lin M. Z.; Miyawaki A.; Palmer A. E.; Shu X.; Zhang J.; Tsien R. Y. The Growing and Glowing Toolbox of Fluorescent and Photoactive Proteins. Trends Biochem. Sci. 2017, 42, 111–129. 10.1016/j.tibs.2016.09.010. [DOI] [PMC free article] [PubMed] [Google Scholar]
- Lukyanov K. A.; Belousov V. V. Genetically Encoded Fluorescent Redox Sensors. Biochim. Biophys. Acta, Gen. Subj. 2014, 1840, 745–756. 10.1016/j.bbagen.2013.05.030. [DOI] [PubMed] [Google Scholar]
- Fan Y.; Chen Z.; Ai H. Monitoring Redox Dynamics in Living Cells with a Redox-Sensitive Red Fluorescent Protein. Anal. Chem. 2015, 87, 2802–2810. 10.1021/ac5041988. [DOI] [PubMed] [Google Scholar]
- Dennis A. M.; Rhee W. J.; Sotto D.; Dublin S. N.; Bao G. Quantum Dot–Fluorescent Protein FRET Probes for Sensing Intracellular pH. ACS Nano 2012, 6, 2917–2924. 10.1021/nn2038077. [DOI] [PMC free article] [PubMed] [Google Scholar]
- Casey J. R.; Grinstein S.; Orlowski J. Sensors and Regulators of Intracellular pH. Nat. Rev. Mol. Cell Biol. 2010, 11, 50–61. 10.1038/nrm2820. [DOI] [PubMed] [Google Scholar]
- Subach O. M.; Gundorov I. S.; Yoshimura M.; Subach F. V.; Zhang J.; Grüenwald D.; Souslova E. A.; Chudakov D. M.; Verkhusha V. V. Conversion of Red Fluorescent Protein into a Bright Blue Probe. Chem. Biol. 2008, 15, 1116–1124. 10.1016/j.chembiol.2008.08.006. [DOI] [PMC free article] [PubMed] [Google Scholar]
- Abad M. F. C.; Di Benedetto G.; Magalhães P. J.; Filippin L.; Pozzan T. Mitochondrial pH Monitored by a New Engineered Green Fluorescent Protein Mutant. J. Biol. Chem. 2004, 279, 11521–11529. 10.1074/jbc.M306766200. [DOI] [PubMed] [Google Scholar]
- Bizzarri R.; Serresi M.; Luin S.; Beltram F. Green Fluorescent Protein Based pH Indicators for in Vivo Use: A Review. Anal. Bioanal. Chem. 2009, 393, 1107. 10.1007/s00216-008-2515-9. [DOI] [PubMed] [Google Scholar]
- Miesenböck G.; De Angelis D. A.; Rothman J. E. Visualizing Secretion and Synaptic Transmission with pH-Sensitive Green Fluorescent Proteins. Nature 1998, 394, 192–195. 10.1038/28190. [DOI] [PubMed] [Google Scholar]
- Tantama M.; Hung Y. P.; Yellen G. Imaging Intracellular pH in Live Cells with a Genetically Encoded Red Fluorescent Protein Sensor. J. Am. Chem. Soc. 2011, 133, 10034–10037. 10.1021/ja202902d. [DOI] [PMC free article] [PubMed] [Google Scholar]
- Hanson G. T.; McAnaney T. B.; Park E. S.; Rendell M. E.; Yarbrough D. K.; Chu S.; Xi L.; Boxer S. G.; Montrose M. H.; Remington S. J. Green Fluorescent Protein Variants as Ratiometric Dual Emission pH Sensors. 1. Structural Characterization and Preliminary Application. Biochemistry 2002, 41, 15477–15488. 10.1021/bi026609p. [DOI] [PubMed] [Google Scholar]
- Awaji T.; Hirasawa A.; Shirakawa H.; Tsujimoto G.; Miyazaki S. Novel Green Fluorescent Protein-Based Ratiometric Indicators for Monitoring pH in Defined Intracellular Microdomains. Biochem. Biophys. Res. Commun. 2001, 289, 457–462. 10.1006/bbrc.2001.6004. [DOI] [PubMed] [Google Scholar]
- Esposito A.; Gralle M.; Dani M. A. C.; Lange D.; Wouters F. S. pHlameleons: A Family of FRET-Based Protein Sensors for Quantitative pH Imaging. Biochemistry 2008, 47, 13115–13126. 10.1021/bi8009482. [DOI] [PubMed] [Google Scholar]
- Shen Y.; Rosendale M.; Campbell R. E.; Perrais D. pHuji, a pH-Sensitive Red Fluorescent Protein for Imaging of Exo-and Endocytosis. J. Cell Biol. 2014, 207, 419–432. 10.1083/jcb.201404107. [DOI] [PMC free article] [PubMed] [Google Scholar]
- Kirkpatrick S. M.; Naik R. R.; Stone M. O. Nonlinear Saturation and Determination of the Two-Photon Absorption Cross Section of Green Fluorescent Protein. J. Phys. Chem. B 2001, 105, 2867–2873. 10.1021/jp0041609. [DOI] [Google Scholar]
- Borisov S. M.; Klimant I. Optical Nanosensors—Smart Tools in Bioanalytics. Analyst 2008, 133, 1302–1307. 10.1039/b805432k. [DOI] [PubMed] [Google Scholar]
- Lobnik A.; Korent Urek Š. Nano-Based Optical Chemical Sensors. J. Nano Res. 2011, 13, 99–110. 10.4028/www.scientific.net/JNanoR.13.99. [DOI] [Google Scholar]
- Wolfbeis O. S. An Overview of Nanoparticles Commonly Used in Fluorescent Bioimaging. Chem. Soc. Rev. 2015, 44, 4743–4768. 10.1039/C4CS00392F. [DOI] [PubMed] [Google Scholar]
- Borisov S. M.; Mayr T.; Karasyov A. A.; Klimant I.; Chojnacki P.; Moser C.; Nagl S.; Schaeferling M.; Stich M. I.; Kocincova A. S.; Wolfbeis O. S.. New Plastic Microparticles and Nanoparticles for Fluorescent Sensing and Encoding. In Fluorescence of Supermolecules, Polymers, and Nanosystems; Berberan-Santos M. N., Ed.; Springer: Berlin, 2007; Vol. 4, pp 431–463. [Google Scholar]
- Chen M.; Yin M. Design and Development of Fluorescent Nanostructures for Bioimaging. Prog. Polym. Sci. 2014, 39, 365–395. 10.1016/j.progpolymsci.2013.11.001. [DOI] [Google Scholar]
- Chen G.; Song F.; Xiong X.; Peng X. Fluorescent Nanosensors Based on Fluorescence Resonance Energy Transfer (FRET). Ind. Eng. Chem. Res. 2013, 52, 11228–11245. 10.1021/ie303485n. [DOI] [Google Scholar]
- Saha K.; Agasti S. S.; Kim C.; Li X.; Rotello V. M. Gold Nanoparticles in Chemical and Biological Sensing. Chem. Rev. 2012, 112, 2739–2779. 10.1021/cr2001178. [DOI] [PMC free article] [PubMed] [Google Scholar]
- Shen J.; Zhu Y.; Yang X.; Li C. Graphene Quantum Dots: Emergent Nanolights for Bioimaging, Sensors, Catalysis and Photovoltaic Devices. Chem. Commun. 2012, 48, 3686–3699. 10.1039/c2cc00110a. [DOI] [PubMed] [Google Scholar]
- Zhong W. Nanomaterials in Fluorescence-Based Biosensing. Anal. Bioanal. Chem. 2009, 394, 47–59. 10.1007/s00216-009-2643-x. [DOI] [PubMed] [Google Scholar]
- Schäferling M. Nanoparticle-Based Luminescent Probes for Intracellular Sensing and Imaging of pH. Wiley Interdiscip. Rev. Nanomed. Nanobiotechnol. 2016, 8, 378–413. 10.1002/wnan.1366. [DOI] [PubMed] [Google Scholar]
- Lu J.; Rosenzweig Z. Nanoscale Fluorescent Sensors for Intracellular Analysis. Fresenius' J. Anal. Chem. 2000, 366, 569–575. 10.1007/s002160051552. [DOI] [PubMed] [Google Scholar]
- Srivastava A. K.; Dev A.; Karmakar S. Nanosensors and Nanobiosensors in Food and Agriculture. Environ. Chem. Lett. 2018, 16, 161–182. 10.1007/s10311-017-0674-7. [DOI] [Google Scholar]
- Doria G.; Conde J.; Veigas B.; Giestas L.; Almeida C.; Assunção M.; Rosa J.; Baptista P. V. Noble Metal Nanoparticles for Biosensing Applications. Sensors 2012, 12, 1657–1687. 10.3390/s120201657. [DOI] [PMC free article] [PubMed] [Google Scholar]
- Aylott J. W. Optical Nanosensors—an Enabling Technology for Intracellular Measurements. Analyst 2003, 128, 309–312. 10.1039/b302174m. [DOI] [PubMed] [Google Scholar]
- Asefa T.; Duncan C. T.; Sharma K. K. Recent Advances in Nanostructured Chemosensors and Biosensors. Analyst 2009, 134, 1980–1990. 10.1039/b911965p. [DOI] [PubMed] [Google Scholar]
- Buck S. Nanoscale Probes Encapsulated by Biologically Localized Embedding (PEBBLEs) for Ion Sensing and Imaging in Live Cells. Talanta 2004, 63, 41–59. 10.1016/j.talanta.2003.12.048. [DOI] [PubMed] [Google Scholar]
- Li K.; Liu B. Polymer Encapsulated Conjugated Polymernanoparticles for Fluorescence Bioimaging. J. Mater. Chem. 2012, 22, 1257–1264. 10.1039/C1JM14397B. [DOI] [Google Scholar]
- Knopp D.; Tang D.; Niessner R. Review: Bioanalytical Applications of Biomolecule-Functionalized Nanometer-Sized Doped Silica Particles. Anal. Chim. Acta 2009, 647, 14–30. 10.1016/j.aca.2009.05.037. [DOI] [PubMed] [Google Scholar]
- Burns A.; Ow H.; Wiesner U. Fluorescent Core–Shell Silica Nanoparticles: Towards “Lab on a Particle” Architectures for Nanobiotechnology. Chem. Soc. Rev. 2006, 35, 1028–1042. 10.1039/B600562B. [DOI] [PubMed] [Google Scholar]
- Bae S. W.; Tan W.; Hong J.-I. Fluorescent Dye-Doped Silica Nanoparticles: New Tools for Bioapplications. Chem. Commun. 2012, 48 (17), 2270–2282. 10.1039/c2cc16306c. [DOI] [PubMed] [Google Scholar]
- Wang K.; He X.; Yang X.; Shi H. Functionalized Silica Nanoparticles: A Platform for Fluorescence Imaging at the Cell and Small Animal Levels. Acc. Chem. Res. 2013, 46, 1367–1376. 10.1021/ar3001525. [DOI] [PubMed] [Google Scholar]
- Peng F.; Su Y.; Zhong Y.; Fan C.; Lee S.-T.; He Y. Silicon Nanomaterials Platform for Bioimaging, Biosensing, and Cancer Therapy. Acc. Chem. Res. 2014, 47, 612–623. 10.1021/ar400221g. [DOI] [PubMed] [Google Scholar]
- Wang C.; Li X.; Zhang F. Bioapplications and Biotechnologies of Upconversion Nanoparticle-Based Nanosensors. Analyst 2016, 141, 3601–3620. 10.1039/C6AN00150E. [DOI] [PubMed] [Google Scholar]
- DaCosta M. V.; Doughan S.; Han Y.; Krull U. J. Lanthanide Upconversion Nanoparticles and Applications in Bioassays and Bioimaging: A Review. Anal. Chim. Acta 2014, 832, 1–33. 10.1016/j.aca.2014.04.030. [DOI] [PubMed] [Google Scholar]
- Achatz D. E.; Ali R.; Wolfbeis O. S.. Luminescent Chemical Sensing, Biosensing, and Screening Using Upconverting Nanoparticles. In Luminescence Applied in Sensor Science; Prodi L., Montalti M., Zaccheroni N., Eds.; Springer: Berlin, 2010; Vol. 300, pp 29–50. [DOI] [PubMed] [Google Scholar]
- Doussineau T.; Schulz A.; Lapresta-Fernandez A.; Moro A.; Körsten S.; Trupp S.; Mohr G. J. On the Design of Fluorescent Ratiometric Nanosensors. Chem. - Eur. J. 2010, 16, 10290–10299. 10.1002/chem.201000829. [DOI] [PubMed] [Google Scholar]
- Mahata M.; Bae H.; Lee K. Upconversion Luminescence Sensitized pH-Nanoprobes. Molecules 2017, 22, 2064. 10.3390/molecules22122064. [DOI] [PMC free article] [PubMed] [Google Scholar]
- Schäferling M.; Resch-Genger U.. Luminescent Nanoparticles for Chemical Sensing and Imaging. In Reviews in Fluorescence 2016; Geddes C. D., Ed.; Springer International Publishing: Cham, 2017; pp 71–109. [Google Scholar]
- Canfarotta F.; Whitcombe M. J.; Piletsky S. A. Polymeric Nanoparticles for Optical Sensing. Biotechnol. Adv. 2013, 31, 1585–1599. 10.1016/j.biotechadv.2013.08.010. [DOI] [PubMed] [Google Scholar]
- Wang L.; Li C. pH Responsive Fluorescence Nanoprobe Imaging of Tumors by Sensing the Acidic Microenvironment. J. Mater. Chem. 2011, 21, 15862–15871. 10.1039/c1jm12072g. [DOI] [Google Scholar]
- Moßhammer M.; Brodersen K. E.; Kühl M.; Koren K. Nanoparticle- and Microparticle-Based Luminescence Imaging of Chemical Species and Temperature in Aquatic Systems: A Review. Microchim. Acta 2019, 186, 126. 10.1007/s00604-018-3202-y. [DOI] [PubMed] [Google Scholar]
- Ehgartner J.; Strobl M.; Bolivar J. M.; Rabl D.; Rothbauer M.; Ertl P.; Borisov S. M.; Mayr T. Simultaneous Determination of Oxygen and pH Inside Microfluidic Devices Using Core–Shell Nanosensors. Anal. Chem. 2016, 88, 9796–9804. 10.1021/acs.analchem.6b02849. [DOI] [PubMed] [Google Scholar]
- Fröhlich E. The Role of Surface Charge in Cellular Uptake and Cytotoxicity of Medical Nanoparticles. Int. J. Nanomed. 2012, 7, 5577–5591. 10.2147/IJN.S36111. [DOI] [PMC free article] [PubMed] [Google Scholar]
- Nie S.; Xing Y.; Kim G. J.; Simons J. W. Nanotechnology Applications in Cancer. Annu. Rev. Biomed. Eng. 2007, 9, 257–288. 10.1146/annurev.bioeng.9.060906.152025. [DOI] [PubMed] [Google Scholar]
- Soršak E.; Valh J. V.; Urek Š. K.; Lobnik A. Application of PAMAM Dendrimers in Optical Sensing. Analyst 2015, 140, 976–989. 10.1039/C4AN00825A. [DOI] [PubMed] [Google Scholar]
- Srikun D.; Albers A. E.; Chang C. J. A Dendrimer-Based Platform for Simultaneous Dual Fluorescence Imaging of Hydrogen Peroxide and pH Gradients Produced in Living Cells. Chem. Sci. 2011, 2, 1156–1165. 10.1039/c1sc00064k. [DOI] [Google Scholar]
- Senarath-Yapa M. D.; Scott Saavedra S. Dye Leaching from a Doped Sol–Gel Is Eliminated by Conjugation to a Dendrimer. Anal. Chim. Acta 2001, 432, 89–94. 10.1016/S0003-2670(00)01347-7. [DOI] [Google Scholar]
- Wang Y.; Niu S.; Zhang Z.; Xie Y.; Yuan C.; Wang H.; Fu D. Reversible pH Manipulation of the Fluorescence Emission from Sectorial Poly(Amido Amine) Dendrimers. J. Nanosci. Nanotechnol. 2010, 10, 4227–4233. 10.1166/jnn.2010.2195. [DOI] [PubMed] [Google Scholar]
- Wang D.; Imae T. Fluorescence Emission from Dendrimers and Its pH Dependence. J. Am. Chem. Soc. 2004, 126, 13204–13205. 10.1021/ja0454992. [DOI] [PubMed] [Google Scholar]
- Cao L.; Jia D.; Wang S.; Rong Y.; Liu C.; Wang D. Significant Influence of Distance between Amine Groups on Intrinsic Fluorescence Properties. Chem. Lett. 2014, 43, 246–248. 10.1246/cl.130877. [DOI] [Google Scholar]
- Grabchev I.; Staneva D.; Betcheva R. Sensor Activity, Photodegradation and Photostabilisation of a PAMAM Dendrimer Comprising 1,8-Naphthalimide Functional Groups in Its Periphery. Polym. Degrad. Stab. 2006, 91, 2257–2264. 10.1016/j.polymdegradstab.2006.04.022. [DOI] [Google Scholar]
- Grabchev I.; Soumillion J.-P.; Muls B.; Ivanova G. Poly(Amidoamine) Dendrimer Peripherally Modified with 4-N,N-Dimethylaminoethyleneamino-1,8-Naphthalimide as a Sensor of Metal Cations and Protons. Photochem. Photobiol. Sci. 2004, 3, 1032–1037. 10.1039/b412384k. [DOI] [PubMed] [Google Scholar]
- Grabchev I.; Guittonneau S. Sensors for Detecting Metal Ions and Protons Based on New Green Fluorescent Poly(Amidoamine) Dendrimers Peripherally Modified with 1,8-Naphthalimides. J. Photochem. Photobiol., A 2006, 179, 28–34. 10.1016/j.jphotochem.2005.07.008. [DOI] [PubMed] [Google Scholar]
- Grabchev I.; Chovelon J.-M.; Bojinov V.; Ivanova G. Poly(Amidoamine) Dendrimers Peripherally Modified with 4-Ethylamino-1,8-Naphthalimide. Synthesis and Photophysical Properties. Tetrahedron 2003, 59, 9591–9598. 10.1016/j.tet.2003.10.006. [DOI] [Google Scholar]
- Grabchev I. Synthesis and Photophysical Properties of 1,8-Naphthalimide-Labelled PAMAM as PET Sensors of Protons and of Transition Metal Ions. Polymer 2002, 43, 5731–5736. 10.1016/S0032-3861(02)00417-2. [DOI] [Google Scholar]
- Grabchev I.; Staneva D.; Bojinov V.; Betcheva R.; Gregoriou V. Spectral Investigation of Coordination of Cuprum Cations and Protons at PAMAM Dendrimer Peripherally Modified with 1,8-Naphthalimide Units. Spectrochim. Acta, Part A 2008, 70, 532–536. 10.1016/j.saa.2007.07.057. [DOI] [PubMed] [Google Scholar]
- Georgiev N. I.; Bojinov V. B. The Design and Synthesis of a Novel 1,8-Naphthalimide PAMAM Light-Harvesting Dendron with Fluorescence “off-on” Switching Core. Dyes Pigm. 2010, 84, 249–256. 10.1016/j.dyepig.2009.09.013. [DOI] [Google Scholar]
- Bojinov V. B.; Georgiev N. I.; Nikolov P. S. Synthesis and Photophysical Properties of Fluorescence Sensing Ester- and Amidoamine-Functionalized 1,8-Naphthalimides. J. Photochem. Photobiol., A 2008, 193, 129–138. 10.1016/j.jphotochem.2007.06.016. [DOI] [Google Scholar]
- Georgiev N. I.; Bojinov V. B.; Nikolov P. S. Design and Synthesis of a Novel pH Sensitive Core and Peripherally 1,8-Naphthalimide-Labeled PAMAM Dendron as Light Harvesting Antenna. Dyes Pigm. 2009, 81, 18–26. 10.1016/j.dyepig.2008.08.009. [DOI] [Google Scholar]
- Bojinov V. B.; Georgiev N. I.; Nikolov P. S. Design and Synthesis of Core and Peripherally Functionalized with 1,8-Naphthalimide Units Fluorescent PAMAM Dendron as Light Harvesting Antenna. J. Photochem. Photobiol., A 2008, 197, 281–289. 10.1016/j.jphotochem.2008.01.005. [DOI] [Google Scholar]
- Dodangeh M.; Gharanjig K.; Arami M. Synthesis, Characterization, and Photo-Physical Properties of Dendrimers Modified With 1,8-Naphthalimide Derivatives as Novel Fluorescent pH Sensors. IEEE Sens. J. 2014, 14, 2889–2896. 10.1109/JSEN.2014.2319293. [DOI] [Google Scholar]
- Georgiev N. I.; Sakr A. R.; Bojinov V. B. Design and Synthesis of Novel Fluorescence Sensing Perylene Diimides Based on Photoinduced Electron Transfer. Dyes Pigm. 2011, 91, 332–339. 10.1016/j.dyepig.2011.04.015. [DOI] [Google Scholar]
- Albertazzi L.; Storti B.; Marchetti L.; Beltram F. Delivery and Subcellular Targeting of Dendrimer-Based Fluorescent pH Sensors in Living Cells. J. Am. Chem. Soc. 2010, 132, 18158–18167. 10.1021/ja105689u. [DOI] [PubMed] [Google Scholar]
- Dirksen A.; Zuidema E.; Williams R. M.; De Cola L.; Kauffmann C.; Vögtle F.; Roque A.; Pina F. Photoactivity and pH Sensitivity of Methyl Orange Functionalized Poly(Propyleneamine) Dendrimers. Macromolecules 2002, 35, 2743–2747. 10.1021/ma011350o. [DOI] [Google Scholar]
- Vinogradov S. A.; Wilson D. F. Electrostatic Core Shielding in Dendritic Polyglutamic Porphyrins. Chem. - Eur. J. 2000, 6, 2456–2461. 10.1002/1521-3765(20000703)6:13<2456::AID-CHEM2456>3.0.CO;2-P. [DOI] [PubMed] [Google Scholar]
- Thyagarajan S.; Leiding T.; Årsköld S. P.; Cheprakov A. V.; Vinogradov S. A. Highly Non-Planar Dendritic Porphyrin for pH Sensing: Observation of Porphyrin Monocation. Inorg. Chem. 2010, 49, 9909–9920. 10.1021/ic100968p. [DOI] [PMC free article] [PubMed] [Google Scholar]
- Yang Q.; Ye Z.; Zhong M.; Chen B.; Chen J.; Zeng R.; Wei L.; Li H.; Xiao L. Self-Assembled Fluorescent Bovine Serum Albumin Nanoprobes for Ratiometric pH Measurement inside Living Cells. ACS Appl. Mater. Interfaces 2016, 8, 9629–9634. 10.1021/acsami.6b00857. [DOI] [PubMed] [Google Scholar]
- Han J.; Loudet A.; Barhoumi R.; Burghardt R. C.; Burgess K. A Ratiometric pH Reporter For Imaging Protein-Dye Conjugates In Living Cells. J. Am. Chem. Soc. 2009, 131, 1642–1643. 10.1021/ja8073374. [DOI] [PMC free article] [PubMed] [Google Scholar]
- Saha S.; Chakraborty K.; Krishnan Y. Tunable, Colorimetric DNA-Based pH Sensors Mediated by A-Motif Formation. Chem. Commun. 2012, 48, 2513–2515. 10.1039/c2cc16347k. [DOI] [PubMed] [Google Scholar]
- Carnevale K. J. F.; Riskowski R. A.; Strouse G. F. A Gold Nanoparticle Bio-Optical Transponder to Dynamically Monitor Intracellular pH. ACS Nano 2018, 12, 5956–5968. 10.1021/acsnano.8b02200. [DOI] [PubMed] [Google Scholar]
- Alvarez-Rodriguez R.; Alonso M.; Girotti A.; Reboto V.; Rodriguez-Cabello J. C. One-Pot Synthesis of pH and Temperature Sensitive Gold Clusters Mediated by a Recombinant Elastin-like Polymer. Eur. Polym. J. 2010, 46, 643–650. 10.1016/j.eurpolymj.2009.12.022. [DOI] [Google Scholar]
- Modi S.; Swetha M. G.; Goswami D.; Gupta G. D.; Mayor S.; Krishnan Y. A DNA Nanomachine That Maps Spatial and Temporal pH Changes inside Living Cells. Nat. Nanotechnol. 2009, 4, 325–330. 10.1038/nnano.2009.83. [DOI] [PubMed] [Google Scholar]
- Huang J.; Ying L.; Yang X.; Yang Y.; Quan K.; Wang H.; Xie N.; Ou M.; Zhou Q.; Wang K. Ratiometric Fluorescent Sensing of pH Values in Living Cells by Dual-Fluorophore-Labeled i-Motif Nanoprobes. Anal. Chem. 2015, 87, 8724–8731. 10.1021/acs.analchem.5b01527. [DOI] [PubMed] [Google Scholar]
- Luo F.; Xi Q.; Jiang J.; Yu R. Graphene Oxide Based DNA Nanoswitches as a Programmable pH-Responsive Biosensor. Anal. Methods 2016, 8, 6982–6985. 10.1039/C6AY01358A. [DOI] [Google Scholar]
- Yang M.; Song Y.; Zhang M.; Lin S.; Hao Z.; Liang Y.; Zhang D.; Chen P. R. Converting a Solvatochromic Fluorophore into a Protein-Based pH Indicator for Extreme Acidity. Angew. Chem. 2012, 124, 7794–7799. 10.1002/ange.201204029. [DOI] [PubMed] [Google Scholar]
- Hilderbrand S. A.; Kelly K. A.; Niedre M.; Weissleder R. Near Infrared Fluorescence-Based Bacteriophage Particles for Ratiometric pH Imaging. Bioconjugate Chem. 2008, 19, 1635–1639. 10.1021/bc800188p. [DOI] [PMC free article] [PubMed] [Google Scholar]
- Tian Y.; Wu M.; Liu X.; Liu Z.; Zhou Q.; Niu Z.; Huang Y. Probing the Endocytic Pathways of the Filamentous Bacteriophage in Live Cells Using Ratiometric pH Fluorescent Indicator. Adv. Healthcare Mater. 2015, 4, 413–419. 10.1002/adhm.201400508. [DOI] [PubMed] [Google Scholar]
- Chen L.; Wu Y.; Lin Y.; Wang Q. Virus-Templated FRET Platform for the Rational Design of Ratiometric Fluorescent Nanosensors. Chem. Commun. 2015, 51, 10190–10193. 10.1039/C5CC02866C. [DOI] [PubMed] [Google Scholar]
- Yan J.; Estévez M. C.; Smith J. E.; Wang K.; He X.; Wang L.; Tan W. Dye-Doped Nanoparticles for Bioanalysis. Nano Today 2007, 2, 44–50. 10.1016/S1748-0132(07)70086-5. [DOI] [Google Scholar]
- Yao G.; Wang L.; Wu Y.; Smith J.; Xu J.; Zhao W.; Lee E.; Tan W. FloDots: Luminescent Nanoparticles. Anal. Bioanal. Chem. 2006, 385, 518–524. 10.1007/s00216-006-0452-z. [DOI] [PubMed] [Google Scholar]
- Tang F.; Li L.; Chen D. Mesoporous Silica Nanoparticles: Synthesis, Biocompatibility and Drug Delivery. Adv. Mater. 2012, 24, 1504–1534. 10.1002/adma.201104763. [DOI] [PubMed] [Google Scholar]
- Gao F.; Wang L.; Tang L.; Zhu C. A Novel Nano-Sensor Based on Rhodamine-β-Isothiocyanate – Doped Silica Nanoparticle for pH Measurement. Microchim. Acta 2005, 152, 131–135. 10.1007/s00604-005-0418-4. [DOI] [Google Scholar]
- Peng J.; He X.; Wang K.; Tan W.; Wang Y.; Liu Y. Noninvasive Monitoring of Intracellular pH Change Induced by Drug Stimulation Using Silica Nanoparticle Sensors. Anal. Bioanal. Chem. 2007, 388, 645–654. 10.1007/s00216-007-1244-9. [DOI] [PubMed] [Google Scholar]
- He X.; Wang Y.; Wang K.; Peng J.; Liu F.; Tan W. Research of the Relationship of Intracellular Acidification and Apoptosis in Hela Cells Based on pH Nanosensors. Sci. China, Ser. B: Chem. 2007, 50, 258–265. 10.1007/s11426-007-0012-1. [DOI] [Google Scholar]
- Xu J.; Sun L.; Li J.; Liang J.; Zhang H.; Yang W. FITC and Ru(Phen)32+ Co-Doped Silica Particles as Visualized Ratiometric pH Indicator. Nanoscale Res. Lett. 2011, 6, 561. 10.1186/1556-276X-6-561. [DOI] [PMC free article] [PubMed] [Google Scholar]
- Acquah I.; Roh J.; Ahn D. J. Dual-Fluorophore Raspberry-like Nanohybrids for Ratiometric pH Sensing. Chem. - Asian J. 2017, 12, 1724–1729. 10.1002/asia.201700616. [DOI] [PubMed] [Google Scholar]
- Hu S.; Sun L.; Liu M.; Zhu H.; Guo H.; Sun H.; Sun H. A Highly Dispersible Silica pH Nanosensor with Expanded Measurement Ranges. New J. Chem. 2015, 39, 4568–4574. 10.1039/C4NJ02419B. [DOI] [Google Scholar]
- Liu J.; Zang L.; Wang Y.; Liu G. Preparation of Acridine Orange-Doped Silica Nanoparticles for pH Measurement. J. Lumin. 2014, 147, 155–158. 10.1016/j.jlumin.2013.11.015. [DOI] [Google Scholar]
- Gao F.; Chen X.; Ye Q.; Yao Z.; Guo X.; Wang L. Core-Shell Fluorescent Silica Nanoparticles for Sensing near-Neutral pH Values. Microchim. Acta 2011, 172, 327–333. 10.1007/s00604-010-0494-y. [DOI] [Google Scholar]
- Mathew N. D.; Mathew M. D.; Surawski P. P. T. Nanoparticle Imaging and Diagnostic of Caenorhabditis Elegans Intracellular pH. Anal. Biochem. 2014, 450, 52–56. 10.1016/j.ab.2014.01.011. [DOI] [PubMed] [Google Scholar]
- Ali R.; Saleh S. M.; Elshaarawy R. F. M. Turn-on pH Nano-Fluorosensor Based on Imidazolium Salicylaldehyde Ionic Liquid-Labeled Silica Nanoparticles. RSC Adv. 2016, 6, 86965–86975. 10.1039/C6RA18097C. [DOI] [Google Scholar]
- Chen Y.-P.; Chen H.-A.; Hung Y.; Chien F.-C.; Chen P.; Mou C.-Y. Surface Charge Effect in Intracellular Localization of Mesoporous Silica Nanoparticles as Probed by Fluorescent Ratiometric pH Imaging. RSC Adv. 2012, 2, 968–973. 10.1039/C1RA00586C. [DOI] [Google Scholar]
- Korzeniowska B.; Woolley R.; Decourcey J.; Wencel D.; Loscher C. E.; McDonagh C. Intracellular pH-Sensing Using Core/Shell Silica Nanoparticles. J. Biomed. Nanotechnol. 2014, 10, 1336–1345. 10.1166/jbn.2014.1815. [DOI] [PubMed] [Google Scholar]
- Tsou C.-J.; Chu C.; Hung Y.; Mou C.-Y. A Broad Range Fluorescent pH Sensor Based on Hollow Mesoporous Silica Nanoparticles, Utilising the Surface Curvature Effect. J. Mater. Chem. B 2013, 1, 5557–5563. 10.1039/c3tb21009j. [DOI] [PubMed] [Google Scholar]
- Yang L.; Li N.; Pan W.; Yu Z.; Tang B. Real-Time Imaging of Mitochondrial Hydrogen Peroxide and pH Fluctuations in Living Cells Using a Fluorescent Nanosensor. Anal. Chem. 2015, 87, 3678–3684. 10.1021/ac503975x. [DOI] [PubMed] [Google Scholar]
- Borisov S. M.; Mayr T.; Mistlberger G.; Waich K.; Koren K.; Chojnacki P.; Klimant I. Precipitation as a Simple and Versatile Method for Preparation of Optical Nanochemosensors. Talanta 2009, 79, 1322–1330. 10.1016/j.talanta.2009.05.041. [DOI] [PubMed] [Google Scholar]
- Clark H. A.; Hoyer M.; Philbert M. A.; Kopelman R. Optical Nanosensors for Chemical Analysis inside Single Living Cells. 1. Fabrication, Characterization, and Methods for Intracellular Delivery of PEBBLE Sensors. Anal. Chem. 1999, 71, 4831–4836. 10.1021/ac990629o. [DOI] [PubMed] [Google Scholar]
- Ray A.; Koo Lee Y.-E.; Epstein T.; Kim G.; Kopelman R. Two-Photon Nano-PEBBLE Sensors: Subcellular pH Measurements. Analyst 2011, 136, 3616–3622. 10.1039/c1an15046d. [DOI] [PubMed] [Google Scholar]
- Sun H.; Benjaminsen R. V.; Almdal K.; Andresen T. L. Hyaluronic Acid Immobilized Polyacrylamide Nanoparticle Sensors for CD44 Receptor Targeting and pH Measurement in Cells. Bioconjugate Chem. 2012, 23, 2247–2255. 10.1021/bc300349n. [DOI] [PubMed] [Google Scholar]
- Chauhan V. M.; Burnett G. R.; Aylott J. W. Dual-Fluorophore Ratiometric pH Nanosensor with Tuneable p K a and Extended Dynamic Range. Analyst 2011, 136, 1799–1801. 10.1039/c1an15042a. [DOI] [PubMed] [Google Scholar]
- Zhang M.; Søndergaard R. V.; Kumar E. K. P.; Henriksen J. R.; Cui D.; Hammershøj P.; Clausen M. H.; Andresen T. L. A Hydrogel Based Nanosensor with an Unprecedented Broad Sensitivity Range for pH Measurements in Cellular Compartments. Analyst 2015, 140, 7246–7253. 10.1039/C5AN01014D. [DOI] [PubMed] [Google Scholar]
- Søndergaard R. V.; Henriksen J. R.; Andresen T. L. Design, Calibration and Application of Broad-Range Optical Nanosensors for Determining Intracellular pH. Nat. Protoc. 2014, 9, 2841–2858. 10.1038/nprot.2014.196. [DOI] [PubMed] [Google Scholar]
- Benjaminsen R. V.; Sun H.; Henriksen J. R.; Christensen N. M.; Almdal K.; Andresen T. L. Evaluating Nanoparticle Sensor Design for Intracellular pH Measurements. ACS Nano 2011, 5, 5864–5873. 10.1021/nn201643f. [DOI] [PubMed] [Google Scholar]
- Sun H.; Almdal K.; Andresen T. L. Expanding the Dynamic Measurement Range for Polymeric Nanoparticle pH Sensors. Chem. Commun. 2011, 47, 5268–5270. 10.1039/c1cc10439j. [DOI] [PubMed] [Google Scholar]
- Sun H.; Andresen T. L.; Benjaminsen R. V.; Almdal K. Polymeric Nanosensors for Measuring the Full Dynamic pH Range of Endosomes and Lysosomes in Mammalian Cells. J. Biomed. Nanotechnol. 2009, 5, 676–682. 10.1166/jbn.2009.1084. [DOI] [PubMed] [Google Scholar]
- Mistlberger G.; Medina-Castillo A. L.; Borisov S. M.; Mayr T.; Fernández-Gutiérrez A.; Fernandez-Sanchez J. F.; Klimant I. Mini-Emulsion Solvent Evaporation: A Simple and Versatile Way to Magnetic Nanosensors. Microchim. Acta 2011, 172, 299–308. 10.1007/s00604-010-0492-0. [DOI] [Google Scholar]
- Peng H.; Stolwijk J. A.; Sun L.-N.; Wegener J.; Wolfbeis O. S. A Nanogel for Ratiometric Fluorescent Sensing of Intracellular pH Values. Angew. Chem., Int. Ed. 2010, 49, 4246–4249. 10.1002/anie.200906926. [DOI] [PubMed] [Google Scholar]
- Bao Y.; De Keersmaecker H.; Corneillie S.; Yu F.; Mizuno H.; Zhang G.; Hofkens J.; Mendrek B.; Kowalczuk A.; Smet M. Tunable Ratiometric Fluorescence Sensing of Intracellular pH by Aggregation-Induced Emission-Active Hyperbranched Polymer Nanoparticles. Chem. Mater. 2015, 27, 3450–3455. 10.1021/acs.chemmater.5b00858. [DOI] [Google Scholar]
- Chen J.; Tang Y.; Wang H.; Zhang P.; Li Y.; Jiang J. Design and Fabrication of Fluorescence Resonance Energy Transfer-Mediated Fluorescent Polymer Nanoparticles for Ratiometric Sensing of Lysosomal pH. J. Colloid Interface Sci. 2016, 484, 298–307. 10.1016/j.jcis.2016.09.009. [DOI] [PubMed] [Google Scholar]
- Kisiel A.; Kłucińska K.; Głębicka Z.; Gniadek M.; Maksymiuk K.; Michalska A. Alternating Polymer Micelle Nanospheres for Optical Sensing. Analyst 2014, 139, 2515–2524. 10.1039/c3an02344c. [DOI] [PubMed] [Google Scholar]
- Chang S.; Wu X.; Li Y.; Niu D.; Gao Y.; Ma Z.; Gu J.; Zhao W.; Zhu W.; Tian H.; Shi J. A pH-Responsive Hybrid Fluorescent Nanoprober for Real Time Cell Labeling and Endocytosis Tracking. Biomaterials 2013, 34, 10182–10190. 10.1016/j.biomaterials.2013.09.044. [DOI] [PubMed] [Google Scholar]
- Schulz A.; Wotschadlo J.; Heinze T.; Mohr G. J. Fluorescent Nanoparticles for Ratiometric pH-Monitoring in the Neutral Range. J. Mater. Chem. 2010, 20, 1475–1482. 10.1039/b918427a. [DOI] [Google Scholar]
- Zhou X.; Su F.; Tian Y.; Meldrum D. R. Dually Fluorescent Core-Shell Microgels for Ratiometric Imaging in Live Antigen-Presenting Cells. PLoS One 2014, 9, e88185 10.1371/journal.pone.0088185. [DOI] [PMC free article] [PubMed] [Google Scholar]
- Kreft O.; Javier A. M.; Sukhorukov G. B.; Parak W. J. Polymer Microcapsules as Mobile Local pH-Sensors. J. Mater. Chem. 2007, 17, 4471–4476. 10.1039/b705419j. [DOI] [Google Scholar]
- Madsen J.; Canton I.; Warren N. J.; Themistou E.; Blanazs A.; Ustbas B.; Tian X.; Pearson R.; Battaglia G.; Lewis A. L.; Armes S. P. Nile Blue-Based Nanosized pH Sensors for Simultaneous Far-Red and Near-Infrared Live Bioimaging. J. Am. Chem. Soc. 2013, 135, 14863–14870. 10.1021/ja407380t. [DOI] [PMC free article] [PubMed] [Google Scholar]
- Georgiev N. I.; Bryaskova R.; Tzoneva R.; Ugrinova I.; Detrembleur C.; Miloshev S.; Asiri A. M.; Qusti A. H.; Bojinov V. B. A Novel pH Sensitive Water Soluble Fluorescent Nanomicellar Sensor for Potential Biomedical Applications. Bioorg. Med. Chem. 2013, 21, 6292–6302. 10.1016/j.bmc.2013.08.064. [DOI] [PubMed] [Google Scholar]
- Kumar E K P.; Feldborg L. N.; Almdal K.; Andresen T. L. Synthesis and Characterization of a Micelle-Based pH Nanosensor with an Unprecedented Broad Measurement Range. Chem. Mater. 2013, 25, 1496–1501. 10.1021/cm302922d. [DOI] [Google Scholar]
- Li Y.-Y.; Cheng H.; Zhu J.-L.; Yuan L.; Dai Y.; Cheng S.-X.; Zhang X.-Z.; Zhuo R.-X. Temperature- and pH-Sensitive Multicolored Micellar Complexes. Adv. Mater. 2009, 21, 2402–2406. 10.1002/adma.200803770. [DOI] [Google Scholar]
- Pan T.; Yang C.; Shi J.; Hao C.; Qiao Y.; Li J.; Deng M.; Tian Y.; Chen M. Dual pH and Oxygen Luminescent Nanoprobes Based on Graft Polymers for Extracellular Metabolism Monitoring and Intracellular Imaging. Sens. Actuators, B 2019, 291, 306–318. 10.1016/j.snb.2019.04.082. [DOI] [Google Scholar]
- Yao Q.; Lu S.; Lin F.; Zhao T.; Zhao L.; Chen X. A Co-Precipitation Strategy for Making a Ratiometric pH Nanosensor for Intracellular Imaging. Sens. Actuators, B 2017, 250, 484–490. 10.1016/j.snb.2017.04.097. [DOI] [Google Scholar]
- Gong P.; Yang Y.; Yi H.; Fang S.; Zhang P.; Sheng Z.; Gao G.; Gao D.; Cai L. Polypeptide Micelles with Dual pH Activatable Dyes for Sensing Cells and Cancer Imaging. Nanoscale 2014, 6, 5416–5424. 10.1039/C4NR00519H. [DOI] [PubMed] [Google Scholar]
- Patrick M. J.; Janjic J. M.; Teng H.; O’Hear M. R.; Brown C. W.; Stokum J. A.; Schmidt B. F.; Ahrens E. T.; Waggoner A. S. Intracellular pH Measurements Using Perfluorocarbon Nanoemulsions. J. Am. Chem. Soc. 2013, 135, 18445–18457. 10.1021/ja407573m. [DOI] [PMC free article] [PubMed] [Google Scholar]
- McNamara K. P.; Rosenzweig N.; Rosenzweig Z. Liposome-Based Optochemical Nanosensors. Microchim. Acta 1999, 131, 57–64. 10.1007/s006040050009. [DOI] [Google Scholar]
- McNamara K. P.; Nguyen T.; Dumitrascu G.; Ji J.; Rosenzweig N.; Rosenzweig Z. Synthesis, Characterization, and Application of Fluorescence Sensing Lipobeads for Intracellular pH Measurements. Anal. Chem. 2001, 73, 3240–3246. 10.1021/ac0102314. [DOI] [PubMed] [Google Scholar]
- Tang L.; Li T.; Zhuang S.; Lu Q.; Li P.; Huang B. Synthesis of pH-Sensitive Fluorescein Grafted Cellulose Nanocrystals with an Amino Acid Spacer. ACS Sustainable Chem. Eng. 2016, 4, 4842–4849. 10.1021/acssuschemeng.6b01124. [DOI] [Google Scholar]
- Horning S.; Schultz A.; Mohr G. J.; Heinze T. Fluorescent Polysaccharide Nanoparticles for pH-Sensing. J. Photopolym. Sci. Technol. 2009, 22, 671–673. 10.2494/photopolymer.22.671. [DOI] [PubMed] [Google Scholar]
- Schulz A.; Hornig S.; Liebert T.; Birckner E.; Heinze T.; Mohr G. J. Evaluation of Fluorescent Polysaccharide Nanoparticles for pH-Sensing. Org. Biomol. Chem. 2009, 7, 1884–1889. 10.1039/b900260j. [DOI] [PubMed] [Google Scholar]
- Rosenthal S. J.; Chang J. C.; Kovtun O.; McBride J. R.; Tomlinson I. D. Biocompatible Quantum Dots for Biological Applications. Chem. Biol. 2011, 18, 10–24. 10.1016/j.chembiol.2010.11.013. [DOI] [PMC free article] [PubMed] [Google Scholar]
- Arya H.; Kaul Z.; Wadhwa R.; Taira K.; Hirano T.; Kaul S. C. Quantum Dots in Bio-Imaging: Revolution by the Small. Biochem. Biophys. Res. Commun. 2005, 329, 1173–1177. 10.1016/j.bbrc.2005.02.043. [DOI] [PubMed] [Google Scholar]
- Li J.; Zhu J.-J. Quantum Dots for Fluorescent Biosensing and Bio-Imaging Applications. Analyst 2013, 138, 2506–2515. 10.1039/c3an36705c. [DOI] [PubMed] [Google Scholar]
- Wang Y.; Hu R.; Lin G.; Roy I.; Yong K.-T. Functionalized Quantum Dots for Biosensing and Bioimaging and Concerns on Toxicity. ACS Appl. Mater. Interfaces 2013, 5, 2786–2799. 10.1021/am302030a. [DOI] [PubMed] [Google Scholar]
- Hutter E.; Maysinger D. Gold Nanoparticles and Quantum Dots for Bioimaging. Microsc. Res. Tech. 2011, 74, 592–604. 10.1002/jemt.20928. [DOI] [PubMed] [Google Scholar]
- Jaiswal J. K.; Simon S. M. Potentials and Pitfalls of Fluorescent Quantum Dots for Biological Imaging. Trends Cell Biol. 2004, 14, 497–504. 10.1016/j.tcb.2004.07.012. [DOI] [PubMed] [Google Scholar]
- Bera D.; Qian L.; Tseng T.-K.; Holloway P. H. Quantum Dots and Their Multimodal Applications: A Review. Materials 2010, 3, 2260–2345. 10.3390/ma3042260. [DOI] [Google Scholar]
- Biju V.; Itoh T.; Anas A.; Sujith A.; Ishikawa M. Semiconductor Quantum Dots and Metal Nanoparticles: Syntheses, Optical Properties, and Biological Applications. Anal. Bioanal. Chem. 2008, 391, 2469–2495. 10.1007/s00216-008-2185-7. [DOI] [PubMed] [Google Scholar]
- Petryayeva E.; Algar W. R.; Medintz I. L. Quantum Dots in Bioanalysis: A Review of Applications across Various Platforms for Fluorescence Spectroscopy and Imaging. Appl. Spectrosc. 2013, 67, 215–252. 10.1366/12-06948. [DOI] [PubMed] [Google Scholar]
- Chen C.; Zhang P.; Zhang L.; Gao D.; Gao G.; Yang Y.; Li W.; Gong P.; Cai L. Long-Decay near-Infrared-Emitting Doped Quantum Dots for Lifetime-Based in Vivo pH Imaging. Chem. Commun. 2015, 51, 11162–11165. 10.1039/C5CC03046C. [DOI] [PubMed] [Google Scholar]
- Kirchner C.; Liedl T.; Kudera S.; Pellegrino T.; Muñoz Javier A.; Gaub H. E.; Stölzle S.; Fertig N.; Parak W. J. Cytotoxicity of Colloidal CdSe and CdSe/ZnS Nanoparticles. Nano Lett. 2005, 5, 331–338. 10.1021/nl047996m. [DOI] [PubMed] [Google Scholar]
- Kuno M.; Fromm D. P.; Hamann H. F.; Gallagher A.; Nesbitt D. J. Nonexponential “Blinking” Kinetics of Single CdSe Quantum Dots: A Universal Power Law Behavior. J. Chem. Phys. 2000, 112, 3117–3120. 10.1063/1.480896. [DOI] [Google Scholar]
- Orte A.; Alvarez-Pez J. M.; Ruedas-Rama M. J. Fluorescence Lifetime Imaging Microscopy for the Detection of Intracellular pH with Quantum Dot Nanosensors. ACS Nano 2013, 7, 6387–6395. 10.1021/nn402581q. [DOI] [PubMed] [Google Scholar]
- Ruedas-Rama M. J.; Orte A.; Hall E. A. H.; Alvarez-Pez J. M.; Talavera E. M. Quantum Dot Photoluminescence Lifetime-Based pH Nanosensor. Chem. Commun. 2011, 47, 2898–2900. 10.1039/c0cc05252c. [DOI] [PubMed] [Google Scholar]
- Chen X.; Sun X.; Xu W.; Pan G.; Zhou D.; Zhu J.; Wang H.; Bai X.; Dong B.; Song H. Ratiometric Photoluminescence Sensing Based on Ti 3 C 2 MXene Quantum Dots as an Intracellular pH Sensor. Nanoscale 2018, 10, 1111–1118. 10.1039/C7NR06958H. [DOI] [PubMed] [Google Scholar]
- Xu H.; Li D.; Zhao Y.; Wang X.; Li D.; Wang Y. Sodium 4-mercaptophenolate Capped CdSe/ZnS Quantum Dots as a Fluorescent Probe for pH Detection in Acidic Aqueous Media. Luminescence 2018, 33, 410–416. 10.1002/bio.3428. [DOI] [PubMed] [Google Scholar]
- Li D.; Xu H.; Li D.; Wang Y. P-Aminothiophenol-Coated CdSe/ZnS Quantum Dots as a Turn-on Fluorescent Probe for pH Detection in Aqueous Media. Talanta 2017, 166, 54–62. 10.1016/j.talanta.2017.01.032. [DOI] [PubMed] [Google Scholar]
- Snee P. T.; Somers R. C.; Nair G.; Zimmer J. P.; Bawendi M. G.; Nocera D. G. A Ratiometric CdSe/ZnS Nanocrystal pH Sensor. J. Am. Chem. Soc. 2006, 128, 13320–13321. 10.1021/ja0618999. [DOI] [PubMed] [Google Scholar]
- Somers R. C.; Lanning R. M.; Snee P. T.; Greytak A. B.; Jain R. K.; Bawendi M. G.; Nocera D. G. A Nanocrystal-Based Ratiometric pH Sensor for Natural pH Ranges. Chem. Sci. 2012, 3, 2980–2985. 10.1039/c2sc20212c. [DOI] [PMC free article] [PubMed] [Google Scholar]
- Tang R.; Lee H.; Achilefu S. Induction of pH Sensitivity on the Fluorescence Lifetime of Quantum Dots by NIR Fluorescent Dyes. J. Am. Chem. Soc. 2012, 134, 4545–4548. 10.1021/ja300276s. [DOI] [PMC free article] [PubMed] [Google Scholar]
- Paek K.; Chung S.; Cho C.-H.; Kim B. J. Fluorescent and pH-Responsive Diblock Copolymer-Coated Core–Shell CdSe/ZnS Particles for a Color-Displaying, Ratiometric pH Sensor. Chem. Commun. 2011, 47, 10272–10274. 10.1039/c1cc13848k. [DOI] [PubMed] [Google Scholar]
- Ast S.; Rutledge P. J.; Todd M. H. pH-Responsive Quantum Dots (RQDs) That Combine a Fluorescent Nanoparticle with a pH-Sensitive Dye. Phys. Chem. Chem. Phys. 2014, 16, 25255–25257. 10.1039/C4CP03914A. [DOI] [PubMed] [Google Scholar]
- Jin T.; Sasaki A.; Kinjo M.; Miyazaki J. A Quantum Dot-Based Ratiometric pH Sensor. Chem. Commun. 2010, 46, 2408–2410. 10.1039/b921602b. [DOI] [PubMed] [Google Scholar]
- Liu T.; Wang W.; Ding H.; Yi D. Smartphone-Based Hand-Held Optical Fiber Fluorescence Sensor for On-Site pH Detection. IEEE Sens. J. 2019, 19, 9441–9446. 10.1109/JSEN.2019.2926153. [DOI] [Google Scholar]
- Medintz I. L.; Stewart M. H.; Trammell S. A.; Susumu K.; Delehanty J. B.; Mei B. C.; Melinger J. S.; Blanco-Canosa J. B.; Dawson P. E.; Mattoussi H. Quantum-Dot/Dopamine Bioconjugates Function as Redox Coupled Assemblies for in Vitro and Intracellular pH Sensing. Nat. Mater. 2010, 9, 676–684. 10.1038/nmat2811. [DOI] [PubMed] [Google Scholar]
- Susumu K.; Field L. D.; Oh E.; Hunt M.; Delehanty J. B.; Palomo V.; Dawson P. E.; Huston A. L.; Medintz I. L. Purple-, Blue-, and Green-Emitting Multishell Alloyed Quantum Dots: Synthesis, Characterization, and Application for Ratiometric Extracellular pH Sensing. Chem. Mater. 2017, 29, 7330–7344. 10.1021/acs.chemmater.7b02174. [DOI] [Google Scholar]
- Kurabayashi T.; Funaki N.; Fukuda T.; Akiyama S.; Suzuki M. CdSe/ZnS Quantum Dots Conjugated with a Fluorescein Derivative: A FRET-Based pH Sensor for Physiological Alkaline Conditions. Anal. Sci. 2014, 30, 545–550. 10.2116/analsci.30.545. [DOI] [PubMed] [Google Scholar]
- Liu Y.-S.; Sun Y.; Vernier P. T.; Liang C.-H.; Chong S. Y. C.; Gundersen M. A. pH-Sensitive Photoluminescence of CdSe/ZnSe/ZnS Quantum Dots in Human Ovarian Cancer Cells. J. Phys. Chem. C 2007, 111, 2872–2878. 10.1021/jp0654718. [DOI] [PMC free article] [PubMed] [Google Scholar]
- Yue Q.; Hu Y.; Tao L.; Zhang B.; Liu C.; Wang Y.; Chen C.; Zhao J.; Li C.-Z. Fluorometric Sensing of pH Values Using Green-Emitting Black Phosphorus Quantum Dots. Microchim. Acta 2019, 186, 640. 10.1007/s00604-019-3768-z. [DOI] [PubMed] [Google Scholar]
- Zu F.; Yan F.; Bai Z.; Xu J.; Wang Y.; Huang Y.; Zhou X. The Quenching of the Fluorescence of Carbon Dots: A Review on Mechanisms and Applications. Microchim. Acta 2017, 184, 1899–1914. 10.1007/s00604-017-2318-9. [DOI] [Google Scholar]
- Shen L.; Zhang L.; Chen M.; Chen X.; Wang J. The Production of pH-Sensitive Photoluminescent Carbon Nanoparticles by the Carbonization of Polyethylenimine and Their Use for Bioimaging. Carbon 2013, 55, 343–349. 10.1016/j.carbon.2012.12.074. [DOI] [Google Scholar]
- Chandra A.; Singh N. Biocompatible Fluorescent Carbon Dots for Ratiometric Intracellular pH Sensing. ChemistrySelect 2017, 2, 5723–5728. 10.1002/slct.201701012. [DOI] [Google Scholar]
- Zhong D.; Miao H.; Yang K.; Yang X. Carbon Dots Originated from Carnation for Fluorescent and Colorimetric pH Sensing. Mater. Lett. 2016, 166, 89–92. 10.1016/j.matlet.2015.12.061. [DOI] [Google Scholar]
- Nie H.; Li M.; Li Q.; Liang S.; Tan Y.; Sheng L.; Shi W.; Zhang S. X.-A. Carbon Dots with Continuously Tunable Full-Color Emission and Their Application in Ratiometric pH Sensing. Chem. Mater. 2014, 26, 3104–3112. 10.1021/cm5003669. [DOI] [Google Scholar]
- Wang N.; Zheng A.-Q.; Liu X.; Chen J.-J.; Yang T.; Chen M.-L.; Wang J.-H. Deep Eutectic Solvent-Assisted Preparation of Nitrogen/Chloride-Doped Carbon Dots for Intracellular Biological Sensing and Live Cell Imaging. ACS Appl. Mater. Interfaces 2018, 10, 7901–7909. 10.1021/acsami.8b00947. [DOI] [PubMed] [Google Scholar]
- Wang W.-J.; Xia J.-M.; Feng J.; He M.-Q.; Chen M.-L.; Wang J.-H. Green Preparation of Carbon Dots for Intracellular pH Sensing and Multicolor Live Cell Imaging. J. Mater. Chem. B 2016, 4, 7130–7137. 10.1039/C6TB02071B. [DOI] [PubMed] [Google Scholar]
- Pedro S. G.; Salinas-Castillo A.; Ariza-Avidad M.; Lapresta-Fernández A.; Sánchez-González C.; Martínez-Cisneros C. S.; Puyol M.; Capitan-Vallvey L. F.; Alonso-Chamarro J. Microsystem-Assisted Synthesis of Carbon Dots with Fluorescent and Colorimetric Properties for pH Detection. Nanoscale 2014, 6, 6018–6024. 10.1039/C4NR00573B. [DOI] [PubMed] [Google Scholar]
- Jiao Y.; Gong X.; Han H.; Gao Y.; Lu W.; Liu Y.; Xian M.; Shuang S.; Dong C. Facile Synthesis of Orange Fluorescence Carbon Dots with Excitation Independent Emission for pH Sensing and Cellular Imaging. Anal. Chim. Acta 2018, 1042, 125–132. 10.1016/j.aca.2018.08.044. [DOI] [PubMed] [Google Scholar]
- Liu X.; Yang C.; Zheng B.; Dai J.; Yan L.; Zhuang Z.; Du J.; Guo Y.; Xiao D. Green Anhydrous Synthesis of Hydrophilic Carbon Dots on Large-Scale and Their Application for Broad Fluorescent pH Sensing. Sens. Actuators, B 2018, 255, 572–579. 10.1016/j.snb.2017.08.101. [DOI] [Google Scholar]
- Li B.; Ma H.; Zhang B.; Qian J.; Cao T.; Feng H.; Li W.; Dong Y.; Qin W. Dually Emitting Carbon Dots as Fluorescent Probes for Ratiometric Fluorescent Sensing of pH Values, Mercury (II), Chloride and Cr (VI) via Different Mechanisms. Microchim. Acta 2019, 186, 341. 10.1007/s00604-019-3437-2. [DOI] [PubMed] [Google Scholar]
- Wang Q.; Yang H.; Zhang Q.; Ge H.; Zhang S.; Wang Z.; Ji X. Strong Acid-Assisted Preparation of Green-Emissive Carbon Dots for Fluorometric Imaging of pH Variation in Living Cells. Microchim. Acta 2019, 186, 468. 10.1007/s00604-019-3569-4. [DOI] [PubMed] [Google Scholar]
- Chandra A.; Singh N. Cell Microenvironment pH Sensing in 3D Microgels Using Fluorescent Carbon Dots. ACS Biomater. Sci. Eng. 2017, 3, 3620–3627. 10.1021/acsbiomaterials.7b00740. [DOI] [PubMed] [Google Scholar]
- Zhu X.; Jin H.; Gao C.; Gui R.; Wang Z. Ratiometric, Visual, Dual-Signal Fluorescent Sensing and Imaging of pH/Copper Ions in Real Samples Based on Carbon Dots-Fluorescein Isothiocyanate Composites. Talanta 2017, 162, 65–71. 10.1016/j.talanta.2016.10.015. [DOI] [PubMed] [Google Scholar]
- Essner J. B.; Laber C. H.; Ravula S.; Polo-Parada L.; Baker G. A. Pee-Dots: Biocompatible Fluorescent Carbon Dots Derived from the Upcycling of Urine. Green Chem. 2016, 18, 243–250. 10.1039/C5GC02032H. [DOI] [Google Scholar]
- D'Angelis do E. S. Barbosa C.; Correa J. R.; Medeiros G. A.; Barreto G.; Magalhães K. G.; de Oliveira A. L.; Spencer J.; Rodrigues M. O.; Neto B. A. D. Carbon Dots (C-dots) from Cow Manure with Impressive Subcellular Selectivity Tuned by Simple Chemical Modification. Chem. - Eur. J. 2015, 21, 5055–5060. 10.1002/chem.201406330. [DOI] [PubMed] [Google Scholar]
- Du F.; Ming Y.; Zeng F.; Yu C.; Wu S. A Low Cytotoxic and Ratiometric Fluorescent Nanosensor Based on Carbon-Dots for Intracellular pH Sensing and Mapping. Nanotechnology 2013, 24, 365101. 10.1088/0957-4484/24/36/365101. [DOI] [PubMed] [Google Scholar]
- Liu W.; Li C.; Sun X.; Pan W.; Wang J. Carbon-Dot-Based Ratiometric Fluorescent pH Sensor for the Detections of Very Weak Acids Assisted by Auxiliary Reagents That Contribute to the Release of Protons. Sens. Actuators, B 2017, 244, 441–449. 10.1016/j.snb.2017.01.009. [DOI] [Google Scholar]
- Shi W.; Li X.; Ma H. A Tunable Ratiometric pH Sensor Based on Carbon Nanodots for the Quantitative Measurement of the Intracellular pH of Whole Cells. Angew. Chem., Int. Ed. 2012, 51, 6432–6435. 10.1002/anie.201202533. [DOI] [PubMed] [Google Scholar]
- Qu S.; Chen H.; Zheng X.; Cao J.; Liu X. Ratiometric Fluorescent Nanosensor Based on Water Soluble Carbon Nanodots with Multiple Sensing Capacities. Nanoscale 2013, 5, 5514–5518. 10.1039/c3nr00619k. [DOI] [PubMed] [Google Scholar]
- Zhang C.; Cui Y.; Song L.; Liu X.; Hu Z. Microwave Assisted One-Pot Synthesis of Graphene Quantum Dots as Highly Sensitive Fluorescent Probes for Detection of Iron Ions and pH Value. Talanta 2016, 150, 54–60. 10.1016/j.talanta.2015.12.015. [DOI] [PubMed] [Google Scholar]
- Wang C.; Xu Z.; Cheng H.; Lin H.; Humphrey M. G.; Zhang C. A Hydrothermal Route to Water-Stable Luminescent Carbon Dots as Nanosensors for pH and Temperature. Carbon 2015, 82, 87–95. 10.1016/j.carbon.2014.10.035. [DOI] [Google Scholar]
- Yao C.; Xu Y.; Xia Z. A Carbon Dot-Encapsulated UiO-Type Metal Organic Framework as a Multifunctional Fluorescent Sensor for Temperature, Metal Ion and pH Detection. J. Mater. Chem. C 2018, 6, 4396–4399. 10.1039/C8TC01018H. [DOI] [Google Scholar]
- Liu G.; Li S.; Cheng M.; Zhao L.; Zhang B.; Gao Y.; Xu Y.; Liu F.; Lu G. Facile Synthesis of Nitrogen and Sulfur Co-Doped Carbon Dots for Multiple Sensing Capacities: Alkaline Fluorescence Enhancement Effect, Temperature Sensing, and Selective Detection of Fe 3+ Ions. New J. Chem. 2018, 42, 13147–13156. 10.1039/C8NJ02086H. [DOI] [Google Scholar]
- Wang Z.; Lu Y.; Yuan H.; Ren Z.; Xu C.; Chen J. Microplasma-Assisted Rapid Synthesis of Luminescent Nitrogen-Doped Carbon Dots and Their Application in pH Sensing and Uranium Detection. Nanoscale 2015, 7, 20743–20748. 10.1039/C5NR05804J. [DOI] [PubMed] [Google Scholar]
- Moniruzzaman M.; Kim J. Mechanistic Studies on the β-Resorcylic Acid Mediated Carbon Dots for the pH-Induced Fluorescence Switch and Sensing Application. Dyes Pigm. 2019, 163, 538–546. 10.1016/j.dyepig.2018.12.041. [DOI] [Google Scholar]
- Wang L.; Li M.; Li W.; Han Y.; Liu Y.; Li Z.; Zhang B.; Pan D. Rationally Designed Efficient Dual-Mode Colorimetric/Fluorescence Sensor Based on Carbon Dots for Detection of pH and Cu 2+ Ions. ACS Sustainable Chem. Eng. 2018, 6, 12668–12674. 10.1021/acssuschemeng.8b01625. [DOI] [Google Scholar]
- Park C. H.; Yang H.; Lee J.; Cho H.-H.; Kim D.; Lee D. C.; Kim B. J. Multicolor Emitting Block Copolymer-Integrated Graphene Quantum Dots for Colorimetric, Simultaneous Sensing of Temperature, pH, and Metal Ions. Chem. Mater. 2015, 27, 5288–5294. 10.1021/acs.chemmater.5b01545. [DOI] [Google Scholar]
- Wang Y.; Xu J.; Lei L.; Wang F.; Xu Z.; Zhang W. Multi-Functional Carbon Dots-Based Nanoprobe for Ratiometric Enzyme Reaction Monitoring and Biothiol Analysis. Sens. Actuators, B 2018, 264, 296–303. 10.1016/j.snb.2018.02.183. [DOI] [Google Scholar]
- Shi B.; Zhang L.; Lan C.; Zhao J.; Su Y.; Zhao S. One-Pot Green Synthesis of Oxygen-Rich Nitrogen-Doped Graphene Quantum Dots and Their Potential Application in pH-Sensitive Photoluminescence and Detection of Mercury(II) Ions. Talanta 2015, 142, 131–139. 10.1016/j.talanta.2015.04.059. [DOI] [PubMed] [Google Scholar]
- Doroodmand M. M.; Askari M. Synthesis of a Novel Nitrogen-Doped Carbon Dot by Microwave-Assisted Carbonization Method and Its Applications as Selective Probes for Optical pH (Acidity) Sensing in Aqueous/Nonaqueous Media, Determination of Nitrate/Nitrite, and Optical Recognition of NOX Gas. Anal. Chim. Acta 2017, 968, 74–84. 10.1016/j.aca.2017.02.041. [DOI] [PubMed] [Google Scholar]
- Chen J.-L.; Yan X.-P. Ionic Strength and pH Reversible Response of Visible and Near-Infrared Fluorescence of Graphene Oxide Nanosheets for Monitoring the Extracellular pH. Chem. Commun. 2011, 47, 3135–3137. 10.1039/c0cc03999c. [DOI] [PubMed] [Google Scholar]
- Kwon H.; Kim M.; Meany B.; Piao Y.; Powell L. R.; Wang Y. Optical Probing of Local pH and Temperature in Complex Fluids with Covalently Functionalized, Semiconducting Carbon Nanotubes. J. Phys. Chem. C 2015, 119, 3733–3739. 10.1021/jp509546d. [DOI] [Google Scholar]
- Ehtesabi H.; Hallaji Z.; Najafi Nobar S.; Bagheri Z. Carbon Dots with pH-Responsive Fluorescence: A Review on Synthesis and Cell Biological Applications. Microchim. Acta 2020, 187, 150 10.1007/s00604-019-4091-4. [DOI] [PubMed] [Google Scholar]
- Moniruzzaman M.; Kim J. N-Doped Carbon Dots with Tunable Emission for Multifaceted Application: Solvatochromism, Moisture Sensing, pH Sensing, and Solid State Multicolor Lighting. Sens. Actuators, B 2019, 295, 12–21. 10.1016/j.snb.2019.05.035. [DOI] [Google Scholar]
- Jia X.; Li J.; Wang E. One-Pot Green Synthesis of Optically pH-Sensitive Carbon Dots with Upconversion Luminescence. Nanoscale 2012, 4, 5572–5575. 10.1039/c2nr31319g. [DOI] [PubMed] [Google Scholar]
- Wu Z. L.; Gao M. X.; Wang T. T.; Wan X. Y.; Zheng L. L.; Huang C. Z. A General Quantitative pH Sensor Developed with Dicyandiamide N-Doped High Quantum Yield Graphene Quantum Dots. Nanoscale 2014, 6, 3868–3874. 10.1039/C3NR06353D. [DOI] [PubMed] [Google Scholar]
- Yang S.; Chen X.; Liu S.; Wang F.; Ouyang G. Microwave-Assisted Solid-Phase Synthesis of Highly Fluorescent Carbon Nanoparticles and Its Application in Intracellular pH Sensing. Talanta 2018, 186, 80–87. 10.1016/j.talanta.2018.04.031. [DOI] [PubMed] [Google Scholar]
- Shangguan J.; He D.; He X.; Wang K.; Xu F.; Liu J.; Tang J.; Yang X.; Huang J. Label-Free Carbon-Dots-Based Ratiometric Fluorescence pH Nanoprobes for Intracellular pH Sensing. Anal. Chem. 2016, 88, 7837–7843. 10.1021/acs.analchem.6b01932. [DOI] [PubMed] [Google Scholar]
- Yang M.; Li B.; Zhong K.; Lu Y. Photoluminescence Properties of N-Doped Carbon Dots Prepared in Different Solvents and Applications in pH Sensing. J. Mater. Sci. 2018, 53, 2424–2433. 10.1007/s10853-017-1700-7. [DOI] [Google Scholar]
- Sun Y.; Wang X.; Wang C.; Tong D.; Wu Q.; Jiang K.; Jiang Y.; Wang C.; Yang M. Red Emitting and Highly Stable Carbon Dots with Dual Response to pH Values and Ferric Ions. Microchim. Acta 2018, 185, 83. 10.1007/s00604-017-2544-1. [DOI] [PubMed] [Google Scholar]
- Wang L.; Chen Y. Lanthanide Doped Carbon Dots as a Fluorescence Chromaticity-Based pH Probe. Microchim. Acta 2018, 185, 489. 10.1007/s00604-018-3027-8. [DOI] [PubMed] [Google Scholar]
- Mondal T. K.; Saha S. K. Facile Approach To Synthesize Nitrogen- and Oxygen-Rich Carbon Quantum Dots for pH Sensor, Fluorescent Indicator, and Invisible Ink Applications. ACS Sustainable Chem. Eng. 2019, 7, 19669–19678. 10.1021/acssuschemeng.9b04817. [DOI] [Google Scholar]
- Xia C.; Cao M.; Xia J.; Zhou G.; Jiang D.; Zhang D.; Wang J.; Li H. An Ultrafast Responsive and Sensitive Ratiometric Fluorescent pH Nanoprobe Based on Label-Free Dual-Emission Carbon Dots. J. Mater. Chem. C 2019, 7, 2563–2569. 10.1039/C8TC05693E. [DOI] [Google Scholar]
- Wang Y.; Lu L.; Peng H.; Xu J.; Wang F.; Qi R.; Xu Z.; Zhang W. Multi-Doped Carbon Dots with Ratiometric pH Sensing Properties for Monitoring Enzyme Catalytic Reactions. Chem. Commun. 2016, 52, 9247–9250. 10.1039/C6CC02874H. [DOI] [PubMed] [Google Scholar]
- Zhang T.; Zhai Y.; Wang H.; Zhu J.; Xu L.; Dong B.; Song H. Facilely Prepared Carbon Dots and Rare Earth Ion Doped Hybrid Composites for Ratio-Metric pH Sensing and White-Light Emission. RSC Adv. 2016, 6, 61468–61472. 10.1039/C6RA11386A. [DOI] [Google Scholar]
- Hu S.; Meng X.; Tian F.; Yang W.; Li N.; Xue C.; Yang J.; Chang Q. Dual Photoluminescence Centers from Inorganic-Salt-Functionalized Carbon Dots for Ratiometric pH Sensing. J. Mater. Chem. C 2017, 5, 9849–9853. 10.1039/C7TC03266H. [DOI] [Google Scholar]
- Pal A.; Ahmad K.; Dutta D.; Chattopadhyay A. Boron Doped Carbon Dots with Unusually High Photoluminescence Quantum Yield for Ratiometric Intracellular pH Sensing. ChemPhysChem 2019, 20, 1018–1027. 10.1002/cphc.201900140. [DOI] [PubMed] [Google Scholar]
- Mao Y.; Bao Y.; Yan L.; Li G.; Li F.; Han D.; Zhang X.; Niu L. pH-Switched Luminescence and Sensing Properties of a Carbon Dot–Polyaniline Composite. RSC Adv. 2013, 3, 5475–5482. 10.1039/c3ra22991b. [DOI] [Google Scholar]
- Shi B.; Su Y.; Zhang L.; Liu R.; Huang M.; Zhao S. Nitrogen-Rich Functional Groups Carbon Nanoparticles Based Fluorescent pH Sensor with Broad-Range Responding for Environmental and Live Cells Applications. Biosens. Bioelectron. 2016, 82, 233–239. 10.1016/j.bios.2016.04.003. [DOI] [PubMed] [Google Scholar]
- Lu L.; Liu C.; Li G.; Liu L.-J.; Leung C.-H.; Ma D.-L. Low Toxic Fluorescent Nanoprobe Applicable for Sensing pH Changes in Biological Environment. Sens. Actuators, B 2018, 257, 860–865. 10.1016/j.snb.2017.11.047. [DOI] [Google Scholar]
- Yuan F.; Ding L.; Li Y.; Li X.; Fan L.; Zhou S.; Fang D.; Yang S. Multicolor Fluorescent Graphene Quantum Dots Colorimetrically Responsive to All-pH and a Wide Temperature Range. Nanoscale 2015, 7, 11727–11733. 10.1039/C5NR02007G. [DOI] [PubMed] [Google Scholar]
- Shao T.; Zhang P.; Tang L.; Zhuo S.; Zhu C. Highly Sensitive Enzymatic Determination of Urea Based on the pH-Dependence of the Fluorescence of Graphene Quantum Dots. Microchim. Acta 2015, 182, 1431–1437. 10.1007/s00604-015-1469-9. [DOI] [Google Scholar]
- Hong S. W.; Kim K. H.; Huh J.; Ahn C.-H.; Jo W. H. Design and Synthesis of a New pH Sensitive Polymeric Sensor Using Fluorescence Resonance Energy Transfer. Chem. Mater. 2005, 17, 6213–6215. 10.1021/cm051663o. [DOI] [Google Scholar]
- Paek K.; Yang H.; Lee J.; Park J.; Kim B. J. Efficient Colorimetric pH Sensor Based on Responsive Polymer–Quantum Dot Integrated Graphene Oxide. ACS Nano 2014, 8, 2848–2856. 10.1021/nn406657b. [DOI] [PubMed] [Google Scholar]
- Zhou K.; Liu H.; Zhang S.; Huang X.; Wang Y.; Huang G.; Sumer B. D.; Gao J. Multicolored pH-Tunable and Activatable Fluorescence Nanoplatform Responsive to Physiologic pH Stimuli. J. Am. Chem. Soc. 2012, 134, 7803–7811. 10.1021/ja300176w. [DOI] [PMC free article] [PubMed] [Google Scholar]
- You S.; Cai Q.; Müllen K.; Yang W.; Yin M. pH-Sensitive Unimolecular Fluorescent Polymeric Micelles: From Volume Phase Transition to Optical Response. Chem. Commun. 2014, 50, 823–825. 10.1039/C3CC48046A. [DOI] [PubMed] [Google Scholar]
- Frisch H.; Besenius P. pH-Switchable Self-Assembled Materials. Macromol. Rapid Commun. 2015, 36, 346–363. 10.1002/marc.201400623. [DOI] [PubMed] [Google Scholar]
- Hong S. W.; Jo W. H. A Fluorescence Resonance Energy Transfer Probe for Sensing pH in Aqueous Solution. Polymer 2008, 49, 4180–4187. 10.1016/j.polymer.2008.07.044. [DOI] [Google Scholar]
- Chiu Y.-L.; Chen S.-A.; Chen J.-H.; Chen K.-J.; Chen H.-L.; Sung H.-W. A Dual-Emission Forster Resonance Energy Transfer Nanoprobe for Sensing/Imaging pH Changes in the Biological Environment. ACS Nano 2010, 4, 7467–7474. 10.1021/nn102644u. [DOI] [PubMed] [Google Scholar]
- Fu L.; Yuan P.; Ruan Z.; Liu L.; Li T.; Yan L. Ultra-pH-Sensitive Polypeptide Micelles with Large Fluorescence off/on Ratio in near Infrared Range. Polym. Chem. 2017, 8, 1028–1038. 10.1039/C6PY01818A. [DOI] [Google Scholar]
- Ma X.; Wang Y.; Zhao T.; Li Y.; Su L.-C.; Wang Z.; Huang G.; Sumer B. D.; Gao J. Ultra-pH-Sensitive Nanoprobe Library with Broad pH Tunability and Fluorescence Emissions. J. Am. Chem. Soc. 2014, 136, 11085–11092. 10.1021/ja5053158. [DOI] [PMC free article] [PubMed] [Google Scholar]
- Liu T.; Hu J.; Jin Z.; Jin F.; Liu S. Two-Photon Ratiometric Fluorescent Mapping of Intracellular Transport Pathways of pH-Responsive Block Copolymer Micellar Nanocarriers. Adv. Healthcare Mater. 2013, 2, 1576–1581. 10.1002/adhm.201200436. [DOI] [PubMed] [Google Scholar]
- Wang X.; Stolwijk J. A.; Lang T.; Sperber M.; Meier R. J.; Wegener J.; Wolfbeis O. S. Ultra-Small, Highly Stable, and Sensitive Dual Nanosensors for Imaging Intracellular Oxygen and pH in Cytosol. J. Am. Chem. Soc. 2012, 134, 17011–17014. 10.1021/ja308830e. [DOI] [PubMed] [Google Scholar]
- Wu W.; Aiello M.; Zhou T.; Berliner A.; Banerjee P.; Zhou S. In-Situ Immobilization of Quantum Dots in Polysaccharide-Based Nanogels for Integration of Optical pH-Sensing, Tumor Cell Imaging, and Drug Delivery. Biomaterials 2010, 31, 3023–3031. 10.1016/j.biomaterials.2010.01.011. [DOI] [PubMed] [Google Scholar]
- Yan L.; Chang Y.-N.; Yin W.; Liu X.; Xiao D.; Xing G.; Zhao L.; Gu Z.; Zhao Y. Biocompatible and Flexible Graphene Oxide/Upconversion Nanoparticle Hybrid Film for Optical pH Sensing. Phys. Chem. Chem. Phys. 2014, 16, 1576–1582. 10.1039/C3CP54317J. [DOI] [PubMed] [Google Scholar]
- Bai Z.; Chen R.; Si P.; Huang Y.; Sun H.; Kim D.-H. Fluorescent pH Sensor Based on Ag@SiO2 Core–Shell Nanoparticle. ACS Appl. Mater. Interfaces 2013, 5, 5856–5860. 10.1021/am401528w. [DOI] [PubMed] [Google Scholar]
- Panda B. R.; Chattopadhyay A. A Water-Soluble Polythiophene–Au Nanoparticle Composite for pH Sensing. J. Colloid Interface Sci. 2007, 316, 962–967. 10.1016/j.jcis.2007.08.033. [DOI] [PubMed] [Google Scholar]
- Liu X.; Chen Q.; Yang G.; Zhang L.; Liu Z.; Cheng Z.; Zhu X. Magnetic Nanomaterials with Near-Infrared pH-Activatable Fluorescence via Iron-Catalyzed AGET ATRP for Tumor Acidic Microenvironment Imaging. J. Mater. Chem. B 2015, 3, 2786–2800. 10.1039/C5TB00070J. [DOI] [PubMed] [Google Scholar]
- Lapresta-Fernández A.; Doussineau T.; Moro A. J.; Dutz S.; Steiniger F.; Mohr G. J. Magnetic Core–Shell Fluorescent pH Ratiometric Nanosensor Using a Stöber Coating Method. Anal. Chim. Acta 2011, 707, 164–170. 10.1016/j.aca.2011.09.008. [DOI] [PubMed] [Google Scholar]
- Wu W.; Shen J.; Gai Z.; Hong K.; Banerjee P.; Zhou S. Multi-Functional Core-Shell Hybrid Nanogels for pH-Dependent Magnetic Manipulation, Fluorescent pH-Sensing, and Drug Delivery. Biomaterials 2011, 32, 9876–9887. 10.1016/j.biomaterials.2011.08.082. [DOI] [PubMed] [Google Scholar]
- Asselin J.; Roy C.; Boudreau D.; Messaddeq Y.; Bouchareb R.; Mathieu P. Supported Core–Shell Nanobiosensors for Quantitative Fluorescence Imaging of Extracellular pH. Chem. Commun. 2014, 50, 13746–13749. 10.1039/C4CC06075J. [DOI] [PubMed] [Google Scholar]
- Sun S.; Ning X.; Zhang G.; Wang Y.-C.; Peng C.; Zheng J. Dimerization of Organic Dyes on Luminescent Gold Nanoparticles for Ratiometric pH Sensing. Angew. Chem., Int. Ed. 2016, 55, 2421–2424. 10.1002/anie.201509515. [DOI] [PMC free article] [PubMed] [Google Scholar]
- Mineo P. G.; Abbadessa A.; Rescifina A.; Mazzaglia A.; Nicosia A.; Scamporrino A. A. PEGylate Porphyrin-Gold Nanoparticles Conjugates as Removable pH-Sensor Nano-Probes for Acidic Environments. Colloids Surf., A 2018, 546, 40–47. 10.1016/j.colsurfa.2018.02.061. [DOI] [Google Scholar]
- Ding C.; Cheng S.; Zhang C.; Xiong Y.; Ye M.; Xian Y. Ratiometric Upconversion Luminescence Nanoprobe with Near-Infrared Ag2 S Nanodots as the Energy Acceptor for Sensing and Imaging of pH in Vivo. Anal. Chem. 2019, 91, 7181–7188. 10.1021/acs.analchem.9b00404. [DOI] [PubMed] [Google Scholar]
- Wang C.; Otto S.; Dorn M.; Heinze K.; Resch-Genger U. Luminescent TOP Nanosensors for Simultaneously Measuring Temperature, Oxygen, and pH at a Single Excitation Wavelength. Anal. Chem. 2019, 91, 2337–2344. 10.1021/acs.analchem.8b05060. [DOI] [PubMed] [Google Scholar]
- Zhao Y.; Chang C.; Gai P.; Han L.; Li F.; Li B. One-Step Synthesis of Fluorescent Organic Nanoparticles: The Application to Label-Free Ratiometric Fluorescent pH Sensor. Sens. Actuators, B 2018, 273, 1479–1486. 10.1016/j.snb.2018.07.047. [DOI] [Google Scholar]
- Guo J.; Xiong S.; Wu X.; Shen J.; Chu P. K. In Situ Probing of Intracellular pH by Fluorescence from Inorganic Nanoparticles. Biomaterials 2013, 34, 9183–9189. 10.1016/j.biomaterials.2013.08.023. [DOI] [PubMed] [Google Scholar]
- Fu L.; Du Y.; Zhang Z.; Sun H.; Zheng A.; Liu X. Dual Sensing of Glutathione and Acidic pH Values by Using MnO2 Nanosheets and 3-Acetyl-7-Hydroxy-2H-Chromen-2-One as a Fluorescent pH Probe. Microchim. Acta 2019, 186, 491. 10.1007/s00604-019-3590-7. [DOI] [PubMed] [Google Scholar]
- Luo J.; Xie Z.; Lam J. W.; Cheng L.; Chen H.; Qiu C.; Kwok H. S.; Zhan X.; Liu Y.; Zhu D.; et al. Aggregation-Induced Emission of 1-Methyl-1, 2, 3, 4, 5-Pentaphenylsilole. Chem. Commun. 2001, 18, 1740–1741. 10.1039/b105159h. [DOI] [PubMed] [Google Scholar]
- Hong Y.; Lam J. W.; Tang B. Z. Aggregation-Induced Emission: Phenomenon, Mechanism and Applications. Chem. Commun. 2009, 29, 4332–4353. 10.1039/b904665h. [DOI] [PubMed] [Google Scholar]
- Chen S.; Hong Y.; Liu Y.; Liu J.; Leung C. W.; Li M.; Kwok R. T.; Zhao E.; Lam J. W.; Yu Y.; et al. Full-Range Intracellular pH Sensing by an Aggregation-Induced Emission-Active Two-Channel Ratiometric Fluorogen. J. Am. Chem. Soc. 2013, 135, 4926–4929. 10.1021/ja400337p. [DOI] [PubMed] [Google Scholar]
- Fang M.; Xia S.; Bi J.; Wigstrom T. P.; Valenzano L.; Wang J.; Mazi W.; Tanasova M.; Luo F.-T.; Liu H. A Cyanine-Based Fluorescent Cassette with Aggregation-Induced Emission for Sensitive Detection of pH Changes in Live Cells. Chem. Commun. 2018, 54, 1133–1136. 10.1039/C7CC08986D. [DOI] [PMC free article] [PubMed] [Google Scholar]
- Rananaware A.; Bhosale R. S.; Patil H.; Al Kobaisi M.; Abraham A.; Shukla R.; Bhosale S. V.; Bhosale S. V. Precise Aggregation-Induced Emission Enhancement via H+ Sensing and Its Use in Ratiometric Detection of Intracellular pH Values. RSC Adv. 2014, 4, 59078–59082. 10.1039/C4RA10511G. [DOI] [Google Scholar]
- Wang L.; Yang L.; Cao D. Probes Based on Diketopyrrolopyrrole and Anthracenone Conjugates with Aggregation-Induced Emission Characteristics for pH and BSA Sensing. Sens. Actuators, B 2015, 221, 155–166. 10.1016/j.snb.2015.06.074. [DOI] [Google Scholar]
- Zhao Y.; Zhu W.; Ren L.; Zhang K. Aggregation-Induced Emission Polymer Nanoparticles with pH-Responsive Fluorescence. Polym. Chem. 2016, 7, 5386–5395. 10.1039/C6PY01009A. [DOI] [Google Scholar]
- Zhou H.; Liu F.; Wang X.; Yan H.; Song J.; Ye Q.; Tang B. Z.; Xu J. Aggregation Induced Emission Based Fluorescence pH and Temperature Sensors: Probing Polymer Interactions in Poly (N-Isopropyl Acrylamide-Co-Tetra (Phenyl) Ethene Acrylate)/Poly (Methacrylic Acid) Interpenetrating Polymer Networks. J. Mater. Chem. C 2015, 3, 5490–5498. 10.1039/C5TC00752F. [DOI] [Google Scholar]
- Song P.; Chen X.; Xiang Y.; Huang L.; Zhou Z.; Wei R.; Tong A. A Ratiometric Fluorescent pH Probe Based on Aggregation-Induced Emission Enhancement and Its Application in Live-Cell Imaging. J. Mater. Chem. 2011, 21, 13470–13475. 10.1039/c1jm12098k. [DOI] [Google Scholar]
- Wang A.; Fan R.; Zhou Y.; Zheng X.; Zhou X.; Hao S.; Yang Y. Multiple-Color Aggregation-Induced Emission-Based Schiff Base Sensors for Ultrafast Dual Recognition of Hg2+ and pH Integrating Boolean Logic Operations. J. Coord. Chem. 2019, 72, 102–118. 10.1080/00958972.2018.1546851. [DOI] [Google Scholar]
- Yan L.; Qing T.; Li R.; Wang Z.; Qi Z. Synthesis and Optical Properties of Aggregation-Induced Emission (AIE) Molecules Based on the ESIPT Mechanism as pH-and Zn 2+-Responsive Fluorescent Sensors. RSC Adv. 2016, 6, 63874–63879. 10.1039/C6RA09920C. [DOI] [Google Scholar]
- Ma X.; Cheng J.; Liu J.; Zhou X.; Xiang H. Ratiometric Fluorescent pH Probes Based on Aggregation-Induced Emission-Active Salicylaldehyde Azines. New J. Chem. 2015, 39, 492–500. 10.1039/C4NJ01908C. [DOI] [Google Scholar]
- Tian D.; Zheng X.; Li X.; Liu X.; Zhao J.; Wang J. Tunable Aggregation-Induced Emission of Imidazole Hydrazones by pH and Anions. Chem. - Eur. J. 2019, 25, 16519–16522. 10.1002/chem.201904259. [DOI] [PubMed] [Google Scholar]
- Lin N.; Chen X.; Yan S.; Wang H.; Lu Z.; Xia X.; Liang M.; Wu Y.-L.; Zheng L.; Cao Q.; et al. An Aggregation-Induced Emission-Based pH-Sensitive Fluorescent Probe for Intracellular Acidity Sensing. RSC Adv. 2016, 6, 25416–25419. 10.1039/C6RA01167E. [DOI] [Google Scholar]
- Lu H.; Xu B.; Dong Y.; Chen F.; Li Y.; Li Z.; He J.; Li H.; Tian W. Novel Fluorescent pH Sensors and a Biological Probe Based on Anthracene Derivatives with Aggregation-Induced Emission Characteristics. Langmuir 2010, 26, 6838–6844. 10.1021/la904727t. [DOI] [PubMed] [Google Scholar]
- Wu D.; Shao L.; Li Y.; Hu Q.; Huang F.; Yu G.; Tang G. A Boron Difluoride Dye Showing the Aggregation-Induced Emission Feature and High Sensitivity to Intra-and Extra-Cellular pH Changes. Chem. Commun. 2016, 52, 541–544. 10.1039/C5CC08429F. [DOI] [PubMed] [Google Scholar]
- Bai Y.; Liu D.; Han Z.; Chen Y.; Chen Z.; Jiao Y.; He W.; Guo Z. BODIPY-Derived Ratiometric Fluorescent Sensors: pH-Regulated Aggregation-Induced Emission and Imaging Application in Cellular Acidification Triggered by Crystalline Silica Exposure. Sci. China: Chem. 2018, 61, 1413–1422. 10.1007/s11426-018-9284-4. [DOI] [Google Scholar]
- Yu Y.; Yu C.; Wu Q.; Wang H.; Jiao L.; Wong W.-Y.; Hao E. Pure E/Z Isomers of N-Methylpyrrole-Benzohydrazide-Based BF 2 Complexes: Remarkable Aggregation-, Crystallization-Induced Emission Switching Properties and Application in Sensing Intracellular pH Microenvironment. J. Mater. Chem. C 2019, 7, 4533–4542. 10.1039/C9TC00473D. [DOI] [Google Scholar]
- Flannery D.; James S. W.; Tatam R. P.; Ashwell G. J. pH Sensor Using Langmuir–Blodgett Overlays on Polished Optical Fibers. Opt. Lett. 1997, 22, 567–569. 10.1364/OL.22.000567. [DOI] [PubMed] [Google Scholar]
- Raoufi N.; Surre F.; Rajarajan M.; Sun T.; Grattan K. T. Fiber Optic pH Sensor Using Optimized Layer-by-Layer Coating Approach. IEEE Sens. J. 2014, 14, 47–54. 10.1109/JSEN.2013.2280283. [DOI] [Google Scholar]
- Surre F.; Lyons W.; Sun T.; Grattan K.; O’Keeffe S.; Lewis E.; Elosua C.; Hernaez M.; Barian C.. U-Bend Fibre Optic pH Sensors Using Layer-by-Layer Electrostatic Self-Assembly Technique; IOP Publishing, 2009; Vol. 178, p 012046. [Google Scholar]
- Gu B.; Yin M.; Zhang A. P.; Qian J.; He S. Biocompatible Fiber-Optic pH Sensor Based on Optical Fiber Modal Interferometer Self-Assembled with Sodium Alginate/Polyethylenimine Coating. IEEE Sens. J. 2012, 12, 1477–1482. 10.1109/JSEN.2011.2173481. [DOI] [Google Scholar]
- Goicoechea J.; Zamarreño C.; Matias I.; Arregui F. Utilization of White Light Interferometry in pH Sensing Applications by Mean of the Fabrication of Nanostructured Cavities. Sens. Actuators, B 2009, 138, 613–618. 10.1016/j.snb.2009.02.045. [DOI] [Google Scholar]
- Zhou Z.; Shinar R.; Allison A. J.; Shinar J. Enhanced Photoluminescence of Oxygen Sensing Films through Doping with High Dielectric Constant Particles. Adv. Funct. Mater. 2007, 17, 3530–3537. 10.1002/adfm.200700324. [DOI] [Google Scholar]
- Moßhammer M.; Strobl M.; Kühl M.; Klimant I.; Borisov S. M.; Koren K. Design and Application of an Optical Sensor for Simultaneous Imaging of pH and Dissolved O2 with Low Cross-Talk. ACS Sens. 2016, 1, 681–687. 10.1021/acssensors.6b00071. [DOI] [Google Scholar]
- Vesel A.; Junkar I.; Cvelbar U.; Kovac J.; Mozetic M. Surface Modification of Polyester by Oxygen-and Nitrogen-plasma Treatment. Surf. Interface Anal. 2008, 40, 1444–1453. 10.1002/sia.2923. [DOI] [Google Scholar]
- Chan C.-M.; Ko T.-M.; Hiraoka H. Polymer Surface Modification by Plasmas and Photons. Surf. Sci. Rep. 1996, 24, 1–54. 10.1016/0167-5729(96)80003-3. [DOI] [Google Scholar]
- Atkinson R. S.; Brimage D. R. G.; Davidson R. S.; Gray E. Use of Tertiary Amino-Groups as Substituents to Stabilise Compounds towards Attack by Singlet Oxygen. J. Chem. Soc., Perkin Trans. 1 1973, 960–964. 10.1039/p19730000960. [DOI] [Google Scholar]
- Matheson I.; Lee J. Quenching of Photophysically Formed Singlet (1. DELTA. 4g) Oxygen in Solution by Amines. J. Am. Chem. Soc. 1972, 94, 3310–3313. 10.1021/ja00765a006. [DOI] [Google Scholar]
- Ricketts S. R.; Douglas P. A Simple Colorimetric Luminescent Oxygen Sensor Using a Green LED with Pt Octaethylporphyrin in Ethyl Cellulose as the Oxygen-Responsive Element. Sens. Actuators, B 2008, 135, 46–51. 10.1016/j.snb.2008.07.017. [DOI] [Google Scholar]
- Ouannes C.; Wilson T. Quenching of Singlet Oxygen by Tertiary Aliphatic Amines. Effect of DABCO (1, 4-Diazabicyclo [2.2. 2] Octane). J. Am. Chem. Soc. 1968, 90, 6527–6528. 10.1021/ja01025a059. [DOI] [Google Scholar]
- Goicoechea J.; Zamarreño C. R.; Matías I. R.; Arregui F. J.. Study and Optimization of the Photobleaching in Self-Assembled Optical Fiber pH Sensors Based on HPTS Using DABCO Antifading Agent. In Optical Fiber Sensors; Optical Society of America, 2006; p TuE66. [Google Scholar]
- Guillory J.; Cook C. Energy Transfer Processes Involving Ultraviolet Stabilizers. Quenching of Singlet Oxygen. J. Polym. Sci., Polym. Chem. Ed. 1973, 11, 1927–1937. 10.1002/pol.1973.170110814. [DOI] [Google Scholar]
- Ackerman R.; Rosenthal I.; Pitts J. Jr Singlet Oxygen in the Environmental Sciences. X. Absolute Rates of Deactivation of O2 (1Δg) in the Gas Phase by Sulfur Compounds. J. Chem. Phys. 1971, 54, 4960–4961. 10.1063/1.1674778. [DOI] [Google Scholar]
- Bregnhøj M.; Prete M.; Turkovic V.; Petersen A. U.; Nielsen M. B.; Madsen M.; Ogilby P. R. Oxygen-Dependent Photophysics and Photochemistry of Prototypical Compounds for Organic Photovoltaics: Inhibiting Degradation Initiated by Singlet Oxygen at a Molecular Level. Methods Appl. Fluoresc. 2020, 8, 014001 10.1088/2050-6120/ab4edc. [DOI] [PubMed] [Google Scholar]
- Foote C. S.; Fujimoto T. T.; Chang Y. C. Chemistry of Singlet Oxygen. XV. Irrelevance of Azide Trapping to Mechanism of the Ene Reaction. Tetrahedron Lett. 1972, 13, 45–48. 10.1016/S0040-4039(01)84235-0. [DOI] [Google Scholar]
- Hasty N.; Merkel P. B.; Radlick P.; Kearns D. R. Role of Azide in Singlet Oxygen Reactions: Reaction of Azide with Singlet Oxygen. Tetrahedron Lett. 1972, 13, 49–52. 10.1016/S0040-4039(01)84236-2. [DOI] [Google Scholar]
- Engel E.; Schraml R.; Maisch T.; Kobuch K.; König B.; Szeimies R.-M.; Hillenkamp J.; Bäumler W.; Vasold R. Light-Induced Decomposition of Indocyanine Green. Invest. Ophthalmol. Visual Sci. 2008, 49, 1777–1783. 10.1167/iovs.07-0911. [DOI] [PubMed] [Google Scholar]
- van der Velde J. H.; Oelerich J.; Huang J.; Smit J. H.; Hiermaier M.; Ploetz E.; Herrmann A.; Roelfes G.; Cordes T. The Power of Two: Covalent Coupling of Photostabilizers for Fluorescence Applications. J. Phys. Chem. Lett. 2014, 5, 3792–3798. 10.1021/jz501874f. [DOI] [PubMed] [Google Scholar]
- Demchenko A. P. Photobleaching of Organic Fluorophores: Quantitative Characterization, Mechanisms. Methods Appl. Fluoresc. 2020, 8, 022001 10.1088/2050-6120/ab7365. [DOI] [PubMed] [Google Scholar]
- Szmacinski H.; Lakowicz J. R. Optical Measurements of pH Using Fluorescence Lifetimes and Phase-Modulation Fluorometry. Anal. Chem. 1993, 65, 1668–1674. 10.1021/ac00061a007. [DOI] [PMC free article] [PubMed] [Google Scholar]
- Jin L.; Shi L.; Shi W.; Meng Z.; Shang L.; Shen Y. Fluorescence Lifetime-Based pH Sensing by Platinum Nanoclusters. Analyst 2019, 144, 3533–3538. 10.1039/C9AN00061E. [DOI] [PubMed] [Google Scholar]
- Valeur B.Molecular Fluorescence: Principles and Applications; Wiley-VCH: Weinheim, 2001. [Google Scholar]
- Lippitsch M. E. Optical Sensors Based on Fluorescence Anisotropy. Sens. Actuators, B 1993, 11, 499–502. 10.1016/0925-4005(93)85293-J. [DOI] [Google Scholar]
- Lakowicz J. R.; Gryczynski I.; Gryczynski Z.; Dattelbaum J. D. Anisotropy-Based Sensing with Reference Fluorophores. Anal. Biochem. 1999, 267, 397–405. 10.1006/abio.1998.3029. [DOI] [PMC free article] [PubMed] [Google Scholar]
- Lakowicz J. R.; Szmacinski H.; Karakelle M. Optical Sensing of pH and pCO2 Using Phase-Modulation Fluorimetry and Resonance Energy Transfer. Anal. Chim. Acta 1993, 272, 179–186. 10.1016/0003-2670(93)80567-5. [DOI] [Google Scholar]
- Mayr T.; Borisov S. M.; Abel T.; Enko B.; Waich K.; Mistlberger G.; Klimant I. Light Harvesting as a Simple and Versatile Way to Enhance Brightness of Luminescent Sensors. Anal. Chem. 2009, 81, 6541–6545. 10.1021/ac900662x. [DOI] [Google Scholar]
- Kosch U.; Klimant I.; Werner T.; Wolfbeis O. S. Strategies To Design pH Optodes with Luminescence Decay Times in the Microsecond Time Regime. Anal. Chem. 1998, 70, 3892–3897. 10.1021/ac971282x. [DOI] [Google Scholar]
- Poehler E.; Pfeiffer S. A.; Herm M.; Gaebler M.; Busse B.; Nagl S. Microchamber Arrays with an Integrated Long Luminescence Lifetime pH Sensor. Anal. Bioanal. Chem. 2016, 408, 2927–2935. 10.1007/s00216-015-9178-0. [DOI] [PubMed] [Google Scholar]
- Meier R. J.; Simbürger J. M. B.; Soukka T.; Schäferling M. A FRET Based pH Probe with a Broad Working Range Applicable to Referenced Ratiometric Dual Wavelength and Luminescence Lifetime Read Out. Chem. Commun. 2015, 51, 6145–6148. 10.1039/C5CC00144G. [DOI] [PubMed] [Google Scholar]
- Turel M.; Cajlakovic M.; Austin E.; Dakin J. P.; Uray G.; Lobnik A. Direct UV-LED Lifetime pH Sensor Based on a Semi-Permeable Sol-Gel Membrane Immobilized Luminescent Eu3+ Chelate Complex. Sens. Actuators, B 2008, 131, 247–253. 10.1016/j.snb.2007.11.047. [DOI] [Google Scholar]
- Hiruta Y.; Yoshizawa N.; Citterio D.; Suzuki K. Highly Durable Double Sol–Gel Layer Ratiometric Fluorescent pH Optode Based on the Combination of Two Types of Quantum Dots and Absorbing pH Indicators. Anal. Chem. 2012, 84, 10650–10656. 10.1021/ac302178z. [DOI] [PubMed] [Google Scholar]
- Borisov S. M.; Klimant I. A Versatile Approach for Ratiometric Time-Resolved Read-out of Colorimetric Chemosensors Using Broadband Phosphors as Secondary Emitters. Anal. Chim. Acta 2013, 787, 219–225. 10.1016/j.aca.2013.05.032. [DOI] [PubMed] [Google Scholar]
- Sun L.-N.; Peng H.; Stich M. I. J.; Achatz D.; Wolfbeis O. S. pH Sensor Based on Upconverting Luminescent Lanthanide Nanorods. Chem. Commun. 2009, (33), 5000–5002. 10.1039/b907822c. [DOI] [PubMed] [Google Scholar]
- Meier R. J.; Simbürger J. M. B.; Soukka T.; Schäferling M. Background-Free Referenced Luminescence Sensing and Imaging of pH Using Upconverting Phosphors and Color Camera Read-Out. Anal. Chem. 2014, 86, 5535–5540. 10.1021/ac5009207. [DOI] [PubMed] [Google Scholar]
- Xie L.; Qin Y.; Chen H.-Y. Polymeric Optodes Based on Upconverting Nanorods for Fluorescent Measurements of pH and Metal Ions in Blood Samples. Anal. Chem. 2012, 84, 1969–1974. 10.1021/ac203003w. [DOI] [PubMed] [Google Scholar]
- Strobl M.; Mayr T.; Klimant I.; Borisov S. M. Photostable Upconverting and Downconverting pH Sensors Based on Combination of a Colorimetric NIR Indicator and Stable Inorganic Phosphors as Secondary Emitters. Sens. Actuators, B 2017, 245, 972–979. 10.1016/j.snb.2017.01.189. [DOI] [Google Scholar]
- Ali R.; Saleh S. M.; Aly S. M. Fluorescent Gold Nanoclusters as pH Sensors for the pH 5 to 9 Range and for Imaging of Blood Cell pH Values. Microchim. Acta 2017, 184, 3309–3315. 10.1007/s00604-017-2352-7. [DOI] [Google Scholar]
- Wang F.; Raval Y.; Chen H.; Tzeng T. J.; DesJardins J. D.; Anker J. N. Development of Luminescent pH Sensor Films for Monitoring Bacterial Growth through Tissue. Adv. Healthcare Mater. 2014, 3, 197–204. 10.1002/adhm.201300101. [DOI] [PMC free article] [PubMed] [Google Scholar]
- Ma T.; Ma Y.; Liu S.; Zhang L.; Yang T.; Yang H.-R.; Lv W.; Yu Q.; Xu W.; Zhao Q.; Huang W. Dye-Conjugated Upconversion Nanoparticles for Ratiometric Imaging of Intracellular pH Values. J. Mater. Chem. C 2015, 3, 6616–6620. 10.1039/C5TC00849B. [DOI] [Google Scholar]
- Radunz S.; Andresen E.; Würth C.; Koerdt A.; Tschiche H. R.; Resch-Genger U. Simple Self-Referenced Luminescent pH Sensors Based on Upconversion Nanocrystals and pH-Sensitive Fluorescent BODIPY Dyes. Anal. Chem. 2019, 91, 7756–7764. 10.1021/acs.analchem.9b01174. [DOI] [PubMed] [Google Scholar]
- Arppe R.; Näreoja T.; Nylund S.; Mattsson L.; Koho S.; Rosenholm J. M.; Soukka T.; Schäferling M. Photon Upconversion Sensitized Nanoprobes for Sensing and Imaging of pH. Nanoscale 2014, 6, 6837–6843. 10.1039/C4NR00461B. [DOI] [PubMed] [Google Scholar]
- Li H.; Dong H.; Yu M.; Liu C.; Li Z.; Wei L.; Sun L.-D.; Zhang H. NIR Ratiometric Luminescence Detection of pH Fluctuation in Living Cells with Hemicyanine Derivative-Assembled Upconversion Nanophosphors. Anal. Chem. 2017, 89, 8863–8869. 10.1021/acs.analchem.7b01324. [DOI] [PubMed] [Google Scholar]
- Tsai E. S.; Himmelstoß S. F.; Wiesholler L. M.; Hirsch T.; Hall E. A. H. Upconversion Nanoparticles for Sensing pH. Analyst 2019, 144, 5547–5557. 10.1039/C9AN00236G. [DOI] [PubMed] [Google Scholar]
- Li C.; Zuo J.; Zhang L.; Chang Y.; Zhang Y.; Tu L.; Liu X.; Xue B.; Li Q.; Zhao H.; et al. Accurate Quantitative Sensing of Intracellular pH Based on Self-Ratiometric Upconversion Luminescent Nanoprobe. Sci. Rep. 2016, 6, 38617. 10.1038/srep38617. [DOI] [PMC free article] [PubMed] [Google Scholar]
- Du S.; Hernández-Gil J.; Dong H.; Zheng X.; Lyu G.; Bañobre-López M.; Gallo J.; Sun L.; Yan C.; Long N. J. Design and Validation of a New Ratiometric Intracellular pH Imaging Probe Using Lanthanide-Doped Upconverting Nanoparticles. Dalton Trans 2017, 46, 13957–13965. 10.1039/C7DT02418E. [DOI] [PubMed] [Google Scholar]
- Näreoja T.; Deguchi T.; Christ S.; Peltomaa R.; Prabhakar N.; Fazeli E.; Perälä N.; Rosenholm J. M.; Arppe R.; Soukka T.; Schäferling M. Ratiometric Sensing and Imaging of Intracellular pH Using Polyethylenimine-Coated Photon Upconversion Nanoprobes. Anal. Chem. 2017, 89, 1501–1508. 10.1021/acs.analchem.6b03223. [DOI] [PubMed] [Google Scholar]
- Dutta J.; Rai V. K. APTES Modified GO-PEI-Er3+/Yb3+:NaYF4 Upconverting Nanoparticles Hybrid Film-Based Optical pH Sensor and NIR Photoelectric Response. IEEE Sens. J. 2019, 19, 3609–3615. 10.1109/JSEN.2019.2892785. [DOI] [Google Scholar]
- Wang S.; Feng J.; Song S.; Zhang H. A Long-Wave Optical pH Sensor Based on Red Upconversion Luminescence of NaGdF 4 Nanotubes. RSC Adv. 2014, 4, 55897–55899. 10.1039/C4RA09686J. [DOI] [Google Scholar]
- Liu X.; Zhang S.-Q.; Wei X.; Yang T.; Chen M.-L.; Wang J.-H. A Novel “Modularized” Optical Sensor for pH Monitoring in Biological Matrixes. Biosens. Bioelectron. 2018, 109, 150–155. 10.1016/j.bios.2018.02.052. [DOI] [PubMed] [Google Scholar]
- Xu D.; Li Y.; Poon C.-Y.; Chan H.-N.; Li H.-W.; Wong M. S. A Zero Cross-Talk Ratiometric Two-Photon Probe for Imaging of Acid pH in Living Cells and Tissues and Early Detection of Tumor in Mouse Model. Anal. Chem. 2018, 90, 8800–8806. 10.1021/acs.analchem.8b00520. [DOI] [PubMed] [Google Scholar]
- Han Z.; Tan J.; Wei T.; Zhang Y.; Xiao H.; Xu L.; He B. Two Novel Two-Photon Fluorescent Probes for Low pH Values and Cell Imaging Based on Spirobifluorene Motif. Sens. Actuators, B 2018, 255, 2290–2297. 10.1016/j.snb.2017.09.053. [DOI] [Google Scholar]
- Kong B.; Zhu A.; Ding C.; Zhao X.; Li B.; Tian Y. Carbon Dot-Based Inorganic-Organic Nanosystem for Two-Photon Imaging and Biosensing of pH Variation in Living Cells and Tissues. Adv. Mater. 2012, 24, 5844–5848. 10.1002/adma.201202599. [DOI] [PubMed] [Google Scholar]
- Nagl S.; Wolfbeis O. S. Optical Multiple Chemical Sensing: Status and Current Challenges. Analyst 2007, 132, 507–511. 10.1039/b702753b. [DOI] [PubMed] [Google Scholar]
- Stich M. I. J.; Fischer L. H.; Wolfbeis O. S. Multiple Fluorescent Chemical Sensing and Imaging. Chem. Soc. Rev. 2010, 39, 3102–3114. 10.1039/b909635n. [DOI] [PubMed] [Google Scholar]
- Hwang E. Y.; Pappas D.; Jeevarajan A. S.; Anderson M. M. Evaluation of the Paratrend Multi-Analyte Sensor for Potential Utilization in Long-Duration Automated Cell Culture Monitoring. Biomed. Microdevices 2004, 6, 241–249. 10.1023/B:BMMD.0000042054.02940.b6. [DOI] [PubMed] [Google Scholar]
- Ehgartner J.; Wiltsche H.; Borisov S. M.; Mayr T. Low Cost Referenced Luminescent Imaging of Oxygen and pH with a 2-CCD Colour near Infrared Camera. Analyst 2014, 139, 4924–4933. 10.1039/C4AN00783B. [DOI] [PubMed] [Google Scholar]
- Xu W.; Lu S.; Xu M.; Jiang Y.; Wang Y.; Chen X. Simultaneous Imaging of Intracellular pH and O2 Using Functionalized Semiconducting Polymer Dots. J. Mater. Chem. B 2016, 4, 292–298. 10.1039/C5TB02071A. [DOI] [PubMed] [Google Scholar]
- Chauhan V. M.; Giuntini F.; Aylott J. W. Quadruple Labelled Dual Oxygen and pH-Sensitive Ratiometric Nanosensors. Sens. Bio-Sens. Res. 2016, 8, 36–42. 10.1016/j.sbsr.2016.03.007. [DOI] [Google Scholar]
- Wan X.; Liu S. Fluorescent Water-Soluble Responsive Polymers Site-Specifically Labeled with FRET Dyes Possessing pH- and Thermo-Modulated Multicolor Fluorescence Emissions as Dual Ratiometric Probes. J. Mater. Chem. 2011, 21, 10321–10329. 10.1039/c1jm10332f. [DOI] [Google Scholar]
- Yin L.; He C.; Huang C.; Zhu W.; Wang X.; Xu Y.; Qian X. A Dual pH and Temperature Responsive Polymeric Fluorescent Sensor and Its Imaging Application in Living Cells. Chem. Commun. 2012, 48, 4486–4488. 10.1039/c2cc30404j. [DOI] [PubMed] [Google Scholar]
- Xu W.; Lu S.; Chen Y.; Zhao T.; Jiang Y.; Wang Y.; Chen X. Simultaneous Color Sensing of O2 and pH Using a Smartphone. Sens. Actuators, B 2015, 220, 326–330. 10.1016/j.snb.2015.05.088. [DOI] [Google Scholar]
- Tian Y.; Shumway B. R.; Cody Youngbull A.; Li Y.; Jen A. K.-Y.; Johnson R. H.; Meldrum D. R. Dually Fluorescent Sensing of pH and Dissolved Oxygen Using a Membrane Made from Polymerizable Sensing Monomers. Sens. Actuators, B 2010, 147, 714–722. 10.1016/j.snb.2010.03.029. [DOI] [PMC free article] [PubMed] [Google Scholar]
- Kim C.-K.; Duong H. D.; Rhee J. I. Preparation of an Optical Sensing Membrane for Triple Detection of Oxygen, pH, and Temperature Using Response Surface Methodology. Microchem. J. 2013, 110, 702–710. 10.1016/j.microc.2013.08.005. [DOI] [Google Scholar]
- Schroder C.; Polerecky L.; Klimant I. Time-Resolved pH/PO2 Mapping with Luminescent Hybrid Sensors. Anal. Chem. 2007, 79, 60–70. 10.1021/ac0606047. [DOI] [PubMed] [Google Scholar]
- Wolfbeis O. S.Feasibility of Optically Sensing Two Parameters Simultaneously Using One Indicator; International Society for Optics and Photonics, 1991; Vol. 1368, pp 218–222. [Google Scholar]
- Dmitriev R. I.; Borisov S. M.; Düssmann H.; Sun S.; Müller B. J.; Prehn J.; Baklaushev V. P.; Klimant I.; Papkovsky D. B. Versatile Conjugated Polymer Nanoparticles for High-Resolution O2 Imaging in Cells and 3D Tissue Models. ACS Nano 2015, 9, 5275–5288. 10.1021/acsnano.5b00771. [DOI] [PubMed] [Google Scholar]
- Zhang W.; Abou El-Reash Y. G.; Ding L.; Lin Z.; Lian Y.; Song B.; Yuan J.; Wang X.-d. A Lysosome-Targeting Nanosensor for Simultaneous Fluorometric Imaging of Intracellular pH Values and Temperature. Microchim. Acta 2018, 185, 533. 10.1007/s00604-018-3040-y. [DOI] [PubMed] [Google Scholar]
- Papkovsky D. B.; Zhdanov A. V.. Cell Energy Budget Platform for Assessment of Cell Metabolism. In Mitochondrial Medicine: Vol. II, Manipulating Mitochondrial Function; Weissig V., Edeas M., Eds.; Springer New York: New York, NY, 2015; pp 333–348. [DOI] [PubMed] [Google Scholar]
- Zhang X.; Zhang W.; Wang Q.; Wang J.; Ren G.; Wang X. Quadruply-Labeled Serum Albumin as a Biodegradable Nanosensor for Simultaneous Fluorescence Imaging of Intracellular pH Values, Oxygen and Temperature. Microchim. Acta 2019, 186, 584. 10.1007/s00604-019-3674-4. [DOI] [PubMed] [Google Scholar]
- Fischer L. H.; Karakus C.; Meier R. J.; Risch N.; Wolfbeis O. S.; Holder E.; Schäferling M. Referenced Dual Pressure-and Temperature-Sensitive Paint for Digital Color Camera Read Out. Chem. - Eur. J. 2012, 18, 15706–15713. 10.1002/chem.201201358. [DOI] [PubMed] [Google Scholar]
- Jezierski S.; Belder D.; Nagl S. Microfluidic Free-Flow Electrophoresis Chips with an Integrated Fluorescent Sensor Layer for Real Time pH Imaging in Isoelectric Focusing. Chem. Commun. 2013, 49, 904–906. 10.1039/C2CC38093E. [DOI] [PubMed] [Google Scholar]
- Kühl M.; Behrendt L.; Trampe E. C. L. E.; Qvortrup K.; Schreiber U.; Borisov S. M.; Klimant I.; Larkum A. W. Microenvironmental Ecology of the Chlorophyll B-Containing Symbiotic Cyanobacterium Prochloron in the Didemnid Ascidian Lissoclinum Patella. Front. Microbiol. 2012, 3, 402. 10.3389/fmicb.2012.00402. [DOI] [PMC free article] [PubMed] [Google Scholar]
- Fan Y.; Zhu Q.; Aller R. C.; Rhoads D. C. An In Situ Multispectral Imaging System for Planar Optodes in Sediments: Examples of High-Resolution Seasonal Patterns of pH. Aquat. Geochem. 2011, 17, 457–471. 10.1007/s10498-011-9124-5. [DOI] [Google Scholar]
- Han C.; Yao L.; Xu D.; Xie X.; Zhang C. High-Resolution Imaging of pH in Alkaline Sediments and Water Based on a New Rapid Response Fluorescent Planar Optode. Sci. Rep. 2016, 6, 26417. 10.1038/srep26417. [DOI] [PMC free article] [PubMed] [Google Scholar]
- Jiang Z.; Yu X.; Hao Y. Design and Fabrication of a Ratiometric Planar Optode for Simultaneous Imaging of pH and Oxygen. Sensors 2017, 17, 1316. 10.3390/s17061316. [DOI] [PMC free article] [PubMed] [Google Scholar]
- Koop-Jakobsen K.; Mueller P.; Meier R. J.; Liebsch G.; Jensen K. Plant-Sediment Interactions in Salt Marshes – An Optode Imaging Study of O2, pH, and CO2 Gradients in the Rhizosphere. Front. Plant Sci. 2018, 9, 541. 10.3389/fpls.2018.00541. [DOI] [PMC free article] [PubMed] [Google Scholar]
- Cantrell K.; Erenas M. M.; de Orbe-Payá I.; Capitán-Vallvey L. F. Use of the Hue Parameter of the Hue, Saturation, Value Color Space As a Quantitative Analytical Parameter for Bitonal Optical Sensors. Anal. Chem. 2010, 82, 531–542. 10.1021/ac901753c. [DOI] [PubMed] [Google Scholar]
- Carter J. C.; Alvis R. M.; Brown S. B.; Langry K. C.; Wilson T. S.; McBride M. T.; Myrick M.; Cox W. R.; Grove M. E.; Colston B. W. Fabricating Optical Fiber Imaging Sensors Using Inkjet Printing Technology: A pH Sensor Proof-of-Concept. Biosens. Bioelectron. 2006, 21, 1359–1364. 10.1016/j.bios.2005.06.006. [DOI] [PubMed] [Google Scholar]
- Sharman K. K.; Periasamy A.; Ashworth H.; Demas J. N. Error Analysis of the Rapid Lifetime Determination Method for Double-Exponential Decays and New Windowing Schemes. Anal. Chem. 1999, 71, 947–952. 10.1021/ac981050d. [DOI] [PubMed] [Google Scholar]
- Grengg C.; Müller B.; Staudinger C.; Mittermayr F.; Breininger J.; Ungerböck B.; Borisov S. M.; Mayr T.; Dietzel M. High-Resolution Optical pH Imaging of Concrete Exposed to Chemically Corrosive Environments. Cem. Concr. Res. 2019, 116, 231–237. 10.1016/j.cemconres.2018.10.027. [DOI] [Google Scholar]
- Nawaz H.; Tian W.; Zhang J.; Jia R.; Yang T.; Yu J.; Zhang J. Visual and Precise Detection of pH Values under Extreme Acidic and Strong Basic Environments by Cellulose-Based Superior Sensor. Anal. Chem. 2019, 91, 3085–3092. 10.1021/acs.analchem.8b05554. [DOI] [PubMed] [Google Scholar]
- Staneva D.; Betcheva R. Synthesis and Functional Properties of New Optical pH Sensor Based on Benzo[de]Anthracen-7-One Immobilized on the Viscose. Dyes Pigm. 2007, 74, 148–153. 10.1016/j.dyepig.2006.01.029. [DOI] [Google Scholar]
- Xu H.; Sadik O. A. Design of a Simple Optical Sensor for the Detection of Concentrated Hydroxide Ions in an Unusual pH Range. Analyst 2000, 125, 1783–1786. 10.1039/b004529m. [DOI] [Google Scholar]
- Raamat E.; Kaupmees K.; Ovsjannikov G.; Trummal A.; Kütt A.; Saame J.; Koppel I.; Kaljurand I.; Lipping L.; Rodima T.; Pihl V.; Koppel I. A.; Leito I. Acidities of Strong Neutral Brønsted Acids in Different Media. J. Phys. Org. Chem. 2013, 26, 162–170. 10.1002/poc.2946. [DOI] [Google Scholar]
- Nguyen T. H.; Venugopala T.; Chen S.; Sun T.; Grattan K. T. V.; Taylor S. E.; Basheer P. A. M.; Long A. E. Fluorescence Based Fibre Optic pH Sensor for the pH 10–13 Range Suitable for Corrosion Monitoring in Concrete Structures. Sens. Actuators, B 2014, 191, 498–507. 10.1016/j.snb.2013.09.072. [DOI] [Google Scholar]
- Wang E.; Chow K.-F.; Wang W.; Wong C.; Yee C.; Persad A.; Mann J.; Bocarsly A. Optical Sensing of HCl with Phenol Red Doped Sol–Gels. Anal. Chim. Acta 2005, 534, 301–306. 10.1016/j.aca.2004.11.052. [DOI] [Google Scholar]
- Shamsipur M.; Azimi G. High-Acidity Optical Sensors Based on Sol-Gel-Derived Thin Films. Anal. Lett. 2001, 34, 1603–1616. 10.1081/AL-100105345. [DOI] [Google Scholar]
- Li C.-Y.; Zhang X.-B.; Han Z.-X.; Åkermark B.; Sun L.; Shen G.-L.; Yu R.-Q. A Wide pH Range Optical Sensing System Based on a Sol–Gel Encapsulated Amino-Functionalised Corrole. Analyst 2006, 131, 388–393. 10.1039/b514510d. [DOI] [PubMed] [Google Scholar]
- Tsou C.-J.; Hung Y.; Mou C.-Y. Hollow Mesoporous Silica Nanoparticles with Tunable Shell Thickness and Pore Size Distribution for Application as Broad-Ranging pH Nanosensor. Microporous Mesoporous Mater. 2014, 190, 181–188. 10.1016/j.micromeso.2014.02.011. [DOI] [Google Scholar]
- Totland C.; Thomas P. J.; Holst B.; Akhtar N.; Hovdenes J.; Skodvin T. A Broad-Range Fluorescence Lifetime pH Sensing Material Based on a Single Organic Fluorophore. J. Fluoresc. 2019, 29, 1125–1131. 10.1007/s10895-019-02426-9. [DOI] [PubMed] [Google Scholar]
- Wang D.; Nap R. J.; Lagzi I.; Kowalczyk B.; Han S.; Grzybowski B. A.; Szleifer I. How and Why Nanoparticle’s Curvature Regulates the Apparent pKa of the Coating Ligands. J. Am. Chem. Soc. 2011, 133, 2192–2197. 10.1021/ja108154a. [DOI] [PubMed] [Google Scholar]
- Lin J. Recent Development and Applications of Optical and Fiber-Optic pH Sensors. TrAC, Trends Anal. Chem. 2000, 19, 541–552. 10.1016/S0165-9936(00)00034-0. [DOI] [Google Scholar]
- Pathak A. K.; Singh V. K. A Wide Range and Highly Sensitive Optical Fiber pH Sensor Using Polyacrylamide Hydrogel. Opt. Fiber Technol. 2017, 39, 43–48. 10.1016/j.yofte.2017.09.022. [DOI] [Google Scholar]
- Pathak A. K.; Chaudhary D. K.; Singh V. K. Broad Range and Highly Sensitive Optical pH Sensor Based on Hierarchical ZnO Microflowers over Tapered Silica Fiber. Sens. Actuators, A 2018, 280, 399–405. 10.1016/j.sna.2018.08.013. [DOI] [Google Scholar]
- Khan Md.; Kang S.-W. Highly Sensitive and Wide-Dynamic-Range Multichannel Optical-Fiber pH Sensor Based on PWM Technique. Sensors 2016, 16, 1885. 10.3390/s16111885. [DOI] [PMC free article] [PubMed] [Google Scholar]
- Munkholm C.; Walt D. R.; Milanovich F. P.; Klainer S. M. Polymer Modification of Fiber Optic Chemical Sensors as a Method of Enhancing Fluorescence Signal for pH Measurement. Anal. Chem. 1986, 58, 1427–1430. 10.1021/ac00298a034. [DOI] [Google Scholar]
- Mohamad F.; Tanner M. G.; Choudhury D.; Choudhary T. R.; Wood H. A.; Harrington K.; Bradley M. Controlled Core-to-Core Photo-Polymerisation–Fabrication of an Optical Fibre-Based pH Sensor. Analyst 2017, 142, 3569–3572. 10.1039/C7AN00454K. [DOI] [PubMed] [Google Scholar]
- Schubert E. F.Light-Emitting Diodes, 2nd ed.; Cambridge University Press, 2006. [Google Scholar]
- Ioannides N.; Chunga E. B.; Bachmatiuk A.; Gonzalez-Martinez I. G.; Trzebicka B.; Adebimpe D. B.; Kalymnios D.; Rümmeli M. H. Approaches to Mitigate Polymer-Core Loss in Plastic Optical Fibers: A Review. Mater. Res. Express 2014, 1, 032002 10.1088/2053-1591/1/3/032002. [DOI] [Google Scholar]
- Koop-Jakobsen K.; Gutbrod M. S. Shallow Salt Marsh Tidal Ponds–An Environment With Extreme Oxygen Dynamics. Front. Environ. Sci. 2019, 7, 137. 10.3389/fenvs.2019.00137. [DOI] [Google Scholar]
- Pantano P.; Walt D. R. Analytical Applications of Optical Imaging Fibers. Anal. Chem. 1995, 67, 481A–487A. 10.1021/ac00111a727. [DOI] [PubMed] [Google Scholar]
- Sharma N. K.; Gupta B. Fabrication and Characterization of pH Sensor Based on Side Polished Single Mode Optical Fiber. Opt. Commun. 2003, 216, 299–303. 10.1016/S0030-4018(02)02343-X. [DOI] [Google Scholar]
- Ghandehari M.; Vimer C. S. In Situ Monitoring of pH Level with Fiber Optic Evanescent Field Spectroscopy. NDT&E Int. 2004, 37, 611–616. 10.1016/j.ndteint.2004.03.007. [DOI] [Google Scholar]
- Mizaikoff B.; Lendl B.. Sensor Systems Based on Mid-Infrared Transparent Fibers. In Handbook of Vibrational Spectroscopy; John Wiley & Sons, Ltd., 2006. [Google Scholar]
- Zajíc J.; Traplová L.; Matějec V.; Pospíšilová M.; Bartoň I.. Optical pH Detection with U-Shaped Fiber-Optic Probes and Absorption Transducers, Conference Papers in Science; Hindawi, 2015, Vol. 2015. [Google Scholar]
- Deboux B.-C.; Lewis E.; Scully P.; Edwards R. A Novel Technique for Optical Fiber pH Sensing Based on Methylene Blue Adsorption. J. Lightwave Technol. 1995, 13, 1407–1414. 10.1109/50.400705. [DOI] [Google Scholar]
- Xiao S.; Wang T.; Liu Y.; Han X.; Yan X. An Ultrasensitive and Multispectral Refractive Index Sensor Design Based on Quad-Supercell Metamaterials. Plasmonics 2017, 12, 185–191. 10.1007/s11468-016-0248-8. [DOI] [Google Scholar]
- Ji L.; Sun X.; He G.; Liu Y.; Wang X.; Yi Y.; Chen C.; Wang F.; Zhang D. Surface Plasmon Resonance Refractive Index Sensor Based on Ultraviolet Bleached Polymer Waveguide. Sens. Actuators, B 2017, 244, 373–379. 10.1016/j.snb.2017.01.006. [DOI] [Google Scholar]
- An G.; Li S.; Wang H.; Zhang X.; Yan X. Quasi-D-Shaped Optical Fiber Plasmonic Refractive Index Sensor. J. Opt. 2018, 20, 035403 10.1088/2040-8986/aaaa42. [DOI] [Google Scholar]
- Chen C.; Yang R.; Zhang X.; Wei W.; Guo Q.; Zhang X.; Qin L.; Ning Y.; Yu Y. Compact Refractive Index Sensor Based on an S-Tapered Fiber Probe. Opt. Mater. Express 2018, 8, 919–925. 10.1364/OME.8.000919. [DOI] [Google Scholar]
- Zhou X.; Sheng L.; Ling X. Photonic Spin Hall Effect Enabled Refractive Index Sensor Using Weak Measurements. Sci. Rep. 2018, 8, 1221. 10.1038/s41598-018-19713-3. [DOI] [PMC free article] [PubMed] [Google Scholar]
- Wang Y.; Gao B.; Zhang K.; Yuan K.; Wan Y.; Xie Z.; Xu X.; Zhang H.; Song Q.; Yao L.; et al. Refractive Index Sensor Based on Leaky Resonant Scattering of Single Semiconductor Nanowire. ACS Photonics 2017, 4, 688–694. 10.1021/acsphotonics.7b00064. [DOI] [Google Scholar]
- Seitz W. R.; Rooney M. T.; Miele E. W.; Wang H.; Kaval N.; Zhang L.; Doherty S.; Milde S.; Lenda J. Derivatized, Swellable Polymer Microspheres for Chemical Transduction. Anal. Chim. Acta 1999, 400, 55–64. 10.1016/S0003-2670(99)00608-X. [DOI] [Google Scholar]
- Pietsch C.; Hoogenboom R.; Schubert U. S. Soluble Polymeric Dual Sensor for Temperature and pH Value. Angew. Chem. 2009, 121, 5763–5766. 10.1002/ange.200901071. [DOI] [PubMed] [Google Scholar]
- Dübendorfer J.; Kunz R.; Jobst G.; Moser I.; Urban G. Integrated Optical pH Sensor Using Replicated Chirped Grating Coupler Sensor Chips. Sens. Actuators, B 1998, 50, 210–219. 10.1016/S0925-4005(98)00238-X. [DOI] [Google Scholar]
- Zamarreño C.; Hernáez M.; Del Villar I.; Fernandez-Valdivielso C.; Arregui F.; Matias I. Optical Fiber pH Sensor Fabrication by Means of Indium Tin Oxide Coated Optical Fiber Refractometers. Phys. Status Solidi C 2010, 7, 2705–2707. 10.1002/pssc.200983800. [DOI] [Google Scholar]
- Nylander C.; Liedberg B.; Lind T. Gas Detection by Means of Surface Plasmon Resonance. Sens. Actuators 1982, 3, 79–88. 10.1016/0250-6874(82)80008-5. [DOI] [Google Scholar]
- Liedberg B.; Nylander C.; Lunström I. Surface Plasmon Resonance for Gas Detection and Biosensing. Sens. Actuators 1983, 4, 299–304. 10.1016/0250-6874(83)85036-7. [DOI] [Google Scholar]
- Ahn J. H.; Seong T. Y.; Kim W. M.; Lee T. S.; Kim I.; Lee K.-S. Fiber-Optic Waveguide Coupled Surface Plasmon Resonance Sensor. Opt. Express 2012, 20, 21729–21738. 10.1364/OE.20.021729. [DOI] [PubMed] [Google Scholar]
- Singh S.; Gupta B. D. Fabrication and Characterization of a Highly Sensitive Surface Plasmon Resonance Based Fiber Optic pH Sensor Utilizing High Index Layer and Smart Hydrogel. Sens. Actuators, B 2012, 173, 268–273. 10.1016/j.snb.2012.06.089. [DOI] [Google Scholar]
- Mishra S. K.; Gupta B. D. Surface Plasmon Resonance Based Fiber Optic pH Sensor Utilizing Ag/ITO/Al/Hydrogel Layers. Analyst 2013, 138, 2640–2646. 10.1039/c3an00097d. [DOI] [PubMed] [Google Scholar]
- Zhao Y.; Lei M.; Liu S.-X.; Zhao Q. Smart Hydrogel-Based Optical Fiber SPR Sensor for pH Measurements. Sens. Actuators, B 2018, 261, 226–232. 10.1016/j.snb.2018.01.120. [DOI] [Google Scholar]
- Joshi G. K.; Johnson M. A.; Sardar R. Novel pH-Responsive Nanoplasmonic Sensor: Controlling Polymer Structural Change to Modulate Localized Surface Plasmon Resonance Response. RSC Adv. 2014, 4, 15807–15815. 10.1039/c4ra00117f. [DOI] [Google Scholar]
- Gangwar R. K.; Singh V. K. Highly Sensitive Surface Plasmon Resonance Based D-Shaped Photonic Crystal Fiber Refractive Index Sensor. Plasmonics 2017, 12, 1367–1372. 10.1007/s11468-016-0395-y. [DOI] [Google Scholar]
- Fan J.; Li Z.; Chen Z.; Wu W. Standing-Wave Resonances in Plasmonic Nanoumbrella Cavities for Color Generation and Colorimetric Refractive Index Sensor. Appl. Surf. Sci. 2016, 384, 534–538. 10.1016/j.apsusc.2016.05.127. [DOI] [Google Scholar]
- Tang Y.; Zhang Z.; Wang R.; Hai Z.; Xue C.; Zhang W.; Yan S. Refractive Index Sensor Based on Fano Resonances in Metal-Insulator-Metal Waveguides Coupled with Resonators. Sensors 2017, 17, 784. 10.3390/s17040784. [DOI] [PMC free article] [PubMed] [Google Scholar]
- Velázquez-González J. S.; Monzón-Hernández D.; Moreno-Hernández D.; Martínez-Piñón F.; Hernández-Romano I. Simultaneous Measurement of Refractive Index and Temperature Using a SPR-Based Fiber Optic Sensor. Sens. Actuators, B 2017, 242, 912–920. 10.1016/j.snb.2016.09.164. [DOI] [Google Scholar]
- An G.; Li S.; Yan X.; Zhang X.; Yuan Z.; Wang H.; Zhang Y.; Hao X.; Shao Y.; Han Z. Extra-Broad Photonic Crystal Fiber Refractive Index Sensor Based on Surface Plasmon Resonance. Plasmonics 2017, 12, 465–471. 10.1007/s11468-016-0286-2. [DOI] [Google Scholar]
- Dash J. N.; Jha R. Graphene-Based Birefringent Photonic Crystal Fiber Sensor Using Surface Plasmon Resonance. IEEE Photonics Technol. Lett. 2014, 26, 1092–1095. 10.1109/LPT.2014.2315233. [DOI] [Google Scholar]
- Wong W. C.; Chan C. C.; Chen L. H.; Li T.; Lee K. X.; Leong K. C. Polyvinyl Alcohol Coated Photonic Crystal Optical Fiber Sensor for Humidity Measurement. Sens. Actuators, B 2012, 174, 563–569. 10.1016/j.snb.2012.07.032. [DOI] [Google Scholar]
- Zhang W.; Lian Z.; Benson T.; Wang X.; Lou S. A Refractive Index Sensor Based on a D-Shaped Photonic Crystal Fiber with a Nanoscale Gold Belt. Opt. Quantum Electron. 2018, 50, 29. 10.1007/s11082-017-1276-0. [DOI] [Google Scholar]
- Chen X.; Xia L.; Li C. Surface Plasmon Resonance Sensor Based on a Novel D-Shaped Photonic Crystal Fiber for Low Refractive Index Detection. IEEE Photonics J. 2018, 10, 1–9. 10.1109/JPHOT.2018.2790424. [DOI] [Google Scholar]
- Yang Q.; Qin L.; Cao G.; Zhang C.; Li X. Refractive Index Sensor Based on Graphene-Coated Photonic Surface-Wave Resonance. Opt. Lett. 2018, 43, 639–642. 10.1364/OL.43.000639. [DOI] [PubMed] [Google Scholar]
- Maurya J. B.; François A.; Prajapati Y. K. Two-Dimensional Layered Nanomaterial-Based One-Dimensional Photonic Crystal Refractive Index Sensor. Sensors 2018, 18, 857. 10.3390/s18030857. [DOI] [PMC free article] [PubMed] [Google Scholar]
- Yetisen A. K.; Butt H.; Volpatti L. R.; Pavlichenko I.; Humar M.; Kwok S. J.; Koo H.; Kim K. S.; Naydenova I.; Khademhosseini A.; et al. Photonic Hydrogel Sensors. Biotechnol. Adv. 2016, 34, 250–271. 10.1016/j.biotechadv.2015.10.005. [DOI] [PubMed] [Google Scholar]
- Holtz J. H.; Asher S. A. Polymerized Colloidal Crystal Hydrogel Films as Intelligent Chemical Sensing Materials. Nature 1997, 389, 829–832. 10.1038/39834. [DOI] [PubMed] [Google Scholar]
- Lee K.; Asher S. A. Photonic Crystal Chemical Sensors: pH and Ionic Strength. J. Am. Chem. Soc. 2000, 122, 9534–9537. 10.1021/ja002017n. [DOI] [Google Scholar]
- Xu X.; Goponenko A. V.; Asher S. A. Polymerized PolyHEMA Photonic Crystals: pH and Ethanol Sensor Materials. J. Am. Chem. Soc. 2008, 130, 3113–3119. 10.1021/ja077979+. [DOI] [PubMed] [Google Scholar]
- Asher S. A.; Kimble K. W.; Walker J. P. Enabling Thermoreversible Physically Cross-Linked Polymerized Colloidal Array Photonic Crystals. Chem. Mater. 2008, 20, 7501–7509. 10.1021/cm801519x. [DOI] [PMC free article] [PubMed] [Google Scholar]
- Zhang J.-T.; Wang L.; Luo J.; Tikhonov A.; Kornienko N.; Asher S. A. 2-D Array Photonic Crystal Sensing Motif. J. Am. Chem. Soc. 2011, 133, 9152–9155. 10.1021/ja201015c. [DOI] [PubMed] [Google Scholar]
- Li C.; Lotsch B. V. Stimuli-Responsive 2D Polyelectrolyte Photonic Crystals for Optically Encoded pH Sensing. Chem. Commun. 2012, 48, 6169–6171. 10.1039/c2cc31916k. [DOI] [PubMed] [Google Scholar]
- Yang Q.; Zhu S.; Peng W.; Yin C.; Wang W.; Gu J.; Zhang W.; Ma J.; Deng T.; Feng C.; et al. Bioinspired Fabrication of Hierarchically Structured, pH-Tunable Photonic Crystals with Unique Transition. ACS Nano 2013, 7, 4911–4918. 10.1021/nn400090j. [DOI] [PubMed] [Google Scholar]
- Fenzl C.; Wilhelm S.; Hirsch T.; Wolfbeis O. S. Optical Sensing of the Ionic Strength Using Photonic Crystals in a Hydrogel Matrix. ACS Appl. Mater. Interfaces 2013, 5, 173–178. 10.1021/am302355g. [DOI] [PubMed] [Google Scholar]
- Shin J.; Braun P. V.; Lee W. Fast Response Photonic Crystal pH Sensor Based on Templated Photo-Polymerized Hydrogel Inverse Opal. Sens. Actuators, B 2010, 150, 183–190. 10.1016/j.snb.2010.07.018. [DOI] [Google Scholar]
- Griffete N.; Frederich H.; Maître A.; Chehimi M. M.; Ravaine S.; Mangeney C. Photonic Crystal pH Sensor Containing a Planar Defect for Fast and Enhanced Response. J. Mater. Chem. 2011, 21, 13052–13055. 10.1039/c1jm12015h. [DOI] [Google Scholar]
- Honda M.; Seki T.; Takeoka Y. Dual Tuning of the Photonic Band-Gap Structure in Soft Photonic Crystals. Adv. Mater. 2009, 21, 1801–1804. 10.1002/adma.200801258. [DOI] [Google Scholar]
- Fei X.; Lu T.; Ma J.; Wang W.; Zhu S.; Zhang D. Bioinspired Polymeric Photonic Crystals for High Cycling pH-Sensing Performance. ACS Appl. Mater. Interfaces 2016, 8, 27091–27098. 10.1021/acsami.6b08724. [DOI] [PubMed] [Google Scholar]
- Liu C.; Zhu Y.; Ma T.; Yao C.; Ren J.; Peng H.; Zhao X.; Ge L. Acidic/Alkali Vapor Sensitive One Dimensional Photonic Crystals with a Gradient Architecture. Mater. Today Proc. 2015, 2, 261–270. 10.1016/j.matpr.2015.04.037. [DOI] [Google Scholar]
- Shi D.; Zhang X.; Yang Z.; Liu S.; Chen M. Fabrication of PAM/PMAA Inverse Opal Photonic Crystal Hydrogels by a “Sandwich” Method and Their pH and Solvent Responses. RSC Adv. 2016, 6, 85885–85890. 10.1039/C6RA18738B. [DOI] [Google Scholar]
- Jia X.; Wang K.; Wang J.; Hu Y.; Shen L.; Zhu J. Full-Color Photonic Hydrogels for pH and Ionic Strength Sensing. Eur. Polym. J. 2016, 83, 60–66. 10.1016/j.eurpolymj.2016.08.006. [DOI] [Google Scholar]
- Pace S.; Vasani R. B.; Zhao W.; Perrier S.; Voelcker N. H. Photonic Porous Silicon as a pH Sensor. Nanoscale Res. Lett. 2014, 9, 420. 10.1186/1556-276X-9-420. [DOI] [PMC free article] [PubMed] [Google Scholar]
- Pidenko P. S.; Borzov V. M.; Savenko O. A.; Skaptsov A. A.; Skibina Y. S.; Goryacheva I. Y.; Rusanova T. Y.. Modification of the Internal Surface of Photonic Crystal Fibers with Ag and Au Nanoparticles for Application as Sensor Elements; International Society for Optics and Photonics, 2017; Vol. 10336, p 103360T. [Google Scholar]
- Walker J. P.; Kimble K. W.; Asher S. A. Photonic Crystal Sensor for Organophosphate Nerve Agents Utilizing the Organophosphorus Hydrolase Enzyme. Anal. Bioanal. Chem. 2007, 389, 2115–2124. 10.1007/s00216-007-1599-y. [DOI] [PubMed] [Google Scholar]
- Li L.; Long Y.; Gao J.-M.; Song K.; Yang G. Label-Free and pH-Sensitive Colorimetric Materials for the Sensing of Urea. Nanoscale 2016, 8, 4458–4462. 10.1039/C5NR07690K. [DOI] [PubMed] [Google Scholar]
- Arunbabu D.; Sannigrahi A.; Jana T. Photonic Crystal Hydrogel Material for the Sensing of Toxic Mercury Ions (Hg 2+) in Water. Soft Matter 2011, 7, 2592–2599. 10.1039/c0sm01136c. [DOI] [Google Scholar]
- Zhang Y.; Zhao Y.; Zhou T.; Wu Q. Applications and Developments of On-Chip Biochemical Sensors Based on Optofluidic Photonic Crystal Cavities. Lab Chip 2018, 18, 57–74. 10.1039/C7LC00641A. [DOI] [PubMed] [Google Scholar]
- Zawadzka M.; Mikulchyk T.; Cody D.; Martin S.; Yetisen A. K.; Martinez-Hurtado J. L.; Butt H.; Mihaylova E.; Awala H.; Mintova S.. Photonic Materials for Holographic Sensing. In Photonic Materials for Sensing, Biosensing and Display Devices; Springer, 2016; pp 315–359. [Google Scholar]
- Marshall A. J.; Blyth J.; Davidson C. A.; Lowe C. R. pH-Sensitive Holographic Sensors. Anal. Chem. 2003, 75, 4423–4431. 10.1021/ac020730k. [DOI] [PubMed] [Google Scholar]
- Sartain F. K.; Yang X.; Lowe C. R. Holographic Lactate Sensor. Anal. Chem. 2006, 78, 5664–5670. 10.1021/ac060416g. [DOI] [PubMed] [Google Scholar]
- Beiu R.-M.; Beiu V.; Duma V.-F. Fiber Optic Mechanical Deformation Sensors Employing Perpendicular Photonic Crystals. Opt. Express 2017, 25, 23388–23398. 10.1364/OE.25.023388. [DOI] [PubMed] [Google Scholar]
- Vezouviou E.; Lowe C. R. A near Infrared Holographic Glucose Sensor. Biosens. Bioelectron. 2015, 68, 371–381. 10.1016/j.bios.2015.01.014. [DOI] [PubMed] [Google Scholar]
- Bianco G.; Ferrara M. A.; Borbone F.; Zuppardi F.; Roviello A.; Striano V.; Coppola G.. Volume Holographic Gratings as Optical Sensor for Heavy Metal in Bathing Waters; Baldini F., Homola J., Lieberman R. A., Eds.; Prague, Czech Republic, 2015; p 95062B. [Google Scholar]
- Ye H.; Nilsen O.; Bright V. M.; Anderson D. Z. Holographic Chemical Vapor Sensor. Opt. Lett. 2005, 30, 1467–1469. 10.1364/OL.30.001467. [DOI] [PubMed] [Google Scholar]
- Liu H.; Yu D.; Zhou K.; Wang S.; Luo S.; Wang W.; Song Q. Improvement of Temperature-Induced Spectrum Characterization in a Holographic Sensor Based on N-Isopropylacrylamide Photopolymer Hydrogel. Appl. Opt. 2017, 56, 9006–9013. 10.1364/AO.56.009006. [DOI] [PubMed] [Google Scholar]
- Oliveira N. C.; El Khoury G.; Versnel J. M.; Moghaddam G. K.; Leite L. S.; Lima-Filho J. L.; Lowe C. R. A Holographic Sensor Based on a Biomimetic Affinity Ligand for the Detection of Cocaine. Sens. Actuators, B 2018, 270, 216–222. 10.1016/j.snb.2018.05.009. [DOI] [Google Scholar]
- Khalili Moghaddam G.; Margerison H.; Suzuki J.; Blyth J.; Lowe C. R. A Transparent Glucose-Sensitive Double Polymerised Holographic Sensor. Sens. Actuators, B 2018, 267, 1–4. 10.1016/j.snb.2018.04.009. [DOI] [Google Scholar]
- Browne C. A.; Tarrant D. H.; Olteanu M. S.; Mullens J. W.; Chronister E. L. Intrinsic Sol–Gel Clad Fiber-Optic Sensors with Time-Resolved Detection. Anal. Chem. 1996, 68, 2289–2295. 10.1021/ac960078r. [DOI] [Google Scholar]
- Mendoza E. A.; Sorenson J. A.; Iossi A.; Sun Z.; Robinson D. P.; Lieberman R. A.. Demonstration of Self-Referenced Fiber Optic Moisture and pH Sensors Using Optical Time Domain Reflectometry (OTDR); Lieberman R. A., Ed.; Denver, CO, 1996; pp 242–249. [Google Scholar]
- Wallace P. A.; Campbell M.; Yang Y.; Holmes-Smith A. S.; Uttamlal M. A Distributed Optical Fibre Fluorosensor for pH Measurement. J. Lumin. 1997, 72, 1017–1019. 10.1016/S0022-2313(97)80797-1. [DOI] [Google Scholar]
- Tusa J. K.; He H. Critical Care Analyzer with Fluorescent Optical Chemosensors for Blood Analytes. J. Mater. Chem. 2005, 15, 2640–2647. 10.1039/b503172a. [DOI] [Google Scholar]
- Mahutte C. K. On-Line Arterial Blood Gas Analysis With Optodes: Current Status. Clin. Biochem. 1998, 31, 119–130. 10.1016/S0009-9120(98)00009-5. [DOI] [PubMed] [Google Scholar]
- Peterson J. I.; Goldstein S. R.; Fitzgerald R. V.; Buckhold D. K. Fiber optic pH probe for physiological use. Anal. Chem. 1980, 52, 864–869. 10.1021/ac50056a022. [DOI] [PubMed] [Google Scholar]
- Leiner M. J. P. Optical Sensors for in Vitro Blood Gas Analysis. Sens. Actuators, B 1995, 29, 169–173. 10.1016/0925-4005(95)01679-1. [DOI] [Google Scholar]
- Ferrari L.; Rovati L.; Fabbri P.; Pilati F. Continuous Haematic pH Monitoring in Extracorporeal Circulation Using a Disposable Florescence Sensing Element. J. Biomed. Opt. 2013, 18, 027002 10.1117/1.JBO.18.2.027002. [DOI] [PubMed] [Google Scholar]
- Pakulla M.; Obal D.; Loer S. Continuous Intra-Arterial Blood Gas Monitoring in Rats. Lab. Anim. 2004, 38, 133–137. 10.1258/002367704322968803. [DOI] [PubMed] [Google Scholar]
- Bromberg A.; Zilberstein J.; Riesemberg S.; Benori E.; Silberstein E.; Zimnavoda J.; Frishman G.; Kritzman A. Optical-Fibre Sensors for Blood Gases and pH, Based on Porous Glass Tips. Sens. Actuators, B 1996, 31, 181–191. 10.1016/0925-4005(96)80064-5. [DOI] [Google Scholar]
- McKinley B. A. ISFET and Fiber Optic Sensor Technologies: In Vivo Experience for Critical Care Monitoring. Chem. Rev. 2008, 108, 826–844. 10.1021/cr068120y. [DOI] [PubMed] [Google Scholar]
- Miller W. W.; Yafuso M.; Yan C. F.; Hui H. K.; Arick S. Performance of an In-Vivo, Continuous Blood-Gas Monitor with Disposable Probe. Clin. Chem. 1987, 33, 1538–1542. 10.1093/clinchem/33.9.1538. [DOI] [PubMed] [Google Scholar]
- Smith B. E.; King P. H.; Schlain L. Clinical Evaluation--Continuous Real-Time Intra-Arterial Blood Gas Monitoring during Anesthesia and Surgery by Fiber Optic Sensor. Int. J. Clin. Monit. Comput. 1992, 9, 45–52. 10.1007/BF01145901. [DOI] [PubMed] [Google Scholar]
- Lumsden T.; Marshall W. R.; Divers G. A.; Riccitelli S. D. The PB3300 Intraarterial Blood Gas Monitoring System. J. Clin. Monit. 1994, 10, 59–66. 10.1007/BF01651467. [DOI] [PubMed] [Google Scholar]
- VENKATESH B.; CLUTTON BROCK T. H.; HENDRY S. P. A Multiparameter Sensor for Continuous Intra-Arterial Blood Gas Monitoring: A Prospective Evaluation. Crit. Care Med. 1994, 22, 588–594. 10.1097/00003246-199404000-00013. [DOI] [PubMed] [Google Scholar]
- Christiansson L.; Hellberg A.; Koga I.; Thelin S.; Bergqvist D.; Wiklund L.; Karacagil S. A New Method of Intrathecal PO2, PCO2, and pH Measurements for Continuous Monitoring of Spinal Cord Ischemia during Thoracic Aortic Clamping in Pigs. Surgery 2000, 127, 571–576. 10.1067/msy.2000.105036. [DOI] [PubMed] [Google Scholar]
- Venkatesh B.; Clutton-Brock T. H.; Hendry S. P. Evaluation of the Paratrend 7 Intravascular Blood Gas Monitor during Cardiac Surgery: Comparison with the C4000 in-Line Blood Gas Monitor during Cardiopulmonary Bypass. J. Cardiothorac. Vasc. Anesth. 1995, 9, 412–419. 10.1016/S1053-0770(05)80096-5. [DOI] [PubMed] [Google Scholar]
- Ganter M.; Zollinger A. Continuous Intravascular Blood Gas Monitoring: Development, Current Techniques, and Clinical Use of a Commercial Device. Br. J. Anaesth. 2003, 91, 397–407. 10.1093/bja/aeg176. [DOI] [PubMed] [Google Scholar]
- Venkatesh B. Continuous Intra-Arterial Blood Gas Monitoring. Crit. Care Resusc. 1999, 1, 140. [PubMed] [Google Scholar]
- Morgan C.; Newell S. J.; Ducker D. A.; Hodgkinson J.; White D. K.; Morley C. J.; Church J. M. Continuous Neonatal Blood Gas Monitoring Using a Multiparameter Intra-Arterial Sensor. Arch. Dis. Child. - Fetal Neonatal Ed. 1999, 80, F93–F98. 10.1136/fn.80.2.F93. [DOI] [PMC free article] [PubMed] [Google Scholar]
- Baldini F. In Vivo Monitoring of the Gastrooesophageal System Using Optical Fibre Sensors. Anal. Bioanal. Chem. 2003, 375, 732–743. 10.1007/s00216-003-1778-4. [DOI] [PubMed] [Google Scholar]
- Marieb E. N.; Hoehn K.. Human Anatomy & Physiology; Pearson Education, 2007. [Google Scholar]
- Schultz A.; Puvvadi R.; Borisov S. M.; Shaw N. C.; Klimant I.; Berry L. J.; Montgomery S. T.; Nguyen T.; Kreda S. M.; Kicic A.; Noble P. B.; Button B.; Stick S. M. Airway Surface Liquid pH Is Not Acidic in Children with Cystic Fibrosis. Nat. Commun. 2017, 8, 1409. 10.1038/s41467-017-00532-5. [DOI] [PMC free article] [PubMed] [Google Scholar]
- Sato K.; Kang W. H.; Saga K.; Sato K. T. Biology of Sweat Glands and Their Disorders. I. Normal Sweat Gland Function. J. Am. Acad. Dermatol. 1989, 20, 537–563. 10.1016/S0190-9622(89)70063-3. [DOI] [PubMed] [Google Scholar]
- Nakata S.; Arie T.; Akita S.; Takei K. Wearable, Flexible, and Multifunctional Healthcare Device with an ISFET Chemical Sensor for Simultaneous Sweat pH and Skin Temperature Monitoring. ACS Sens. 2017, 2, 443–448. 10.1021/acssensors.7b00047. [DOI] [PubMed] [Google Scholar]
- Curto V. F.; Fay C.; Coyle S.; Byrne R.; O’Toole C.; Barry C.; Hughes S.; Moyna N.; Diamond D.; Benito-Lopez F. Real-Time Sweat pH Monitoring Based on a Wearable Chemical Barcode Micro-Fluidic Platform Incorporating Ionic Liquids. Sens. Actuators, B 2012, 171–172, 1327–1334. 10.1016/j.snb.2012.06.048. [DOI] [Google Scholar]
- Caldara M.; Colleoni C.; Guido E.; Re V.; Rosace G. Optical Monitoring of Sweat pH by a Textile Fabric Wearable Sensor Based on Covalently Bonded Litmus-3-Glycidoxypropyltrimethoxysilane Coating. Sens. Actuators, B 2016, 222, 213–220. 10.1016/j.snb.2015.08.073. [DOI] [Google Scholar]
- Dargaville T. R.; Farrugia B. L.; Broadbent J. A.; Pace S.; Upton Z.; Voelcker N. H. Sensors and Imaging for Wound Healing: A Review. Biosens. Bioelectron. 2013, 41, 30–42. 10.1016/j.bios.2012.09.029. [DOI] [PubMed] [Google Scholar]
- Jones E. M.; Cochrane C. A.; Percival S. L. The Effect of pH on the Extracellular Matrix and Biofilms. Adv. Wound Care 2015, 4, 431–439. 10.1089/wound.2014.0538. [DOI] [PMC free article] [PubMed] [Google Scholar]
- Auerswald S.; Schreml S.; Meier R.; Blancke Soares A.; Niyazi M.; Marschner S.; Belka C.; Canis M.; Haubner F. Wound Monitoring of pH and Oxygen in Patients after Radiation Therapy. Radiat. Oncol. 2019, 14, 199. 10.1186/s13014-019-1413-y. [DOI] [PMC free article] [PubMed] [Google Scholar]
- Schreml S.; Meier R. J.; Weiß K. T.; Cattani J.; Flittner D.; Gehmert S.; Wolfbeis O. S.; Landthaler M.; Babilas P. A Sprayable Luminescent pH Sensor and Its Use for Wound Imaging in Vivo. Exp. Dermatol. 2012, 21, 951–953. 10.1111/exd.12042. [DOI] [PubMed] [Google Scholar]
- Tamayol A.; Akbari M.; Zilberman Y.; Comotto M.; Lesha E.; Serex L.; Bagherifard S.; Chen Y.; Fu G.; Ameri S. K.; Ruan W.; Miller E. L.; Dokmeci M. R.; Sonkusale S.; Khademhosseini A. Flexible pH-Sensing Hydrogel Fibers for Epidermal Applications. Adv. Healthcare Mater. 2016, 5, 711–719. 10.1002/adhm.201500553. [DOI] [PMC free article] [PubMed] [Google Scholar]
- Zhu Y.; Zhang J.; Song J.; Yang J.; Du Z.; Zhao W.; Guo H.; Wen C.; Li Q.; Sui X.; Zhang L. A Multifunctional Pro-Healing Zwitterionic Hydrogel for Simultaneous Optical Monitoring of pH and Glucose in Diabetic Wound Treatment. Adv. Funct. Mater. 2020, 30, 1905493. 10.1002/adfm.201905493. [DOI] [Google Scholar]
- Dimde M.; Sahle F. F.; Wycisk V.; Steinhilber D.; Camacho L. C.; Licha K.; Lademann J.; Haag R. Synthesis and Validation of Functional Nanogels as pH-Sensors in the Hair Follicle. Macromol. Biosci. 2017, 17, 1600505. 10.1002/mabi.201600505. [DOI] [PubMed] [Google Scholar]
- Schaude C.; Fröhlich E.; Meindl C.; Attard J.; Binder B.; Mohr G. J. The Development of Indicator Cotton Swabs for the Detection of pH in Wounds. Sensors 2017, 17, 1365. 10.3390/s17061365. [DOI] [PMC free article] [PubMed] [Google Scholar]
- Zauner A.; Bullock R.; Di X.; Young H. F. Brain Oxygen, CO2, pH, and Temperature Monitoring: Evaluation in the Feline Brain. Neurosurgery 1995, 37, 1168–1176. discussion 1176–1177 10.1227/00006123-199512000-00017. [DOI] [PubMed] [Google Scholar]
- McKinley B. A.; Morris W. P.; Parmley C. L.; Butler B. D. Brain Parenchyma pO2, pCO2, and pH during and after Hypoxic, Ischemic Brain Insult in Dogs. Crit. Care Med. 1996, 24, 1858–1868. 10.1097/00003246-199611000-00016. [DOI] [PubMed] [Google Scholar]
- Magnotta V. A.; Heo H.-Y.; Dlouhy B. J.; Dahdaleh N. S.; Follmer R. L.; Thedens D. R.; Welsh M. J.; Wemmie J. A. Detecting Activity-Evoked pH Changes in Human Brain. Proc. Natl. Acad. Sci. U. S. A. 2012, 109, 8270–8273. 10.1073/pnas.1205902109. [DOI] [PMC free article] [PubMed] [Google Scholar]
- Ramamonjisoa N.; Ackerstaff E. Characterization of the Tumor Microenvironment and Tumor–Stroma Interaction by Non-Invasive Preclinical Imaging. Front. Oncol. 2017, 7, 3. 10.3389/fonc.2017.00003. [DOI] [PMC free article] [PubMed] [Google Scholar]
- Tung C.-H.; Qi J.; Hu L.; Han M. S.; Kim Y. A Quick Responsive Fluorogenic pH Probe for Ovarian Tumor Imaging. Theranostics 2015, 5, 1166–1174. 10.7150/thno.12813. [DOI] [PMC free article] [PubMed] [Google Scholar]
- Martin G. R.; Jain R. K. Noninvasive Measurement of Interstitial pH Profiles in Normal and Neoplastic Tissue Using Fluorescence Ratio Imaging Microscopy. Cancer Res. 1994, 54, 5670–5674. [PubMed] [Google Scholar]
- Urano Y.; Asanuma D.; Hama Y.; Koyama Y.; Barrett T.; Kamiya M.; Nagano T.; Watanabe T.; Hasegawa A.; Choyke P. L.; Kobayashi H. Selective Molecular Imaging of Viable Cancer Cells with pH-Activatable Fluorescence Probes. Nat. Med. 2009, 15, 104–109. 10.1038/nm.1854. [DOI] [PMC free article] [PubMed] [Google Scholar]
- Shirmanova M. V.; Druzhkova I. N.; Lukina M. M.; Matlashov M. E.; Belousov V. V.; Snopova L. B.; Prodanetz N. N.; Dudenkova V. V.; Lukyanov S. A.; Zagaynova E. V. Intracellular pH Imaging in Cancer Cells in Vitro and Tumors in Vivo Using the New Genetically Encoded Sensor SypHer2. Biochim. Biophys. Acta, Gen. Subj. 2015, 1850, 1905–1911. 10.1016/j.bbagen.2015.05.001. [DOI] [PubMed] [Google Scholar]
- Li C.; Xia J.; Wei X.; Yan H.; Si Z.; Ju S. pH-Activated Near-Infrared Fluorescence Nanoprobe Imaging Tumors by Sensing the Acidic Microenvironment. Adv. Funct. Mater. 2010, 20, 2222–2230. 10.1002/adfm.201000038. [DOI] [Google Scholar]
- Chen Q.; Liu X.; Chen J.; Zeng J.; Cheng Z.; Liu Z. A Self-Assembled Albumin-Based Nanoprobe for In Vivo Ratiometric Photoacoustic pH Imaging. Adv. Mater. 2015, 27, 6820–6827. 10.1002/adma.201503194. [DOI] [PubMed] [Google Scholar]
- Gong J.; Tanner M. G.; Venkateswaran S.; Stone J. M.; Zhang Y.; Bradley M. A Hydrogel-Based Optical Fibre Fluorescent pH Sensor for Observing Lung Tumor Tissue Acidity. Anal. Chim. Acta 2020, 1134, 136. 10.1016/j.aca.2020.07.063. [DOI] [PubMed] [Google Scholar]
- Stromer B. S.; Kumar C. V. White-Emitting Protein Nanoparticles for Cell-Entry and pH Sensing. Adv. Funct. Mater. 2017, 27, 1603874. 10.1002/adfm.201603874. [DOI] [Google Scholar]
- Ma J.; Ding C.; Zhou J.; Tian Y. 2D Ratiometric Fluorescent pH Sensor for Tracking of Cells Proliferation and Metabolism. Biosens. Bioelectron. 2015, 70, 202–208. 10.1016/j.bios.2015.03.033. [DOI] [PubMed] [Google Scholar]
- Arnett T. R. Extracellular pH Regulates Bone Cell Function. J. Nutr. 2008, 138, 415S–418S. 10.1093/jn/138.2.415S. [DOI] [PubMed] [Google Scholar]
- Zhang X.; Lin Y.; Gillies R. J. Tumor pH and Its Measurement. J. Nucl. Med. 2010, 51, 1167–1170. 10.2967/jnumed.109.068981. [DOI] [PMC free article] [PubMed] [Google Scholar]
- Ke G.; Zhu Z.; Wang W.; Zou Y.; Guan Z.; Jia S.; Zhang H.; Wu X.; Yang C. J. A Cell-Surface-Anchored Ratiometric Fluorescent Probe for Extracellular pH Sensing. ACS Appl. Mater. Interfaces 2014, 6, 15329–15334. 10.1021/am503818n. [DOI] [PubMed] [Google Scholar]
- Choi W.-G.; Swanson S. J.; Gilroy S. High-Resolution Imaging of Ca2+, Redox Status, ROS and pH Using GFP Biosensors. Plant J. 2012, 70, 118–128. 10.1111/j.1365-313X.2012.04917.x. [DOI] [PubMed] [Google Scholar]
- Gao D.; Knight M. R.; Trewavas A. J.; Sattelmacher B.; Plieth C. Self-Reporting Arabidopsis Expressing pH and [Ca2+] Indicators Unveil Ion Dynamics in the Cytoplasm and in the Apoplast under Abiotic Stress. Plant Physiol. 2004, 134, 898–908. 10.1104/pp.103.032508. [DOI] [PMC free article] [PubMed] [Google Scholar]
- Gjetting S. K.; Ytting C. K.; Schulz A.; Fuglsang A. T. Live Imaging of Intra-and Extracellular pH in Plants Using pHusion, a Novel Genetically Encoded Biosensor. J. Exp. Bot. 2012, 63, 3207–3218. 10.1093/jxb/ers040. [DOI] [PMC free article] [PubMed] [Google Scholar]
- Michard E.; Dias P.; Feijó J. A. Tobacco Pollen Tubes as Cellular Models for Ion Dynamics: Improved Spatial and Temporal Resolution of Extracellular Flux and Free Cytosolic Concentration of Calcium and Protons Using pHluorin and YC3. 1 CaMeleon. Sex. Plant Reprod. 2008, 21, 169–181. 10.1007/s00497-008-0076-x. [DOI] [Google Scholar]
- Schulte A.; Lorenzen I.; Böttcher M.; Plieth C. A Novel Fluorescent pH Probe for Expression in Plants. Plant Methods 2006, 2, 7. 10.1186/1746-4811-2-7. [DOI] [PMC free article] [PubMed] [Google Scholar]
- Rao T. P.; Yano K.; Iijima M.; Yamauchi A.; Tatsumi J. Regulation of Rhizosphere Acidification by Photosynthetic Activity in Cowpea (Vigna Unguiculata L. Walp.) Seedlings. Ann. Bot. 2002, 89, 213–220. 10.1093/aob/mcf030. [DOI] [PMC free article] [PubMed] [Google Scholar]
- Blossfeld S.; Gansert D. A Novel Non-Invasive Optical Method for Quantitative Visualization of pH Dynamics in the Rhizosphere of Plants. Plant, Cell Environ. 2007, 30, 176–186. 10.1111/j.1365-3040.2006.01616.x. [DOI] [PubMed] [Google Scholar]
- Blossfeld S.; Perriguey J.; Sterckeman T.; Morel J.-L.; Lösch R. Rhizosphere pH Dynamics in Trace-Metal-Contaminated Soils, Monitored with Planar pH Optodes. Plant Soil 2010, 330, 173–184. 10.1007/s11104-009-0190-z. [DOI] [Google Scholar]
- Schreiber C. M.; Zeng B.; Blossfeld S.; Rascher U.; Kazda M.; Schurr U.; Höltkemeier A.; Kuhn A. J. Monitoring Rhizospheric pH, Oxygen, and Organic Acid Dynamics in Two Short-Time Flooded Plant Species. J. Plant Nutr. Soil Sci. 2012, 175, 761–768. 10.1002/jpln.201000427. [DOI] [Google Scholar]
- Blossfeld S.; Schreiber C. M.; Liebsch G.; Kuhn A. J.; Hinsinger P. Quantitative Imaging of Rhizosphere pH and CO2 Dynamics with Planar Optodes. Ann. Bot. 2013, 112, 267–276. 10.1093/aob/mct047. [DOI] [PMC free article] [PubMed] [Google Scholar]
- Buss W.; Shepherd J. G.; Heal K. V.; Mašek O. Spatial and Temporal Microscale pH Change at the Soil-Biochar Interface. Geoderma 2018, 331, 50–52. 10.1016/j.geoderma.2018.06.016. [DOI] [Google Scholar]
- Rudolph-Mohr N.; Tötzke C.; Kardjilov N.; Oswald S. E. Mapping Water, Oxygen, and pH Dynamics in the Rhizosphere of Young Maize Roots. J. Plant Nutr. Soil Sci. 2017, 180, 336–346. 10.1002/jpln.201600120. [DOI] [Google Scholar]
- Santner J.; Larsen M.; Kreuzeder A.; Glud R. N. Two Decades of Chemical Imaging of Solutes in Sediments and Soils – a Review. Anal. Chim. Acta 2015, 878, 9–42. 10.1016/j.aca.2015.02.006. [DOI] [PubMed] [Google Scholar]
- Kreuzeder A.; Santner J.; Scharsching V.; Oburger E.; Hoefer C.; Hann S.; Wenzel W. W. In Situ Observation of Localized, Sub-Mm Scale Changes of Phosphorus Biogeochemistry in the Rhizosphere. Plant Soil 2018, 424, 573–589. 10.1007/s11104-017-3542-0. [DOI] [PMC free article] [PubMed] [Google Scholar]
- Rérolle V. M. C.; Floquet C. F. A.; Mowlem M. C.; Connelly D. P.; Achterberg E. P.; Bellerby R. R. G. J. Seawater-pH Measurements for Ocean-Acidification Observations. TrAC, Trends Anal. Chem. 2012, 40, 146–157. 10.1016/j.trac.2012.07.016. [DOI] [Google Scholar]
- Rérolle V. M. C.; Floquet C. F. A.; Harris A. J. K.; Mowlem M. C.; Bellerby R. R. G. J.; Achterberg E. P. Development of a Colorimetric Microfluidic pH Sensor for Autonomous Seawater Measurements. Anal. Chim. Acta 2013, 786, 124–131. 10.1016/j.aca.2013.05.008. [DOI] [PubMed] [Google Scholar]
- Lai C.-Z.; DeGrandpre M. D.; Darlington R. C. Autonomous Optofluidic Chemical Analyzers for Marine Applications: Insights from the Submersible Autonomous Moored Instruments (SAMI) for pH and pCO2. Front. Mar. Sci. 2018, 4, 438. 10.3389/fmars.2017.00438. [DOI] [Google Scholar]
- Kühl M.; Behrendt L.; Trampe E. C. L. E.; Qvortrup K.; Schreiber U.; Borisov S. M.; Klimant I.; Larkum A. W. D. Microenvironmental Ecology of the Chlorophyll B-Containing Symbiotic Cyanobacterium Prochloron in the Didemnid Ascidian Lissoclinum Patella. Front. Microbiol. 2012, 3, 402. 10.3389/fmicb.2012.00402. [DOI] [PMC free article] [PubMed] [Google Scholar]
- Brodersen K. E.; Koren K.; Moßhammer M.; Ralph P. J.; Kühl M.; Santner J. Seagrass-Mediated Phosphorus and Iron Solubilization in Tropical Sediments. Environ. Sci. Technol. 2017, 51, 14155–14163. 10.1021/acs.est.7b03878. [DOI] [PMC free article] [PubMed] [Google Scholar]
- Michael K. L.; Walt D. R. Combined Imaging and Chemical Sensing of Fertilization-Induced Acid Release from Single Sea Urchin Eggs. Anal. Biochem. 1999, 273, 168–178. 10.1006/abio.1999.4173. [DOI] [PubMed] [Google Scholar]
- Elgetti Brodersen K.; Koren K.; Lichtenberg M.; Kühl M. Nanoparticle-Based Measurements of pH and O2 Dynamics in the Rhizosphere of Zostera Marina L.: Effects of Temperature Elevation and Light-Dark Transitions. Plant, Cell Environ. 2016, 39, 1619–1630. 10.1111/pce.12740. [DOI] [PubMed] [Google Scholar]
- Agayn V. I.; Walt D. R. Fiber-Optic Sensor for Continuous Monitoring of Fermentation pH. Nat. Biotechnol. 1993, 11, 726–729. 10.1038/nbt0693-726. [DOI] [PubMed] [Google Scholar]
- Jeevarajan A. S.; Vani S.; Taylor T. D.; Anderson M. M. Continuous pH Monitoring in a Perfused Bioreactor System Using an Optical pH Sensor. Biotechnol. Bioeng. 2002, 78, 467–472. 10.1002/bit.10212. [DOI] [PubMed] [Google Scholar]
- Kensy F.; John G. T.; Hofmann B.; Büchs J. Characterisation of Operation Conditions and Online Monitoring of Physiological Culture Parameters in Shaken 24-Well Microtiter Plates. Bioprocess Biosyst. Eng. 2005, 28, 75–81. 10.1007/s00449-005-0010-7. [DOI] [PubMed] [Google Scholar]
- Schneider K.; Schütz V.; John G. T.; Heinzle E. Optical Device for Parallel Online Measurement of Dissolved Oxygen and pH in Shake Flask Cultures. Bioprocess Biosyst. Eng. 2010, 33, 541–547. 10.1007/s00449-009-0367-0. [DOI] [PubMed] [Google Scholar]
- Isett K.; George H.; Herber W.; Amanullah A. Twenty-Four-Well Plate Miniature Bioreactor High-Throughput System: Assessment for Microbial Cultivations. Biotechnol. Bioeng. 2007, 98, 1017–1028. 10.1002/bit.21484. [DOI] [PubMed] [Google Scholar]
- Naciri M.; Kuystermans D.; Al-Rubeai M. Monitoring pH and Dissolved Oxygen in Mammalian Cell Culture Using Optical Sensors. Cytotechnology 2008, 57, 245–250. 10.1007/s10616-008-9160-1. [DOI] [PMC free article] [PubMed] [Google Scholar]
- Velez-Suberbie M. L.; Betts J. P. J.; Walker K. L.; Robinson C.; Zoro B.; Keshavarz-Moore E. High Throughput Automated Microbial Bioreactor System Used for Clone Selection and Rapid Scale-down Process Optimization. Biotechnol. Prog. 2018, 34, 58–68. 10.1002/btpr.2534. [DOI] [PMC free article] [PubMed] [Google Scholar]
- Hsu W.-T.; Aulakh R. P. S.; Traul D. L.; Yuk I. H. Advanced Microscale Bioreactor System: A Representative Scale-down Model for Bench-Top Bioreactors. Cytotechnology 2012, 64, 667–678. 10.1007/s10616-012-9446-1. [DOI] [PMC free article] [PubMed] [Google Scholar]
- Puskeiler R.; Kaufmann K.; Weuster-Botz D. Development, Parallelization, and Automation of a Gas-Inducing Milliliter-Scale Bioreactor for High-Throughput Bioprocess Design (HTBD). Biotechnol. Bioeng. 2005, 89, 512–523. 10.1002/bit.20352. [DOI] [PubMed] [Google Scholar]
- Chen A.; Chitta R.; Chang D.; Amanullah A. Twenty-Four Well Plate Miniature Bioreactor System as a Scale-down Model for Cell Culture Process Development. Biotechnol. Bioeng. 2009, 102, 148–160. 10.1002/bit.22031. [DOI] [PubMed] [Google Scholar]
- Moses S.; Manahan M.; Ambrogelly A.; Ling W. L. W. Assessment of AMBRTM as a Model for High-Throughput Cell Culture Process Development Strategy. Adv. Biosci. Biotechnol. 2012, 03, 918–927. 10.4236/abb.2012.37113. [DOI] [Google Scholar]
- Schmideder A.; Weuster-Botz D. High-Performance Recombinant Protein Production with Escherichia Coli in Continuously Operated Cascades of Stirred-Tank Reactors. J. Ind. Microbiol. Biotechnol. 2017, 44, 1021–1029. 10.1007/s10295-017-1927-y. [DOI] [PubMed] [Google Scholar]
- Janzen N. H.; Schmidt M.; Krause C.; Weuster-Botz D. Evaluation of Fluorimetric pH Sensors for Bioprocess Monitoring at Low pH. Bioprocess Biosyst. Eng. 2015, 38, 1685–1692. 10.1007/s00449-015-1409-4. [DOI] [PubMed] [Google Scholar]
- Sardesai N.; Rao G.; Kostov Y. Versatile Common Instrumentation for Optical Detection of pH and Dissolved Oxygen. Rev. Sci. Instrum. 2015, 86, 074302 10.1063/1.4926542. [DOI] [PubMed] [Google Scholar]
- Ge X.; Rao G. Real-time Monitoring of Shake Flask Fermentation and off Gas Using Triple Disposable Noninvasive Optical Sensors. Biotechnol. Prog. 2012, 28, 872–877. 10.1002/btpr.1528. [DOI] [PubMed] [Google Scholar]
- Kondragunta B.; Drew J. L.; Brorson K. A.; Moreira A. R.; Rao G. Advances in Clone Selection Using High-Throughput Bioreactors. Biotechnol. Prog. 2010, 26, 1095–1103. 10.1002/btpr.392. [DOI] [PubMed] [Google Scholar]
- Lee S.; Ibey B. L.; Coté G. L.; Pishko M. V. Measurement of pH and Dissolved Oxygen within Cell Culture Media Using a Hydrogel Microarray Sensor. Sens. Actuators, B 2008, 128, 388–398. 10.1016/j.snb.2007.06.027. [DOI] [Google Scholar]
- Boniello C.; Mayr T.; Klimant I.; Koenig B.; Riethorst W.; Nidetzky B. Intraparticle Concentration Gradients for Substrate and Acidic Product in Immobilized Cephalosporin C Amidase and Their Dependencies on Carrier Characteristics and Reaction Parameters. Biotechnol. Bioeng. 2010, 106, 528–540. 10.1002/bit.22694. [DOI] [PubMed] [Google Scholar]
- Consolati T.; Bolivar J. M.; Petrasek Z.; Berenguer J.; Hidalgo A.; Guisán J. M.; Nidetzky B. Biobased, Internally pH-Sensitive Materials: Immobilized Yellow Fluorescent Protein as an Optical Sensor for Spatiotemporal Mapping of pH Inside Porous Matrices. ACS Appl. Mater. Interfaces 2018, 10, 6858–6868. 10.1021/acsami.7b16639. [DOI] [PubMed] [Google Scholar]
- Piletsky S. A.; Panasyuk T. L.; Piletskaya E. V.; Sergeeva T. A.; El’skaya A. V.; Pringsheim E.; Wolfbeis O. S. Polyaniline-Coated Microtiter Plates for Use in Longwave Optical Bioassays. Fresenius' J. Anal. Chem. 2000, 366, 807–810. 10.1007/s002160051575. [DOI] [PubMed] [Google Scholar]
- Busch M.; Höbel W.; Polster J. Software FIACRE: Bioprocess Monitoring on the Basis of Flow Injection Analysis Using Simultaneously a Urea Optode and a Glucose Luminescence Sensor. J. Biotechnol. 1993, 31, 327–343. 10.1016/0168-1656(93)90078-2. [DOI] [PubMed] [Google Scholar]
- Kulp T. J.; Camins I.; Angel S. M.; Munkholm C.; Walt D. R. Polymer Immobilized Enzyme Optrodes for the Detection of Penicillin. Anal. Chem. 1987, 59, 2849–2853. 10.1021/ac00151a006. [DOI] [PubMed] [Google Scholar]
- Fuh M. R. S.; Burgess L. W.; Christian G. D. Single Fiber-Optic Fluorescence Enzyme-Based Sensor. Anal. Chem. 1988, 60, 433–435. 10.1021/ac00156a012. [DOI] [PubMed] [Google Scholar]
- Xie X.; Suleiman A. A.; Guilbault G. G. A Fluorescence-based Fiber Optic Biosensor for the Flow-injection Analysis of Penicillin. Biotechnol. Bioeng. 1992, 39, 1147–1150. 10.1002/bit.260391111. [DOI] [PubMed] [Google Scholar]
- Healey B. G.; Walt D. R. Improved Fiber-Optic Chemical Sensor for Penicillin. Anal. Chem. 1995, 67, 4471–4476. 10.1021/ac00120a007. [DOI] [PubMed] [Google Scholar]
- Yerian T. D.; Christian G. D.; Ruzicka J. Flow Injection Analysis as a Diagnostic Tool for Development and Testing of a Penicillin Sensor. Anal. Chem. 1988, 60, 1250–1256. 10.1021/ac00164a003. [DOI] [PubMed] [Google Scholar]
- Scheper Th.; Brandes W.; Maschke H.; Plötz F.; Müller C. Two FIA-Based Biosensor Systems Studied for Bioprocess Monitoring. J. Biotechnol. 1993, 31, 345–356. 10.1016/0168-1656(93)90079-3. [DOI] [PubMed] [Google Scholar]
- Yadavalli V. K.; Koh W.-G.; Lazur G. J.; Pishko M. V. Microfabricated Protein-Containing Poly (Ethylene Glycol) Hydrogel Arrays for Biosensing. Sens. Actuators, B 2004, 97, 290–297. 10.1016/j.snb.2003.08.030. [DOI] [Google Scholar]
- Tsai H.; Doong R. Simultaneous Determination of Renal Clinical Analytes in Serum Using Hydrolase- and Oxidase-Encapsulated Optical Array Biosensors. Anal. Biochem. 2004, 334, 183–192. 10.1016/j.ab.2004.08.009. [DOI] [PubMed] [Google Scholar]
- Koncki R.; Lenarczuk T.; Radomska A.; Głąb S. Optical Biosensors Based on Prussian Blue Films. Analyst 2001, 126, 1080–1085. 10.1039/b103044m. [DOI] [PubMed] [Google Scholar]
- Brennan J. D.; Brown R. S.; Della Manna A.; Kallury K. M.; Piunno P. A.; Krull U. J. Covalent Immobilization of Amphiphilic Monolayers Containing Urease onto Optical Fibers for Fluorimetric Detection of Urea. Sens. Actuators, B 1993, 11, 109–119. 10.1016/0925-4005(93)85245-6. [DOI] [Google Scholar]
- Yerian T. D.; Christian G. D.; Růžička J. Enzymatic Determination of Urea in Water and Serum by Optosensing Flow Injection Analysis. Analyst 1986, 111, 865–873. 10.1039/AN9861100865. [DOI] [PubMed] [Google Scholar]
- Koncki R.; Wolfbeis O. S. Composite Films of Prussian Blue and N-Substituted Polypyrroles: Covalent Immobilization of Enzymes and Application to near Infrared Optical Biosensing. Biosens. Bioelectron. 1999, 14, 87–92. 10.1016/S0956-5663(98)00095-5. [DOI] [PubMed] [Google Scholar]
- Scheper T.; Brandes W.; Maschke H.; Plötz F.; Müller C. Two FIA-Based Biosensor Systems Studied for Bioprocess Monitoring. J. Biotechnol. 1993, 31, 345–356. 10.1016/0168-1656(93)90079-3. [DOI] [PubMed] [Google Scholar]
- de Marcos S.; Hortigüela R.; Gatbán J.; Castillo J. R.; Wolfbeis O. S. Characterization of a Urea Optical Sensor Based on Polypyrrole. Microchim. Acta 1999, 130, 267–272. 10.1007/BF01242915. [DOI] [Google Scholar]
- Busch M.; Gutberlet F.; Hoebel W.; Polster J.; Schmidt H.-L.; Schwenk M. The Application of Optodes in FIA-Based Fermentation Process Control Using the Software Package FIACRE. Sens. Actuators, B 1993, 11, 407–412. 10.1016/0925-4005(93)85280-N. [DOI] [Google Scholar]
- Tsai H.; Doong R. Simultaneous Determination of pH, Urea, Acetylcholine and Heavy Metals Using Array-Based Enzymatic Optical Biosensor. Biosens. Bioelectron. 2005, 20, 1796–1804. 10.1016/j.bios.2004.07.008. [DOI] [PubMed] [Google Scholar]
- Esmaeili C.; Heng L. Y.; Ling T. L. Nile Blue Chromoionophore-Doped Kappa-Carrageenan for a Novel Reflectometric Urea Biosensor. Sens. Actuators, B 2015, 221, 969–977. 10.1016/j.snb.2015.07.037. [DOI] [Google Scholar]
- Kazakova L. I.; Shabarchina L. I.; Sukhorukov G. B. Co-Encapsulation of Enzyme and Sensitive Dye as a Tool for Fabrication of Microcapsule Based Sensor for Urea Measuring. Phys. Chem. Chem. Phys. 2011, 13, 11110–11117. 10.1039/c1cp20354a. [DOI] [PubMed] [Google Scholar]
- Koh W.-G.; Pishko M. Immobilization of Multi-Enzyme Microreactors inside Microfluidic Devices. Sens. Actuators, B 2005, 106, 335–342. 10.1016/j.snb.2004.08.025. [DOI] [Google Scholar]
- Andreou V. G.; Clonis Y. D. Novel Fiber-Optic Biosensor Based on Immobilized Glutathione S-Transferase and Sol–Gel Entrapped Bromcresol Green for the Determination of Atrazine. Anal. Chim. Acta 2002, 460, 151–161. 10.1016/S0003-2670(02)00250-7. [DOI] [Google Scholar]
- Vamvakaki V.; Fournier D.; Chaniotakis N. A. Fluorescence Detection of Enzymatic Activity within a Liposome Based Nano-Biosensor. Biosens. Bioelectron. 2005, 21, 384–388. 10.1016/j.bios.2004.10.028. [DOI] [PubMed] [Google Scholar]
- Pfeiffer S. A.; Borisov S. M.; Nagl S. In-Line Monitoring of pH and Oxygen during Enzymatic Reactions in off-the-Shelf All-Glass Microreactors Using Integrated Luminescent Microsensors. Microchim. Acta 2017, 184, 621–626. 10.1007/s00604-016-2021-2. [DOI] [Google Scholar]
- Xavier M. P.; Vallejo B.; Marazuela M. D.; Moreno-Bondi M. C.; Baldini F.; Falai A. Fiber Optic Monitoring of Carbamate Pesticides Using Porous Glass with Covalently Bound Chlorophenol Red. Biosens. Bioelectron. 2000, 14, 895–905. 10.1016/S0956-5663(99)00066-4. [DOI] [PubMed] [Google Scholar]
- Doong R.-A.; Tsai H.-C. Immobilization and Characterization of Sol–Gel-Encapsulated Acetylcholinesterase Fiber-Optic Biosensor. Anal. Chim. Acta 2001, 434, 239–246. 10.1016/S0003-2670(01)00853-4. [DOI] [Google Scholar]
- Russell R. J.; Pishko M. V.; Simonian A. L.; Wild J. R. Poly(Ethylene Glycol) Hydrogel-Encapsulated Fluorophore–Enzyme Conjugates for Direct Detection of Organophosphorus Neurotoxins. Anal. Chem. 1999, 71, 4909–4912. 10.1021/ac990901u. [DOI] [PubMed] [Google Scholar]
- Viveros L.; Paliwal S.; McCrae D.; Wild J.; Simonian A. A Fluorescence-Based Biosensor for the Detection of Organophosphate Pesticides and Chemical Warfare Agents. Sens. Actuators, B 2006, 115, 150–157. 10.1016/j.snb.2005.08.032. [DOI] [Google Scholar]
- Jerónimo P. C. A.; Araújo A. N.; Montenegro M. C. B. S. M.; Satinský D.; Solich P. Flow-through Sol–Gel Optical Biosensor for the Colorimetric Determination of Acetazolamide. Analyst 2005, 130, 1190–1197. 10.1039/b504474j. [DOI] [PubMed] [Google Scholar]
- Bidmanova S.; Steiner M.-S.; Stepan M.; Vymazalova K.; Gruber M. A.; Duerkop A.; Damborsky J.; Prokop Z.; Wolfbeis O. S. Enzyme-Based Test Strips for Visual or Photographic Detection and Quantitation of Gaseous Sulfur Mustard. Anal. Chem. 2016, 88, 6044–6049. 10.1021/acs.analchem.6b01272. [DOI] [PubMed] [Google Scholar]
- Charlton S. C.; Fleming R. L.; Zipp A. Solid-Phase Colorimetric Determination of Potassium. Clin. Chem. 1982, 28, 1857–1861. 10.1093/clinchem/28.9.1857. [DOI] [PubMed] [Google Scholar]
- Lerchi M.; Bakker E.; Rusterholz B.; Simon W. Lead-Selective Bulk Optodes Based on Neutral Ionophores with Subnanomolar Detection Limits. Anal. Chem. 1992, 64, 1534–1540. 10.1021/ac00038a007. [DOI] [Google Scholar]
- He H.; Li H; Mohr G.; Kovacs B.; Werner T.; Wolfbeis O. S. Novel Type of Ion-Selective Fluorosensor Based on the Inner Filter Effect: An Optrode for Potassium. Anal. Chem. 1993, 65, 123–127. 10.1021/ac00050a006. [DOI] [Google Scholar]
- Wolfbeis O. S. Optical Sensors in Flow Injection Analysis. J. Mol. Struct. 1993, 292, 133–140. 10.1016/0022-2860(93)80096-E. [DOI] [Google Scholar]
- Xiong Y.; Huang Y.; Ye Z.; Guan Y. Flow Injection Small-Volume Fiber-Optic pH Sensor Based on Evanescent Wave Excitation and Fluorescence Determination. J. Fluoresc. 2011, 21, 1137–1142. 10.1007/s10895-010-0790-2. [DOI] [PubMed] [Google Scholar]
- Li H.; Wolfbeis O. S. Determination of Urease Activity by Flow-Injection Analysis Using an Ammonium-Selective Optrode as the Detector. Anal. Chim. Acta 1993, 276, 115–119. 10.1016/0003-2670(93)85045-L. [DOI] [Google Scholar]
- Gruber P.; Marques M. P. C.; Szita N.; Mayr T. Integration and Application of Optical Chemical Sensors in Microbioreactors. Lab Chip 2017, 17, 2693–2712. 10.1039/C7LC00538E. [DOI] [PubMed] [Google Scholar]
- Fan H.; Lu Y.; Stump A.; Reed S. T.; Baer T.; Schunk R.; Perez-Luna V.; López G. P.; Brinker C. J. Rapid Prototyping of Patterned Functional Nanostructures. Nature 2000, 405, 56–60. 10.1038/35011026. [DOI] [PubMed] [Google Scholar]
- Florea L.; Fay C.; Lahiff E.; Phelan T.; O’Connor N. E.; Corcoran B.; Diamond D.; Benito-Lopez F. Dynamic pH Mapping in Microfluidic Devices by Integrating Adaptive Coatings Based on Polyaniline with Colorimetric Imaging Techniques. Lab Chip 2013, 13, 1079–1085. 10.1039/c2lc41065f. [DOI] [PubMed] [Google Scholar]
- Zhu H.; Zhou X.; Su F.; Tian Y.; Ashili S.; Holl M. R.; Meldrum D. R. Micro-Patterning and Characterization of pHEMA-Co-PAM-Based Optical Chemical Sensors for Lab-on-a-Chip Applications. Sens. Actuators, B 2012, 173, 817–823. 10.1016/j.snb.2012.07.101. [DOI] [PMC free article] [PubMed] [Google Scholar]
- Tahirbegi I. B.; Ehgartner J.; Sulzer P.; Zieger S.; Kasjanow A.; Paradiso M.; Strobl M.; Bouwes D.; Mayr T. Fast Pesticide Detection inside Microfluidic Device with Integrated Optical pH, Oxygen Sensors and Algal Fluorescence. Biosens. Bioelectron. 2017, 88, 188–195. 10.1016/j.bios.2016.08.014. [DOI] [PubMed] [Google Scholar]
- Tang Y.; Zhen L.; Liu J.; Wu J. Rapid Antibiotic Susceptibility Testing in a Microfluidic pH Sensor. Anal. Chem. 2013, 85, 2787–2794. 10.1021/ac303282j. [DOI] [PubMed] [Google Scholar]
- Thete A. R.; Gross G. A.; Henkel T.; Koehler J. M. Microfluidic Arrangement with an Integrated Micro-Spot Array for the Characterization of pH and Solvent Polarity. Chem. Eng. J. 2008, 135, S327–S332. 10.1016/j.cej.2007.07.012. [DOI] [Google Scholar]
- Zhan W.; Seong G. H.; Crooks R. M. Hydrogel-Based Microreactors as a Functional Component of Microfluidic Systems. Anal. Chem. 2002, 74, 4647–4652. 10.1021/ac020340y. [DOI] [PubMed] [Google Scholar]
- Klauke N.; Monaghan P.; Sinclair G.; Padgett M.; Cooper J. Characterisation of Spatial and Temporal Changes in pH Gradients in Microfluidic Channels Using Optically Trapped Fluorescent Sensors. Lab Chip 2006, 6, 788–793. 10.1039/b517237c. [DOI] [PubMed] [Google Scholar]
- Funfak A.; Cao J.; Wolfbeis O. S.; Martin K.; Köhler J. M. Monitoring Cell Cultivation in Microfluidic Segments by Optical pH Sensing with a Micro Flow-through Fluorometer Using Dye-Doped Polymer Particles. Microchim. Acta 2009, 164, 279–286. 10.1007/s00604-008-0096-0. [DOI] [Google Scholar]
- Brigo L.; Carofiglio T.; Fregonese C.; Meneguzzi F.; Mistura G.; Natali M.; Tonellato U. An Optical Sensor for pH Supported onto Tentagel Resin Beads. Sens. Actuators, B 2008, 130, 477–482. 10.1016/j.snb.2007.09.020. [DOI] [Google Scholar]
- Gruber P.; Marques M. P. C.; Sulzer P.; Wohlgemuth R.; Mayr T.; Baganz F.; Szita N. Real-Time pH Monitoring of Industrially Relevant Enzymatic Reactions in a Microfluidic Side-Entry Reactor (ΜSER) Shows Potential for pH Control. Biotechnol. J. 2017, 12, 1600475. 10.1002/biot.201600475. [DOI] [PubMed] [Google Scholar]
- Nagl S. Micro Free-Flow Isoelectric Focusing with Integrated Optical pH Sensors. Eng. Life Sci. 2018, 18, 114–123. 10.1002/elsc.201700035. [DOI] [PMC free article] [PubMed] [Google Scholar]
- Poehler E.; Herzog C.; Lotter C.; Pfeiffer S. A.; Aigner D.; Mayr T.; Nagl S. Label-Free Microfluidic Free-Flow Isoelectric Focusing, pH Gradient Sensing and near Real-Time Isoelectric Point Determination of Biomolecules and Blood Plasma Fractions. Analyst 2015, 140, 7496–7502. 10.1039/C5AN01345C. [DOI] [PubMed] [Google Scholar]
- Kalpana S.; Priyadarshini S. R.; Maria Leena M.; Moses J. A.; Anandharamakrishnan C. Intelligent Packaging: Trends and Applications in Food Systems. Trends Food Sci. Technol. 2019, 93, 145–157. 10.1016/j.tifs.2019.09.008. [DOI] [Google Scholar]
- Kuswandi B.; Nurfawaidi A. On-Package Dual Sensors Label Based on pH Indicators for Real-Time Monitoring of Beef Freshness. Food Control 2017, 82, 91–100. 10.1016/j.foodcont.2017.06.028. [DOI] [Google Scholar]
- Kurek M.; Garofulić I. E.; Bakić M. T.; Ščetar M.; Uzelac V. D.; Galić K. Development and Evaluation of a Novel Antioxidant and pH Indicator Film Based on Chitosan and Food Waste Sources of Antioxidants. Food Hydrocolloids 2018, 84, 238–246. 10.1016/j.foodhyd.2018.05.050. [DOI] [Google Scholar]
- Luchese C. L.; Abdalla V. F.; Spada J. C.; Tessaro I. C. Evaluation of Blueberry Residue Incorporated Cassava Starch Film as pH Indicator in Different Simulants and Foodstuffs. Food Hydrocolloids 2018, 82, 209–218. 10.1016/j.foodhyd.2018.04.010. [DOI] [Google Scholar]
- Ma Q.; Liang T.; Cao L.; Wang L. Intelligent Poly (Vinyl Alcohol)-Chitosan Nanoparticles-Mulberry Extracts Films Capable of Monitoring pH Variations. Int. J. Biol. Macromol. 2018, 108, 576–584. 10.1016/j.ijbiomac.2017.12.049. [DOI] [PubMed] [Google Scholar]
- Ma Q.; Wang L. Preparation of a Visual pH-Sensing Film Based on Tara Gum Incorporating Cellulose and Extracts from Grape Skins. Sens. Actuators, B 2016, 235, 401–407. 10.1016/j.snb.2016.05.107. [DOI] [Google Scholar]
- Prietto L.; Mirapalhete T. C.; Pinto V. Z.; Hoffmann J. F.; Vanier N. L.; Lim L.-T.; Guerra Dias A. R.; da Rosa Zavareze E. pH-Sensitive Films Containing Anthocyanins Extracted from Black Bean Seed Coat and Red Cabbage. LWT 2017, 80, 492–500. 10.1016/j.lwt.2017.03.006. [DOI] [Google Scholar]
- Moradi M.; Tajik H.; Almasi H.; Forough M.; Ezati P. A Novel pH-Sensing Indicator Based on Bacterial Cellulose Nanofibers and Black Carrot Anthocyanins for Monitoring Fish Freshness. Carbohydr. Polym. 2019, 222, 115030. 10.1016/j.carbpol.2019.115030. [DOI] [PubMed] [Google Scholar]
- Yong H.; Wang X.; Bai R.; Miao Z.; Zhang X.; Liu J. Development of Antioxidant and Intelligent pH-Sensing Packaging Films by Incorporating Purple-Fleshed Sweet Potato Extract into Chitosan Matrix. Food Hydrocolloids 2019, 90, 216–224. 10.1016/j.foodhyd.2018.12.015. [DOI] [Google Scholar]
- Choi I.; Lee J. Y.; Lacroix M.; Han J. Intelligent pH Indicator Film Composed of Agar/Potato Starch and Anthocyanin Extracts from Purple Sweet Potato. Food Chem. 2017, 218, 122–128. 10.1016/j.foodchem.2016.09.050. [DOI] [PubMed] [Google Scholar]
- Jayakumar A.; Heera K. V.; Sumi T. S.; Joseph M.; Mathew S.; Praveen G.; Nair I. C.; Radhakrishnan E. K. Starch-PVA Composite Films with Zinc-Oxide Nanoparticles and Phytochemicals as Intelligent pH Sensing Wraps for Food Packaging Application. Int. J. Biol. Macromol. 2019, 136, 395–403. 10.1016/j.ijbiomac.2019.06.018. [DOI] [PubMed] [Google Scholar]
- Liu J.; Wang H.; Guo M.; Li L.; Chen M.; Jiang S.; Li X.; Jiang S. Extract from Lycium Ruthenicum Murr. Incorporating κ-Carrageenan Colorimetric Film with a Wide pH–Sensing Range for Food Freshness Monitoring. Food Hydrocolloids 2019, 94, 1–10. 10.1016/j.foodhyd.2019.03.008. [DOI] [Google Scholar]
- Musso Y. S.; Salgado P. R.; Mauri A. N. Smart Edible Films Based on Gelatin and Curcumin. Food Hydrocolloids 2017, 66, 8–15. 10.1016/j.foodhyd.2016.11.007. [DOI] [Google Scholar]
- Liang T.; Wang L. A pH-Sensing Film from Tamarind Seed Polysaccharide with Litmus Lichen Extract as an Indicator. Polymers 2018, 10, 13. 10.3390/polym10010013. [DOI] [PMC free article] [PubMed] [Google Scholar]
- Ezati P.; Tajik H.; Moradi M.; Molaei R. Intelligent pH-Sensitive Indicator Based on Starch-Cellulose and Alizarin Dye to Track Freshness of Rainbow Trout Fillet. Int. J. Biol. Macromol. 2019, 132, 157–165. 10.1016/j.ijbiomac.2019.03.173. [DOI] [PubMed] [Google Scholar]
- Moreira J. B.; Terra A. L. M.; Costa J. A. V.; Greque de Morais M. G. Development of pH Indicator from PLA/PEO Ultrafine Fibers Containing Pigment of Microalgae Origin. Int. J. Biol. Macromol. 2018, 118, 1855–1862. 10.1016/j.ijbiomac.2018.07.028. [DOI] [PubMed] [Google Scholar]
- Ding L.; Li X.; Hu L.; Zhang Y.; Jiang Y.; Mao Z.; Xu H.; Wang B.; Feng X.; Sui X. A Naked-Eye Detection Polyvinyl Alcohol/Cellulose-Based pH Sensor for Intelligent Packaging. Carbohydr. Polym. 2020, 233, 115859. 10.1016/j.carbpol.2020.115859. [DOI] [PubMed] [Google Scholar]
- Zhang H.; Hou A.; Xie K.; Gao A. Smart Color-Changing Paper Packaging Sensors with pH Sensitive Chromophores Based on Azo-Anthraquinone Reactive Dyes. Sens. Actuators, B 2019, 286, 362–369. 10.1016/j.snb.2019.01.165. [DOI] [Google Scholar]
- Pacquit A.; Lau K. T.; McLaughlin H.; Frisby J.; Quilty B.; Diamond D. Development of a Volatile Amine Sensor for the Monitoring of Fish Spoilage. Talanta 2006, 69, 515–520. 10.1016/j.talanta.2005.10.046. [DOI] [PubMed] [Google Scholar]
- Borchert N. B.; Kerry J. P.; Papkovsky D. B. A CO2 Sensor Based on Pt-Porphyrin Dye and FRET Scheme for Food Packaging Applications. Sens. Actuators, B 2013, 176, 157–165. 10.1016/j.snb.2012.09.043. [DOI] [Google Scholar]
- Behnood A.; Van Tittelboom K.; De Belie N. Methods for Measuring pH in Concrete: A Review. Constr. Build. Mater. 2016, 105, 176–188. 10.1016/j.conbuildmat.2015.12.032. [DOI] [Google Scholar]
- Dantan N.; Habel W. R.; Wolfbeis O. S.. Fiber Optic pH Sensor for Early Detection of Danger of Corrosion in Steel-Reinforced Concrete Structures. In Smart Structures and Materials 2005: Smart Sensor Technology and Measurement Systems; International Society for Optics and Photonics, 2005; Vol. 5758, pp 274–285. [Google Scholar]
- Blumentritt M.; Melhorn K.; Flachsbarth J.; Kroener M.; Kowalsky W.; Johannes H.-H. A Novel Fabrication Method of Fiber-Optical Planar Transmission Sensors for Monitoring pH in Concrete Structures. Sens. Actuators, B 2008, 131, 504–508. 10.1016/j.snb.2007.12.034. [DOI] [Google Scholar]
- McPolin D. O.; Basheer P. A. M.; Grattan K. T. V.; Long A. E.; Sun T.; Xie W. Preliminary Development and Evaluation of Fiber-Optic Chemical Sensors. J. Mater. Civ. Eng. 2011, 23, 1200–1210. 10.1061/(ASCE)MT.1943-5533.0000290. [DOI] [Google Scholar]
- Müller B.; Grengg C.; Schallert V.; Sakoparnig M.; Staudinger C.; Breininger J.; Mittermayr F.; Ungerböck B.; Borisov S. M.; Dietzel M.; et al. Wide-Range Optical pH Imaging of Cementitious Materials Exposed to Chemically Corrosive Environments. RILEM Technol. Lett. 2018, 3, 39–45. 10.21809/rilemtechlett.2018.72. [DOI] [Google Scholar]
- Nielsen S. D.; Paegle I.; Borisov S. M.; Kjeldsen K. U.; Røy H.; Skibsted J.; Koren K. Optical Sensing of pH and O2 in the Evaluation of Bioactive Self-Healing Cement. ACS Omega 2019, 4, 20237–20243. 10.1021/acsomega.9b02541. [DOI] [PMC free article] [PubMed] [Google Scholar]
Associated Data
This section collects any data citations, data availability statements, or supplementary materials included in this article.