

Abstract
Risk factors for pulmonary embolism in patients with coronavirus disease 2019 include obesity, an elevated d-dimer value, elevated C-reactive protein level, and a rising d-dimer value over time.
Introduction
Thrombotic complications in patients diagnosed with coronavirus disease 2019 (COVID-19) are emerging as important sequelae that contribute to significant morbidity and mortality (1,2). Pulmonary embolism (PE), deep vein thrombosis, ischemic stroke, and myocardial infarction are examples of complications described in patients with increasing frequency (1,2). Recent publications propose excessive inflammation, hypoxia, immobilization, and diffuse intravascular coagulation in the setting of COVID-19 infection as contributors to a prothrombotic state (2,3). The purpose of this study was to evaluate the clinical characteristics of patients with COVID-19 who developed PE and to compare their inflammatory markers, d-dimer values, and outcomes.
Materials and Methods
Institutional review board approval and waived informed consent were obtained for this retrospective analysis. All chest examinations performed in a single health system across multiple hospitals from March 16, 2020, to April 18, 2020, were obtained from the picture archiving and communication system database. From this list, patients with pulmonary CT angiography were identified; those who had a positive reverse transcriptase polymerase chain reaction result on nasopharyngeal swab formed the study population (Fig 1). The reverse transcriptase polymerase chain reaction test was developed in-house by the Clinical Microbiology Laboratory with Federal Drug Agency’s Emergency Use Authorization. All pulmonary CT angiography studies were initially read by fellowship-trained thoracic or abdominal radiologists, or emergency radiologists, all with 2–40 years of experience. The radiology reports for these examinations were reviewed to determine the presence or absence of PE. CT studies that were limited by respiratory motion or poor contrast opacification were excluded. In addition, nine patients who tested positive for COVID-19 underwent two pulmonary CT angiograms during their admission, and only the most recent CT and respective laboratory values were included in data analysis. Patient charts were reviewed for demographic, laboratory, and clinical outcome variables. Laboratory values that were obtained within 2 days of the pulmonary CT angiogram were used in data analysis. If a patient was found to have a PE on a pulmonary CT angiogram performed more than 2 days after admission, then the admission values and values just prior to the CT were recorded to evaluate for absolute change. Simplified PE severity index scores were calculated based on clinical variables.
Figure 1:

Flowchart depicts patient population. Limited pulmonary CT angiography was defined by respiratory motion and poor contrast opacification. Nine patients who tested positive for coronavirus disease 2019 (COVID-19) underwent multiple pulmonary CT angiography examinations and only the most recent study was used as a reference point in analysis. PCR = polymerase chain reaction, RT-PCR = reverse transcriptase polymerase chain reaction.
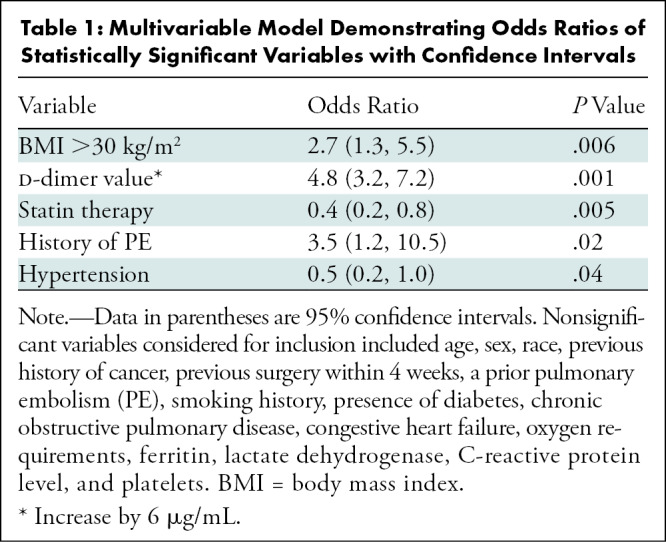
Wilcoxon two-sample test was used to analyze continuous variables and Pearson χ2 test was used for nominal variables. Logistic regression was used to generate area under the receiver operating characteristic curve estimates. Sensitivity and specificity were chosen based on values that maximized sum over all possible cut points. A forward stepwise logistic regression with an α value of .05 required for inclusion was used to determine a multivariable model. Demographic and laboratory values listed in the footnote of Table 1 were considered for inclusion. The final model included the smallest set of variables where each met the significance criteria and included hypertension, history of PE, body mass index greater than 30 kg/m2, statin therapy, and d-dimer value prior to pulmonary CT angiography. Odds ratios were calculated for each variable while adjusting for other variables in the multivariable model.
Table 1:
Multivariable Model Demonstrating Odds Ratios of Statistically Significant Variables with Confidence Intervals
Results
During a 1-month period, 328 patients with a positive reverse transcriptase polymerase chain reaction test result for COVID-19 underwent pulmonary CT angiography. Among these, 72 of 328 (22%; 95% confidence interval [CI]: 18%, 27%) were found to have a PE (Fig 1). Demographic results are depicted in Table 2. Patients with a body mass index greater than 30 kg/m2 were seen more frequently in the PE group compared with the non-PE group (58% vs 44%; P = .045; see example in Fig 2). Fewer patients with PE were undergoing statin therapy prior to admission compared with the non-PE cohort (27% vs 46%; P = .005). There was no significant difference in age, sex, ethnicity, or history of cardiopulmonary disease such as congestive heart failure or chronic obstructive pulmonary disease. Laboratory values obtained prior to pulmonary CT angiography and absolute change in laboratory values from admission to just prior to pulmonary CT angiography within 2 days are depicted in Table 2. Mean d-dimer value, obtained within 2 days of pulmonary CT angiography, was higher in the PE positive group relative to the PE negative group (9.33 μg/mL vs 2.54 μg/mL; P = .001). Mean C-reactive protein level, obtained within 2 days of pulmonary CT angiography, was also higher in the PE-positive group compared with the PE-negative group (10.0 mg/dL vs 7.4 mg/dL; P = .01). Oxygen requirements, measured in liters per minute in nonintubated patients within 4 hours prior to pulmonary CT angiography, was higher in the PE group than the non-PE group (4.3 L/min vs 2.7 L/min; P = .007).
Table 2:
Demographic, Outcome, and Laboratory Variables

Figure 2:

A, B, Axial and, C, D, coronal pulmonary CT angiography images in a 76-year-old African American man with body mass index of 37 kg/m2 who required admission to medical intensive care unit for acute respiratory failure secondary to coronavirus disease 2019 confirmed with reverse transcriptase polymerase chain reaction. Pulmonary CT angiography was obtained 4 days after admission and demonstrates acute pulmonary embolism in right lower lobar pulmonary artery (white arrows), bilateral ground glass opacities (black arrows), and consolidation (arrowheads).
In the PE group, the location of the PE was recorded with respect to the most proximal embolus. Distribution was as follows: 51% (37 of 72) segmental PE, 31% (22 of 72) lobar PE, 13% (nine of 72) central PE, and 5.5% (four of 72) subsegmental PE. CT evidence of right heart strain was documented in 11% (eight of 72) of patient reports. Average simplified PE severity index was 1.2 ± 0.70 (standard deviation). Among the 72 patients who developed a PE, 51% were diagnosed in the emergency department. Twenty-eight of 122 (23%) of all patients who were on venous thromboprophylaxis developed a PE. Rate of intubation in patients admitted to the intensive care unit (ICU) was 65% in the PE group versus 67% in the non-PE group (P = .89). Mean intubation time was 10.2 days ± 6.6 in patients with PE and 10.1 days ± 7.9 in patients without PE (P = .73). No statistically significant difference in ICU admission or death was found between the PE and non-PE cohorts.
A multivariable model was developed to predict PE, and odds ratios for statistically significant results are depicted in Table 1. Patients receiving statin therapy prior to admission had an adjusted multivariable odds ratio of 0.4 (95% CI: 0.23, 0.75; P = .005) for developing a PE. Patients with a body mass index greater than 30 kg/m2 had an adjusted multivariable odds ratio of 2.7 (95% CI: 1.3, 5.5; P = .006) for developing a PE. An increase in d-dimer value of 6 μg/mL had an odds ratio of 4.8 (95% CI: 3.2, 7.2; P = .001) for developing a PE. The multivariable model had an area under the receiver operating characteristic curve estimate of 0.86 (95% CI: 0.81, 0.91). Sensitivity and specificity for a d-dimer value of 3.11μg/mL were 78% and 81%, respectively, for development of PE, with an area under the receiver operating characteristic curve estimate of 0.85.
Discussion
Respiratory tract infection is a known risk factor in development of pulmonary embolism (PE) in hospitalized patients (4). In recently published studies, the incidence of PE in patients with coronavirus disease 2019 (COVID-19) who underwent pulmonary CT angiography was reported to be between 23%–30%, which is similar to our rate of 22% (5,6). Our patient population is unique when compared with recently published studies. There were a greater number of African American patients and patients with obesity in our demographic distribution. In our study, patients with a body mass index greater than 30 kg/m2 were 2.7 times more likely to develop a PE, which has not been previously described. Recent literature suggests that obesity in COVID-19 is associated with more severe disease (7). We found that patients with COVID-19 receiving statin therapy prior to admission are less likely to develop a PE. Statins have been previously described to be associated with decreased rates of venous thromboembolism, as well as decreased risk of recurrent PE (8,9).
In our study, we found a significant difference in C-reactive protein level and d-dimer value between PE-positive and PE-negative groups, which may suggest that patients with a positive COVID-19 test with higher levels of inflammation and d-dimer values are more susceptible to developing PE. In addition, we found that nonintubated patients who developed PE required more oxygen prior to pulmonary CT angiography evaluation than did their non-PE counterparts.
We did not find a significant difference in ICU admissions, requirement for intubation, or duration of intubation between patients who developed PE and those who did not. In fact, 72% (52 of 72) of PEs were diagnosed in patients who did not require ICU-level care. This is in sharp contrast to a recently published study (5) highlighting PE to be associated with ICU admission and mechanical ventilation. Our results suggest that even patients who do not have severe enough illness to qualify for ICU care can develop acute PE.
Limitations of our study included its retrospective nature and restriction to a single-health system.
Our study, in conjunction with recent and future studies, may prompt early evaluation with pulmonary CT angiography in patients with coronavirus disease 2019 who are at increased risk for developing pulmonary embolism based on demographic, clinical, and laboratory variables (6,7,10).
Footnotes
Disclosures of Conflicts of Interest: N.P. disclosed no relevant relationships. P.C. disclosed no relevant relationships. P.Y.P. disclosed no relevant relationships. M.O.H. disclosed no relevant relationships. P.B. disclosed no relevant relationships. K.K. disclosed no relevant relationships. J.N. disclosed no relevant relationships. T.K. disclosed no relevant relationships. D.S. disclosed no relevant relationships. N.R. disclosed no relevant relationships. C.K. disclosed no relevant relationships. E.L.P. disclosed no relevant relationships. T.S. disclosed no relevant relationships.
References
- 1.Bikdeli B, Madhavan MV, Jimenez D, et al. COVID-19 and Thrombotic or Thromboembolic Disease: Implications for Prevention, Antithrombotic Therapy, and Follow-up. J Am Coll Cardiol 2020;75(23):2950–2973. [DOI] [PMC free article] [PubMed] [Google Scholar]
- 2.Klok FA, Kruip MJHA, van der Meer NJM, et al. Incidence of thrombotic complications in critically ill ICU patients with COVID-19. Thromb Res 2020;191:145–147. [DOI] [PMC free article] [PubMed] [Google Scholar]
- 3.Goeijenbier M, van Wissen M, van de Weg C, et al. Review: Viral infections and mechanisms of thrombosis and bleeding. J Med Virol 2012;84(10):1680–1696. [DOI] [PMC free article] [PubMed] [Google Scholar]
- 4.Grimnes G, Isaksen T, Tichelaar YIGV, Brækkan SK, Hansen JB. Acute infection as a trigger for incident venous thromboembolism: Results from a population-based case-crossover study. Res Pract Thromb Haemost 2017;2(1):85–92. [DOI] [PMC free article] [PubMed] [Google Scholar]
- 5.Grillet F, Behr J, Calame P, Aubry S, Delabrousse E. Acute Pulmonary Embolism Associated with COVID-19 Pneumonia Detected by Pulmonary CT Angiography. Radiology 2020. 10.1148/radiol.2020201544. Published online April 23, 2020. [DOI] [PMC free article] [PubMed] [Google Scholar]
- 6.Leonard-Lorant I, Delabranche X, Severac F, et al. Acute Pulmonary Embolism in COVID-19 Patients on CT Angiography and Relationship to D-Dimer Levels. Radiology 2020. 10.1148/radiol.2020201561. Published online April 23, 2020. [DOI] [PMC free article] [PubMed] [Google Scholar]
- 7.Zheng KI, Gao F, Wang XB, et al. Letter to the Editor: Obesity as a risk factor for greater severity of COVID-19 in patients with metabolic associated fatty liver disease. Metabolism 2020. 10.1016/j.metabol.2020.154244. Published online April 19, 2020. [DOI] [PMC free article] [PubMed] [Google Scholar]
- 8.Wallace A, Albadawi H, Hoang P, et al. Statins as a preventative therapy for venous thromboembolism. Cardiovasc Diagn Ther 2017;7(Suppl 3):S207–S218. [DOI] [PMC free article] [PubMed] [Google Scholar]
- 9.Ray KK. Statin treatment and the risk of recurrent pulmonary embolism. Eur Heart J 2013;34(24):1775–1777. [DOI] [PubMed] [Google Scholar]
- 10.Oudkerk M, Büller HR, Kuijpers D, et al. Diagnosis, Prevention, and Treatment of Thromboembolic Complications in COVID-19: Report of the National Institute for Public Health of the Netherlands. Radiology 2020. 10.1148/radiol.2020201629. Published online April 23, 2020. [DOI] [PMC free article] [PubMed] [Google Scholar]