

Abstract
Rationale: Uncontrolled inflammatory innate response and impaired adaptive immune response are associated with clinical severity in patients with coronavirus disease (COVID-19).
Objectives: To compare the immunopathology of COVID-19 acute respiratory distress syndrome (ARDS) with that of non–COVID-19 ARDS, and to identify biomarkers associated with mortality in patients with COVID-19 ARDS.
Methods: Prospective observational monocenter study. Immunocompetent patients diagnosed with RT-PCR–confirmed severe acute respiratory syndrome coronavirus 2 (SARS-CoV-2) infection and ARDS admitted between March 8 and March 30, 2020, were included and compared with patients with non–COVID-19 ARDS. The primary clinical endpoint of the study was mortality at Day 28. Flow cytometry analyses and serum cytokine measurements were performed at Days 1–2 and 4–6 of ICU admission.
Measurements and Main Results: As compared with patients with non–COVID-19 ARDS (n = 36), those with COVID-19 (n = 38) were not significantly different regarding age, sex, and Sequential Organ Failure Assessment and Simplified Acute Physiology Score II scores but exhibited a higher Day-28 mortality (34% vs. 11%, P = 0.030). Patients with COVID-19 showed profound and sustained T CD4+ (P = 0.002), CD8+ (P < 0.0001), and B (P < 0.0001) lymphopenia, higher HLA-DR expression on monocytes (P < 0.001) and higher serum concentrations of EGF (epithelial growth factor), GM-CSF, IL-10, CCL2/MCP-1, CCL3/MIP-1a, CXCL10/IP-10, CCL5/RANTES, and CCL20/MIP-3a. After adjusting on age and Sequential Organ Failure Assessment, serum CXCL10/IP-10 (P = 0.047) and GM-CSF (P = 0.050) were higher and nasopharyngeal RT-PCR cycle threshold values lower (P = 0.010) in patients with COVID-19 who were dead at Day 28.
Conclusions: Profound global lymphopenia and a “chemokine signature” were observed in COVID-19 ARDS. Increased serum concentrations of CXCL10/IP-10 and GM-CSF, together with higher nasopharyngeal SARS-CoV-2 viral load, were associated with Day-28 mortality.
Keywords: SARS-CoV-2, COVID-19, ARDS, chemokines, cytokines
At a Glance Commentary
Scientific Knowledge on the Subject
Severe acute respiratory syndrome coronavirus 2 (SARS-CoV-2) infections leading to coronavirus disease (COVID-19) and acute respiratory distress syndrome (ARDS) are associated with high mortality and prolonged durations of ICU stay. Profound lymphopenia and elevated serum levels of proinflammatory cytokines, also characterized as cytokine storm, have been associated with clinical severity. However, few data compared the immunopathology of COVID-19 ARDS with that of non–COVID-19 ARDS, so specific traits of the immune responses to severe SARS-CoV-2 infections have not been well identified.
What This Study Adds to the Field
Patients with COVID-19 ARDS showed a phenotype of impaired adaptive immune response with profound lymphopenia and impaired/delayed lymphocyte activation. We also report a “chemokine signature” with increased serum concentrations of IP-10 and GM-CSF in patients with COVID-19. Serum concentrations of IP-10 and GM-CSF and nasopharyngeal viral loads were associated with outcomes in patients with COVID-19. Such results highlight the contribution of myeloid cells and impaired adaptive immune response with associated viral immune evasion to pathogenic inflammation during SARS-CoV-2 infection, suggesting that these could be potential targets for pharmacological manipulations.
The pandemic of coronavirus disease (COVID-19) caused by the novel severe acute respiratory syndrome coronavirus 2 (SARS-CoV-2) represents the greatest global public health crisis that occurred during the last decades. Among hospitalized patients, up to 42% will develop acute respiratory failure/acute respiratory distress syndrome (ARDS) and require ICU admission, with an in-ICU mortality rate of 52% in the recently published cohort of Wu and colleagues (1). The cornerstone of clinical treatment consists in supportive care, relying primarily on mechanical ventilation support and management of associated organ failures. Although a large number of interventional trials are ongoing, assessing the effect either of antivirals or of treatments that aim at mitigating the immunopathology of the infection, no therapeutic intervention has been approved for COVID-19 so far. Better understanding the pathophysiology of severe SARS-CoV-2 infection is thus a crucial step to better identify therapeutic interventions most likely to mitigate the course of the disease and to have an impact on patient outcomes.
SARS-CoV-2 infection seems to trigger peculiar innate and adaptative immune responses. Profound lymphopenia and increased neutrophil-to-lymphocyte ratio have been shown to be associated with clinical severity (2), and elevated serum levels of proinflammatory cytokines, also characterized as cytokine storm, have been reported as potential mediators of respiratory/multiple organ failure (3). Indeed, elevated levels of IL-6 were found to be associated with poor outcome in patients with COVID-19–associated ARDS (4). A pattern of immune dysregulation associating IL-6–mediated low HLA-DR (human leukocyte antigen D–related) expression on circulating monocytes, together with sustained lymphopenia and hyperinflammation, was recently put forward (5). Yet, few data compared the immunopathology of COVID-19 ARDS with that of non–COVID-19 ARDS, so specific traits of the immune responses to severe SARS-CoV-2 infections have not been well identified. Whether the magnitude of the so-called cytokine storm reported in severe SARS-CoV-2 infection exceeds that characterizing bacterial sepsis, for instance, has been challenged (6, 7), and a profound depletion of CD4+ and CD8+ T cells is also a common feature of septic shock (8).
We thus conducted a monocenter prospective study that aimed at 1) comparing the immunopathology of COVID-19 ARDS with that of non–COVID-19 ARDS and 2) identifying biomarkers associated with mortality in patients with COVID-19 ARDS. We show that major differences involving both the innate and the adaptive immune responses characterize severe SARS-CoV-2 infection.
Methods
Additional methods are available in the online supplement.
Study Design and Patients
This is a prospective observational monocenter study, which included all nonimmunocompromised patients diagnosed with RT-PCR–confirmed SARS-CoV-2 infection and ARDS (Berlin definition (9), COVID-19 ARDS group) consecutively admitted in the medical ICU at Henri Mondor Hospital, Créteil, France, between March 8, 2020, and March 30, 2020. Patients with pneumonia-associated ARDS previously included in a historical monocenter prospective cohort between January 2014 and December 2018 were used as controls (non–COVID-19 ARDS group; see the flow chart in Figure E1 in the online supplement) (10). The study has received the approbation of an institutional review board (Comité de Protection des Personnes Ile de France II; reference number: 3675-NI; and Comité de Protection des Personnes Ile de France V; reference number: 13899). Informed consent was obtained from all patients or their relatives.
Patients with ARDS received mechanical ventilation using a standardized protective ventilation strategy (11) and were managed according to national guidelines (12).
Data Collection
Demographics and clinical and laboratory variables were recorded upon ICU admission, at samples collection time points, and during ICU stay. The primary clinical endpoint of the study was Day-28 mortality.
Flow Cytometry Analyses
Blood samples were collected within 48 hours of ICU admission (Days 1–2 sample) and 4 days thereafter (Days 4–6 sample). Fresh whole blood was stained with different combinations of the following conjugated monoclonal antibodies: anti–CD4-PE, anti–CD3-AA750, anti–CD8-AA700, anti–CD38-PC5.5 or isotype control, anti-CD279 (PD-1)-PC7 or isotype control, anti–HLA-DR-PB or isotype control, anti–CD14-ECD, and CD45-Krome Orange (Beckman Coulter). Acquisition was performed on a 10-multicolor Navios flow cytometer and analyzed with the Kaluza 2.1 software (Beckman Coulter). Gating strategies are depicted in Figure E2.
Measurements of Serum Cytokine Concentrations
Cytokines concentrations were measured in serum inactivated for 20 minutes at 56°C (13) using Luminex multiplex bead-based technology (R&D Systems) and a Bio-Plex 200 instrument (BioRad), on serum diluted to 1/2.
SARS-CoV-2 Detection Genome in Nasopharyngeal Swabs
Nasopharyngeal swabs were processed for RNA extraction with the QIAsymphony platform. Real-time RT-PCR was performed using RealStar SARS-CoV-2 RT-PCR kit 1.0 (Altona) on a LightCycler 480 plate-based real-time PCR platform. The cycle threshold values of RT-PCR were used as indicators of the viral load of SARS-CoV-2 RNA in specimens.
Statistical Analyses
Descriptive results are presented as means (±SD) or medians (first–third quartiles) for continuous variables, and as numbers with percentages for categorical variables. Bivariate correlation analyses between cytokines and COVID-19 status were conducted by computing Spearman and biserial correlation coefficients for continuous–continuous and binary–continuous variable correlations, respectively.
Unadjusted between-groups comparisons between conditions (COVID-19 vs. non–COVID-19) and outcome (alive vs. dead at ICU Day 28) were performed using Mann-Whitney tests for continuous variables, and chi-square or Fisher’s exact tests for categorical variables, as appropriate. Association between cytokines, other covariates, and final outcome were further assessed after systematically adjusting for age and Sequential Organ Failure Assessment (SOFA) score, using logistic regression (categorical variables) and linear regression modeling (continuous variables). Longitudinal analyses were performed to assess the temporal evolution of cytokines levels over a 12-day period using mixed-effects linear regression models.
Two-tailed P values <0.05 were considered statistically significant. Analyses were performed using Stata V16.0 statistical software (StataCorp), and R 3.6.3 (R Foundation for Statistical Computing; corrplot and qgraph packages).
Results
Clinical Characteristics and Outcomes of Patients with COVID-19 ARDS and Non–COVID-19 ARDS
Thirty-eight patients were admitted in the ICU for severe SARS-CoV-2 infection and ARDS within the study period. As compared with patients with non–COVID-19 ARDS (n = 36), patients with COVID-19 did not show significant differences regarding age, sex, associated comorbidities except for more frequent obesity, severity scores (i.e., SOFA and Simplified Acute Physiology Score II), and invasive mechanical ventilation support upon ICU admission (Table 1). Yet, patients with COVID-19 had less severe ARDS than their non–COVID-19 counterparts, as reflected by Berlin definition categorization and higher values of PaO2/FiO2 obtained within 24 hours of ICU admission. In keeping with previous findings (2, 5), patients with COVID-19 showed more pronounced lymphopenia and monocytopenia, whereas those without COVID-19 had more blood neutrophils (Table 1). As expected, more bacterial and non–SARS-CoV-2 viral infections were documented in patients without COVID-19 upon ICU admission.
Table 1.
Characteristics of Patients with COVID-19 (n = 38) and Non–COVID-19 (n = 36) ARDS
| Variables | Available Data | COVID-19 ARDS (n = 38) | Non–COVID-19 ARDS (n = 36) | P Value |
|---|---|---|---|---|
| Demographics and comorbidities | ||||
| Age | 74 | 63 (50–72) | 58 (44–70) | 0.443 |
| Sex, M | 74 | 32 (84) | 28 (78) | 0.480 |
| BMI, kg/cm2 | 73 | 27.9 (25.6–32.7) | 26.7 (22.6–31.0) | 0.117 |
| Obesity | 74 | 13 (36) | 5 (14) | 0.029 |
| Diabetes mellitus | 74 | 12 (32) | 7 (19) | 0.232 |
| COPD | 74 | 5 (13) | 7 (19) | 0.463 |
| Chronic heart failure | 74 | 6 (16) | 7 (19) | 0.680 |
| Liver cirrhosis | 74 | 0 (0) | 2 (6) | 0.141 |
| Sickle cell disease | 74 | 1 (3) | 4 (11) | 0.143 |
| End-stage renal disease | 74 | 1 (3) | 0 (0) | 0.327 |
| Smoker | 74 | 15 (39) | 16 (44) | 0.665 |
| Patients’ characteristics upon ICU admission | ||||
| First symptom to admission*, d | 74 | 6 (3–8) | 3 (0–7) | 0.007 |
| SOFA | 74 | 9 (6–10) | 9 (6–11) | 0.483 |
| SAPS II | 74 | 38 (32–45) | 39 (31–54) | 0.808 |
| Invasive mechanical ventilation | 74 | 25 (66) | 20 (56) | 0.476 |
| Temperature | 72 | 38.0 (38.0–40.0) | 38.6 (37.8–39.6) | 0.634 |
| ARDS severity (Berlin) | 74 | 0.007 | ||
| Mild | 9 (24) | 1 (3) | ||
| Moderate | 18 (47) | 14 (39) | ||
| Severe | 11 (29) | 21 (58) | ||
| PaO2/FiO2 ratio, mm Hg | 74 | 125 (94–169) | 94 (72–129) | 0.025 |
| PaCO2, mm Hg | 74 | 40 (37–48) | 45 (38–51) | 0.168 |
| pH | 74 | 7.42 (7.32–7.45) | 7.36 (7.27–7.42) | 0.039 |
| Left ventricle ejection fraction, % | 74 | 61 (52–70) | 60 (50–60) | 0.030 |
| Arterial blood lactates, mM | 74 | 1.4 (1.2–1.9) | 1.4 (0.8–2.2) | 0.695 |
| Creatinine, μmol/L | 74 | 82 (66–120) | 87 (65–144) | 0.455 |
| Alanine aminotransferase, IU/L | 74 | 36 (22–47) | 45 (24–100) | 0.137 |
| Aspartate aminotransferase, IU/L | 74 | 51 (41–85) | 62 (29–145) | 0.552 |
| Bilirubin, μmol/L | 74 | 9 (7–11) | 14 (8–21) | 0.013 |
| Prothrombin time, % | 74 | 80 (72–87) | 77 (61–87) | 0.222 |
| WBC counts, 103/mm3 | 74 | 7.3 (5.6–9.8) | 12.8 (8.3–19.0) | <0.001 |
| Lymphocytes, 103/mm3 | 73 | 0.6 (0.5–0.9) | 0.9 (0.6–1.2) | 0.035 |
| Monocytes, 103/mm3 | 73 | 0.3 (0.2–0.4) | 0.7 (0.2–1.2) | 0.008 |
| Neutrophils, 103/mm3 | 73 | 6.4 (4.2–8.6) | 10.5 (7.2–16.2) | <0.001 |
| Neutrophils-to-lymphocytes ratio | 73 | 8.8 (5.5–15.2) | 11.1 (8.3–18.7) | 0.167 |
| Neuromuscular blockers | 74 | 24 (63) | 30 (83) | 0.051 |
| Prone position | 74 | 13 (34) | 13 (36) | 0.864 |
| Nitric oxide | 74 | 0 (0) | 2 (6) | 0.141 |
| ECMO | 74 | 0 (0) | 2 (6) | 0.141 |
| Vasopressor support | 74 | 22 (58) | 25 (69) | 0.302 |
| Microbiological documentation (other than SARS-CoV-2) | 74 | 9 (24) | 24 (67) | 0.0002 |
| Bacteria | ||||
| Gram positive | ||||
| Staphylococcus aureus | 1 | 1 | ||
| Streptococcus pneumoniae | 0 | 5 | ||
| Group A Streptococcus | 0 | 2 | ||
| Gram negative | ||||
| Enterobacteriaceae | 3 | 7 | ||
| Nonfermenting bacteria | 2 | 1 | ||
| Haemophilus influenzae | 0 | 2 | ||
| Intracellular pathogens | ||||
| Legionella pneumophila | 0 | 4 | ||
| Mycoplasma pneumonia | 0 | 2 | ||
| Virus (other than SARS-CoV-2) | 2 (5) | 11† (30) | 0.005 | |
| Influenza | 0 | 6‡ | ||
| Rhinovirus | 2 | 1 | ||
| Others | 0 | 4§ |
Definition of abbreviations: ARDS = acute respiratory distress syndrome; BMI = body mass index; COPD = chronic obstructive pulmonary disease; COVID-19 = coronavirus disease; ECMO = extracorporeal membrane oxygenation; SOFA = Sequential Organ Failure Assessment; SAPS II = Simplified Acute Physiology Score II; SARS-CoV-2 = severe acute respiratory syndrome coronavirus 2; WBC = white blood cell.
Continuous variables are presented as median (first–third quartiles); P values come from the Mann-Whitney test. Categorical variables are shown as n (%); P values come from the chi-square or the Fisher exact test, as appropriate. Bold results are statistically significant at the P < 0.05 level.
Time lag between the first symptoms of the disease and ICU admission.
Including three patients who had bacterial coinfections (group A Streptococcus, Streptococcus pneumoniae, and Enterobacter cloacae).
Influenza A(H1N1)pdm2009 (n = 4) and influenza B (n = 2).
Seasonal coronavirus (n = 1), adenovirus (n = 1), metapneumovirus (n = 1), and respiratory syncytial virus (n = 1).
Patients with COVID-19 ARDS showed dramatic outcome differences as compared with patients with non–COVID-19 ARDS, with significantly more frequent ventilator-acquired pneumonias, fewer organ failure–free days, and eventually higher Day-28 and ICU mortality (Table 2).
Table 2.
Outcomes of Patients with COVID-19 (n = 38) and Non–COVID-19 (n = 36) ARDS
| Variables | COVID-19 ARDS (n = 38) | Non–COVID-19 ARDS (n = 36) | P Value |
|---|---|---|---|
| First symptom to first sample*, d | 10 (7–12) | 7 (4–11) | 0.200 |
| First symptom to second sample†, d | 14 (9–15) | 11 (9–16) | 0.995 |
| Invasive mechanical ventilation | 37 (97) | 36 (100) | >0.99 |
| ICU admission to intubation‡, d | 0 (0–2) | 0 (0–2) | 0.492 |
| VAP | |||
| ≥1 VAP episode | 29 (76) | 15 (42) | 0.002 |
| Intubation to first VAP episode§, d | 8 (6–10) | 9 (5–11) | 0.794 |
| ≥2 VAP episodes | 19 (50) | 6 (17) | 0.002 |
| Intubation to second VAP episode‖, d | 14 (12–17) | 21 (11–24) | 0.176 |
| Other ICU-acquired infections | 6 (15.8) | 1 (2.8) | 0.108 |
| Catheter-related infection | 5 (13.1) | 1 (2.8) | — |
| Urinary tract infection | 1 (2.6) | 0 (0) | — |
| Shock dose steroids | 13 (36) | 12 (33) | 0.804 |
| Shock | 29 (76) | 25 (69) | 0.506 |
| Renal replacement therapy | 21 (55) | 15 (42) | 0.242 |
| ECMO | 10 (26) | 8 (22) | 0.682 |
| Organ failure–free days at Day 28, d | 0 (0–15) | 14 (0–20) | 0.003 |
| Day-28 mortality | 13 (34) | 4 (12) | 0.030 |
| ICU mortality | 14 (52) | 7 (19) | 0.007 |
Definition of abbreviations: ARDS = acute respiratory distress syndrome; COVID-19 = coronavirus disease; ECMO = extracorporeal membrane oxygenation; VAP = ventilator-associated pneumonia.
Continuous variables are presented as median (first–third quartiles); P values come from the Mann-Whitney test. Categorical variables are shown as n (%); P values come from the chi-square or the Fisher exact test, as appropriate. Bold results are statistically significant at the P < 0.05 level.
Time lag between the first symptom of the disease and the first sample drawn for flow cytometry analysis/cytokine measurements.
Time lag between the first symptom of the disease and the second sample drawn for flow cytometry analysis/cytokine measurements.
Time lag between ICU admission and orotracheal intubation.
Time lag between orotracheal intubation and the first episode of ventilator-associated pneumonia.
Time lag between orotracheal intubation and the second episode of ventilator-associated pneumonia.
Blood Lymphocyte Counts and CD38 and HLA-DR Expression Underline Distinct Immune Phenotype in Patients with and without COVID-19
Lymphopenia is a common feature in patients with severe COVID-19 and is associated with clinical severity and outcome (5, 14, 15). Although absolute T CD4+ lymphocyte counts were not significantly different between groups at Days 1–2, patients with COVID-19 showed lower counts than others at Days 4–6 (Figure 1A). Regarding T CD8+ and B-cell counts, patients with COVID-19 displayed deep and sustained lymphopenia with significantly lower values than those without COVID-19 at both time points (Figures 1B and 1C). Interestingly, patients with COVID-19 even displayed significantly lower B-cell counts than patients with non–COVID-19 ARDS diagnosed with viral pulmonary infections (Figure E3).
Figure 1.
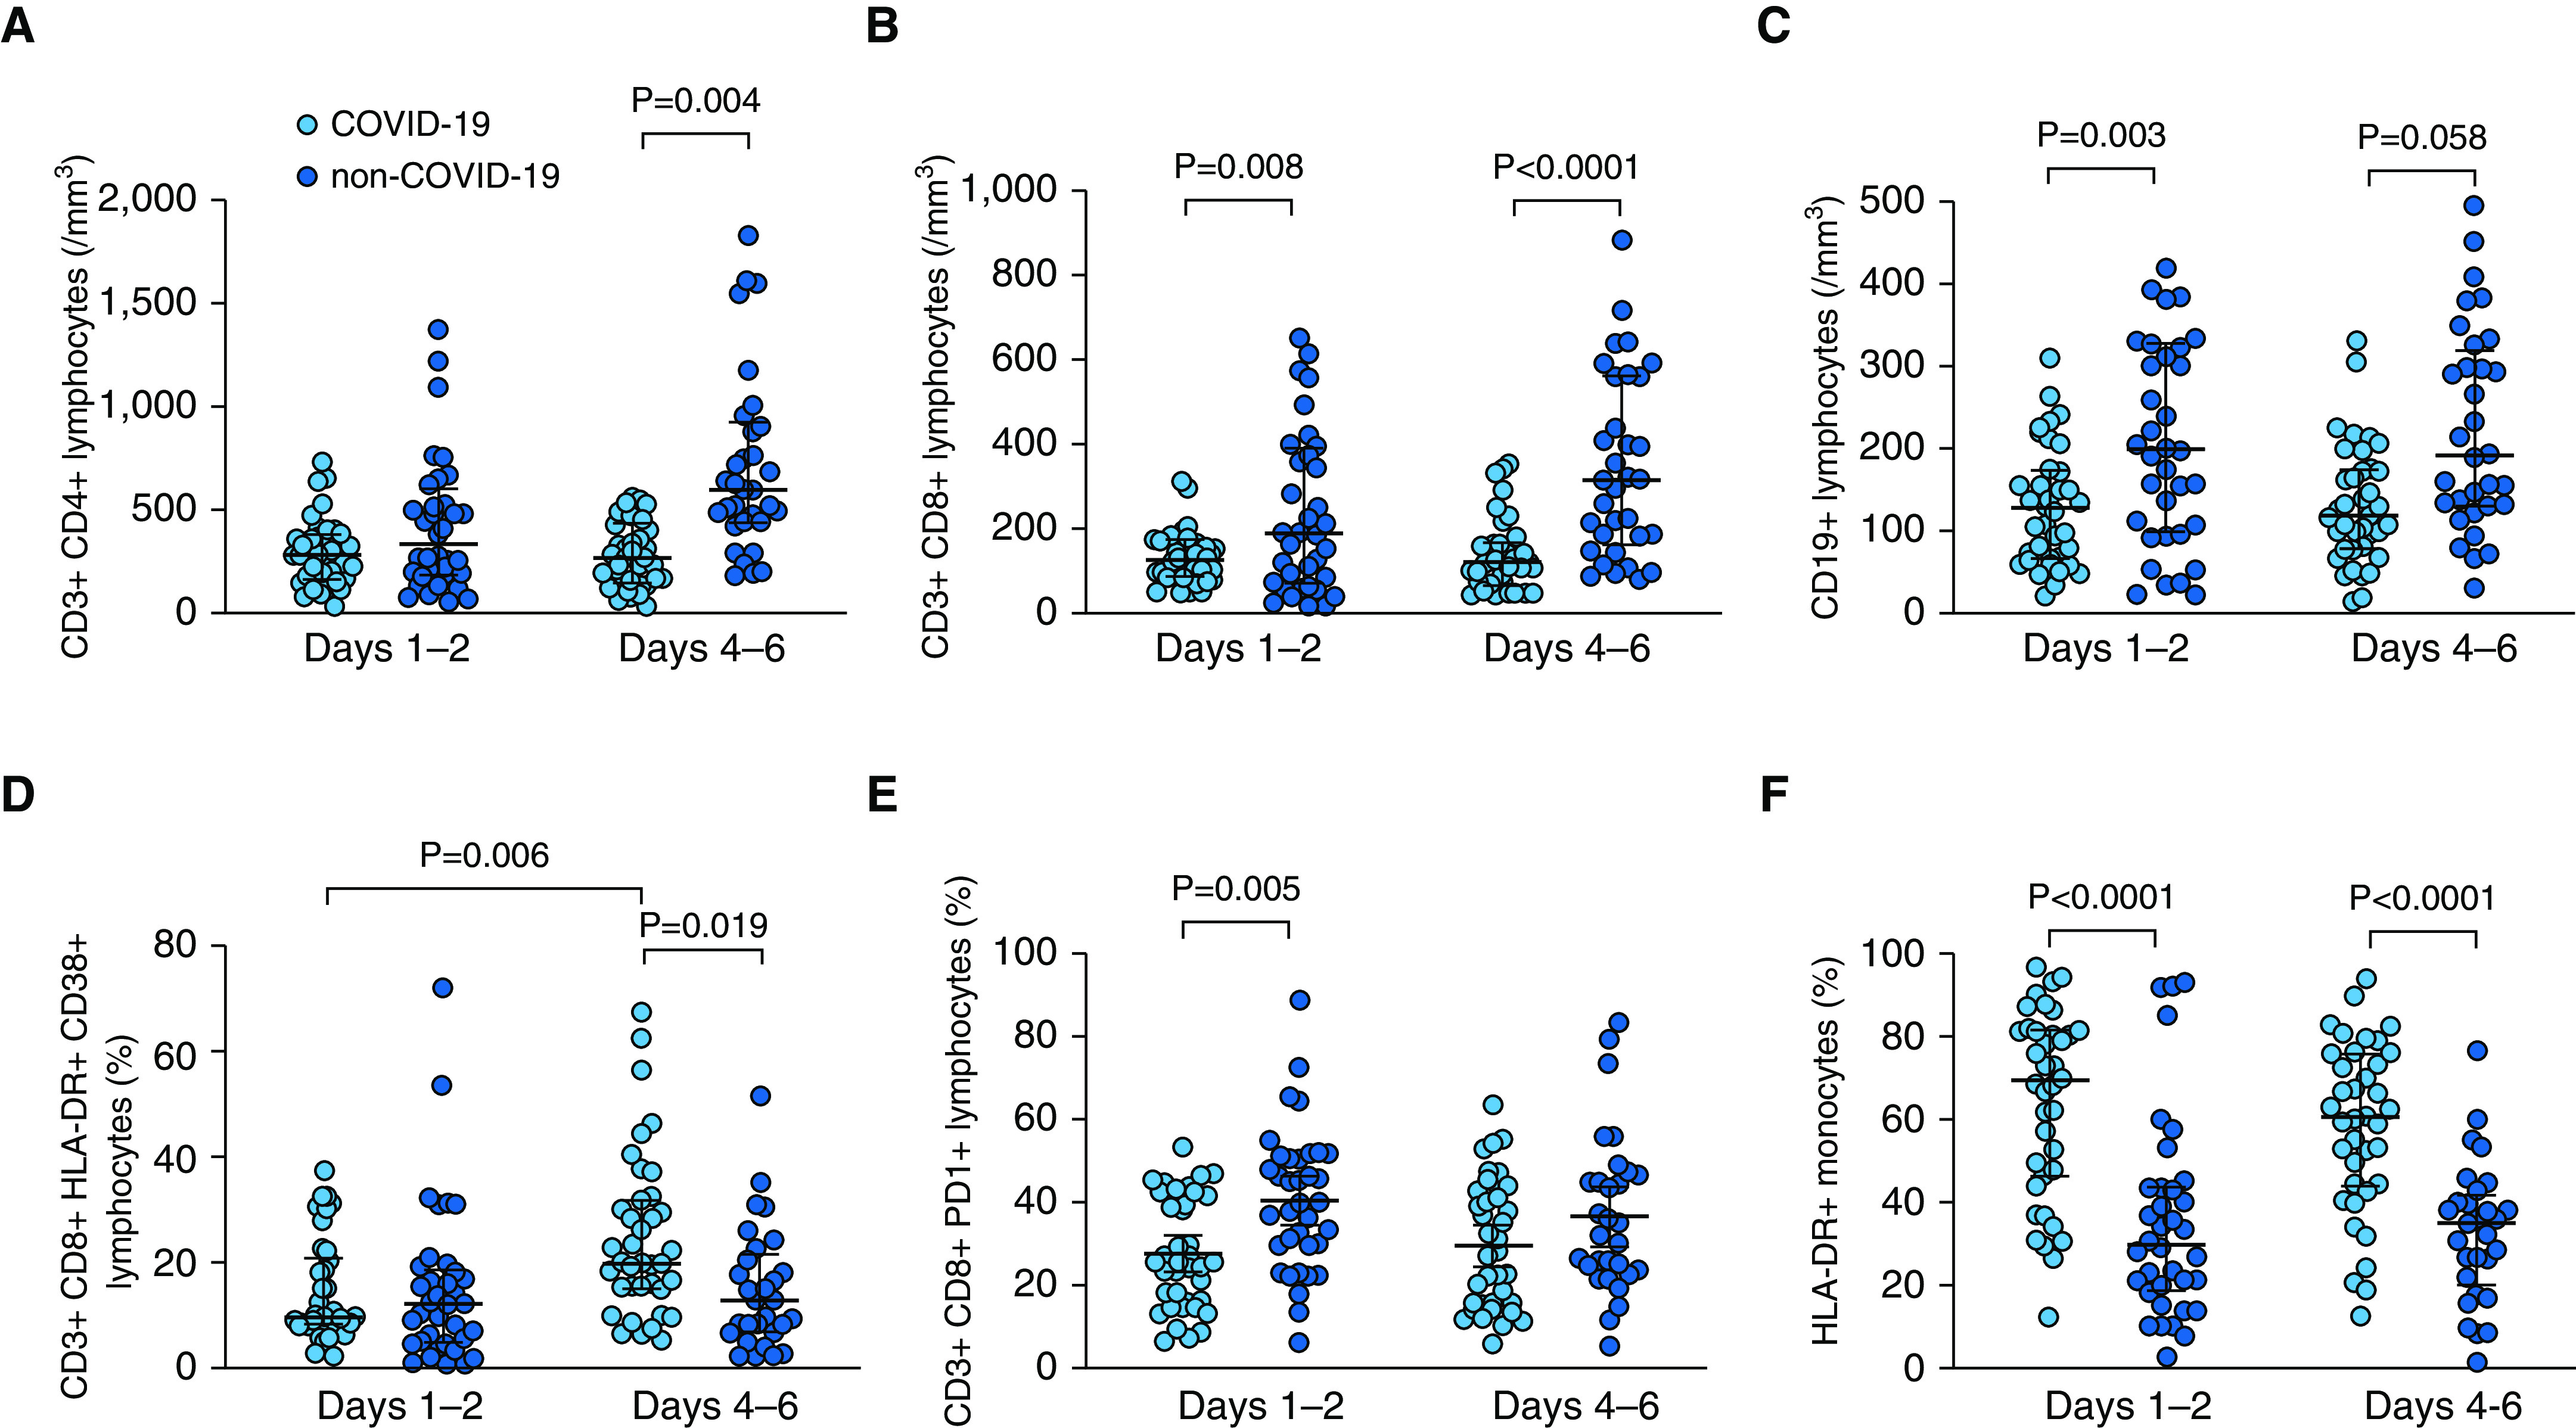
Flow cytometry analysis of lymphocyte subsets and monocytes in patients with (light blue) and without (dark blue) coronavirus disease (COVID-19) at Days 1–2 and Days 4–6 of ICU admission. (A) Blood T CD4+ lymphocyte counts; there was a significant effect of COVID-19 status (P = 0.002) but not of time point (P = 0.091) and no significant interaction (COVID-19 status × time point, P = 0.074) by two-way ANOVA. (B) Blood T CD8+ lymphocyte counts; there was a significant effect of COVID-19 status (P < 0.0001) but not of time point (P = 0.108) and no significant interaction (COVID-19 status × time point, P = 0.162) by two-way ANOVA. (C) Blood B (CD19+) lymphocyte counts; there was a significant effect of COVID-19 status (P < 0.0001) but not of time point (P = 0.578) and no significant interaction (COVID-19 status × time point, P = 0.540) by two-way ANOVA. (D) Percentage of T CD8+CD38+HLA-DR+ lymphocytes; there was a significant effect of COVID-19 status (P = 0.046) but not of time point (P = 0.025), with a significant interaction (COVID-19 status × time point, P = 0.024) by two-way ANOVA. (E) Percentage of T CD8+PD1+ lymphocytes; there was a significant effect of COVID-19 status (P < 0.001) but not of time point (P = 0.753) and no significant interaction (COVID-19 status × time point, P = 0.293) by two-way ANOVA. (F) Percentage of HLA-DR+ monocytes; there was a significant effect of COVID-19 status (P < 0.0001) but not of time point (P = 0.252) and no significant interaction (COVID-19 status × time point, P = 0.630) by two-way ANOVA. P values indicated on the figure come from the Sidak post hoc test.
The coexpression of CD38 and HLA-DR on CD8+ T cells, a hallmark of activation during viral infections (16, 17), was not significantly different between groups at Days 1–2 but increased in patients with COVID-19 with time and was eventually higher in patients with COVID-19 than in others at Days 4–6 (Figure 1D). PD-1 expression on CD8+ T cells, which has been shown to be associated with immune dysfunction and poor outcome in sepsis (18), was lower at Days 1–2 in patients with COVID-19 than in others (Figure 1E), with significantly lower PD-1 expression in patients with COVID-19 than in their non–COVID-19 viral ARDS counterparts (Figure E3). In line with this result, HLA-DR expression on monocytes was dramatically higher in patients with COVID-19 as compared with those without COVID-19 at both time points (Figure 1F). In fact, HLA-DR expression on monocytes was significantly lower in patients with viral (COVID-19 or not) ARDS than in those with bacterial or nondocumented ARDS (Figure E3).
Patients with and without COVID-19 Exhibit Different Profiles of Cytokine Storm
No significant differences were observed regarding the time course of serum concentrations of IL-6 and IL-1Ra between patients with and without COVID-19. However, the serum concentrations of these cytokines were significantly impacted by the time elapsed since hospital admission (Figure 2 and Table E1) or since first symptoms of disease onset (Figure E4 and Table E2). As such, the concentrations kept steady or increased with time for CCL4/MIP-1b, CCL20/MIP-3a, IL-15, and IL-8 in patients with COVID-19, whereas they decreased in others. The serum concentrations of IL-10, an antiinflammatory cytokine, were significantly higher in patients with COVID-19 than in others, with a decreasing time course, with significant interactions between time and COVID-19 status, indicating that the time course of this cytokine was different between groups.
Figure 2.
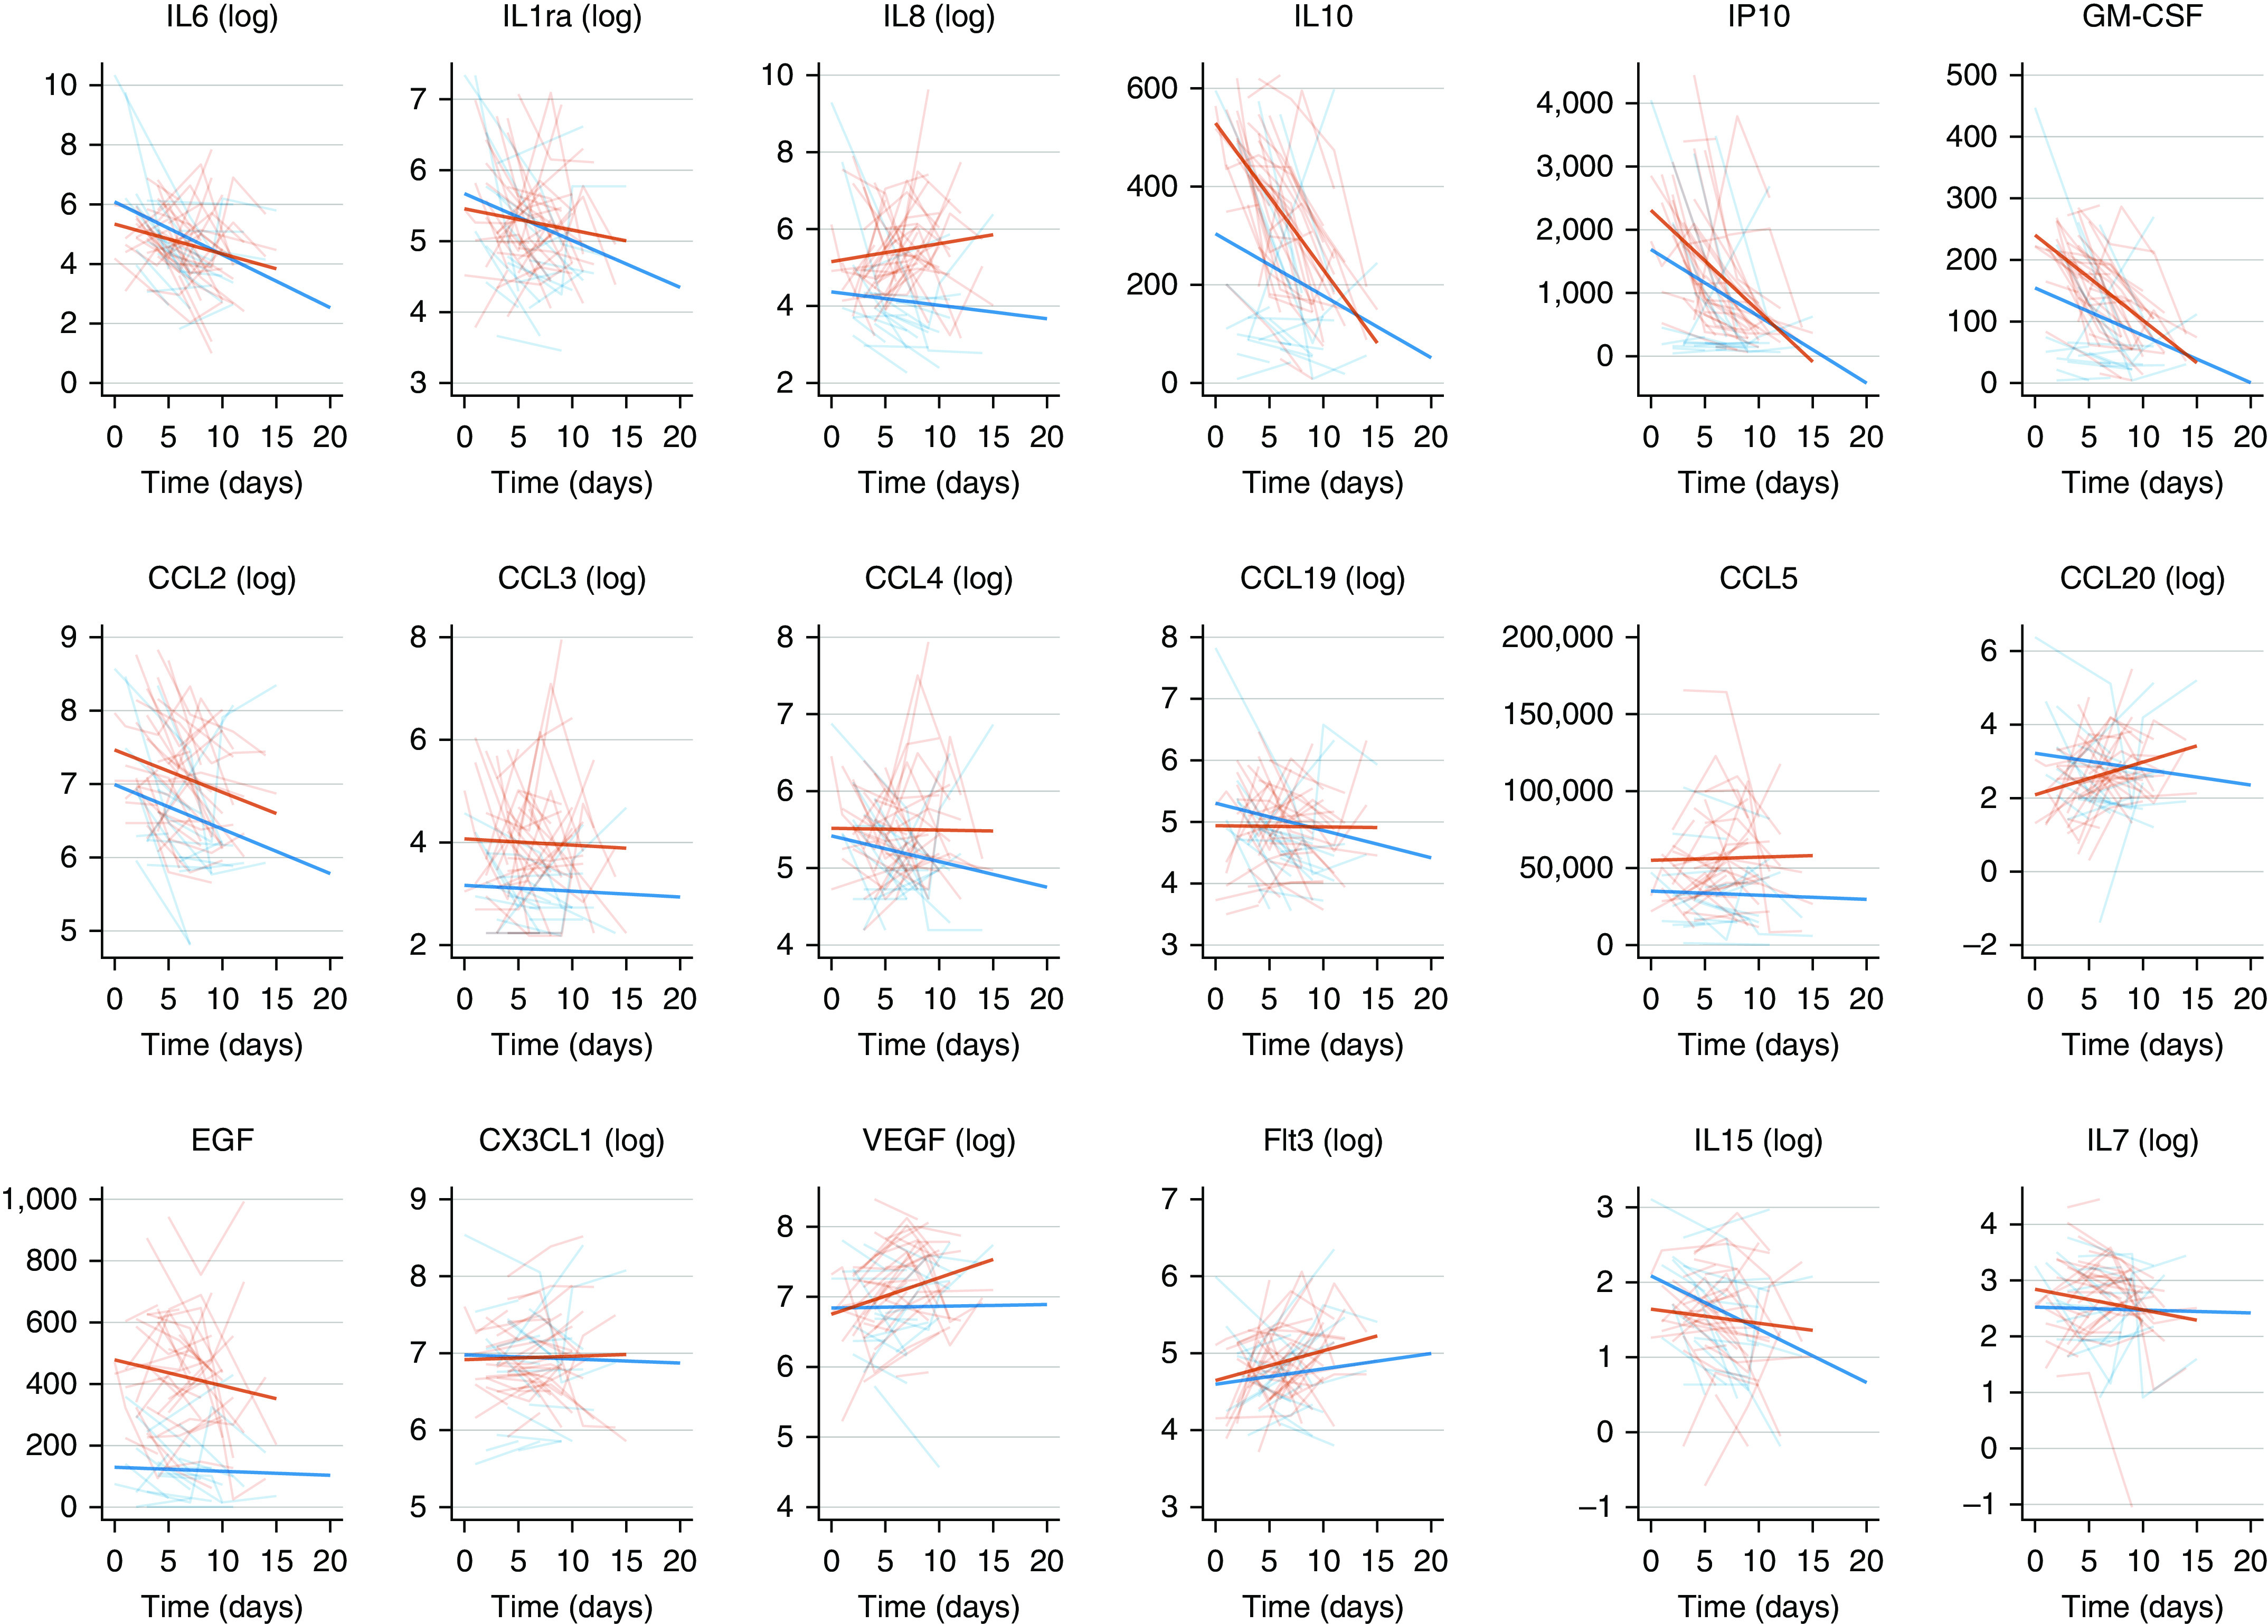
Evolution of serum concentrations of cytokines over time in patients with coronavirus disease (COVID-19) (thick red lines) and non–COVID-19 (thick blue lines) acute respiratory distress syndrome. The y-axis represents serum concentrations expressed in log ng/ml. Individual trajectories of patients with (thin red lines) and without (thin blue lines) COVID-19 are represented in the background. The x-axis represents the time elapsed since hospital admission (Day 0).
A chemokine response has been described in the respiratory tract of patients with SARS-CoV-2. We observed this “chemokine signature” in the blood of patients with COVID-19. Indeed, higher levels of CCL3/MIP-1a, CXCL10/IP-10, CCL5/RANTES, and CCL20/MIP-3a were measured in patients with COVID-19 than in their non–COVID-19 counterparts (Figures 2 and E3 and Tables E1 and E2). Interestingly, the concentrations of CCL19/MIP/3b, CCL20/MIP-3a, and CCL5/RANTES, which recruit monocytes and T cells, remained stable over time. These chemokines are secreted by CD14+CD16+ inflammatory monocytes, which are enriched in the blood of patients with COVID-19 with severe disease (19). In line with this observation, the serum concentrations of GM-CSF were significantly higher in patients with COVID-19 than in others. The serum concentrations of EGF (epithelial growth factor) were significantly higher in patients with COVID-19 than in others.
To distinguish features between non–COVID-19 bacterial or viral and COVID-19 ARDS, we analyzed cytokines concentrations according to these three categories (Table E3). Interestingly, there were dramatically lower serum concentrations of IL-10, CXCL10/IP-10, and GM-CSF in patients having bacterial/nondocumented ARDS than in patients with non–COVID-19 viral ARDS or COVID-19, suggesting that these are biomarkers of viral infections. In contrast, as compared with patients with COVID-19, those with bacterial, but also those with viral non–COVID-19 ARDS, tended to exhibit lower concentrations of CCL3/MIP-1a and showed dramatically lower concentrations of EGF. These results suggest that EGF and, to a lesser extent, CCL3/MIP-1a are specific to COVID-19 ARDS.
In all, two main cytokine clusters could be identified, as indicated by the strong correlation coefficients among them (Figures 3 and E5). The first one comprised CXCL10/IP-10, GM-CSF, and IL-10 and was related to COVID-19 ARDS. The second one comprised IL-6, IL-1Ra, CCL20/MIP-3a, CX3CL1, and IL-15 and was linked to SOFA, reflecting associated organ failures. No correlation was observed between serum cytokines concentrations and patients’ age.
Figure 3.

Correlation network between cytokines and coronavirus disease (COVID-19) status. The correlation network is constructed from all pairwise correlations between cytokines and the COVID-19 status, computing Spearman and biserial correlation coefficients for continuous–continuous and binary–continuous variables correlations, respectively. Variables are represented by nodes and connected by edges. Red and blue lines represent negative and positive correlations, respectively, with line width, color saturation, and variable proximity on the graph being proportional to the strength of the correlation. Shown edges are all based on statistically significant correlation coefficients at the P < 0.05 level after Benjamini-Hochberg correction for test multiplicity. SOFA = Sequential Organ Failure Assessment.
Immune Dysregulation and Higher Nasopharyngeal Viral Load Are Associated with Day-28 Mortality in Patients with COVID-19
We further analyzed whether serum cytokines concentrations and leukocytes numbers and phenotype were linked to fatal outcome. Serum concentrations of IL-10, CXCL10/IP-10, GM-CSF, and CX3CL1 were significantly higher in patients who had died at ICU Day 28 than in those who were still alive (Tables E4 and E5). In contrast, serum concentrations of EGF were higher in patients who survived. SARS-CoV-2 viral loads, quantified with the cycle threshold of RT-PCR performed on nasopharyngeal swabs, were also higher both upon ICU admission and during the course of ICU stay in patients who were dead at Day 28 (Tables 3 and E4 and Figure 4). After adjustment for age and SOFA, the serum concentrations of CXCL10/IP-10 and GM-CSF as well as SARS-CoV-2 viral loads remained significantly different between patients who died and those who were still alive (Tables 3 and E5). Such results are consistent with the fact that CXCL10/IP-10, GM-CSF, and IL-10 were highly correlated with COVID-19 ARDS but not with age and SOFA (Figures 3 and E5).
Table 3.
Variables Associated with Day-28 Mortality in Patients with COVID-19 (n = 38)
| Variables | Unadjusted Analysis |
Adjusted Analysis* |
||||
|---|---|---|---|---|---|---|
| Alive (n = 25) | Dead (n = 13) | P Value | Alive (n = 25) | Dead (n = 13) | P Value | |
| Clinical features (categorical variables) | n (%) | n (%) | Adjusted Odds Ratios (95% CI) |
|||
| Diabetes | 4 (16) | 8 (61) | 0.009 | 4.10 (0.67–25.00) |
0.126 | |
| COPD | 1 (4) | 4 (31) | 0.038 | 1.41 (0.09–21.49) |
0.805 | |
| Chronic heart failure | 1 (4) | 5 (38) | 0.012 | 13.12 (0.41–424.00) |
0.147 | |
| Clinical and general laboratory features (continuous variables) | Mean (±SD) | Mean (±SD) | Adjusted Mean (±SE) | Adjusted Mean (±SE) | ||
| Age, yr | 57.04 (±12.43) | 68.15 (±10.37) | 0.007 | 56.93 (±2.53) | 68.36 (±3.55) | 0.017 |
| SOFA | 7.0 (±2.8) | 9.8 (±2.6) | 0.017 | 7.1 (±0.6) | 9.9 (±0.8) | 0.013 |
| PaO2/FiO2 ratio, mm Hg | 121.2 (±58.6) | 361.3 (±761.0) | 0.036 | 128.8 (±101.1) | 356.0 (±145.2) | 0.243 |
| Creatinine, μmol/L | 85.6 (±34.6) | 210.4 (±287.4) | 0.093 | 94.6 (±38.3) | 191.3 (±55.0) | 0.191 |
| Serum cytokine concentrations† | ||||||
| IL-6, pg/ml (log) | 4.9 (±1.0) | 5.5 (±0.7) | 0.070 | 5.0 (±0.2) | 5. 6 (±0.3) | 0.168 |
| IL-10, pg/ml | 397.1 (±133.1) | 503.7 (±116.5) | 0.013 | 400. 0 (±29.9) | 502.2 (±46.0) | 0.093 |
| CXCL10/IP-10, pg/ml | 1,563.3 (±878.9) | 2,542.2 (±1,025.4) | 0.017 | 1,613.3 (±213.9) | 2,487.2 (±329.9) | 0.047 |
| GM-CSF, pg/ml | 179.1 (±60.6) | 232.8 (±52.9) | 0.005 | 179.1 (±13.6) | 234.2 (±21.0) | 0.050 |
| CCL19/MIP-3b, pg/ml (log) | 4.7 (±0.6) | 5.2 (±0.9) | 0.065 | 4.8 (±0.1) | 5.1 (±0.2) | 0.381 |
| CCL20/MIP-3a, pg/ml (log) | 2.0 (±0. 9) | 2.7 (±1.1) | 0.076 | 2.1 (±0.2) | 2.4 (±0.3) | 0.429 |
| EGF, pg/ml | 479.4 (±221.6) | 336.6 (±129.0) | 0.033 | 477.6 (±44.4) | 363.7 (±68.5) | 0.204 |
| CX3CL1/fractalkine, pg/ml (log) | 6.8 (±0.4) | 7.1 (±0.5) | 0.028 | 6.9 (±0.1) | 7.0 (±0.2) | 0.384 |
| Other laboratory features | ||||||
| qRT-PCR viral load‡, cycle threshold | 31.68 (±4.70) | 25.27 (±5.23) | 0.002 | 31.31 (±1.09) | 25.71 (±1.56) | 0.010 |
Definition of abbreviations: CI = confidence interval; COPD = chronic obstructive pulmonary disease; COVID-19 = coronavirus disease; SOFA = Sequential Organ Failure Assessment.
Bold results are statistically significant at the P < 0.05 level.
Results from linear regression modeling adjusting for age and SOFA score.
Missing data: n = 3.
Obtained from nasopharyngeal swabs.
Figure 4.

Severe acute respiratory syndrome coronavirus 2 (SARS-CoV-2) RT-PCR CT kinetics measured in nasopharyngeal swabs obtained at Days 1–2, Days 4–6, and Days 8–12 of ICU admission in Day-28 survivors (green circles, n = 25) and decedents (red circles, n = 13). Note that the y-axis is inverted so as to reflect that the RT-PCR CT is inversely correlated with RNA viral load. By two-way ANOVA with repeated measures, there was a significant effect of time (P = 0.002) of outcome (survivors vs. decedents, P = 0.0003) with no significant interaction (time × outcome, P = 0.831). P values indicated on the figure come from the Sidak’s multiple comparisons test. Circles represent median values, and error bars show the interquartile ranges. CT = cycle threshold.
Discussion
The main results of the current study, which compared the clinical characteristics and immune response of patients with COVID-19 ARDS with those of patients with non–COVID-19 ARDS, are as follows: 1) patients with COVID-19 ARDS had higher Day-28 mortality, although they had initially less severe ARDS, according to the Berlin definition categorization and PaO2/FiO2 ratio; 2) patients with COVID-19 ARDS displayed a peculiar immune phenotype characterized by profound and sustained lymphopenia with decreased or delayed expression of markers of cellular activation, together with features of monocyte activation; 3) comparing their cytokines/chemokines serum concentrations with those of patients with non–COVID-19 ARDS allowed for identifying a “chemokine signature”; and 4) patients with COVID-19 ARDS who were dead at Day 28 showed increased serum concentrations of IP-10 and GM-CSF together with higher nasopharyngeal viral load upon ICU admission.
Although patients with COVID-19 seemed to have less severe ARDS upon ICU admission than their non–COVID-19 counterparts, they eventually displayed dramatically higher Day-28 and ICU mortalities, implying profound differences regarding the mechanisms driving the course of the disease and orchestrating the severity of respiratory and other organ failures. Importantly, patients with previously known immunosuppression were excluded from both groups. The physiological basis for this morbidity is believed to be the selective death of type II pneumocytes following SARS-CoV-2 cell entry and subsequent innate immune response, which results in fluid leakage into the lungs and diffuse alveolar damage (20). After SARS-CoV-2 binds to angiotensin-converting enzyme-2–overexpressing organs, increases in nonspecific inflammation markers are observed. In more severe cases, a marked systemic release of inflammatory mediators and cytokines occurs, with corresponding worsening of lymphopenia and potential atrophy of lymphoid organs, impairing lymphocyte turnover (21). Our finding of profound/sustained lymphopenia observed in patients with COVID-19 ARDS is consistent with these observations. We also report more pronounced quantitative and qualitative immune cell alterations in patients with COVID-19 than in the subset of those without COVID-19 having viral (non–SARS-CoV-2) ARDS, including lower B-cell counts and frequency of PD-1+CD8+ lymphocytes, pointing out specific cellular immunity features of SARS-CoV-2 severe infections. In contrast, as recently reported (22, 23), HLA-DR expression on circulating monocytes was relatively conserved in patients with COVID-19 as compared with others, confirming that, as previously shown (24), this biomarker is relevant for bacterial sepsis but likely not for viral sepsis, including that related to SARS-CoV-2.
The identification of immunological biomarkers is a crucial issue in COVID-19 to better understand the pathophysiology of the disease and help clinicians delineate groups of patients with different outcomes. IL-6 and IL-1Ra were reported to be elevated in severe SARS-CoV-2 infection, and serum IL-6 levels have been proposed as a predictor of COVID-19 severity (25–27). Increased serum concentrations of IL-8, IL-10, and GM-CSF have also been associated with disease severity (2, 3). Strikingly, in our study, the serum concentrations of IL-6, IL-1Ra, and IL-8 not only showed no, or only marginally, significant differences between patients with COVID-19 and patients with non–COVID-19 ARDS but also were not associated with Day-28 mortality in the subgroup of patients with COVID-19. As a matter of fact, the serum concentrations of IL-6 and IL-1Ra correlated with the SOFA score, indicating that these cytokines rather behave as biomarkers of organ failure–associated hyperinflammation, consistent with their previously reported association with patient severity and outcome in cohort studies merging patients with mild to severe disease (2, 3, 26, 27), whereas only particularly sick patients were included in the current study. In patients with COVID-19, the time course of some serum biomarkers (i.e., IL-8, CCL20, VEGF) showed an increasing concentration over time, whereas there was an opposite trend in patients without COVID-19, illustrating a more intense, unresolving, inflammatory response during the early phase of disease, consistent with the prolonged durations of viral shedding (28) and ICU stay (29) reported in these patients. In line with this sustained inflammatory response, the “chemokine signature” (CCL3, CCL4, CCL19, and CLL5) remained stable over time. Nevertheless, the inclusion of a group of patients with non–COVID-19 ARDS in the current study allowed us to identify specific biomarkers of COVID-19 ARDS. Indeed, serum concentrations of EGF were strongly associated with COVID-19 (Figure 2), possibly reflecting the severity of acute lung injury but also SARS-CoV-2–associated injuries in peripheral organs, such as the ileum and the kidneys (30), as observed in patients with COVID-19. Strikingly, serum concentrations of EGF were higher in patients with COVID-19 than in those with non–SARS-CoV-2 viral ARDS, suggesting that EGF could be a relatively specific biomarker of SARS-CoV-2–associated tissue injury, which could be linked to the role of EGF in alveolar injury repair through binding to its receptors, including the human epidermal growth factor receptor family (31). Consistently, COVID-19 survivors exhibited higher serum EGF concentrations than others upon ICU admission. We also identified a group of chemokines/cytokines, including IP-10, IL-10, and GM-CSF, with serum concentrations that were not only highly correlated to COVID-19 but also associated with Day-28 mortality in patients with COVID-19 ARDS. Elevated serum levels of IP-10, IL-10, and GM-CSF have been associated with disease severity in patients with COVID-19 (3, 32). GM-CSF is involved in the production of proinflammatory cytokines and promotes leukocyte chemotaxis, further amplifying the inflammatory process; IP-10, through binding to chemokine receptor 3, activates and recruits leukocytes, including T cells and monocytes, and thus perpetuates inflammation, and IL-10 typically inhibits the secretion of proinflammatory cytokines and hampers the expression of the major histocompatibility complex and costimulatory molecules (33). Our finding of an IP-10, IL-10, and GM-CSF signature further highlights the contribution of myeloid cells to pathogenic inflammation during SARS-CoV-2 infection. An increased influx of innate immune cells into the lungs may fuel an autoinflammatory loop leading to tissue damage and respiratory failure (22). Indeed, the study by Liao and colleagues (34) and that of Zhou and colleagues (19) observed an infiltration of inflammatory monocytes with a strong interferon gene signature in the BAL fluid of patients with COVID-19 that likely contribute to the rapid decline in alveolar patency and further amplify acute lung injury. We also found a higher level of IP10, GM-CSF, and IL-10 in non–COVID-19 viral ARDS as compared with their bacterial counterparts, suggesting that these biomarkers are associated with severe viral ARDS.
The SARS-CoV-2 viral load measured in the respiratory tract has previously been shown to be associated with disease severity (28), possibly reflecting an impaired type I IFN response. Our finding that patients with COVID-19 had delayed increase in HLA-DR+CD38+CD8+ T lymphocytes and lower percentages of CD8+PD-1+ T lymphocytes than patients without COVID-19 is consistent with the lack of control of viral replication observed in the most severe patients (Figure 4). Indeed, the viral load obtained from nasopharyngeal samples was higher in patients who died than in those who survived, even after adjusting for age and SOFA score. Low CD8+ lymphocyte counts were recently shown to be predictors of mortality in patients with COVID-19 (26); more specifically, HLA-DR+CD38+CD8+ T lymphocytes have been shown to have a crucial role in response to viral infections (16, 17), and their increasing percentage over time has been associated with SARS-CoV-2 clearance and patient recovery (35). Yet, we failed to establish a significant relationship between adaptive immunity features (i.e., lymphocyte counts and activation status assessed by PD-1 and HLA-DR/CD38 expression) and outcomes of patients with COVID-19. However, consistent with previous findings (5, 33), patients with COVID-19 exhibited a global lymphopenia together with delayed (HLA-DR/CD38) or impaired (PD-1) activation of CD8+ lymphocytes, and higher nasopharyngeal viral loads in patients who were eventually dead at Day 28, suggesting a key role of adaptive immune response impairment in viral immune evasion.
Our study certainly has some limitations. This is a monocenter study, which included a relatively small number of patients, thus limiting the generalizability of the findings and the statistical power to show between-group differences. Indeed, our ability to identify outcome biomarkers was limited, particularly in the non–COVID-19 group owing to the low number of deaths at Day 28 (n = 4), and the results of the conducted analyses, some of which would lose statistical significance after accounting for multiple testing, should be considered exploratory and interpreted with caution. Our study only included those patients with the most severe COVID-19 (i.e., those admitted in the ICU for acute respiratory failure), as illustrated by a 52% ICU mortality, restricting our findings to this subset of patients. Yet, we believe our study also has some strengths, including the fact that we compared COVID-19 with non–COVID-19 ARDS together with the fact that we excluded patients with previously known immunosuppression in both groups, allowing us to identify biomarkers specifically associated with SARS-CoV-2 infection. Importantly, although the two groups of patients were managed during different time periods (i.e., between 2014 and 2018 for patients with non–COVID-19 ARDS and March 2020 for patients with COVID-19), routine management followed national guidelines and, notably, the mechanical ventilation strategy applied and the indications for ARDS adjuvant therapies did not vary significantly over time.
Conclusions
We reported adaptive immune response impairment and a “chemokine signature” in patients with SARS-CoV-2 infection and showed that increased serum concentrations of IP-10 and GM-CSF and higher nasopharyngeal viral loads were associated with outcomes. Such results highlight the contribution of myeloid cells and impaired adaptive immune response with associated viral immune evasion to pathogenic inflammation during SARS-CoV-2 infection.
Supplementary Material
Acknowledgments
Acknowledgment
The authors thank Franck Delafond, Nathalie Crosner, and Lily Wan for performing flow cytometry analyses; Dr. Jean Hazebrouck for helping collect clinical data; and the nurses of the medical ICU, Henri Mondor Hospital, for their help in processing patients’ samples.
Footnotes
Supported by the 2013 Clinical Research Grant of the French Intensive Care Society.
Author Contributions: S.H., A.B.-F., E.A., and N.d.P. conceptualized and designed the study, supervised and analyzed the data, wrote the manuscript, and gave approval of the final version to be submitted. S.H., A.B.-F., and M.S. performed lab experiments, reviewed the manuscript, and gave approval of the final version to be submitted. I.B., T.F., and S.R. collected the clinical data, reviewed the manuscript, and gave approval of the final version to be submitted. S.F., K.R., M.-H.D.-L., G.C., and A.M.-D. reviewed the manuscript and gave approval of the final version to be submitted.
This article has an online supplement, which is accessible from this issue’s table of contents at www.atsjournals.org.
Originally Published in Press as DOI: 10.1164/rccm.202005-1885OC on August 31, 2020
Author disclosures are available with the text of this article at www.atsjournals.org.
References
- 1.Wu C, Chen X, Cai Y, Xia J, Zhou X, Xu S, et al. Risk factors associated with acute respiratory distress syndrome and death in patients with coronavirus disease 2019 pneumonia in Wuhan, China. JAMA Intern Med. 2020;180:1–11. doi: 10.1001/jamainternmed.2020.0994. [DOI] [PMC free article] [PubMed] [Google Scholar]
- 2.Qin C, Zhou L, Hu Z, Zhang S, Yang S, Tao Y, et al. Dysregulation of immune response in patients with coronavirus 2019 (COVID-19) in Wuhan, China. Clin Infect Dis. 2020;71:762–768. doi: 10.1093/cid/ciaa248. [DOI] [PMC free article] [PubMed] [Google Scholar]
- 3.Huang C, Wang Y, Li X, Ren L, Zhao J, Hu Y, et al. Clinical features of patients infected with 2019 novel coronavirus in Wuhan, China. Lancet. 2020;395:497–506. doi: 10.1016/S0140-6736(20)30183-5. [DOI] [PMC free article] [PubMed] [Google Scholar]
- 4.Ruan Q, Yang K, Wang W, Jiang L, Song J. Clinical predictors of mortality due to COVID-19 based on an analysis of data of 150 patients from Wuhan, China. Intensive Care Med. 2020;46:846–848. doi: 10.1007/s00134-020-05991-x. [DOI] [PMC free article] [PubMed] [Google Scholar]
- 5.Giamarellos-Bourboulis EJ, Netea MG, Rovina N, Akinosoglou K, Antoniadou A, Antonakos N, et al. Complex immune dysregulation in COVID-19 patients with severe respiratory failure. Cell Host Microbe. 2020;27:992–1000, e3. doi: 10.1016/j.chom.2020.04.009. [DOI] [PMC free article] [PubMed] [Google Scholar]
- 6.Leisman DE, Deutschman CS, Legrand M. Facing COVID-19 in the ICU: vascular dysfunction, thrombosis, and dysregulated inflammation. Intensive Care Med. 2020;46:1105–1108. doi: 10.1007/s00134-020-06059-6. [DOI] [PMC free article] [PubMed] [Google Scholar]
- 7.Remy KE, Brakenridge SC, Francois B, Daix T, Deutschman CS, Monneret G, et al. Immunotherapies for COVID-19: lessons learned from sepsis. Lancet. [online ahead of print] 28 Apr 2020; DOI: 10.1016/S2213-2600(20)30217-4. [DOI] [PMC free article] [PubMed]
- 8.Francois B, Jeannet R, Daix T, Walton AH, Shotwell MS, Unsinger J, et al. Interleukin-7 restores lymphocytes in septic shock: the IRIS-7 randomized clinical trial. JCI Insight. 2018;3:e98960. doi: 10.1172/jci.insight.98960. [DOI] [PMC free article] [PubMed] [Google Scholar]
- 9.Ranieri VM, Rubenfeld GD, Thompson BT, Ferguson ND, Caldwell E, Fan E, et al. ARDS Definition Task Force. Acute respiratory distress syndrome: the Berlin Definition. JAMA. 2012;307:2526–2533. doi: 10.1001/jama.2012.5669. [DOI] [PubMed] [Google Scholar]
- 10.Bendib I, de Chaisemartin L, Granger V, Schlemmer F, Maitre B, Hüe S, et al. Neutrophil extracellular traps are elevated in patients with pneumonia-related acute respiratory distress syndrome. Anesthesiology. 2019;130:581–591. doi: 10.1097/ALN.0000000000002619. [DOI] [PubMed] [Google Scholar]
- 11.Mercat A, Richard J-CM, Vielle B, Jaber S, Osman D, Diehl J-L, et al. Expiratory Pressure (Express) Study Group. Positive end-expiratory pressure setting in adults with acute lung injury and acute respiratory distress syndrome: a randomized controlled trial. JAMA. 2008;299:646–655. doi: 10.1001/jama.299.6.646. [DOI] [PubMed] [Google Scholar]
- 12.Papazian L, Aubron C, Brochard L, Chiche J-D, Combes A, Dreyfuss D, et al. Formal guidelines: management of acute respiratory distress syndrome. Ann Intensive Care. 2019;9:69. doi: 10.1186/s13613-019-0540-9. [DOI] [PMC free article] [PubMed] [Google Scholar]
- 13.Darnell MER, Taylor DR. Evaluation of inactivation methods for severe acute respiratory syndrome coronavirus in noncellular blood products. Transfusion. 2006;46:1770–1777. doi: 10.1111/j.1537-2995.2006.00976.x. [DOI] [PMC free article] [PubMed] [Google Scholar]
- 14.Wang F, Nie J, Wang H, Zhao Q, Xiong Y, Deng L, et al. Characteristics of peripheral lymphocyte subset alteration in COVID-19 pneumonia. J Infect Dis. 2020;221:1762–1769. doi: 10.1093/infdis/jiaa150. [DOI] [PMC free article] [PubMed] [Google Scholar]
- 15.Du R-H, Liang L-R, Yang C-Q, Wang W, Cao T-Z, Li M, et al. Predictors of mortality for patients with COVID-19 pneumonia caused by SARS-CoV-2: a prospective cohort study. Eur Respir J. 2020;55:2000524. doi: 10.1183/13993003.00524-2020. [DOI] [PMC free article] [PubMed] [Google Scholar]
- 16.McElroy AK, Akondy RS, Davis CW, Ellebedy AH, Mehta AK, Kraft CS, et al. Human Ebola virus infection results in substantial immune activation. Proc Natl Acad Sci USA. 2015;112:4719–4724. doi: 10.1073/pnas.1502619112. [DOI] [PMC free article] [PubMed] [Google Scholar]
- 17.Ndhlovu ZM, Kamya P, Mewalal N, Kløverpris HN, Nkosi T, Pretorius K, et al. Magnitude and kinetics of CD8+ T cell activation during hyperacute HIV infection impact viral set point. Immunity. 2015;43:591–604. doi: 10.1016/j.immuni.2015.08.012. [DOI] [PMC free article] [PubMed] [Google Scholar]
- 18.Hotchkiss RS, Monneret G, Payen D. Sepsis-induced immunosuppression: from cellular dysfunctions to immunotherapy. Nat Rev Immunol. 2013;13:862–874. doi: 10.1038/nri3552. [DOI] [PMC free article] [PubMed] [Google Scholar]
- 19.Zhou Y, Fu B, Zheng X, Wang D, Zhao C, Qi Y, et al. Pathogenic T cells and inflammatory monocytes incite inflammatory storm in severe COVID-19 patients. Natl Sci Rev. doi: 10.1093/nsr/nwaa041. [online ahead of print] 13 Mar 2020; DOI: 10.1093/nsr/nwaa041. [DOI] [PMC free article] [PubMed] [Google Scholar]
- 20.Mason RJ. Pathogenesis of COVID-19 from a cell biology perspective. Eur Respir J. 2020;55:2000607. doi: 10.1183/13993003.00607-2020. [DOI] [PMC free article] [PubMed] [Google Scholar]
- 21.Terpos E, Ntanasis-Stathopoulos I, Elalamy I, Kastritis E, Sergentanis TN, Politou M, et al. Hematological findings and complications of COVID-19. Am J Hematol. 2020;95:834–847. doi: 10.1002/ajh.25829. [DOI] [PMC free article] [PubMed] [Google Scholar]
- 22.Jeannet R, Daix T, Formento R, Feuillard J, François B. Severe COVID-19 is associated with deep and sustained multifaceted cellular immunosuppression. Intensive Care Med. 2020;46:1769–1771. doi: 10.1007/s00134-020-06127-x. [DOI] [PMC free article] [PubMed] [Google Scholar]
- 23.Monneret G, Cour M, Viel S, Venet F, Argaud L. Coronavirus disease 2019 as a particular sepsis: a 2-week follow-up of standard immunological parameters in critically ill patients. Intensive Care Med. 2020;46:1764–1765. doi: 10.1007/s00134-020-06123-1. [DOI] [PMC free article] [PubMed] [Google Scholar]
- 24.Monneret G, Lepape A, Voirin N, Bohé J, Venet F, Debard A-L, et al. Persisting low monocyte human leukocyte antigen-DR expression predicts mortality in septic shock. Intensive Care Med. 2006;32:1175–1183. doi: 10.1007/s00134-006-0204-8. [DOI] [PubMed] [Google Scholar]
- 25.Wang C, Fei D, Li X, Zhao M, Yu K. IL-6 may be a good biomarker for earlier detection of COVID-19 progression. Intensive Care Med. 2020;46:1475–1476. doi: 10.1007/s00134-020-06065-8. [DOI] [PMC free article] [PubMed] [Google Scholar]
- 26.Luo M, Liu J, Jiang W, Yue S, Liu H, Wei S. IL-6 and with CD8+ T cell count early predict in-hospital mortality for patients with COVID-19. JCI Insight. 2020;5:e139024. doi: 10.1172/jci.insight.139024. [DOI] [PMC free article] [PubMed] [Google Scholar]
- 27.Valle DMD, Kim-schulze S, Hsin-hui H, Beckmann ND, Nirenberg S, Wang B, et al. An inflammatory cytokine signature helps predict COVID-19 severity and death [preprint] medRxiv. 2020. Available from: https://www.medrxiv.org/content/10.1101/2020.05.28.20115758v1.
- 28.Zheng S, Fan J, Yu F, Feng B, Lou B, Zou Q, et al. Viral load dynamics and disease severity in patients infected with SARS-CoV-2 in Zhejiang province, China, January-March 2020: retrospective cohort study. BMJ. 2020;369:m1443. doi: 10.1136/bmj.m1443. [DOI] [PMC free article] [PubMed] [Google Scholar]
- 29.Grasselli G, Zangrillo A, Zanella A, Antonelli M, Cabrini L, Castelli A, et al. COVID-19 Lombardy ICU Network. Baseline characteristics and outcomes of 1591 patients infected with SARS-CoV-2 admitted to ICUs of the Lombardy Region, Italy. JAMA. 2020;323:1574–1581. doi: 10.1001/jama.2020.5394. [DOI] [PMC free article] [PubMed] [Google Scholar]
- 30.Vabret N, Britton GJ, Gruber C, Hegde S, Kim J, Kuksin M, et al. Sinai Immunology Review Project. Immunology of COVID-19: current state of the science. Immunity. 2020;52:910–941. doi: 10.1016/j.immuni.2020.05.002. [DOI] [PMC free article] [PubMed] [Google Scholar]
- 31.Finigan JH, Downey GP, Kern JA. Human epidermal growth factor receptor signaling in acute lung injury. Am J Respir Cell Mol Biol. 2012;47:395–404. doi: 10.1165/rcmb.2012-0100TR. [DOI] [PMC free article] [PubMed] [Google Scholar]
- 32.Chi Y, Ge Y, Wu B, Zhang W, Wu T, Wen T, et al. Serum cytokine and chemokine profile in relation to the severity of coronavirus disease 2019 in China. J Infect Dis. 2020;222:746–754. doi: 10.1093/infdis/jiaa363. [DOI] [PMC free article] [PubMed] [Google Scholar]
- 33.Costela-Ruiz VJ, Illescas-Montes R, Puerta-Puerta JM, Ruiz C, Melguizo-Rodríguez L. SARS-CoV-2 infection: the role of cytokines in COVID-19 disease. Cytokine Growth Factor Rev. doi: 10.1016/j.cytogfr.2020.06.001. [online ahead of print] 2 Jun 2020; DOI: 10.1016/j.cytogfr.2020.06.001. [DOI] [PMC free article] [PubMed] [Google Scholar]
- 34.Liao M, Liu Y, Yuan J, Wen Y, Xu G, Zhao J, et al. Single-cell landscape of bronchoalveolar immune cells in patients with COVID-19. Nat Med. 2020;26:842–844. doi: 10.1038/s41591-020-0901-9. [DOI] [PubMed] [Google Scholar]
- 35.Thevarajan I, Nguyen THO, Koutsakos M, Druce J, Caly L, van de Sandt CE, et al. Breadth of concomitant immune responses prior to patient recovery: a case report of non-severe COVID-19. Nat Med. 2020;26:453–455. doi: 10.1038/s41591-020-0819-2. [DOI] [PMC free article] [PubMed] [Google Scholar]
Associated Data
This section collects any data citations, data availability statements, or supplementary materials included in this article.