

To gain insights into mechanisms underlying coagulopathy in malnutrition, we fed mice a low‐protein, low‐fat diet and assessed hepatic gene expression and plasma coagulation indices. Malnourished males were affected more profoundly than females, and exhibited coagulopathy, decreased expression of fibrinogen‐alpha and factor 11, decreased FXR activation, and decreased FXR binding to regulatory elements on these two coagulation factor genes. These findings are associated with profoundly depleted PPAR‐alpha protein, peroxisome loss, and decreased concentrations of FXR agonist bile acids in malnourished males but not females.
Abstract
Liver dysfunction, including coagulopathy, is a prominent feature of protein‐energy malnutrition. To identify mechanisms underlying malnutrition‐associated coagulopathy, we administered a low‐protein low‐fat diet to lactating dams and examined hepatic transcription and plasma coagulation parameters in young adult weanlings. Malnutrition impacted body composition to a greater extent in male versus female mice. Transcriptional profiles suggested opposing effects of nutrient‐sensing nuclear receptors, namely induction of peroxisome proliferator‐activated receptor α (PPARα) targets and repression of farnesoid‐X‐receptor (FXR) targets. Coagulopathy with decreased synthesis of fibrinogen‐α (FGA) and factor 11 (F11) was observed in malnourished male animals but not female animals. In primary mouse hepatocytes, FXR agonist increased and PPARα agonist decreased Fga and F11 messenger RNA expression. Nuclear receptor DNA response elements were identified in the Fga and F11 gene regulatory regions, and opposing effects of FXR and PPARα were confirmed with luciferase assays. Unexpectedly, hepatic PPARα protein was markedly depleted in malnourished male liver and was not enriched on Fga or F11 response elements. Rather, there was loss of FXR binding at these response elements. Reduced PPARα protein was associated with loss of hepatocyte peroxisomes, which are necessary for bile acid biosynthesis, and with decreased concentrations of bile acids that function as FXR ligands, most notably the FXR agonist chenodeoxycholic acid. Conclusion: Malnutrition impairs growth and liver synthetic function more severely in male mice than in female mice. Malnourished male mice are coagulopathic and exhibit decreased hepatocyte peroxisomes, FXR agonist bile acids, FXR binding on Fga and F11 gene regulatory elements, and coagulation factor synthesis. These effects are absent in female mice, which have low baseline levels of PPARα, suggesting that nutrient‐sensing nuclear receptors regulate coagulation factor synthesis in response to host nutritional status in a sex‐specific manner.
Abbreviations
- Abcb11/Bsep
adenosine triphosphate binding cassette subfamily B member 11/bile salt export pump
- Acot1
acyl‐coenzyme A thioesterase 1
- Acox1
acyl‐coenzyme A oxidase 1
- cDNA
complementary DNA
- ChIP
chromatin immunoprecipitation
- CoA
coenzyme A
- Cyp4a14
cytochrome P450, family 4, subfamily a, polypeptide 14
- DR
direct repeat
- DXA
dual‐energy X‐ray absorptiometry
- F11
coagulation factor 11
- FGA
fibrinogen‐α
- Fgf21
fibroblast growth factor 21
- FXR
farnesoid‐X‐receptor
- GAPDH
glyceraldehyde 3‐phosphate dehydrogenase
- INR
international normalized ratio
- IR
inverted repeat
- LPLFD
low‐protein low‐fat diet
- mRNA
messenger RNA
- Nr0b2/Shp
nuclear receptor subfamily 0 group B member 2/small heterodimer partner
- PCA
principal component analysis
- PMP70
peroxisomal membrane protein 70
- PPARα
peroxisome proliferator‐activated receptor α
- qPCR
real‐time quantitative polymerase chain reaction
- seq
sequencing
- Slc51b/Ostb
solute carrier family 51 subunit beta/organic solute transporter beta
Malnutrition remains one of the leading global health challenges, contributing to half of all child deaths. In developing countries, stunting is observed in 31% of children under 5 years of age.( 1 ) Child malnutrition is difficult to treat and carries a high mortality rate, in part due to liver pathophysiology, which includes synthetic function impairment and coagulopathy.( 2 ) Although coagulopathy in child malnutrition often is attributed to vitamin K deficiency, many cases of moderate to severe malnutrition are associated with decreased vitamin K‐independent coagulation factors or are refractory to intravenous vitamin K therapy. Mechanisms underlying malnutrition‐induced coagulopathy remain uncharacterized. Livers from malnourished adults( 3 , 4 ) and from our neonatal mouse model of malnutrition( 5 ) reveal increased autophagy, mirroring a key aspect of the acutely fasted state. Fasting induces autophagy by coordinate regulation of the nutrient‐sensing nuclear receptors farnesoid‐X‐receptor (FXR) and peroxisome proliferator‐activated receptor α (PPARα) competing for and binding to DNA regulatory elements on target genes.( 6 ) Thus, we hypothesized that coagulopathy in malnutrition could be regulated by FXR and PPARα through similar mechanisms.( 7 )
We sought to model malnutrition‐induced coagulopathy by administering to mice a low‐protein low‐fat diet (LPLFD) formulated to match the relative macronutrients consumed by children in low‐income regions of northeastern Brazil.( 8 ) We found that the LPLFD altered body composition to a greater extent in male mice compared to female mice. Malnourished male but not female mice were coagulopathic, with decreased expression of fibrinogen‐α (FGA) and coagulation factor 11 (F11). Although transcriptomic evidence revealed a potential role of PPARα induction and FXR signal loss, we found malnutrition to be associated with decreased FXR binding at the transcriptional start sites of Fga and F11. This loss of FXR activity in malnourished male mice was associated with decreased concentrations of bile acids, several of which function as FXR agonist ligands. These studies implicate decreased bile acid synthesis resulting in decreased FXR activity as a key event underlying malnutrition‐induced coagulopathy, which is sexually dimorphic.
Materials and Methods
Animal Studies
Wild‐type C57BL/6J mice (Jackson Laboratory) were maintained at the Baylor College of Medicine Center for Comparative Medicine in a temperature‐controlled 14:10‐hour light–dark room. Dams with 8‐day‐old pups were randomized to receive an irradiated purified control diet (15% fat, 20% protein, 65% carbohydrate) or an isocaloric LPLFD (5% fat, 7% protein, 88% carbohydrate; #D09051102 and #D09081701B; Research Diets, New Brunswick, NJ) to induce malnutrition.( 8 ) On day‐of‐life 21, pups were weaned to their dams’ diet for another 5 weeks. At 8 weeks of life, mice were lightly anesthetized with isoflurane. Body lengths were measured from nose to tail base, and standard dual‐energy X‐ray absorptiometry (DXA) body composition analyses were performed in an UltraFocus DXA (Faxitron, Tucson, AZ). After euthanization with 2 minutes of CO2 inhalation, plasma was collected by cardiac puncture into syringes prefilled with 0.9% sodium citrate. Liver lobes then were harvested. All animal experiments were conducted in accordance with the Baylor College of Medicine Institutional Animal Care and Use Committee guidelines. Plasma international normalized ratio (INR) was measured in the Texas Children’s Hospital Clinical Chemistry Laboratory.
RNA Purification and Transcriptional Profiling
To broadly analyze transcriptional changes with RNA sequencing (RNA‐seq), total RNA was isolated from 30‐50 mg frozen liver tissue and treated with deoxyribonuclease using RNeasy Mini Kit (Qiagen, Germantown, MD). RNA integrity was confirmed with a 2100 Bioanalyzer Instrument (Agilent Technologies, Santa Clara, CA). Transcripts were identified using stranded, paired‐end, 100‐base pair sequencing to a depth of 22 million reads per sample on a HiSeq 2500 (Illumina, San Diego, CA) in the Baylor College of Medicine Genomic and RNA Profiling Core. The RNA‐seq bioinformatics pipeline, which defined differential gene expression and enriched biological pathways, is described in detail in the Supporting Materials and Methods. RNA‐seq data were deposited in the National Center for Biotechnology Information’s Gene Expression Omnibus (GEO)( 9 ) and are accessible through GEO Series accession number GSE156856. Alternatively, for real‐time quantitative polymerase chain reaction (qPCR), total RNA was isolated from 30‐50 mg liver or cultured hepatocytes using TRIzol Reagent (Invitrogen, Carlsbad, CA) and quantified with a NanoDrop 2000c spectrophotometer (Thermo Fisher Scientific, Waltham, MA). Complementary DNA (cDNA) was synthesized from 1 μg RNA using amfiRivert cDNA Synthesis Platinum Master Mix (GenDEPOT, Inc. Katy, TX). SYBR Green PCR Master Mix (Thermo Fisher Scientific) was used on a StepOnePlus Real‐Time PCR System (Applied Biosystems, Foster City, CA). Relative expression levels to β‐actin or glyceraldehyde 3‐phosphate dehydrogenase (GAPDH) were calculated by the comparative cycle threshold (ΔΔCt) method. All primer sequences are listed in Supporting Table S1.
Plasma Proteome Profiling
Procedures for liquid chromatography‐tandem mass spectrometry were recently described in detail.( 10 ) Briefly, after depletion of albumin and immunoglobulin with Proteome Purify 2 Mouse Serum Protein Immunodepletion Resin (R&D Systems, Minneapolis, MN), samples were denatured and trypsinized on an S‐Trap (ProtiFi, Farmingdale, NY) system. Digested peptides were eluted and desalted with a C18‐stage tip, separated by an nLC‐1000 chromatograph, and applied to a Q‐Exactive Plus Orbitrap Mass Spectrometer (Thermo Fisher Scientific). The resulting spectra were searched against the target‐decoy Mouse Reference Sequence database in Proteome Discoverer 1.4 (Thermo Fisher Scientific) using the Mascot 2.4 algorithm (Matrix Science, Boston, MA). Relative amounts of peptide were calculated with the intensity‐based absolute quantification algorithm and normalized to the intensity‐based fraction of the total. These data were analyzed in the context of pathways and diseases obtained from the Kyoto Encyclopedia of Genes and Genomes database. Differentially expressed peptides were identified with a threshold of P < 0.1 and a log fold change of expression with absolute value ≥0.585.
Western Blot Analysis
To determine the relative concentrations of plasma proteins, samples were thawed and diluted with radio immunoprecipitation assay (RIPA) buffer (Thermo Fisher Scientific) supplemented with protease and phosphatase inhibitors. Alternatively, liver tissue was homogenized in RIPA buffer. From 20 to 50 μg of diluted plasma or liver lysate was loaded on NuPAGE 4%‐20% Bis‐Tris precast gels (Thermo Fisher Scientific) and transferred onto polyvinylidene fluoride transfer membranes (Thermo Fisher Scientific). Primary antibodies to FGA (#sc‐398806; Santa Cruz Biotechnology, Dallas, TX), F11 (#sc‐365996; Santa Cruz Biotechnology), PPARα (#PA5‐85125; Thermo Fisher Scientific), FXR (#ab85606; Abcam, Cambridge, United Kingdom), or peroxisomal membrane protein 70 (PMP70) (#PA1‐650; Thermo Fisher Scientific) were applied, with GAPDH (#14C10; Cell Signaling Technology, Danvers, MA) serving as a housekeeping protein for liver samples. For plasma samples, total protein staining was performed using Ponceau S Staining Solution (Cell Signaling Technology). Horseradish peroxidase‐conjugated secondary antibodies were applied, and protein was visualized with Chemiluminescent Substrate (Thermo Fisher Scientific) on the Amersham Imager 600 (GE Healthcare Life Sciences, Marlborough, MA).
Primary Hepatocyte Culture
Hepatocytes were isolated as described( 6 ) from 8‐week‐old male C57BL/6J mice maintained on standard chow. Isolated cells were washed twice with hepatocyte wash media and then seeded in 12‐well plates with Williams’ E medium (Invitrogen) supplemented with 10% fetal bovine serum, 1% penicillin/streptomycin, insulin‐transferrin‐selenium, and GlutaMAX (Invitrogen). The cell‐culture media was changed after 6 hours; then, 20 μM WY‐14643 (Tocris Bioscience, Bristol, United Kingdom), 5 μM GW4064 (Tocris Bioscience), or both reagents were applied for 12 hours, after which RNA was isolated for qPCR analysis, as described above.
Molecular Cloning and Cell‐Based Reporter Assays
Oligonucleotides encompassing three copies of inverted repeat (IR)‐1 motifs found in mouse Fga or F11 enhancer regions (Supporting Table S2) were cloned into luciferase reporter vectors, and transient transfections were performed using 150‐ng reporter constructs and 100‐ng pCMX‐mouse PPARα plasmid, pCMX‐human FXR plasmid, or cytomegalovirus‐β‐galactosidase plasmid as an internal control, as described.( 6 ) Modifications and additional experimental details are presented in the Supporting Materials and Methods.
Chromatin Immunoprecipitation Assays
Partially purified nuclear fractions were prepared as described,( 11 ) and chromatin immunoprecipitation (ChIP) was performed( 6 ) using 2.5 μg monoclonal anti‐FXR (#A9033A; Thermo Fisher Scientific), 10 μg monoclonal anti‐PPARα (#MA1‐822; Thermo Fisher Scientific), or 2.5 or 10 μg, respectively, of mouse immunoglobulin G (IgG) (#12‐371; Millipore, Burlington, MA). Samples were washed and reverse cross‐linked. Purified DNA was used for qPCR analyses using primer sequences listed in Supporting Table S3. Data are presented as fold enrichment relative to IgG control and normalized to control mice. Additional experimental details are provided in the Supporting Materials and Methods.
Bile Acid Analysis
Extractions were prepared from plasma, liver, or stool with aqueous methanol and injected into an ultra‐high‐performance liquid chromatograph coupled with a Q‐Exactive Orbitrap Mass Spectrometer (Thermo Fisher Scientific) in negative mode with electrospray ionization. Data were acquired and processed with Xcalibur software (Thermo Fisher Scientific), with m/z ranging from 80‐1,200 Da. Bile acids were identified by comparison with the exact masses and retention times of the corresponding standards. Peak areas were calculated with Genesis. Details are provided in the Supporting Materials and Methods.
Statistical Analysis
All results are presented as mean ± SD, and statistical significance was determined among treatment groups separately for each sex. For experiments comparing the LPLFD versus control diet, a two‐tailed Student t test was used. For in vitro experiments involving more than two treatment groups, one‐way analysis of variance was performed, and when the global test was significant (P < 0.05), post‐hoc Sidak’s multiple comparisons tests were used to establish between‐group differences.
Results
Malnutrition Alters Body Composition in a Sex‐Specific Manner
We quantified the impact of the LPLFD on weight, length, and body composition of male and female mice. The LPLFD introduced to lactating dams on day‐of‐life 8 slowed weight gain among male and female pups similarly before weaning (Fig. 1A). However, by 8 weeks of life, malnourished male mice were a mean 27% underweight compared to male controls (P < 0.001), whereas malnourished female mice were just 9% underweight compared to female controls (P < 0.01; Fig. 1B). Similarly, stunting was more prominent in malnourished male (P < 0.001) compared to malnourished female mice (P < 0.05; Fig. 1C).
FIG. 1.
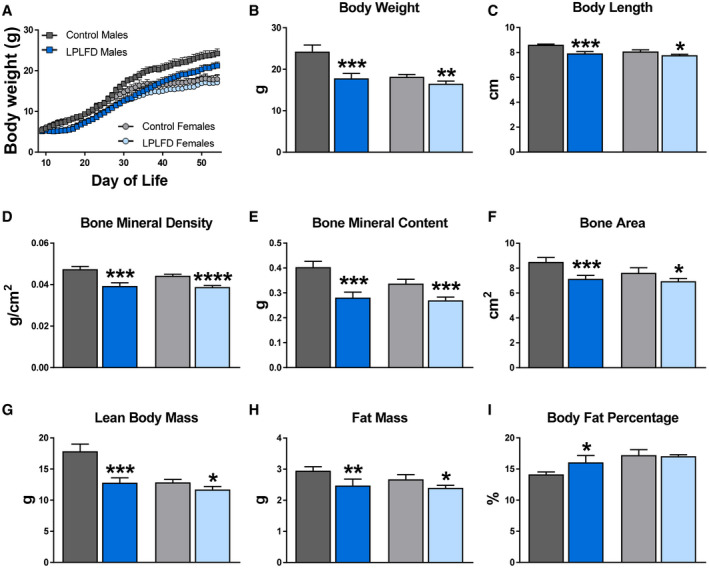
LPLFD impairs growth and alters body composition to a greater extent in weanling male mice compared to female mice. (A) Mean daily body weights from the introduction of the LPLFD on day‐of‐life 8 through 8 weeks of age. (B,C) Body weight and nose‐to‐rump length at 8 weeks of age. (D‐I) Body composition parameters measured by DXA at 8 weeks of age (n = 4‐6). Data are mean + SD. Student t test; ****P < 0.0001, ***P < 0.001, **P < 0.01, *P < 0.05 compared to control mice of the same sex.
DXA body composition analyses revealed that the LPLFD decreased bone mineral density (Fig. 1D), bone mineral content (Fig. 1E), and bone area (Fig. 1F) in 8‐week‐old male and female mice. Malnourished male mice exhibited a striking 28% decrease in lean body mass (P < 0.001) compared to only a 9% decrease in malnourished female mice (P < 0.05; Fig. 1G). Despite modestly decreased total fat mass (Fig. 1H), the profound decrease in lean body mass among male mice receiving the LPLFD translated to increased body fat percentage (P < 0.05; Fig. 1I). The LPLFD did not alter the percentage of body fat in female mice. Thus, the LPLFD has differential effects on growth and body composition among weanling male and female mice.
Liver Transcriptome Response to the LPLFD Includes Altered Nuclear Receptor Targets and Suppressed Coagulation Cascade
Next, we investigated the broad hepatic gene expression response to the LPLFD. We identified 2,160 differentially expressed genes in malnourished male mice (1,046 up, 1,114 down) and 1,920 differentially expressed genes in malnourished female mice (977 up, 943 down). Liver genes down‐regulated in malnutrition included those involved in coagulation and bile acid transport (Fig. 2A). Two decreased bile acid transporter messenger RNAs (mRNAs) are those of the FXR target genes adenosine triphosphate binding cassette subfamily B member 11/bile salt export pump (Abcb11/Bsep) and solute carrier family 51 subunit beta/organic solute transporter beta (Slc51b/Ostb); both were down‐regulated in malnourished male but not female mice (Fig. 2B). The pattern of FXR signal loss was partial; the FXR target gene nuclear receptor subfamily 0 group B member 2/small heterodimer partner (Nr0b2/Shp) was among those not down‐regulated by the LPLFD in male mice (Fig. 2B). Pathway analysis also revealed that the genes up‐regulated in malnourished male livers were enriched for PPARα signaling. qPCR confirmed induction of multiple PPARα targets; however, this induction was not as prominent in malnourished female mice and did not include all PPARα targets, with acyl‐coenzyme A (CoA) oxidase 1 (Acox1) being one example of a noninduced target gene (Fig. 2C).
FIG. 2.
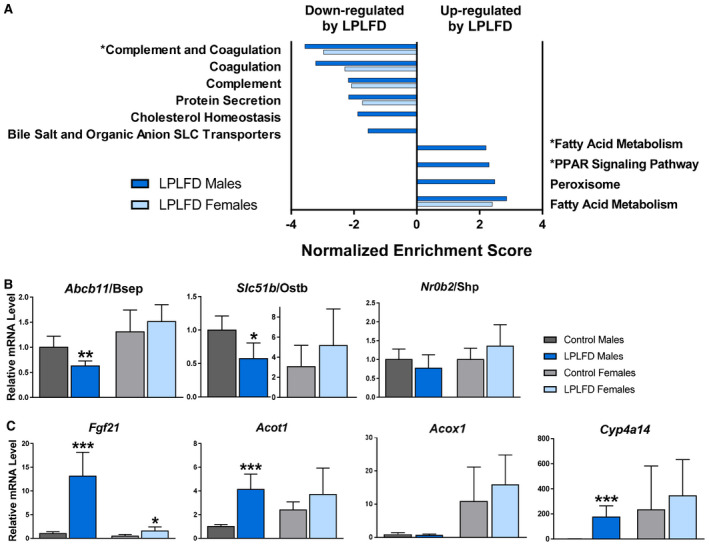
LPLFD hepatic transcription signature indicates suppressed coagulation factor secretion and changes in bile acid transport and PPARα signaling. (A) Pathway analysis of 4,080 differentially expressed transcripts; significantly altered pathways relevant to coagulation, bile acids, and PPARα are shown. (B,C) Confirmation of differentially expressed genes by qPCR that are (B) known FXR targets, including bile acid transporters, or (C) known PPARα targets (n = 6). Data in (B,C) are mean + SD. Student t test; ***P < 0.001, **P < 0.01, *P < 0.05 compared to control mice of the same sex. Abbreviation: SLC, solute carrier.
To gain additional insight into the sexually dimorphic response to the LPLFD, we examined androgen and estrogen receptor target gene expression. Pathway analysis revealed that the LPLFD down‐regulated the androgen receptor signaling pathway and early estrogen response in male mice, while it increased the early and late estrogen responses in female mice (Supporting Fig. S1). Differential expression was observed in 27% of the genes in the androgen receptor signaling pathway and in 36% and 35% of the genes in the early and late estrogen response pathways, respectively (Supporting Tables S4‐S6). In all three pathways, the LPLFD altered a greater number of transcripts in male compared to female mice. Among the top pathways up‐regulated by the LPLFD was fatty acid metabolism, which also revealed more striking abnormalities in male compared to female mice (Supporting Table S7). Taken together, the hepatic transcriptome in the LPLFD suggests down‐regulation of coagulation factor synthesis, partially decreased FXR signaling, and partially increased PPARα signaling and fatty acid metabolism, with male mice more profoundly affected than female mice.
Coagulation Factor Synthesis is Impaired in Malnourished Male Mice
To determine whether these hepatic transcriptional changes are associated with changes in secreted proteins, we profiled the plasma proteome in malnourished and control mice. From a total of 1,153 proteins with measured expression (Fig. 3A), we identified 81 differentially expressed plasma proteins in malnourished male mice and 65 differentially expressed proteins in malnourished female mice (Supporting Tables S8 and S9). Principal component analysis (PCA) revealed two striking findings (Fig. 3B). First, PC1, which conveyed the most variation in the sample set, completely separated all male plasma samples (PC1 >0) from all female samples (PC1 <0), irrespective of diet. Second, PC2, which conveyed the second‐most variation in the sample set, completely separated malnourished male mice (PC2 >0) from male controls (PC2 <0), whereas female mice receiving either the LPLFD or control diet clustered together around PC2 =0. Congruent with our liver transcriptome results, pathway analysis indicated that the most perturbed plasma protein pathway in malnourished male mice was the complement and coagulation cascade (P = 7.2 x10⁻⁵), while the next four pathways on this list were immune pathways that included complement proteins (Fig. 3C). Conversely, the complement and coagulation cascades were not perturbed in malnourished female mice. In accordance with these data, malnourished male mice were coagulopathic, as evidenced by increased INR (mean, 1.2 vs. 0.9; P = 0.0003), but this liver function impairment was not observed in malnourished female mice (Fig. 3D).
FIG. 3.
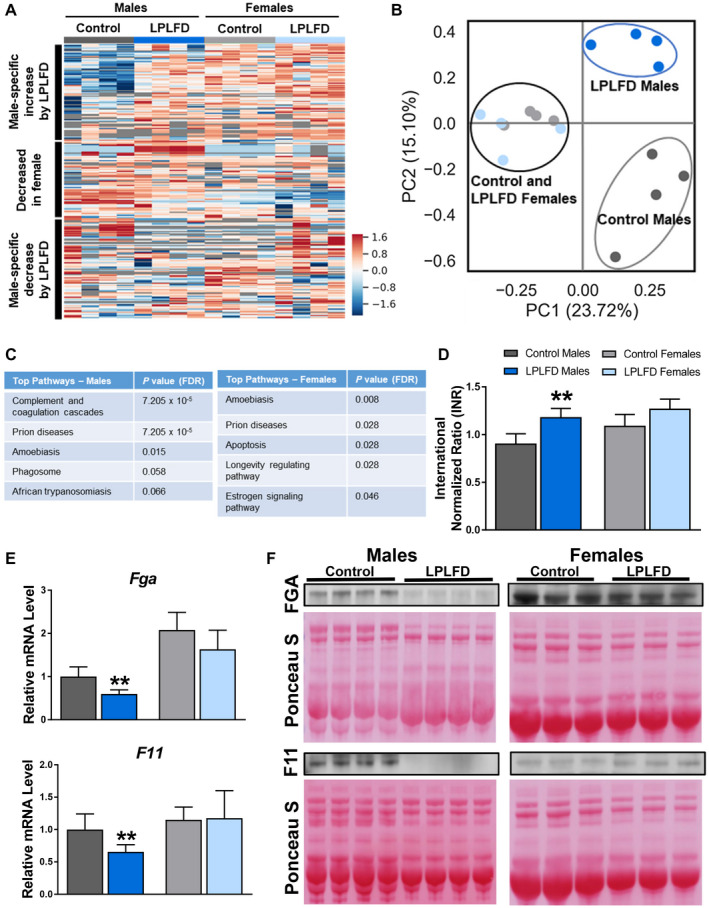
LPLFD plasma protein alterations include decreased coagulation factors. Plasma proteome analysis visualized by (A) heat map and (B) PCA plot reveals that sex differences account for the most variation between groups and that nutritional status accounts for striking differences in male but not female mice. (C) Pathway analyses of 116 altered plasma proteins reveal “Complement and coagulation cascades” as the top perturbed pathway in malnourished male mice. (D) Plasma INR of mice receiving control diet or the LPLFD (n = 5‐8). (E,F) Expression of hepatic mRNA (n = 6) and plasma protein (n = 3‐4) of the coagulation factors Fga and F11 are decreased in malnourished male mice but not female mice. These two genes were found to be decreased in malnourished male mice on an 18‐gene qPCR panel (Supporting Fig. S2). Data in (D,E) are mean + SD. Student t test; **P < 0.01 compared to control mice of the same sex. Abbreviation: FDR, false discovery rate.
To determine which coagulation factors are altered by the LPLFD, we investigated a panel of 18 coagulation genes by qPCR (Supporting Fig. S2) and identified two transcripts that were repressed by the LPLFD. Hepatic transcription of both Fga and F11 was decreased in malnourished male mice but not female mice (Fig. 3E). Consistent with decreased transcription, FGA and F11 proteins were decreased in plasma from malnourished male but not female mice (Fig. 3F). These results indicate that the LPLFD alters liver‐derived plasma coagulation proteins FGA and F11 in male but not female mice. These findings are associated with decreased FXR and altered PPARα transcriptional responses.
Opposing Effects of FXR and PPARα on Coagulation Factor Synthesis
The nutrient‐sensing nuclear receptors FXR and PPARα regulate autophagy by binding to shared DNA regulatory elements and respectively suppressing or inducing transcription of a subset of autophagy‐mediating genes.( 6 ) Given our transcriptomic evidence of FXR target repression and PPARα target activation in the context of impaired coagulation factor synthesis with elevated plasma INR in malnourished male mice, we sought to determine whether regulation of the coagulation factors Fga and F11 might occur by similar mechanisms. In primary hepatocytes derived from healthy male mice, the PPARα agonist WY‐14643 decreased and the FXR agonist GW4064 increased transcription of Fga and F11 as expected (Fig. 4A). Known transcriptional targets of FXR (Abcb11, Slc51b, and Nr0b2) and PPARα (fibroblast growth factor 21 [Fgf21], acyl‐CoA thioesterase 1 [Acot1], Acox1, and cytochrome P450, family 4, subfamily a, polypeptide 14 [Cyp4a14]) were assessed as positive controls (Supporting Fig. S3). These results support our hypothesis that Fga and F11 can be positively regulated by FXR and negatively regulated by PPARα.
FIG. 4.
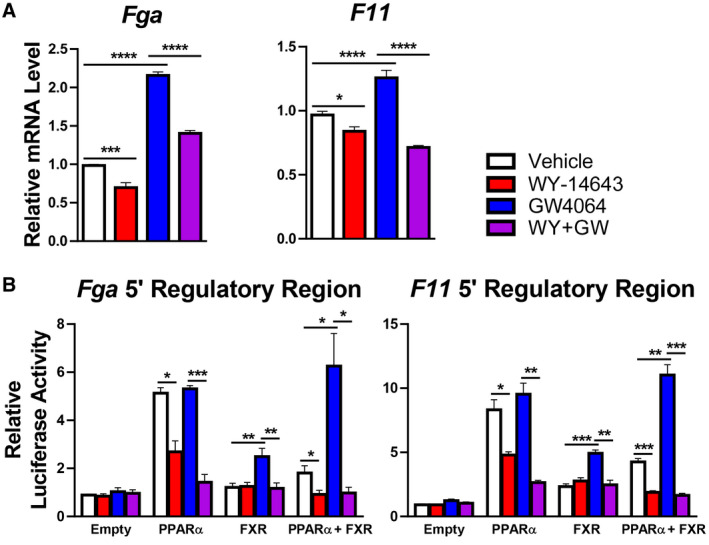
PPARα represses and FXR induces coagulation factor synthesis. (A) Primary mouse hepatocytes treated with 20 μM of the PPARα agonist WY‐14643 or 5 μM of the FXR agonist GW4064 exhibit decreased and increased expression, respectively, of Fga and F11 (n = 6). Expression of known FXR or PPARα target genes is shown in Supporting Fig. S3 as positive controls. (B) Functional role of the IR‐1 motif in the regulatory region of mouse Fga and F11 for PPARα or FXR activity in HeLa cells (n = 6). One‐way analysis of variance followed by Sidak’s multiple comparisons test; ****P < 0.0001, ***P < 0.001, **P < 0.01, *P < 0.05. Data are mean + SD. Regulatory regions were identified by in silico analyses illustrated in Supporting Fig. S4. Confirmatory studies performed in AML12 cells are shown in Supporting Fig. S5.
To explore mechanisms that underlie this coordinate regulation, we examined the Fga and F11 5’ regulatory regions for DNA binding sites shared by PPARα and FXR in publicly available ChIP‐seq data( 6 , 12 , 13 ) (Supporting Fig. S4). Near each transcriptional start site, we found multiple sites shared not just by the nuclear receptors but also by their associated proteins: steroid response coactivators 1‐3, which are recruited by FXR, and nuclear corepressor nuclear receptor corepressor 1 (NCoR) and histone deacetylase 3, which are recruited by PPARα. Each peak contained at least one match to the consensus IR‐1 FXR response element; this suggests the possibility of direct competition between the nuclear receptors in a manner similar to that which occurs in autophagy at consensus PPARα direct repeat (DR‐1) response elements but with opposite effects of the two nutrient responsive nuclear receptors at IR‐1 versus DR‐1 elements.( 6 )
To test the hypothesis that PPARα activation decreases and FXR activation increases transcription of these genes by binding to specific DNA regulatory elements, we tested the responses conferred by the IR‐1 motifs found within the ChIP‐seq peaks near the transcriptional start sites of the Fga and F11 genes. We cotransfected into HeLa cells a luciferase reporter driven by promoter constructs containing three copies of the IR‐1 motifs, along with expression vectors for PPARα and FXR. These studies confirmed opposing responses, with the FXR agonist inducing expression in the presence of FXR, as expected. PPARα cotransfection increased basal luciferase expression, but this was decreased in response to agonist. In the presence of both receptors, PPARα agonist strongly suppressed both basal and FXR‐induced expression (Fig. 4B). Similar results were obtained by cotransfecting AML12 cells, and changes in reporter activity were abolished completely by mutating the IR‐1 elements (Supporting Fig. S5). Taken together, these data indicate that FXR activation can induce and PPARα activation can repress transcriptional activity of Fga and F11 by promoter‐proximal positive IR‐1 FXR response elements.
Impaired Coagulation Factor Transcription in Malnutrition is Associated With Decreased FXR DNA Binding But Not Increased PPARα Binding
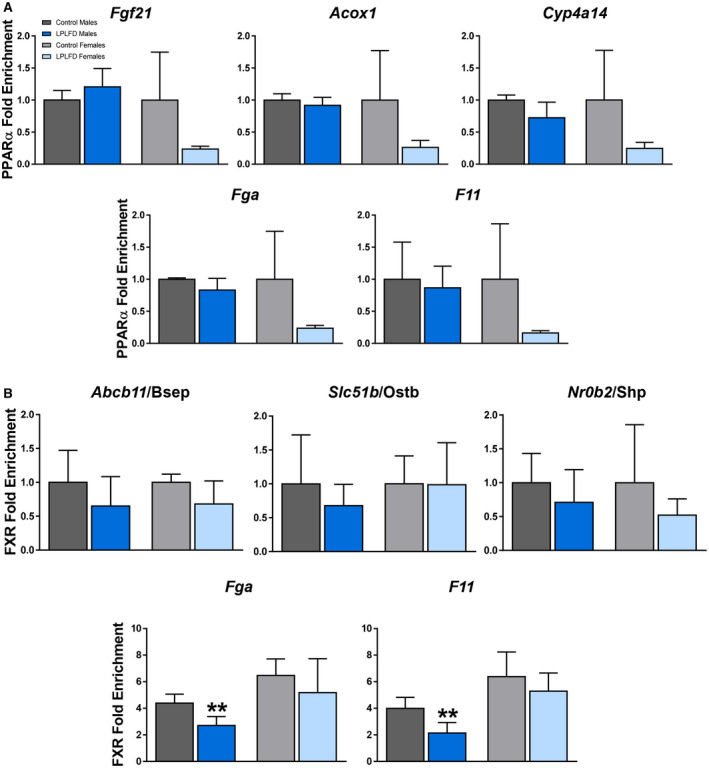
Given the possibility that FXR activation in the healthy state induces and PPARα activation in the malnourished state represses transcription of coagulation factors by binding to the IR‐1 motifs predicted by our in silico analysis, occupancy of these motifs on Fga and F11 by PPARα and FXR was examined in malnourished and healthy mice by ChIP–qPCR. As a positive control to ensure that our predicted DNA regulatory elements are PPARα binding sites, we tested livers harvested from male mice following a 24‐hour fast (Supporting Fig. S6). In fasted male mice, PPARα is known to be robustly activated and enriched at specific IR‐1 motifs.( 6 ) Indeed, we found PPARα enriched in fasted compared to fed mice on the known positive PPARα targets Fgf21 (2.2‐fold; P < 0.01), Acox1 (2.6‐fold; P < 0.001), and Cyp4a14 (2.0‐fold; P < 0.01). In addition, we found PPARα enriched in fasted compared to fed mice on Fga (2.1‐fold; P < 0.001) and F11 (2.1‐fold; P < 0.01; Supporting Fig. S6). However, in malnourished mice consuming the LPLFD, PPARα was not enriched on the known PPARα targets Fgf21, Acox1, or Cyp4a14, nor was PPARα enriched on Fga or F11 (Fig. 5A). On the other hand, although FXR binding was not significantly decreased by the LPLFD on the known response elements of the positive FXR targets Abcb11, Slc51b, or Nr0b2, FXR binding was decreased on Fga to 62% of control levels (P < 0.01) and on F11 to 54% of control levels (P < 0.01) in malnourished male but not female mice (Fig. 5B). Thus, decreased transcription of Fga and F11 in malnourished male mice is associated with decreased FXR binding but not increased PPARα binding.
FIG. 5.
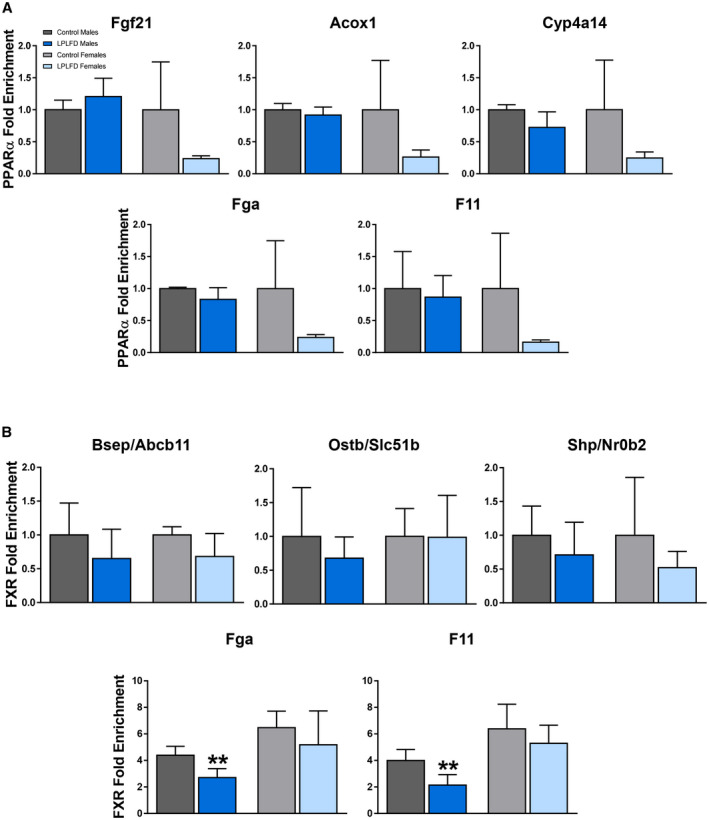
Malnutrition is associated with decreased FXR binding but not increased PPARα binding. (A) PPARα–ChIP–qPCR reveals no increased binding on the known PPARα targets Fgf21, Acox1, or Cyp4a14 nor on Fga or F11, in mice fed the LPLFD (n = 3‐4). This is in contrast to increased PPARα binding on all five genes in mice following a 24‐hour fast (Supporting Fig. S6). (B) FXR–ChIP–qPCR reveals decreased binding on Fga and F11 in malnourished male but not female livers but no significant changes on the known FXR targets Abcb11, Slc51b, and Nr0b2 (n = 3‐4). Data are mean + SD. Student t test; **P < 0.01 compared to control mice of the same sex.
Malnutrition Alters Hepatic Expression of PPARα and FXR
Decreased FXR binding at DNA regulatory elements on Fga and F11 could result from decreased FXR protein levels, decreased FXR activation, or both. To distinguish between these possibilities, we assessed hepatic FXR protein levels by western blot. The LPLFD did not decrease expression of FXR; rather, FXR protein was increased by 41% in malnourished male mice (P < 0.01) and by 19% in malnourished female mice (P < 0.01) compared to controls (Fig. 6A,B). Conversely, expression of PPARα in male liver was profoundly decreased by the LPLFD to just 16% of control levels (P < 0.0001; Fig. 6A,C). This result was surprising in the context of transcriptome evidence of PPARα activation in malnourished male mice. Given that phosphorylation of serine residues on PPARα is associated with increased transcriptional activity,( 14 ) we sought to determine whether dramatically increased PPARα phosphorylation might explain the positive transcriptional signal despite decreased PPARα protein expression. The LPLFD did not increase phosphorylation; rather, there was a slight decrease in PPARα phosphorylation in malnourished male but not female mice (Supporting Fig. S7). The LPLFD did not alter PPARα protein levels in livers from female mice, which had minimal baseline PPARα expression compared to male mice (Fig. 6A).
FIG. 6.
Altered hepatic nuclear receptor expression and FXR agonists in malnutrition. (A‐C) Relative concentrations of FXR and PPARα protein in liver, determined by western blot, reveal a profound decrease of PPARα expression in malnourished male livers (n = 3‐4). (D) Relative expression of PMP70 correlates directly with PPARα protein levels in malnourished male livers (n = 3‐4) and supports qualitative evaluation by electron microscopy revealing loss of hepatocyte peroxisomes (Supporting Fig. S8). (E) Targeted bile acid mass spectrometry from liver, plasma, and stool found total fecal bile acid levels to be significantly decreased in malnourished male mice. (F) Individual stool bile acid metabolites show multiple decreased bile acids and sex specificity (n = 6). Individual liver and plasma bile acid metabolites are shown in Supporting Fig. S9. Data in (B‐D) are mean + SD. Box and whisker plots (E,F) show interquartile range (box), median (vertical line), and outliers (whiskers). Student t test; ****P < 0.0001, **P < 0.01, *P < 0.05 compared to control mice of the same sex. [Corrections added on October 24, 2020 after first online publication: the figure 6 has been replaced with the correct one.]
Given this unexpectedly profound decrease in PPARα protein in malnourished male mice and that PPARα induces peroxisome proliferation, we qualitatively examined hepatocyte peroxisome content by electron microscopy. Similar to a study of malnourished male rats fed a low‐protein diet,( 15 ) hepatocytes from male mice fed the LPLFD exhibited loss of peroxisomes (Supporting Fig. S8). We confirmed this finding by quantifying hepatic expression of PMP70 by western blot. In accordance with decreased PPARα expression and electron microscopy evidence of peroxisome loss, PMP70 in male livers was decreased by the LPLFD to 61% of control levels (P < 0.01) but was unchanged by the LPLFD in female livers (Fig. 6D). These data indicate that markedly decreased hepatic PPARα protein is associated with peroxisome loss in malnourished male mice.
Hepatic FXR Signal Attenuation is Associated With Decreased FXR Agonist Bile Acids
Given that decreased FXR binding on Fga and F11 in malnourished male mice does not result from decreased FXR protein expression and that bile acids, many of which are FXR ligands, require peroxisomal β‐oxidation to form mature bile acid intermediates,( 16 ) we tested the possibility that FXR activation could be impaired by the LPLFD as a result of decreased bile acids. Total concentrations of hepatic and plasma bile acids were not significantly altered by malnutrition. However, total fecal bile acids were decreased in malnourished male mice to 56% of control levels (P < 0.05) and were unchanged by the LPLFD in female mice (Fig. 6E). Specifically, decreased fecal concentrations of the primary bile acid chenodeoxycholic acid (37% of control levels; P < 0.01) along with its derivatives α‐/β‐muricholic acid, lithocholic acid, and ursodeoxycholic acid (Fig. 6F) suggest impairment in the alternative pathway of bile acid biosynthesis. The altered fecal quantities of secondary bile acids, including deoxycholic acid, ursodeoxycholic acid, and lithocholic acid in the LPLFD male mice also might be due to changes in the gut microbiome, which we recently described in this model.( 17 )
Chenodeoxycholic acid is the most potent natural FXR agonist, while lithocholic acid and deoxycholic acid also can activate FXR.( 18 ) All three of these FXR agonists were decreased in stool from the LPLFD male mice (Fig. 6F), and although differences were more subtle in liver, deoxycholic acid also was depleted in liver from the LPLFD male mice (Supporting Fig. S9). Thus, the total pool of bile acids, including several known FXR ligands, is depleted in malnourished male mice, with differences most striking in the stool. All together, these data identify decreased FXR activation and binding to Fga and F11 promoter‐proximal response elements as specific mechanisms that could contribute to coagulopathy in malnourished male mice. We did not observe the predicted repressive PPARα binding to DNA regulatory elements of coagulation factors, potentially because malnourished male livers show a striking loss of PPARα protein. Decreased PPARα expression might lead to loss of peroxisomes, resulting in impaired hepatic synthesis of FXR agonist bile acids.
Discussion
Similar to the acutely fasted state, a chronically malnourished host must adapt to nutrient deficiency by conserving amino acids and energy. Malnourished children have multiple signs of suppressed hepatic secretion. These include decreased circulating complement proteins, which constitute one aspect of malnutrition‐associated immune deficiency,( 19 ) and decreased small bowel concentrations of conjugated bile acids, which impair micellar lipid solubilization and fat absorption.( 20 , 21 , 22 , 23 ) Similarly, hypoalbuminemia is a hallmark of the severe edematous form of malnutrition known as kwashiorkor.( 24 ) Although circulating levels of vitamin K‐dependent coagulation factors are often decreased, depletion of a subset of vitamin K‐independent coagulation factors( 25 , 26 ) as well as incomplete resolution of coagulation despite vitamin K therapy( 27 ) suggest additional mechanisms regulating coagulation factor synthesis in severe malnutrition.
In our moderately malnourished mice, coagulopathy was manifest as moderately increased INR and decreased expression of FGA and F11 in male but not female mice. This was associated with decreased expression of FXR target genes and decreased FXR binding to promoter‐proximal sites upstream of Fga and F11. Decreased FXR activation and binding might be due to hepatocyte peroxisome loss resulting in decreased production of FXR ligand bile acids. These observations suggest a new mechanism of regulation of coagulation factor synthesis by the nutrient‐sensing nuclear receptor FXR.
In humans, FXR activation in the context of obeticholic acid treatment for nonalcoholic steatohepatitis( 28 ) or in cholestatic liver diseases in general( 29 ) is associated with decreased INR and a hypercoagulable state. On the other hand, mutations in the gene encoding FXR cause a progressive familial intrahepatic cholestasis that features severe vitamin K‐independent coagulopathy appearing early in the course of disease, long before global liver synthetic function fails.( 30 ) Affected infants have undetectable hepatic expression of BSEP, an FXR target gene that also is down‐regulated in livers from our malnourished male mice, and expression studies in the human liver cell line Huh7 implicate FGA as well as other potential FXR targets in the coagulation cascade, namely coagulation factors 3, 12, and 13b, as well as genes that encode the two other fibrinogen subunits, fibrinogen‐β and fibrinogen‐γ.( 30 ) All three fibrinogen genes have been identified as FXR targets in both Huh7 cells and another hepatoma cell line, HepG2.( 31 ) We evaluated each of these genes in our qPCR panel, but only Fga and F11 were suppressed in male mice receiving the LPLFD. These discrepant results could reflect differences specific to transformed cell lines or differential regulation between humans and mice, or they could be due to the relatively subtle FXR signal changes that occur in our mild to moderate malnutrition model in contrast to complete genetic loss of FXR or its stimulation in vitro by high concentrations of receptor agonists.
In the inverse of their effects on autophagy,( 6 ) the nuclear receptor PPARα represses expression of genes in the coagulation cascade while FXR activates them. The suppressive role of PPARα is demonstrated by two key results. First, stimulation of primary mouse hepatocytes with PPARα agonist decreased mRNAs of Fga and F11. Second, cell‐based reporter assays revealed strong repression of Fga and F11 IR‐1 response elements following treatment with PPARα agonist. These data add to growing evidence that PPARα contributes to the regulation of coagulation factor synthesis. A recent study found that deletion of PPARα worsens the prothrombotic effect of a high‐cholesterol diet through increased synthesis of several coagulation factors,( 32 ) and earlier work illustrates that PPARα decreases fibrinogen‐β expression by directly binding to a DNA response element and interfering with a transcriptional coactivator complex.( 33 ) Indeed, one might speculate that decreasing coagulation factor synthesis thereby reducing thrombotic potential could contribute to some of the benefits of fibrates in cardiovascular diseases.( 34 )
In contrast to the direct competition between FXR and PPARα for DR‐1 elements described for autophagy,( 6 ) we did not find evidence for competition on the Fga and F11 IR‐1 elements in the malnourished state. Instead, FXR binding to the IR‐1 motif in the regulatory regions of both Fga and F11 was decreased in malnourished male mice, potentially due to decreased agonist levels, while PPARα occupancy was not detectable, apparently due to the markedly decreased levels of PPARα protein. This result is surprising given the transcriptome evidence of PPARα activation in the malnourished liver as well as the reduced expression of Fga and F11 following treatment with a PPARα agonist in both primary hepatocytes and cell‐based reporter assays. The basis for the unexpected 84% loss of PPARα protein levels in malnourished male livers is unclear and is the subject of ongoing investigation. Notably, a strong decrease in hepatic peroxisomes also was observed in a recent study modeling malnutrition in weanling male rats given a low‐protein diet with normal fat composition.( 15 )
PPARα protein expression was high in healthy males and significantly depleted by the LPLFD, yet expression levels in females were much lower in comparison at baseline and unchanged by the LPLFD. Studies in rats have suggested that androgens increase hepatic PPARα expression, resulting in increased expression in male liver relative to female liver.( 35 ) More broadly in our studies, PPARα protein levels seem to correlate inversely with FXR protein levels, particularly in male mice. The basis for this inverse correlation is not clear because analysis of published mRNA profiling studies( 36 , 37 , 38 , 39 , 40 , 41 ) does not support the predicted inhibitory cross‐regulation.
Overall, the most striking findings from our study were the prominent sex differences, manifest in the LPLFD effects on anthropometrics and body composition, transcriptomic and proteomic signatures, fecal bile acid concentrations, FXR target gene expression and binding to DNA, and expression of Fga and F11. Sex differences in malnutrition are widely reported across multiple species, with males of the species typically being more adversely affected.( 42 , 43 , 44 ) Although influences of the sex hormones and sex chromosomes on energy homeostasis are well described in the context of obesity,( 45 ) little is known regarding how these and other factors regulate sex differences in liver function and metabolism during nutrient deprivation. In rat models, diets deficient in methionine and choline cause greater steatosis, hepatic lipid content, and liver injury in male versus female rats,( 46 ) and low dietary fat intake affects plasma polyunsaturated fatty acid composition more profoundly in female compared to male rats.( 47 )Although mechanisms underlying these sex differences are unclear, more recent studies revealed that male and female mice have distinct metabolic responses to short‐term fasting. Whereas male mice preserve the hepatic amino acid pool by down‐regulating lipogenesis and gluconeogenesis, female mice use these amino acids to increase lipid reserves. Intriguingly, this difference is most pronounced in estrus‐cycle stages featuring increased steroidogenesis,( 48 ) suggesting that the distinct female response to malnutrition might have evolved in order to preserve reproductive fitness during periods of famine. Similar mechanisms could be relevant in our model given the hepatic transcriptional changes in sex hormone response and lipid metabolism pathways and their association with relatively spared body composition in female mice receiving the LPLFD. Although expression of the key lipogenesis enzymes acetyl‐CoA carboxylase or fatty‐acid synthase were not altered, ongoing studies seek to determine whether increased de novo synthesis, increased mobilization of peripheral fat stores with accumulation in the liver, or impaired hepatic clearance contribute to metabolic abnormalities in malnutrition.
Fundamental physiologic processes that are essential to life, such as coagulation, are regulated by multiple redundant mechanisms comprised of numerous regulatory inputs beyond the nuclear receptors FXR and PPARα. Nonetheless, these studies highlight novel interactions between host nutritional status and sex in the regulation of coagulation factor synthesis. They also open the possibility that bile acids or specific agonists targeting FXR might be useful to increase circulating coagulation factors and decrease the risk of life‐threatening bleeding in vulnerable patients with a variety of medical conditions who have endured chronic or profound acute weight loss.
Supporting information
Supplementary Material
Acknowledgment
We thank Dr. Lisa White for directing the RNA‐seq studies, Kristian Odfalk and Dr. Corey Reynolds for providing DXA measurements, and Jim Barrish and Dr. Milton Finegold for the electron microscopy images.
Supported by the National Institutes of Health (K08DK113114 to G.A.P., R01DK121970 to F.L., P30ES030285 to the Gulf Coast Center for Precision and Environmental Health, P30DK056338 to the Texas Medical Center Digestive Diseases Center, P30CA125123 to the Baylor College of Medicine Mass Spectrometry Proteomics Core, and P42ES027725 to the Baylor College of Medicine Polycyclic Aromatic Hydrocarbons Superfund Research Program), the R.P. Doherty Jr.‐Welch Chair in Science (Q‐0022 to D.D.M.), and the Cancer Prevention & Research Institute of Texas (RP170005 to the Baylor College of Medicine Mass Spectrometry Proteomics Core and RP160805 to the Baylor College of Medicine Preclinical Candidate Discovery Core).
Potential conflict of interest: Nothing to report.
Contributor Information
Geoffrey A. Preidis, Email: geoffrey.preidis@bcm.edu.
David D. Moore, Email: moore@bcm.edu.
References
Author names in bold designate shared co‐first authorship.
- 1. World Health Organization . WHO global health workforce statistics: December 2018 update. http://www.who.int/hrh/statistics/hwfstats/. Published December 2018. Accessed March 2020.
- 2. Thaxton GE, Melby PC, Manary MJ, Preidis GA. New insights into the pathogenesis and treatment of malnutrition. Gastroenterol Clin North Am 2018;47:813‐827. [DOI] [PMC free article] [PubMed] [Google Scholar]
- 3. Rautou PE, Cazals‐Hatem D, Moreau R, Francoz C, Feldmann G, Lebrec D, et al. Acute liver cell damage in patients with anorexia nervosa: a possible role of starvation‐induced hepatocyte autophagy. Gastroenterology 2008;135:840‐848, 848.e841‐843. [DOI] [PubMed] [Google Scholar]
- 4. Yang L, Licastro D, Cava E, Veronese N, Spelta F, Rizza W, et al. Long‐term calorie restriction enhances cellular quality‐control processes in human skeletal muscle. Cell Rep 2016;14:422‐428. [DOI] [PubMed] [Google Scholar]
- 5. Preidis GA, Keaton MA, Campeau PM, Bessard BC, Conner ME, Hotez PJ. The undernourished neonatal mouse metabolome reveals evidence of liver and biliary dysfunction, inflammation, and oxidative stress. J Nutr 2014;144:273‐281. [DOI] [PMC free article] [PubMed] [Google Scholar]
- 6. Lee JM, Wagner M, Xiao R, Kim KH, Feng D, Lazar MA, et al. Nutrient‐sensing nuclear receptors coordinate autophagy. Nature 2014;516:112‐115. [DOI] [PMC free article] [PubMed] [Google Scholar]
- 7. Preidis GA, Kim KH, Moore DD. Nutrient‐sensing nuclear receptors PPARalpha and FXR control liver energy balance. J Clin Invest 2017;127:1193‐1201. [DOI] [PMC free article] [PubMed] [Google Scholar]
- 8. Teodosio NR, Lago ES, Romani SA, Guedes RC. A regional basic diet from northeast Brazil as a dietary model of experimental malnutrition. Arch Latinoam Nutr 1990;40:533‐547. [PubMed] [Google Scholar]
- 9. Edgar R, Domrachev M, Lash AE. Gene Expression Omnibus: NCBI gene expression and hybridization array data repository. Nucleic Acids Res 2002;30:207‐210. [DOI] [PMC free article] [PubMed] [Google Scholar]
- 10. Mindikoglu AL, Abdulsada MM, Jain A, Choi JM, Jalal PK, Devaraj S, et al. Intermittent fasting from dawn to sunset for 30 consecutive days is associated with anticancer proteomic signature and upregulates key regulatory proteins of glucose and lipid metabolism, circadian clock, DNA repair, cytoskeleton remodeling, immune system and cognitive function in healthy subjects. J Proteomics 2020;217:103645. [DOI] [PMC free article] [PubMed] [Google Scholar]
- 11. Lee AH, Scapa EF, Cohen DE, Glimcher LH. Regulation of hepatic lipogenesis by the transcription factor XBP1. Science 2008;320:1492‐1496. [DOI] [PMC free article] [PubMed] [Google Scholar]
- 12. Bugge A, Feng D, Everett LJ, Briggs ER, Mullican SE, Wang F, et al. Rev‐erbalpha and Rev‐erbbeta coordinately protect the circadian clock and normal metabolic function. Genes Dev 2012;26:657‐667. [DOI] [PMC free article] [PubMed] [Google Scholar]
- 13. Feng D, Liu T, Sun Z, Bugge A, Mullican SE, Alenghat T, et al. A circadian rhythm orchestrated by histone deacetylase 3 controls hepatic lipid metabolism. Science 2011;331:1315‐1319. [DOI] [PMC free article] [PubMed] [Google Scholar]
- 14. Shalev A, Siegrist‐Kaiser CA, Yen PM, Wahli W, Burger AG, Chin WW, et al. The peroxisome proliferator‐activated receptor alpha is a phosphoprotein: regulation by insulin. Endocrinology 1996;137:4499‐4502. [DOI] [PubMed] [Google Scholar]
- 15. van Zutphen T, Ciapaite J, Bloks VW, Ackereley C, Gerding A, Jurdzinski A, et al. Malnutrition‐associated liver steatosis and ATP depletion is caused by peroxisomal and mitochondrial dysfunction. J Hepatol 2016;65:1198‐1208. [DOI] [PubMed] [Google Scholar]
- 16. Ferdinandusse S, Denis S, Faust PL, Wanders RJ. Bile acids: the role of peroxisomes. J Lipid Res 2009;50:2139‐2147. [DOI] [PMC free article] [PubMed] [Google Scholar]
- 17. Soni KG, Dike PN, Suh JH, Halder T, Edwards PT, Foong JPP, Conner ME, et al. Early‐life malnutrition causes gastrointestinal dysmotility that is sexually dimorphic. Neurogastroent Motil 2020; 10.1111/nmo.13936. [DOI] [PMC free article] [PubMed] [Google Scholar]
- 18. Parks DJ, Blanchard SG, Bledsoe RK, Chandra G, Consler TG, Kliewer SA, et al. Bile acids: natural ligands for an orphan nuclear receptor. Science 1999;284:1365‐1368. [DOI] [PubMed] [Google Scholar]
- 19. Rytter MJ, Kolte L, Briend A, Friis H, Christensen VB. The immune system in children with malnutrition‐a systematic review. PLoS One 2014;9:e105017. [DOI] [PMC free article] [PubMed] [Google Scholar]
- 20. Schneider RE, Viteri FE. Luminal events of lipid absorption in protein‐calorie malnourished children; relationship with nutritional recovery and diarrhea. I. Capacity of the duodenal content to achieve micellar solubilization of lipids. Am J Clin Nutr 1974;27:777‐787. [DOI] [PubMed] [Google Scholar]
- 21. Schneider RE, Viteri FE. Luminal events of lipid absorption in protein‐calorie malnourished children; relationship with nutritional recovery and diarrhea. II. Alterations in bile acid content of duodenal aspirates. Am J Clin Nutr 1974;27:788‐796. [DOI] [PubMed] [Google Scholar]
- 22. Mehta HC, Saini AS, Singh H, Dhatt PS. Biochemical aspects of malabsorption in marasmus. Br J Nutr 1984;51:1‐6. [DOI] [PubMed] [Google Scholar]
- 23. Mehta HC, Saini AS, Singh H, Dhatt PS. Biochemical aspects of malabsorption in marasmus: effect of dietary rehabilitation. Br J Nutr 1985;54:567‐575. [DOI] [PubMed] [Google Scholar]
- 24. Coulthard MG. Oedema in kwashiorkor is caused by hypoalbuminaemia. Paediatr Int Child Health 2015;35:83‐89. [DOI] [PMC free article] [PubMed] [Google Scholar]
- 25. Hassanein EA, Tankovsky I. Disturbances of coagulation mechanism in protein‐calorie malnutrition. Trop Geogr Med 1973;25:158‐162. [PubMed] [Google Scholar]
- 26. Jain K, Singh SD, Mukerjee DP. Observations on thrombolastographic patterns and coagulation changes in malnutrition (Marasmus and Kwashiorkor). Indian Pediatr 1979;16:1115‐1119. [PubMed] [Google Scholar]
- 27. Rapoport S, Dodd K. Hypoprothrombinemia in infants with diarrhea. Am J Dis Child 1946;71:611‐617. [PubMed] [Google Scholar]
- 28. Neuschwander‐Tetri BA, Loomba R, Sanyal AJ, Lavine JE, Van Natta ML, Abdelmalek MF, et al.; NASH Clinical Research Network . Farnesoid X nuclear receptor ligand obeticholic acid for non‐cirrhotic, non‐alcoholic steatohepatitis (FLINT): a multicentre, randomised, placebo‐controlled trial. Lancet 2015;385:956‐965. [DOI] [PMC free article] [PubMed] [Google Scholar]
- 29. Magnusson M, Fischler B, Svensson J, Petrini P, Schulman S, Nemeth A. Bile acids and coagulation factors: paradoxical association in children with chronic liver disease. Eur J Gastroenterol Hepatol 2013;25:152‐158. [DOI] [PubMed] [Google Scholar]
- 30. Gomez‐Ospina N, Potter CJ, Xiao R, Manickam K, Kim MS, Kim KH, et al. Mutations in the nuclear bile acid receptor FXR cause progressive familial intrahepatic cholestasis. Nat Commun 2016;7:10713. [DOI] [PMC free article] [PubMed] [Google Scholar]
- 31. Anisfeld AM, Kast‐Woelbern HR, Lee H, Zhang Y, Lee FY, Edwards PA. Activation of the nuclear receptor FXR induces fibrinogen expression: a new role for bile acid signaling. J Lipid Res 2005;46:458‐468. [DOI] [PubMed] [Google Scholar]
- 32. Lu Y, Harada M, Kamijo Y, Nakajima T, Tanaka N, Sugiyama E, et al. Peroxisome proliferator‐activated receptor alpha attenuates high‐cholesterol diet‐induced toxicity and pro‐thrombotic effects in mice. Arch Toxicol 2019;93:149‐161. [DOI] [PMC free article] [PubMed] [Google Scholar]
- 33. Gervois P, Vu‐Dac N, Kleemann R, Kockx M, Dubois G, Laine B, et al. Negative regulation of human fibrinogen gene expression by peroxisome proliferator‐activated receptor alpha agonists via inhibition of CCAAT box/enhancer‐binding protein beta. J Biol Chem 2001;276:33471‐33477. [DOI] [PubMed] [Google Scholar]
- 34. Jakob T, Nordmann AJ, Schandelmaier S, Ferreira‐Gonzalez I, Briel M. Fibrates for primary prevention of cardiovascular disease events. Cochrane Database Syst Rev 2016;11:CD009753. [DOI] [PMC free article] [PubMed] [Google Scholar]
- 35. Jalouli M, Carlsson L, Améen C, Lindén D, Ljungberg A, Michalik L, Edén S, et al. Sex difference in hepatic peroxisome proliferator‐activated receptor alpha expression: influence of pituitary and gonadal hormones. Endocrinology. 2003;144:101‐109. 10.1210/en.2002-220630. [DOI] [PubMed] [Google Scholar]
- 36. Tachibana K, Kobayashi Y, Tanaka T, Tagami M, Sugiyama A, Katayama T, et al. Gene expression profiling of potential peroxisome proliferator‐activated receptor (PPAR) target genes in human hepatoblastoma cell lines inducibly expressing different PPAR isoforms. Nucl Recept. 2005;3:3 10.1186/1478-1336-3-3. [DOI] [PMC free article] [PubMed] [Google Scholar]
- 37. Cariello NF, Romach EH, Colton HM, Ni H, Yoon L, Falls JG, et al. Gene expression profiling of the PPAR‐alpha agonist ciprofibrate in the cynomolgus monkey liver. Toxicol Sci. 2005;88:250‐264. 10.1093/toxsci/kfi273. [DOI] [PubMed] [Google Scholar]
- 38. Ren H, Aleksunes LM, Wood C, Vallanat B, George MH, Klaassen CD, et al. Characterization of peroxisome proliferator‐activated receptor alpha‐‐independent effects of PPARalpha activators in the rodent liver: di‐(2‐ethylhexyl) phthalate also activates the constitutive‐activated receptor. Toxicol Sci. 2010;113:45‐59. 10.1093/toxsci/kfp251. [DOI] [PMC free article] [PubMed] [Google Scholar]
- 39. Rosen MB, Lee JS, Ren H, Vallanat B, Liu J, Waalkes MP. Toxicogenomic dissection of the perfluorooctanoic acid transcript profile in mouse liver: evidence for the involvement of nuclear receptors PPAR alpha and CAR. Toxicol Sci. 2008;103:46‐56. 10.1093/toxsci/kfn025. [DOI] [PubMed] [Google Scholar]
- 40. Zhan L, Liu H‐X, Fang Y, Kong B, He Y, Zhong X‐B. Genome‐wide binding and transcriptome analysis of human farnesoid X receptor in primary human hepatocytes. PLoS One. 2014;9:e105930. 10.1371/journal.pone.0105930. [DOI] [PMC free article] [PubMed] [Google Scholar]
- 41. Ijssennagger N, Janssen AWF, Milona A, Ramos Pittol JM, Hollman DAA, Mokry M, et al. Gene expression profiling in human precision cut liver slices in response to the FXR agonist obeticholic acid. J Hepatol. 2016;64:1158‐1166. 10.1016/j.jhep.2016.01.016. [DOI] [PubMed] [Google Scholar]
- 42. Hoyenga KB, Hoyenga KT. Gender and energy balance: sex differences in adaptations for feast and famine. Physiol Behav 1982;28:545‐563. [DOI] [PubMed] [Google Scholar]
- 43. Tarrade A, Panchenko P, Junien C, Gabory A. Placental contribution to nutritional programming of health and diseases: epigenetics and sexual dimorphism. J Exp Biol 2015;218:50‐58. [DOI] [PubMed] [Google Scholar]
- 44. Pinos H, Carrillo B, Diaz F, Chowen JA, Collado P. Differential vulnerability to adverse nutritional conditions in male and female rats: modulatory role of estradiol during development. Front Neuroendocrinol 2018;48:13‐22. [DOI] [PubMed] [Google Scholar]
- 45. Wang C, Xu Y. Mechanisms for sex differences in energy homeostasis. J Mol Endocrinol 2019;62:R129‐R143. [DOI] [PMC free article] [PubMed] [Google Scholar]
- 46. Kirsch R, Clarkson V, Shephard EG, Marais DA, Jaffer MA, Woodburne VE, et al. Rodent nutritional model of non‐alcoholic steatohepatitis: species, strain and sex difference studies. J Gastroenterol Hepatol 2003;18:1272‐1282. [DOI] [PubMed] [Google Scholar]
- 47. Childs CE, Romeu‐Nadal M, Burdge GC, Calder PC. The polyunsaturated fatty acid composition of hepatic and plasma lipids differ by both sex and dietary fat intake in rats. J Nutr 2010;140:245‐250. [DOI] [PubMed] [Google Scholar]
- 48. Della Torre S, Mitro N, Meda C, Lolli F, Pedretti S, Barcella M, et al. Short‐term fasting reveals amino acid metabolism as a major sex‐discriminating factor in the liver. Cell Metab 2018;28:256‐267.e255. [DOI] [PMC free article] [PubMed] [Google Scholar]
Associated Data
This section collects any data citations, data availability statements, or supplementary materials included in this article.
Supplementary Materials
Supplementary Material