

Abstract
Organophosphate esters have become widely used as flame retardants since the phase out of polybrominated diphenyl ethers. Previously, we demonstrated that some organophosphate esters, such as tert-butylphenyl diphenyl phosphate (BPDP), were more detrimental to endochondral ossification in murine limb bud cultures than one of the major polybrominated diphenyl ethers that they replaced, 2,2′,4,4′-tetrabromodiphenyl ether. Here, we used a transcriptomic approach to elucidate the mechanism of action of BPDP in the developing limb. Limb buds collected from gestation day 13 CD1 mouse embryos were cultured for 3 or 24 h in the presence of vehicle, 1 μM, or 10 μM BPDP. RNA sequencing analyses revealed that exposure to 1 µM BPDP for 24 h increased the expression of 5 transcripts, including Ihh, and decreased 14 others, including Gli1, Ptch1, Ptch2, and other targets of Hedgehog (Hh) signaling. Pathway analysis predicted the inhibition of Hh signaling. Attenuation of Hh signaling activity began earlier and reached a greater magnitude after exposure to 10 µM BPDP. Because this pathway is part of the regulatory network governing endochondral ossification, we used a known Hh agonist, purmorphamine, to determine the contribution of Hh signaling inhibition to the negative impact of BPDP on endochondral ossification. Cotreatment of limbs with purmorphamine rescued the detrimental morphological changes in the cartilage template induced by BPDP exposure though it did not restore the expression of key transcription factors, Runx2 and Sp7, to control levels. These data highlight Hh signaling as a developmentally important pathway vulnerable to environmental chemical exposures.
Keywords: flame retardants, organophosphate esters (OPEs), tert-butylphenyl diphenyl phosphate (BPDP), endochondral ossification, limb bud culture
The addition of flame retardants (FRs) to consumer goods has been the decades-long solution for these products to meet flammability requirements. Organophosphate esters (OPEs), popular as plasticizers and lubricants, are now also widely employed as FRs (Stapleton et al., 2012; van der Veen and de Boer, 2012). One such OPE is tert-butylphenyl diphenyl phosphate (BPDP). BPDP is a major component of several commercial FR mixtures, including Firemaster 600 and Phosflex 71B (Phillips et al., 2017). Like many OPEs, BPDP is an additive FR that is not chemically bound to the treated products. Its ability to leach out of these products makes it possible for humans and other animals to be exposed.
Information on the environmental occurrence of BPDP is limited, but in studies in which BPDP was included, it was detected frequently in household dust (Guan et al., 2019; Phillips et al., 2018; Vykoukalová et al., 2017). Efforts to determine human exposure to BPDP are complicated by its transformation into multiple metabolites, including tert-butylphenyl phenyl phosphate and diphenyl phosphate, a metabolite common to many triaryl-substituted OPEs. In the Environment And Reproductive Health study, tert-butylphenyl phenyl phosphate was detected in the urine of 14% of the recruited women, at levels up to 351 ng/ml after specific gravity adjustment (Carignan et al., 2017). In contrast, in the Toddler’s Exposure to SVOCs in the Indoor Environment study, it was detected in the urine of 94.5% of the recruited children, at levels up to 11.8 ng/ml (Phillips et al., 2018). The explanation for the differences in detection frequency and exposure to BPDP between these 2 studies, both based in the United States, is not known.
Toxicological studies of BPDP have also been limited. In Fischer 344 rats, high doses of butylated triphenyl phosphate-based hydraulic fluid affected reproductive endpoints and induced lipid accumulation in adrenocortical and ovarian interstitial cells (Latendresse et al., 1994, 1995). Jet engine lubricant containing 3% butylated triphenyl phosphate inhibited neurotoxic esterase activity in the brain and spinal cord of hens, though organophosphate-induced delayed neuropathy was not observed (Daughtrey et al., 1996). A study by the company that marketed Phosflex 51B, a commercial BPDP-based FR and plasticizer formulation, reported that Sprague Dawley rats exposed to this mixture had higher liver, kidney, and adrenal weights but were otherwise unaffected (Freudenthal et al., 2001). More recently, Behl et al. (2015) found that BPDP reduced neurite outgrowth and neuronal network firing in primary rat neocortical cultures. Schang et al. (2016) reported that BPDP exposure increased superoxide production and basal progesterone secretion in MA-10 mouse Leydig cells. Exposure to BPDP also affected larval development in Caenorhabditis elegans and embryonic development in zebrafish (Behl et al., 2015). Adult zebrafish exposed to 0.03 or 0.3 µM BPDP during embryonic development had a reduced novel environment response whereas treatment with 3 µM BPDP led to spinal curvature in more than half of the fish (Glazer et al., 2018). BPDP treatment also induced developmental cardiotoxicity and hepatotoxicity in zebrafish, indicating its potential to be a teratogen (Alzualde et al., 2018).
Previously, we reported that 4 OPEs, including BPDP, were detrimental to endochondral ossification in mouse limb bud cultures (Yan and Hales, 2019). Bone formation is a toxicologically interesting endpoint but, to our knowledge, no previous study has examined the effects of BPDP on the skeleton. The potential mechanism(s) by which BPDP harms endochondral ossification remains unknown.
In the process of endochondral ossification, chondrocytes that form the bulk of the cartilage anlage proliferate, allowing the anlage to elongate. Eventually, these cells exit the cell cycle and undergo hypertrophy. Terminally differentiated hypertrophic chondrocytes are then replaced by osteoblasts, which are responsible for ossification. A network of cross-talking signaling pathways, including Hedgehog (Hh), Wnt, fibroblast growth factor, and bone morphogenetic protein, govern each step of this process (Kozhemyakina et al., 2015; Long and Ornitz, 2013).
In the current study, we sought to identify early transcriptomic changes induced by BPDP exposure and determine their contribution to the negative impact of BPDP on endochondral ossification in the murine limb bud culture model, using a triple transgenic reporter mouse line that expresses fluorescent markers for the major cell populations involved.
MATERIALS AND METHODS
3D organotypic limb bud cultures and treatments
Triple transgenic CD1 reporter mice, which express collagen type II alpha 1-enhanced cyan fluorescent protein (COL2A1-ECFP; proliferative chondrocyte marker), collagen type X alpha 1-mCherry (COL10A1-mCherry; hypertrophic chondrocyte marker), and collagen type I alpha 1-yellow fluorescent protein (COL1A1-YFP; osteoblast marker), were a gift from David L. Butler (University of Cincinnati, Cincinnati, Ohio) and David Rowe (University of Connecticut Health Center, Farmington, Connecticut) (Maye et al., 2011). The mice were housed in the McIntyre Animal Resource Centre (McGill University, Montreal, Quebec, Canada). All animal studies were in accordance with the guidelines established by the Canadian Council on Animal Care and approved by the McGill University Animal Care Committee under protocol 7892. The detection of a vaginal plug after overnight mating was considered the start of gestation and designated as gestation day (GD) 0. On GD 13, pregnant dams were euthanized by CO2 asphyxiation and cervical dislocation. The embryos were explanted in Hanks’ balanced salt solution (Sigma-Aldrich Canada Co, Oakville, Ontario, Canada) and their limb buds were cultured as previously described (Paradis et al., 2019; Yan and Hales, 2019). Briefly, excised forelimbs were pooled and cultured in glass bottles containing 6 ml culture medium, which consisted of 75% BGJb medium (GIBCO BRL Products, Burlington, Ontario, Canada) and 25% salt solution, supplemented with ascorbic acid (160 μg/ml) and gentamycin (20 μg/ml, GIBCO BRL Products). Each bottle was gassed with 50% O2, 5% CO2, and 45% N2. All treatments were applied as 12 µl additions to the 6 ml culture medium: the vehicle, dimethyl sulfoxide (Sigma-Aldrich); 1 or 10 µM BPDP (CAS No. 56803-37-3) (a gift from Heather M. Stapleton, Nicholas School of the Environment, Duke University, Durham, North Carolina); 50, 67, or 100 nM purmorphamine (CAS No. 483367-10-8) (Sigma-Aldrich); cotreatment with 1 µM BPDP and 100 nM purmorphamine.
RNA sequencing and pathway analysis
Limbs (n = 4 culture bottles, 3–5 limbs per bottle) were cultured for 3 or 24 h at 37°C before collection and homogenization. Total RNA was isolated using the RNeasy Plus Mini Kit (Qiagen, Mississauga, Ontario, Canada). RNA concentration and integrity were assessed using the RNA 6000 Nano Kit (Agilent Technologies, Mississauga, Ontario, Canada) on the 2100 Bioanalyzer System (Agilent Technologies); RNA purity was assessed using a NanoDrop 2000 spectrophotometer (Thermo Fisher Scientific, Waltham, Massachusetts). Sequencing was conducted at Novogene Corporation (Sacramento, California) using their NovaSeq 6000 Sequencing System (Illumina, San Diego, California). The RNA-seq data have been uploaded to Gene Expression Omnibus (GSE155435). Differentially expressed genes (DEGs) were identified using the DESeq2 R package (q < 0.05; Love et al., 2014). Gene Ontology Enrichment analysis was performed using clusterProfiler (Yu et al., 2012). The datasets were then further analyzed using Ingenuity Pathway Analysis (IPA) software (≥ 1.5-fold change, q < 0.05; Qiagen).
Quantitative reverse transcription-polymerase chain reaction
Total RNA isolated from homogenized limb buds (n = 3 or 5 culture bottles, 3–5 limbs per bottle) was diluted to a working concentration of 2 ng/μl for quantitative reverse transcription-polymerase chain reaction (qRT-PCR). Transcripts were quantified using Power SYBR Green RNA-to-CT 1-Step Kit (Applied Biosystems, Foster City, California) and the ViiA 7 Real-Time PCR System (Applied Biosystems). Each reaction consisted of 10 μl SYBR Green Master Mix, 2 μl of primer, 0.16 μl Reverse Transcriptase mix, 5 μl sample, and topped to 20 μl with RNase-DNase-free water. The PCR conditions were as follows: 48°C for 30 min, 95°C for 10 min, followed by 40 cycles of 95°C for 15 s, 55°C for 30 s, and 72°C for 30 s. All primers were from QuantiTect Primer Assays (Qiagen): GLI-Kruppel family member GLI1 (Gli1, QT00173537), Patched 1 (Ptch1, QT00149135), Patched 2 (Ptch2, QT01763783), Hedgehog-interacting protein (Hhip, QT00147518), RUNX family transcription factor 3 (Runx3, QT01057945), Indian hedgehog (Ihh, QT00096215), RUNX family transcription factor 2 (Runx2, QT00102193), Sp7 transcription factor 7 (Sp7, QT00293181), and ribosomal protein L8 (Rpl8, QT00253379). Each reaction was done in triplicate, averaged, and normalized to the amount of Rpl8 transcripts. Analyses were done using the QuantStudio Real Time PCR Software (version 1.3, Applied Biosystems).
The RNA-seq data were validated by using the samples from the sequencing for qRT-PCR.
Limb morphology
Limbs (n = 5 culture bottles, 5–7 limbs per bottle) were cultured for 6 days at 37°C, with a medium change and reoxygenation on day 3, as previously described (Paradis et al., 2019). No treatments were added to the fresh medium. On days 1, 3, and 6 of culture, limbs were photographed with a Leica DFC450C digital camera (Leica Microsystems, Wetzlar, Germany) connected to a Leica M165 Fluorescent Stereo Microscope (Leica Microsystems). The extent of cartilage template development was quantified on day 6 by using a morphogenetic differentiation scoring system to assess COL2A1-ECFP-positive cartilage differentiation (adapted from Neubert and Barrach, 1977; Paradis et al., 2019; Yan and Hales, 2019). Each component of the limb (each digit, the carpals, the radius, and the ulna [the humerus is excluded because it does not develop in limb buds excised on GD 13]) was assigned a score between zero (absent) and 30 (best possible development); these component scores were then summed into a total limb differentiation score. Scores for limbs in the same bottle were averaged to obtain the value for one biological replicate of that treatment group. The length and width of the radius and ulna were measured using ImageJ (National Institutes of Health, Bethesda, Maryland). The length was defined as the length of a line that longitudinally bisects the COL2A1-ECFP-positive cartilage anlage of the bone; the width was defined as the average of the greatest width attained by the proximal and the distal COL10A1-mCherry-positive zones of hypertrophy.
Statistical analyses
Data were analyzed using GraphPad Prism (version 8.4.1, GraphPad Software Inc, La Jolla, California). To compare the limb differentiation scores, Bonferroni-corrected Mann-Whitney U tests were used. To compare the length and width of the radius, 2-way ANOVA was used, followed by Tukey’s post hoc test. The minimum level of significance was p < .05. To compare mRNA transcript levels, 2-way ANOVA was used, followed by Dunnett’s test or Tukey’s post hoc test. The minimum level of significance was p < .01.
RESULTS
BPDP Affects Cartilage Template Development and Bone Formation
Forelimb buds from triple transgenic reporter embryos were cultured in the presence of dimethyl sulfoxide, 1, or 10 μM BPDP to assess effects on endochondral ossification. On day 1 of culture, limbs were comparable across all treatment groups (Figure 1). In control limbs, the COL2A1-ECFP-positive cartilage template underwent remarkable development over the remaining duration of the culture. The cartilage anlagen of the carpals, the metacarpals, and the phalanges underwent notable growth and differentiation. The radius and the ulna elongated, broadened, and entered the later stages of endochondral ossification. COL10A1-mCherry-positive hypertrophic chondrocytes and COL1A1-YFP-positive osteoblasts were present by day 3; the zones of hypertrophy and ossification marked by these cells lengthened by day 6 (Figure 1).
Figure 1.

Representative fluorescent photographs of gestation day 13 forelimbs cultured in presence of vehicle, 1, or 10 μM tert-butylphenyl diphenyl phosphate (BPDP) on days 1, 3, and 6 of the 6-day culture period. Collagen type II alpha 1-enhanced cyan fluorescent protein (COL2A1-ECFP) marks the developing cartilage template, collagen type X alpha 1-mCherry (COL10A1-mCherry) marks hypertrophic chondrocytes, and collagen type I alpha 1-yellow fluorescent protein (COL1A1-YFP) marks osteoblasts; n = 5.
Exposure to 1 μM BPDP limited the longitudinal growth of the cartilage anlagen, thus leading to a reduction in the overall size of the limb. On day 3, there were no notable changes in the overall intensity COL10A1-mCherry and COL1A1-YFP fluorescence in the radius and the ulna. However, by day 6, the zones of hypertrophy and ossification indicated by these 2 markers tended to be shorter and narrower in treated limbs compared with control (Figure 1). In addition, faint COL10A1-mCherry fluorescence could be seen in the phalanges and metacarpals of 1 μM BPDP-treated limbs, whereas those of the control limbs remained mCherry-negative (Supplementary Figure 3). This phenomenon was more apparent with 3 µM BPDP treatment (Yan and Hales, 2019) and suggests that BPDP may induce premature chondrocyte maturation in the digits.
Exposure to 10 μM BPDP produced even more dramatic effects, further limiting the longitudinal growth of the limb and the differentiation of the digits and the carpals (Figure 1). COL10A1-mCherry fluorescence was only faintly visible by day 6; COL1A1-YFP fluorescence was not observed at all over the course of 6 days of culture.
These results indicate that BPDP was detrimental to both chondrogenesis and osteogenesis in the limb bud culture model.
Effects of BPDP on Canonical Signaling Pathways in the Limb
To elucidate the potential mode of action of BPDP, we used RNA sequencing to assess the early impact of BPDP on the limb transcriptome at 3 and 24 h, prior to any appreciable morphological changes. As control limbs developed in culture from 3 to 24 h, 353 transcripts were significantly downregulated by at least 1.5-fold; 719 transcripts were significantly upregulated by at least 1.5-fold (Figure 2A). The downregulated transcripts were mostly involved in processes related to DNA replication and the cell cycle (Supplementary Figure 1). The upregulated transcripts predominantly functioned in muscle, cartilage, and bone development (Supplementary Figure 2).
Figure 2.

Volcano plots of differential gene expression data from the RNA-seq experiments, showing (A) gene expression changes with time in culture for control limbs; (B) gene expression changes induced by 1 μM tert-butylphenyl diphenyl phosphate (BPDP) at 24 h, compared with control; and gene expression changes induced by 10 μM BPDP at (C) 3 h and (D) 24 h, compared with control. Dashed gray lines indicate the cutoffs used (at least a 1.5-fold change and q value < 0.05, corresponding to |log2(fold change)| ≥ 0.5849 and –log10(q value) > 1.30, respectively). Based on these cutoffs, blue dots indicate downregulated transcripts and orange dots indicate upregulated transcripts; n = 4.
Exposure to 1 μM BPDP for 3 h did not significantly alter gene expression compared with control at q < 0.05, although the 3 transcripts that most tended toward a decrease were Gli1, Ptch2, and Runx3 (data not shown), components of the Hedgehog signaling pathway. By 24 h, 14 transcripts were significantly downregulated and 5 were significantly upregulated (Figure 2B and Table 1). Based on this list of DEGs, IPA predicted the inactivation of the Sonic hedgehog (Shh) signaling pathway (z-score = −2; Figure 3A). Most of the other canonical pathways identified by IPA were based on genes they had in common with Shh signaling (Table 2). Shh and Dhh were barely detectable in mouse forelimbs at this stage of development; Ihh was the dominant ligand regulating pathway activity. As such, the predicted inactivation of Shh signaling indicated the inactivation of Ihh signaling. Interestingly, Ihh was the most upregulated transcript out of the 5 upregulated by 1 μM BPDP at 24 h (Table 1).
Table 1.
Genes for Which Expression Was Altered by ≥ 1.5-Fold After 24 h Exposure to 1 µM tert-Butylphenyl Diphenyl Phosphate, Compared With Control
| Gene Symbol | Gene Name | Fold Change | q Valuea |
|---|---|---|---|
| Ptch2 | Patched homolog 2 | 0.38 | 4.09E-19 |
| Runx3 | Runt related transcription factor 3 | 0.39 | 1.72E-18 |
| Ptch1 | Patched homolog 1 | 0.44 | 1.29E-17 |
| Batf3 | Basic leucine zipper transcription factor ATF-like 3 | 0.52 | 1.62E-07 |
| Hhip | Hedgehog-interacting protein | 0.52 | 2.81E-07 |
| Clic6 | Chloride intracellular channel 6 | 0.53 | 6.50E-07 |
| Bcl2 | B-cell leukemia/lymphoma 2 | 0.57 | 8.25E-08 |
| Foxc2 | Forkhead box C2 | 0.57 | 1.54E-07 |
| Gli1 | GLI-Kruppel family member GLI1 | 0.60 | 5.88E-05 |
| Ccnd1 | Cyclin D1 | 0.63 | 4.50E-06 |
| Angpt2 | Angiopoietin 2 | 0.63 | 0.0007 |
| Thbd | Thrombomodulin | 0.63 | 0.0015 |
| Nrtn | Neurturin | 0.66 | 0.0056 |
| Runx2 | Runt related transcription factor 2 | 0.66 | 0.0006 |
| Ihh | Indian hedgehog | 2.31 | 3.43E-21 |
| Pcsk6 | Proprotein convertase subtilisin/kexin type 6 | 1.87 | 9.96E-16 |
| Cytl1 | Cytokine-like 1 | 1.76 | 1.64E-09 |
| Agtr1a | Angiotensin II receptor type 1a | 1.60 | 0.0010 |
| Pde8b | Phosphodiesterase 8B | 1.52 | 0.0056 |
aThe q value is the adjusted p value calculated by DESeq2.
Figure 3.

Differential gene expression data from the comparison of control limbs with (A) 1 μM tert-butylphenyl diphenyl phosphate (BPDP)-treated limbs and (B) 10 μM BPDP-treated limbs at 24 h were analyzed using Ingenuity Pathway Analysis software. The top 15 affected Ingenuity Canonical Pathways are shown. Each bar is colored by and labeled with its associated z-score: blue/negative z-score = pathway inhibited; orange/positive z-score = pathway activated; white/z-score of 0 = no nonrandom direction of change in the activity of said pathway; gray/NP = no prediction (because no activity pattern is available for said pathway).
Table 2.
Ingenuity Pathway Analysis Output for 1 µM tert-Butylphenyl Diphenyl Phosphate Versus Control at 24 h: Details of the Top 15 Canonical Pathways
| Ingenuity Canonical Pathways | −Log(Overlap p Valuea) | Activation z-Scoreb | Genes in Dataset |
|---|---|---|---|
| Sonic hedgehog signaling | 8 | −2 | Gli1, Hhip, Ptch1, Ptch2 |
| Basal cell carcinoma signaling | 6.41 | 0 | Gli1, Hhip, Ptch1, Ptch2 |
| Molecular mechanisms of cancer | 6.2 | NP | Bcl2, Ccnd1, Gli1, Ihh, Ptch1, Ptch2 |
| Osteoarthritis pathway | 6.11 | −1 | Gli1, Ihh, Ptch1, Ptch2, Runx2 |
| TGF-β signaling | 4.15 | 0 | Bcl2, Runx2, Runx3 |
| Apelin cardiac fibroblast signaling pathway | 3.77 | 0 | Agtr1, Angpt2 |
| Corticotropin releasing hormone signaling | 3.62 | 0 | Gli1, Ptch1, Ptch2 |
| Protein kinase A signaling | 3.5 | 0 | Ihh, Pde8b, Ptch1, Ptch2 |
| IL-8 signaling | 3.22 | 0 | Angpt2, Bcl2, Ccnd1 |
| Axonal guidance signaling | 3.18 | NP | Gli1, Hhip, Ptch1, Ptch2 |
| Small cell lung cancer signaling | 2.79 | 0 | Bcl2, Ccnd1 |
| VDR/RXR activation | 2.7 | 0 | Runx2, Thbd |
| IL-7 signaling pathway | 2.7 | 0 | Bcl2, Ccnd1 |
| Prostate cancer signaling | 2.57 | NP | Bcl2, Ccnd1 |
| p53 signaling | 2.51 | 0 | Bcl2, Ccnd1 |
aAn overlap p value < .01 (right-tailed Fisher’s Exact Test) indicates statistically significant overlap between genes in the dataset and genes in the canonical pathway
bThe activation z-score infers said pathway’s activation state based on the direction(s) of the gene expression changes observed in the dataset versus known canonical pathway patterns.
Abbreviation: NP, no prediction, due to insufficient evidence in the Ingenuity Knowledge Base.
Furthermore, IPA predicted the decreased activity of the upstream regulators GLI1 and GLI2 (Figure 4A). This is consistent with evidence that GLI can drive the expression of 9 of the 14 downregulated transcripts, including components of the pathway itself (such as Gli1 and Ptch1/2), regulators of cell cycle and cell survival (such as cyclin D1 [Ccnd1] and B-cell lymphoma 2 [Bcl2]), and tissue/function-specific genes (such as Runx2/3) (Figure 4B; Katoh and Katoh, 2009; Kim et al., 2013). The activity of CTNNB1 was also predicted to be inhibited; this was based upon a very similar subset of DEGs (Table 3).
Figure 4.

A, The top 3 upstream regulators predicted by Ingenuity Pathway Analysis to have an altered activation state after 24 h of 1 μM tert-butylphenyl diphenyl phosphate (BPDP) treatment, compared with control. B, The differentially expressed genes known to be regulated by GLI1 and GLI2, based on the Ingenuity Knowledge Base and Kim et al. (2013).
Table 3.
Ingenuity Pathway Analysis Output for 1 µM tert-Butylphenyl Diphenyl Phosphate Versus Control at 24 h: Details of the Top 3 Upstream Regulators
| Upstream Regulator | Overlap p Valuea | Activation z-Scoreb | Predicted State | Target Genes in the Dataset |
|---|---|---|---|---|
| GLI1 | 3.76E-12 | −2.759 | Inhibited | Bcl2, Ccnd1, Foxc2, Gli1, Hhip, Ptch1, Ptch2, Runx2 |
| CTNNB1 | 3.16E-10 | −2.71 | Inhibited | Bcl2, Ccnd1, Foxc2, Gli1, Hhip, Ihh, Pcsk6, Ptch1, Ptch2, Runx2 |
| GLI2 | 2.48E-12 | −2.568 | Inhibited | Bcl2, Ccnd1, Foxc2, Gli1, Hhip, Ptch1, Runx2 |
aAn overlap p value < .01 (right-tailed Fisher’s Exact Test) indicates statistically significant overlap between genes in the dataset and genes known to be regulated by said upstream regulator
bThe activation z-score infers said regulator’s activation state based on the direction(s) of gene expression changes observed in the dataset versus literature-based predictions.
Exposure to 10 μM BPDP likewise reduced Hh signaling, though the effect began earlier and reached a greater magnitude. At 3 h, 10 μM BPDP significantly downregulated 6 transcripts, including Gli1 and Runx3, by at least 1.5-fold; none were upregulated (Figure 2C and Table 4). By 24 h, 451 transcripts were significantly downregulated and 167 were upregulated (Figure 2D). The same set of Hh target genes downregulated by 1 μM BPDP at 24 h was also among the top transcripts downregulated by 10 μM BPDP (Table 5). Ihh was the second most upregulated transcript (Supplementary Table 1). Similarly, IPA analysis predicted an inhibition of Shh signaling (Figure 3B). However, after 10 μM BPDP exposure, more general effects on cell cycle-related pathways were also observed.
Table 4.
Genes for Which Expression Was Altered by ≥ 1.5-Fold After 3 h Exposure to 10 µM tert-Butylphenyl Diphenyl Phosphate, Compared With Control
| Gene Symbol | Gene Name | Fold Change | q Value |
|---|---|---|---|
| Dhrs3 | Dehydrogenase/reductase (SDR family) member 3 | 0.52 | 2.69E-20 |
| Cyp1b1 | Cytochrome P450 family 1 subfamily b polypeptide 1 | 0.53 | 6.57E-09 |
| Runx3 | Runt related transcription factor 3 | 0.63 | 0.0001 |
| Rarb | Retinoic acid receptor beta | 0.64 | 7.95E-05 |
| Adra2a | Adrenergic receptor alpha 2a | 0.64 | 0.0002 |
| Gli1 | GLI-Kruppel family member GLI1 | 0.67 | 0.0027 |
Table 5.
Top 20 Genes Downregulated by ≥ 1.5-Fold After 24 h Exposure to 10 µM tert-Butylphenyl Diphenyl Phosphate, Compared With Control
| Gene Symbol | Gene Name | Fold Change | q Value |
|---|---|---|---|
| Ptch2 | Patched homolog 2 | 0.11 | 5.66E-73 |
| C1qa | Complement component 1, q subcomponent, alpha polypeptide | 0.24 | 8.05E-26 |
| Clic6 | Chloride intracellular channel 6 | 0.28 | 6.78E-14 |
| Cx3cr1 | Chemokine (C-X3-C motif) receptor 1 | 0.28 | 2.50E-15 |
| Ptch1 | Patched homolog 1 | 0.30 | 3.66E-39 |
| C1qc | Complement component 1, q subcomponent, C chain | 0.33 | 6.12E-16 |
| Runx3 | Runt related transcription factor 3 | 0.33 | 7.06E-18 |
| Csf1r | Colony stimulating factor 1 receptor | 0.34 | 6.12E-16 |
| Endou | Endonuclease, polyU-specific | 0.35 | 5.53E-09 |
| C1qb | Complement component 1, q subcomponent, beta polypeptide | 0.36 | 1.88E-16 |
| Hhip | Hedgehog-interacting protein | 0.36 | 7.22E-10 |
| Batf3 | Basic leucine zipper transcription factor, ATF-like 3 | 0.37 | 7.22E-09 |
| C3ar1 | Complement component 3a receptor 1 | 0.37 | 1.02E-12 |
| Pou2f3 | POU domain, class 2, transcription factor 3 | 0.37 | 1.33E-08 |
| Lyz2 | Lysozyme 2 | 0.39 | 1.91E-14 |
| Apoc1 | Apolipoprotein C-I | 0.40 | 4.79E-07 |
| Ccnd1 | Cyclin D1 | 0.40 | 1.70E-24 |
| Bcl2 | B-cell leukemia/lymphoma 2 | 0.41 | 2.49E-17 |
| Gli1 | GLI-Kruppel family member GLI1 | 0.44 | 1.11E-06 |
| Arrdc4 | Arrestin domain containing 4 | 0.44 | 3.77E-09 |
We validated our RNA-seq results by using qRT-PCR to assess the mRNA expression levels of 5 Hh target genes (Gli1, Ptch1, Ptch2, Hhip, and Runx3) and Ihh itself. At 3 h, BPDP concentration-dependently reduced the expression of the Hh target genes without affecting Ihh (Figs. 5A and 5B). At 24 h, the reductions in the expression of the Hh target genes were more dramatic (Figure 5C); in addition, Ihh levels were tripled in both 1 and 10 μM BPDP-treated limbs compared with control (Figure 5D). This difference in timing suggests that the increase in expression of the pathway ligand, Ihh, may be compensatory.
Figure 5.

The mRNA expression of 5 Hh target genes and the Hh ligand Ihh was assessed by quantitative reverse transcription-polymerase chain reaction. At both (A) 3 h and (C) 24 h, tert-butylphenyl diphenyl phosphate (BPDP) concentration-dependently downregulated the expression of Hh target genes. Meanwhile, Ihh levels were unaffected at (B) 3 h but tripled by (D) 24 h. Expression was normalized to Rpl8. Two-way ANOVA with Dunnett’s test; #p < .01 control versus 1 μM BPDP, †p < .01 control versus 10 μM BPDP; n = 5.
Interaction Between BPDP and the Hh Agonist Purmorphamine
Because BPDP appeared to act as an antagonist of Hh signaling, we explored its potential interactions with a known Hh agonist, purmorphamine. First, limb buds were cultured for 24 h in the presence of a range of concentrations of purmorphamine (0–100 nM), with or without the addition of 1 μM BPDP. The transcript levels of Gli1, the classical readout of Hh signaling activity, were assessed using qRT-PCR. Purmorphamine alone concentration-dependently increased Gli1 expression, verifying that it was acting as a Hh agonist in the limb bud culture model (Figure 6). BPDP alone, as expected, decreased Gli1 expression. When both chemicals were present, BPDP significantly altered the response of limbs to purmorphamine (F(3, 16) = 67.13, p < .0001). Although all 3 concentrations of purmorphamine tested were able to partially rescue Gli1 expression, they did so to a similar extent and Gli1 levels plateaued at approximately 76% of control (Figure 6). Nonetheless, cotreatment with 100 nM purmorphamine restored Gli1 expression to within 1.5-fold of control. As such, we selected 1 μM BPDP and 100 nM purmorphamine for our subsequent rescue studies.
Figure 6.
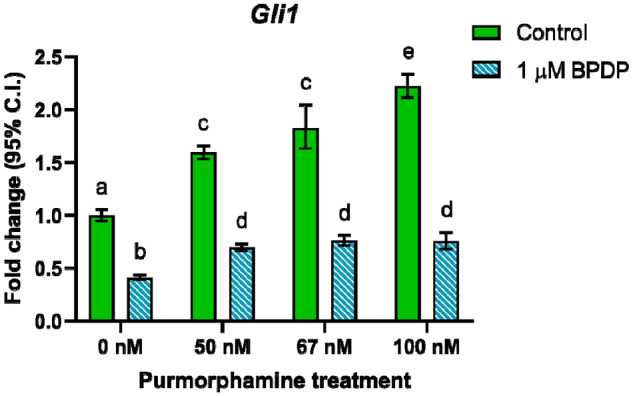
After exposure to vehicle, 1 μM tert-butylphenyl diphenyl phosphate (BPDP), and/or a range of concentrations of the Hh agonist purmorphamine, the mRNA expression of Gli1 was assessed by quantitative reverse transcription-polymerase chain reaction. Two-way ANOVA with Tukey’s post hoc test; different letters indicate statistical significance at p < .01; n = 3.
Purmorphamine treatment produced a recognizable phenotype that included a bent radius and ulna (Figure 7). In limbs cultured for 3 days, it shortened the zones of hypertrophy and ossification, as indicated by COL10A1-mCherry and COL1A1-YFP fluorescence. However, by day 6, purmorphamine-treated limbs had caught up to control limbs (Figure 1). Exposure of limbs to 1 µM BPDP for 6 days affected a range of endpoints, including cartilage template development and the length of the zones of hypertrophy and ossification (Figure 1). However, limbs treated with both BPDP and purmorphamine over the course of the 6-day culture more closely resembled control limbs, in contrast to those exposed to either purmorphamine or BPDP alone (Figure 7). Their cartilage template development was visually superior to that of BPDP-treated limbs and their radius and ulna were not bent as in the purmorphamine-treated limbs. The emergence and the expansion of the mCherry-positive hypertrophic chondrocyte population and the YFP-positive osteoblast population in the radius and the ulna were also similar to control limbs. Although the faint COL10A1-mCherry fluorescence observed in the digits of BPDP-treated limbs was not abolished by purmorphamine cotreatment, its intensity was consistently reduced (Supplementary Figure 3).
Figure 7.

Representative fluorescent photographs of gestation day 13 forelimbs cultured in presence of 100 nM purmorphamine or a combination of 1 μM tert-butylphenyl diphenyl phosphate (BPDP) and 100 nM purmorphamine on days 1, 3, and 6 of the 6-day culture period; n = 5.
To better compare the extent of cartilage template development on day 6, the ECFP-positive cartilage was assessed using a scoring system based on defined morphological criteria (Paradis et al., 2019). BPDP treatment significantly decreased the limb differentiation scores, compared with control, reflecting generally poorer development of the phalangeal cartilage (Figure 8A). However, when purmorphamine was also present, the limbs matched control limbs in terms of their cartilage template development.
Figure 8.

A, On day 6 of culture, the cyan fluorescent protein positive cartilage template of each limb was scored according to the extent of its morphological development. Scores were compared using Bonferroni-corrected Mann-Whitney U tests, *p < .05, n = 5. In addition, the length (B and D) and the width (C and E) of the radius and the ulna were measured to compare the overall growth of limbs. Two-way ANOVA with Tukey’s post hoc test; different letters indicate statistical significance at p < .05; n = 5.
To further assess the impact of purmorphamine on the effects of BPDP, we measured the length and the width of the radius and the ulna. BPDP exposure significantly reduced the length of both the radius and the ulna compared with control (Figs. 8B and 8D); purmorphamine alone produced a small increase in both. In contrast, the cotreated limbs were not statistically different from control. The width of the radius and the ulna were also determined by measuring the widest point of the zone of hypertrophy in the growth plate. BPDP-treated limbs had a significantly narrower radius and ulna compared with control; purmorphamine-treated and cotreated limbs were indistinguishable from control (Figs. 8C and 8E). Thus, purmorphamine significantly altered the outcome of BPDP exposure in both the radius and the ulna.
Previously, we demonstrated that BPDP exposure suppressed the upregulation of Runx2, a transcription factor essential for chondrocyte hypertrophy and early osteoblastogenesis, and Sp7, a transcription factor essential for the differentiation and function of mature osteoblasts, over the course of 48 h (Yan and Hales, 2019). Here, consistent with our earlier results, we found that limbs exposed to BPDP alone had lower transcript levels of Runx2 and Sp7 than control at 24 h (Figs. 9A and 9B). Purmorphamine similarly reduced Runx2 and Sp7 expression, though to a lesser extent. However, the effects of BPDP and purmorphamine were not additive; the interaction between BPDP and purmorphamine was significant for both Runx2 (F(1, 12) = 46.81, p < .0001) and Sp7 (F(1, 12) = 93.52, p < .0001). Cotreated limbs expressed more Runx2 and a similar level of Sp7 compared with those exposed to BPDP alone.
Figure 9.

The mRNA expressions of (A) Runx2 and (B) Sp7 were assessed by quantitative reverse transcription-polymerase chain reaction. Expression was normalized to Rpl8. Two-way ANOVA with Tukey’s post hoc test; different letters indicate statistical significance at p < .01; n = 5.
These results provide evidence that the Hh agonist purmorphamine can attenuate some of the detrimental effects of BPDP exposure on the developing limb bud and support the conclusion that the suppression of Ihh signaling contributes the negative impact of BPDP on endochondral ossification.
DISCUSSION
In the present study, we found that exposure to BPDP inhibited Hh signaling in exposed limb buds prior to appreciable morphological effects on endochondral ossification or other transcriptomic changes. When Hh signaling activity was partially restored using purmorphamine, some of the detrimental effects of BPDP, such as poorer cartilage template differentiation and reduced anlagen growth, were ameliorated. To our knowledge, this is the first demonstration that BPDP modulates the Hh signaling pathway in the context of bone formation and that this modulation contributes to its suppression of endochondral ossification.
Over the past 2 decades, the production of OPEs and their use as FRs have grown (Stapleton et al., 2012; van der Veen and de Boer, 2012). Their environmental levels are often an order of magnitude higher than those of legacy polybrominated diphenyl ethers (Cristale et al., 2016; Greaves et al., 2016; Salamova et al., 2014) and exposure to OPEs has increased in humans and wildlife (Hoffman et al., 2017; Venier et al., 2014). However, our toxicological knowledge of OPEs has yet to catch up.
Investigations into the potential effects of OPE exposure on the skeleton are very limited. Macari et al. (2020) reported that developmental exposure to Firemaster 550, a commercial FR mixture containing triphenyl phosphate (TPHP) and isopropylated triphenyl phosphate (IPPP), was detrimental to the skeletal health of adult male Wistar rats. Interestingly, increases in urinary OPE concentrations by one quartile were associated with a decrease in birth length z-scores in a recent pregnancy cohort study (Kuiper et al., 2020). Previously, we reported that several individual OPEs (BPDP, TPHP, IPPP, and tris[methylphenyl] phosphate) negatively impacted endochondral ossification in the mouse limb bud model (Yan and Hales, 2019). The current study is the first to characterize the Hh signaling pathway as a mediator of the toxicity of a predominant OPE, BPDP, on bone development.
The Hedgehog family of signaling molecules is key to the patterning and development of many organs (reviewed by Varjosalo and Taipale [2008]) and their homeostasis and regeneration in adulthood (reviewed by Petrova and Joyner [2014]). In mammals, there are 3 different Hedgehog ligands: Sonic hedgehog (SHH), Desert hedgehog (DHH), and Indian hedgehog (IHH) (Varjosalo and Taipale, 2008). These ligands bind the same cell surface receptor, Patched (PTCH), and share the downstream signaling mechanism. The binding of a Hh ligand to PTCH relieves the inhibitory effect that an unliganded PTCH has on the localization of Smoothened (SMO) to the primary cilium of the cell. The subsequent accumulation of SMO in the primary cilium and its activation then effect downstream changes that shift the post-translational processing of the GLI family of transcription factors. Unliganded PTCH favors the cleavage of GLI transcription factors into their repressor forms, which translocate to the nucleus and block the transcription of the Hh signaling pathway’s target genes. In the presence of Hh ligand, the activator form of GLI is favored, thus driving the transcription of these target genes (Varjosalo and Taipale, 2008). Mutations in IHH, the ligand particularly important for endochondral ossification, have been associated with skeletal dysplasias in humans (Byrnes et al., 2009; Hellemans et al., 2003).
Data from the Tox21 program also provide evidence that BPDP antagonizes Hh signaling; BPDP was classified as active in a NIH/3T3-based Gli1-Luciferase reporter assay used to screen for antagonists of the Shh pathway, with an AC50 (concentration at which 50% of the maximal response was achieved) of 4.75 µM (EPA, 2020). Though there has yet to be in vivo evidence that BPDP modulates Hh signaling, it is exciting that results from our limb bud culture model, which preserves the 3D structure of the tissue and coordination between multiple cell types, agree with data from the Tox21 fibroblast-based reporter assay. Interestingly, the Tox 21 screen for antagonists of the Shh pathway provided evidence that several other OPE FRs, including TPHP (AC50 = 8.59 µM), IPPP (AC50 = 15.7 µM), and tris(methylphenyl) phosphate (AC50 = 87.7 µM), are also antagonists of Hh signaling (EPA, 2020). These OPEs are also detrimental to endochondral ossification in the limb bud culture model (Yan and Hales, 2019). As such, attenuation of Hh signaling may represent a more general mechanism by which OPEs impact on bone formation.
The correct timing, location, and amount of Ihh signaling activity are important for endochondral ossification. Both complete and chondrocyte-specific knockout of Ihh in mice resulted in dwarfism at birth (Razzaque et al., 2005; St-Jacques et al., 1999). The most severely affected bones were in the limbs and their shortening was evident by as early as mid-gestation. Blocking Ihh activity in GD 12.5 mouse embryos with 5E1, an antibody against Hh, produced a milder form of dwarfism (Kim et al., 2013). The proper elongation of the cartilage anlage and the eventual length attained by the bone depend upon adequate chondrocyte proliferation, which is markedly reduced by the loss of Ihh (Razzaque et al., 2005; St-Jacques et al., 1999) or Smo (Long et al., 2001). On the other hand, overexpression of Ihh or a constitutively active form of Smo increases chondrocyte proliferation (Long et al., 2001). Purmorphamine can also promote the proliferation of human MSC-derived chondrocytes (Fischer et al., 2018). Consistent with this understanding of how modulating Ihh signaling activity affects chondrogenesis, BPDP, an inhibitor of Ihh signaling, limited the growth of the cartilage anlagen of exposed limb buds, whereas purmorphamine, a SMO agonist, had the opposite effect and successfully counteracted the negative impact of BPDP on cartilage development.
The literature on the effects of modulating Ihh signaling on chondrocyte maturation and osteogenesis is complicated. Either too little or too much Ihh signaling may be harmful. BPDP exposure reduced Runx2 and Sp7 expression at 24 h and shortened the zones of hypertrophy and ossification on day 6. This is consistent with a role for Ihh signaling as a positive regulator of chondrocyte maturation and osteogenesis. However, purmorphamine also decreased Runx2 and Sp7 expression at 24 h and shortened the zones of hypertrophy and ossification on day 3.
The negative effects of BPDP and purmorphamine on Runx2 and Sp7 expression were not additive in cotreated limbs; nonetheless, the expression of Runx2 and Sp7 was similar to that of the BPDP alone group. It is possible that 24 h is too early a time point for a full rescue to be observed. Another possibility is that chondrocyte maturation and osteoblast differentiation are more sensitive to inhibition of Hh signaling by 1 µM BPDP than chondrocyte proliferation, which was fully rescued by 100 nM purmorphamine. This is consistent with our observation that 100 nM purmorphamine did not return Gli1 expression to control levels in limbs that were cotreated (Figure 6).
In the future, it would be interesting to see if BPDP exposure has the potential to inhibit Hh signaling in vivo. In such a study, it would be paramount to examine skeletal development, but other endpoints would also be important because the role of Hh signaling extends beyond endochondral ossification. One or more Hh ligand is expressed in almost all tissues of the body and during development, these ligands operate during different windows of time (Varjosalo and Taipale, 2008). Modulation of the signaling pathway used by all 3 mammalian Hhs means that exposure to such a chemical has the potential to affect multiple tissues and organs. This makes Hh signaling an interesting target in the context of developmental toxicology.
SUPPLEMENTARY DATA
Supplementary data are available at Toxicological Sciences online.
DECLARATION OF CONFLICTING INTERESTS
The authors declared no potential conflicts of interest with respect to the research, authorship, and/or publication of this article.
FUNDING
Canadian Institutes of Health Research (CIHR) Institute for Population and Public Health team (FRN No. IP3‐150711); CIHR Project (FRN No. 156239); and the Réseau Québécois en reproduction (FQRNT-RQR), the Centre for Research in Reproduction and Development (CRRD), the Fonds de Recherche du Québec en Santé (FRQS), and the McGill University Faculty of Medicine and Department of Pharmacology and Therapeutics (to H.Y.).
Supplementary Material
ACKNOWLEDGMENTS
We thank Dr David L. Butler and Dr David Rowe for providing the reporter mice. We also thank Dr Heather M. Stapleton for providing BPDP. B.F.H. is a James McGill Professor.
REFERENCES
- Alzualde A., Behl M., Sipes N. S., Hsieh J. H., Alday A., Tice R. R., Paules R. S., Muriana A., Quevedo C. (2018). Toxicity profiling of flame retardants in zebrafish embryos using a battery of assays for developmental toxicity, neurotoxicity, cardiotoxicity and hepatotoxicity toward human relevance. Neurotoxicol. Teratol. 70, 40–50. [DOI] [PubMed] [Google Scholar]
- Behl M., Hsieh J. H., Shafer T. J., Mundy W. R., Rice J. R., Boyd W. A., Freedman J. H., Hunter E. S. 3rd, Jarema K. A., Padilla S., et al. (2015). Use of alternative assays to identify and prioritize organophosphorus flame retardants for potential developmental and neurotoxicity. Neurotoxicol. Teratol. 52, 181–193. [DOI] [PubMed] [Google Scholar]
- Byrnes A. M., Racacho L., Grimsey A., Hudgins L., Kwan A. C., Sangalli M., Kidd A., Yaron Y., Lau Y. L., Nikkel S. M., et al. (2009). Brachydactyly A-1 mutations restricted to the central region of the N-terminal active fragment of Indian Hedgehog. Eur. J. Hum. Genet. 17, 1112–1120. [DOI] [PMC free article] [PubMed] [Google Scholar]
- Carignan C. C., Mínguez-Alarcón L., Butt C. M., Williams P. L., Meeker J. D., Stapleton H. M., Toth T. L., Ford J. B., Hauser R.; EARTH Study Team. (2017). Urinary concentrations of organophosphate flame retardant metabolites and pregnancy outcomes among women undergoing in vitro fertilization. Environ. Health Perspect. 125, 087018. [DOI] [PMC free article] [PubMed] [Google Scholar]
- Cristale J., Hurtado A., Gómez-Canela C., Lacorte S. (2016). Occurrence and sources of brominated and organophosphorus flame retardants in dust from different indoor environments in Barcelona, Spain. Environ. Res. 149, 66–76. [DOI] [PubMed] [Google Scholar]
- Daughtrey W., Biles R., Jortner B., Ehrich M. (1996). Subchronic delayed neurotoxicity evaluation of jet engine lubricants containing phosphorus additives. Fundam. Appl. Toxicol. 32, 244–249. [DOI] [PubMed] [Google Scholar]
- EPA. (2020). The U.S. Environmental Protection Agency’s Chemistry Dashboard. Available at: https://comptox.epa.gov/dashboard. Accessed March 2, 2020.
- Fischer J., Knoch N., Sims T., Rosshirt N., Richter W. (2018). Time-dependent contribution of BMP, FGF, IGF, and HH signaling to the proliferation of mesenchymal stroma cells during chondrogenesis. J. Cell. Physiol. 233, 8962–8970. [DOI] [PubMed] [Google Scholar]
- Freudenthal R. I., Brandwene D., Clous W. (2001). A subchronic toxicity study of Phosflex 51B in Sprague-Dawley rats. Int. J. Toxicol. 20, 269–274. [DOI] [PubMed] [Google Scholar]
- Glazer L., Hawkey A. B., Wells C. N., Drastal M., Odamah K. A., Behl M., Levin E. D. (2018). Developmental exposure to low concentrations of organophosphate flame retardants causes life-long behavioral alterations in zebrafish. Toxicol. Sci. 165, 487–498. [DOI] [PMC free article] [PubMed] [Google Scholar]
- Greaves A. K., Letcher R. J., Chen D., McGoldrick D. J., Gauthier L. T., Backus S. M. (2016). Retrospective analysis of organophosphate flame retardants in herring gull eggs and relation to the aquatic food web in the Laurentian Great Lakes of North America. Environ. Res. 150, 255–263. [DOI] [PubMed] [Google Scholar]
- Guan Q., Tan H., Yang L., Liu X., Fiedler H., Li X., Chen D. (2019). Isopropylated and tert-butylated triarylphosphate isomers in house dust from South China and Midwestern United States. Sci. Total Environ. 686, 1113–1119. [DOI] [PubMed] [Google Scholar]
- Hellemans J., Coucke P. J., Giedion A., De Paepe A., Kramer P., Beemer F., Mortier G. R. (2003). Homozygous mutations in IHH cause acrocapitofemoral dysplasia, an autosomal recessive disorder with cone-shaped epiphyses in hands and hips. Am. J. Hum. Genet. 72, 1040–1046. [DOI] [PMC free article] [PubMed] [Google Scholar]
- Hoffman K., Butt C. M., Webster T. F., Preston E. V., Hammel S. C., Makey C., Lorenzo A. M., Cooper E. M., Carignan C., Meeker J. D., et al. (2017). Temporal trends in exposure to organophosphate flame retardants in the United States. Environ. Sci. Technol. Lett. 4, 112–118. [DOI] [PMC free article] [PubMed] [Google Scholar]
- Katoh Y., Katoh M. (2009). Hedgehog target genes: Mechanisms of carcinogenesis induced by aberrant hedgehog signaling activation. Curr. Mol. Med. 9, 873–886. [DOI] [PubMed] [Google Scholar]
- Kim E. J., Cho S. W., Shin J. O., Lee M. J., Kim K. S., Jung H. S. (2013). Ihh and Runx2/Runx3 signaling interact to coordinate early chondrogenesis: A mouse model. PLoS One 8, e55296. [DOI] [PMC free article] [PubMed] [Google Scholar]
- Kozhemyakina E., Lassar A. B., Zelzer E. (2015). A pathway to bone: Signaling molecules and transcription factors involved in chondrocyte development and maturation. Development 142, 817–831. [DOI] [PMC free article] [PubMed] [Google Scholar]
- Kuiper J. R., Stapleton H. M., Wills-Karp M., Wang X., Burd I., Buckley J. P. (2020). Predictors and reproducibility of urinary organophosphate ester metabolite concentrations during pregnancy and associations with birth outcomes in an urban population. Environ. Health 19, 55. [DOI] [PMC free article] [PubMed] [Google Scholar]
- Latendresse J. R., Brooks C. L., Capen C. C. (1995). Toxic effects of butylated triphenyl phosphate-based hydraulic fluid and tricresyl phosphate in female F344 rats. Vet. Pathol. 32, 394–402. [DOI] [PubMed] [Google Scholar]
- Latendresse J. R., Brooks C. L., Flemming C. D., Capen C. C. (1994). Reproductive toxicity of butylated triphenyl phosphate and tricresyl phosphate fluids in F344 rats. Fundam. Appl. Toxicol. 22, 392–399. [DOI] [PubMed] [Google Scholar]
- Long F., Ornitz D. M. (2013). Development of the endochondral skeleton. Cold Spring Harb. Perspect. Biol. 5, a008334. [DOI] [PMC free article] [PubMed] [Google Scholar]
- Long F., Zhang X. M., Karp S., Yang Y., McMahon A. P. (2001). Genetic manipulation of hedgehog signaling in the endochondral skeleton reveals a direct role in the regulation of chondrocyte proliferation. Development 128, 5099–5108. [DOI] [PubMed] [Google Scholar]
- Love M. I., Huber W., Anders S. (2014). Moderated estimation of fold change and dispersion for RNA-seq data with DESeq2. Genome Biol. 15, 550. [DOI] [PMC free article] [PubMed] [Google Scholar]
- Macari S., Rock K. D., Santos M. S., Lima V. T. M., Szawka R. E., Moss J., Horman B., Patisaul H. B. (2020). Developmental exposure to the flame retardant mixture Firemaster 550 compromises adult bone integrity in male but not female rats. Int. J. Mol. Sci. 21, 2553. [DOI] [PMC free article] [PubMed] [Google Scholar]
- Maye P., Fu Y., Butler D. L., Chokalingam K., Liu Y., Floret J., Stover M. L., Wenstrup R., Jiang X., Gooch C., et al. (2011). Generation and characterization of Col10a1-mcherry reporter mice. Genesis 49, 410–418. [DOI] [PMC free article] [PubMed] [Google Scholar]
- Neubert D., Barrach H. J. (1977). Techniques applicable to study morphogenetic differentiation of limb buds in organ culture In Methods in Pre-Natal Toxicology (Neubert D., Merker H.-J., Kwasigroch T., Eds.), pp. 241–251. Georg Thieme, Stuttgart, Germany. [Google Scholar]
- Paradis F. H., Yan H., Huang C., Hales B. F. (2019). The murine limb bud in culture as an in vitro teratogenicity test system. Methods Mol. Biol. 1965, 73–91. [DOI] [PubMed] [Google Scholar]
- Petrova R., Joyner A. L. (2014). Roles for Hedgehog signaling in adult organ homeostasis and repair. Development 141, 3445–3457. [DOI] [PMC free article] [PubMed] [Google Scholar]
- Phillips A. L., Hammel S. C., Hoffman K., Lorenzo A. M., Chen A., Webster T. F., Stapleton H. M. (2018). Children’s residential exposure to organophosphate ester flame retardants and plasticizers: investigating exposure pathways in the TESIE study. Environ. Int. 116, 176–185. [DOI] [PMC free article] [PubMed] [Google Scholar]
- Phillips A. L., Hammel S. C., Konstantinov A., Stapleton H. M. (2017). Characterization of individual isopropylated and tert-butylated triarylphosphate (ITP and TBPP) isomers in several commercial flame retardant mixtures and house dust standard reference material SRM 2585. Environ. Sci. Technol. 51, 13443–13449. [DOI] [PMC free article] [PubMed] [Google Scholar]
- Razzaque M. S., Soegiarto D. W., Chang D., Long F., Lanske B. (2005). Conditional deletion of Indian hedgehog from collagen type 2alpha1-expressing cells results in abnormal endochondral bone formation. J. Pathol. 207, 453–461. [DOI] [PubMed] [Google Scholar]
- Salamova A., Ma Y., Venier M., Hites R. A. (2014). High levels of organophosphate flame retardants in the Great Lakes atmosphere. Environ. Sci. Technol. Lett. 1, 8–14. [Google Scholar]
- Schang G., Robaire B., Hales B. F. (2016). Organophosphate flame retardants act as endocrine-disrupting chemicals in MA-10 mouse tumor Leydig cells. Toxicol. Sci. 150, 499–509. [DOI] [PubMed] [Google Scholar]
- Stapleton H. M., Sharma S., Getzinger G., Ferguson P. L., Gabriel M., Webster T. F., Blum A. (2012). Novel and high volume use flame retardants in US couches reflective of the 2005 PentaBDE phase out. Environ. Sci. Technol. 46, 13432–13439. [DOI] [PMC free article] [PubMed] [Google Scholar]
- St-Jacques B., Hammerschmidt M., McMahon A. P. (1999). Indian hedgehog signaling regulates proliferation and differentiation of chondrocytes and is essential for bone formation. Genes Dev. 13, 2072–2086. [DOI] [PMC free article] [PubMed] [Google Scholar]
- van der Veen I., de Boer J. (2012). Phosphorus flame retardants: properties, production, environmental occurrence, toxicity and analysis. Chemosphere 88, 1119–1153. [DOI] [PubMed] [Google Scholar]
- Varjosalo M., Taipale J. (2008). Hedgehog: Functions and mechanisms. Genes & Dev 22, 2454–2472. [DOI] [PubMed] [Google Scholar]
- Venier M., Dove A., Romanak K., Backus S., Hites R. (2014). Flame retardants and legacy chemicals in Great Lakes’ water. Environ. Sci. Technol. 48, 9563–9572. [DOI] [PubMed] [Google Scholar]
- Vykoukalová M., Venier M., Vojta Š., Melymuk L., Bečanová J., Romanak K., Prokeš R., Okeme J. O., Saini A., Diamond M. L., et al. (2017). Organophosphate esters flame retardants in the indoor environment. Environ. Int. 106, 97–104. [DOI] [PubMed] [Google Scholar]
- Yan H., Hales B. F. (2019). Effects of organophosphate ester flame retardants on endochondral ossification in ex vivo murine limb bud cultures. Toxicol. Sci. 168, 420–429. [DOI] [PubMed] [Google Scholar]
- Yu G., Wang L., Han Y., He Q. (2012). clusterProfiler: An R package for comparing biological themes among gene clusters. Omics 16, 284–287. [DOI] [PMC free article] [PubMed] [Google Scholar]
Associated Data
This section collects any data citations, data availability statements, or supplementary materials included in this article.