

Abstract
The purposes of this study were to examine the relationships between dynamic strength index (DSI) and other strength-power performance characteristics and to contextualize DSI scores using case study comparisons. 88 male and 67 female NCAA division I collegiate athletes performed countermovement jumps (CMJ) and isometric mid-thigh pulls (IMTP) during a pre-season testing session as part of a long-term athlete monitoring program. Spearman’s correlations were used to assess the relationships between DSI and CMJ peak force, height, modified reactive strength index, peak power and IMTP peak force and rate of force development (RFD). Very large relationships existed between DSI and IMTP peak force (r = -0.848 and -0.746), while small-moderate relationships existed between DSI and CMJ peak force (r = 0.297 and 0.313), height (r = 0.108 and 0.167), modified reactive strength index (r = 0.174 and 0.274), and IMTP RFD (r = -0.341 and -0.338) for men and women, respectively. Finally, relationships between DSI and CMJ peak power were trivial-small for male (r = 0.008) and female athletes (r = 0.191). Case study analyses revealed that despite similar DSI scores, each athlete’s percentile rankings for each variable and CMJ force-time characteristics were unique, which may suggest different training emphases are needed. Based on the explained variance, an athlete’s IMTP performance may have a larger influence on their DSI score compared to the CMJ. DSI scores should be contextualized using additional performance data to ensure each individual athlete receives the appropriate training stimulus during different training phases throughout the year.
Key words: countermovement jump; isometric mid-thigh pull, strength; peak power; rate of force development; reactive strength index-modified
Introduction
A variety of dynamic and isometric tests may be used to monitor an athlete’s fitness characteristics throughout the training year. In order to minimize the disruptions to an athlete’s training program, it is important to select tests that can accurately assess an athlete’s fitness characteristics in an abbreviated amount of time and provide the most valuable information related to sport performance. Two performance tests that have been commonly used within athlete testing batteries are the countermovement jump (CMJ) (McMahon et al., 2018), and isometric mid-thigh pull (IMTP) (Comfort et al., 2019; Stone et al., 2019). These tests may provide insight on the eccentric, concentric, and isometric force production characteristics of an athlete and aid practitioners in designing future training phases. Commonly, practitioners attempt to increase the diagnostic value of data obtained from these tests through the use of composite scores or indexes. For example, by comparing peak force (PF) during the dynamic vertical jump and static isometric test, practitioners can calculate a variable termed dynamic strength index (DSI), which has been used as a diagnostic guide to address training emphasis (Sheppard et al., 2011).
The DSI is calculated as the ratio of ballistic PF, usually assessed by a vertical jump, and isometric PF (Comfort et al., 2018a). Researchers have reported that DSI is reliable and can be assessed during both lower (McMahon et al., 2017; Thomas et al., 2017) and upper body (Young et al., 2014) exercises in athletes. Previous research indicated that DSI may different between collegiate athletic teams (Thomas et al., 2017) as well as those that possess unique CMJ temporal phase characteristics (McMahon et al., 2017). Given that DSI may provide insight on an athlete’s strengths and weaknesses regarding force production, it is interesting that limited research has examined the relationships between DSI and other strength-power performance variables. Secomb et al. (2015) found trivial to small relationships between DSI and a variety of performance variables, with the exception of moderate to very large relationships with CMJ peak velocity and IMTP absolute and relative PF with adolescent male surfing athletes. To the authors’ knowledge, no research has examined the relationships between DSI and strength-power performance variables in collegiate male and female athletes. In order to provide further insight into how different DSI scores relate to strength-power performance characteristics, further research appears to be warranted.
Beyond the relationships with other performance variables, it is important to understand the efficacy of using DSI as a diagnostic training guide for athletes. Previously, authors have suggested that athletes with DSI scores of ≤ 0.60 may benefit most from ballistic training since they are only able to produce 60% of their maximal isometric force during a jump (Sheppard et al., 2011). In contrast, athletes with DSI scores of ≥ 0.80 may benefit most from gaining maximal strength because 80% of their isometric PF is being produced during a jump. Although researchers have shown that high DSI scores may be lowered following strength training (Comfort et al., 2018b; Sheppard et al., 2011), it is important to contextualize an athlete’s performance using other performance parameters that relate to superior sport performance (e.g. relative strength, CMJ height, rate of force development (RFD), relative peak power (PP), etc.) (Suchomel et al., 2019). By doing so, practitioners should be able to make more informed training decisions so that their athletes optimize their performance. The purpose of this study was twofold: first, to examine the relationships between DSI and other strength-power performance characteristics and second, to contextualize DSI scores using case study comparisons between select athletes.
Methods
Design
A correlational approach was used to examine the relationships between DSI and other common performance variables within Division I National Collegiate Athletic Association (NCAA) athletes during pre-season testing. In addition, direct comparisons between select athletes using case study analyses were completed to contextualize the DSI training prescription recommendations by including additional performance data. Athletes took part in a single testing session as part of an ongoing athlete monitoring program where they performed both CMJ and IMTP testing. Each athlete was tested during their pre-season phase of training.
Participants (Athletes)
88 male and 67 female Division I collegiate athletes participated in this study as part of an ongoing long-term athlete monitoring program. The male athletes competed in baseball (n: 36, body mass: 85.5 ± 9.9 kg, height: 181.5 ± 6.0 cm), soccer (n: 24, body mass: 77.9 ± 8.9 kg, height: 179.3 ± 6.9 cm), tennis (n: 10, body mass: 74.1 ± 8.2 kg, height: 177.1 ± 8.1 cm), basketball (n: 10, body mass: 90.4 ± 12.2 kg, height: 189.1 ± 6.5 cm), and track and field (n: 8, body mass: 83.8 ± 18.1 kg, height: 184.8 ± 8.3 cm). The female athletes competed in volleyball (n: 18, body mass: 69.8 ± 7.3 kg, height: 173.8 ± 7.1 cm), soccer (n: 25, body mass: 65.4 ± 9.4 kg, height: 166.8 ± 4.9 cm), softball (n: 16, body mass: 69.5 ± 8.8 kg, height: 166.6 ± 7.7 cm), and track and field (n: 8, body mass: 61.5 ± 5.6 kg, height: 167.4 ± 8.8 cm). All athletes were between the ages of 18-23 years old. This retrospective analysis was approved by the University’s institutional review board.
Testing
After arriving to the sport science laboratory, each athlete completed a standardized warm-up that consisted of 20 jumping jacks, five mid-thigh pull repetitions with a 20 kg barbell, and three sets of five repetitions with 40 kg for women or 60 kg for men. Following the warm-up, each athlete completed CMJ testing as previously described (Suchomel et al., 2015). Briefly, the athletes performed two warm-up CMJs at 50 and 75% of their perceived maximum effort. After a brief rest period, athletes performed two maximum effort CMJs with a 60 s rest interval. The athletes were instructed to perform each jump as fast and as high as possible while holding a polyvinyl chloride (PVC) pipe held on their upper back (e.g. high bar back squat position). Prior to each CMJ, the athletes stood motionless before receiving the countdown “3, 2, 1, jump!” Upon hearing the countdown, the athlete performed a countermovement to a self-selected depth and then jumped with maximal effort.
Following a short rest interval (< 5 min), the athletes performed the IMTP. First, the athletes stepped into a customized IMTP rig that allowed for personalized bar heights. Athletes were placed in a position that resembled the 2nd pull position of the clean. To ensure that the individual was in the proper position, their knee and hip angles were measured using manual goniometers. In accordance with recent standardized IMTP guidelines (Comfort et al., 2019), athletes used a position that consisted of an upright torso, the barbell positioned on the upper portion of the thigh, elbows fully extended, and knee and hip angles ranging from 1250-1350 and 1400-1500, respectively. After achieving the appropriate starting position, each athlete performed two submaximal IMTP efforts at 50 and 75% of their perceived maximum effort interspersed by one minute. Following the 75% warm-up, athletes were given final instructions before performing their first maximal effort IMTP repetition. Prior to each IMTP maximal effort, athletes were instructed to perform the movement “as fast and as hard as possible”. Briefly, each athlete assumed the starting position and produced some pre-tension by removing the slack from their arms and pushing their thighs into the immovable bar. After a stable level of pre-tension was visually identified, the athletes received a countdown of “3, 2, 1, pull!” Upon hearing the countdown, the athletes performed a maximum effort IMTP trial that lasted for approximately 5 s. The athletes completed two maximal effort trials; however, if the difference in PF between the trials was greater than 250 N, a third trial was performed. Strong verbal encouragement was provided during each trial.
Measures
All CMJ, and IMTP trials were performed on dual force platforms (2 separate 45.5 x 91 cm force plates, Rough Deck HP, Rice Lake, WI, USA) sampling at 1000 Hz. To reduce signal noise, the force-time data were digitally filtered using a 4th order low-pass Butterworth filter at 40 Hz (Sole et al., 2018a). Each trial was collected and analyzed using a customized LabView program (2010 version, National Instruments, Austin, TX, USA). CMJ height was determined using the estimated flight time of the center of mass (COM) using previously discussed methods (Moir, 2008). CMJ PF was identified as the greatest force produced during the propulsion phase of the jump (identified as COM velocity > 0.01 m · s-1). Power-time data were calculated by multiplying the force and velocity produced at each time point. PP was then identified as the greatest propulsion power magnitude. Time to takeoff was identified from the force-time record of each jump as the length of time between the initiation of the unweighting phase and take-off (both identified using a 10 N threshold) (Sole et al., 2018b). Modified reactive strength index was then calculated as the ratio between jump height and time to takeoff (Suchomel et al., 2015). Time-normalized force-time and displacement-time curves were generated using previously described methods (Suchomel et al., 2020). PF during the IMTP was identified as the greatest force produced following the initiation of the IMTP (visually identified as the first increase in force following the pre-tension phase of the movement) (Beckham et al., 2018). The rate of force development at 200 ms was calculated as the change in force from the initiation of the pull to the force produced at 200 ms divided by the change in time (i.e. 0.2 s). It should be noted that this time interval was chosen because previous research has shown that 200 ms corresponds to the approximate length of the net impulse during the CMJ (Sole et al., 2018a). PF during the CMJ and IMTP, as well as CMJ PP, were ratio-scaled by dividing each variable by the athletes’ body mass. Finally, DSI was calculated as the ratio of CMJ PF to IMTP PF (Comfort et al., 2018a).
Case Study Analyses
Two separate case study comparisons were analyzed by selecting two male and two female athletes who had similar DSI scores. The purpose of conducting these analyses was to contextualize the DSI training recommendations for each athlete. The male athletes within the first case study included a track and field sprinter/jumper and a basketball forward (Table 4). The female athletes within the second case study included two volleyball hitters (Table 5). In addition to body mass and height, all CMJ, IMTP, and DSI data detailed above were included within these comparisons. Furthermore, time-normalized CMJ force-time and displacement-time curves were included for visual comparison of jumping characteristics and strategy.
Table 4.
Male athlete dynamic strength index (DSI) case study.
| Male Athlete 1 | Male Athlete 2 | |||
|---|---|---|---|---|
| Track and Field | Basketball | |||
| Variable | Sprinter / Jumper | Forward | ||
| Magnitude | Percentile | Magnitude | Percentile | |
| Body mass (kg) | 67.9 | - | 107.7 | - |
| Height (cm) | 173.0 | - | 194.0 | - |
| DSI | 0.70 | 90th | 0.68 | 90th |
| CMJ PF (N · kg-1) | 28.8 | 90th | 24.6 | 60th |
| CMJ height (cm) | 49.0 | 90th | 37.5 | 50th |
| RSImod | 0.54 | 90th | 0.55 | 90th |
| CMJ PP (W · kg-1) | 66.1 | 80th | 56.2 | 40th |
| IMTP PF (N · kg-1) | 41.4 | < 10th | 36.2 | < 10th |
| IMTP RFD (N · s-1) | 8291.3 | 40th | 9810.8 | 70th |
CMJ = countermovement jump; PF = peak force; RSImod = modified reactive strength index; PP = peak power; IMTP = isometric mid-thigh pull; RFD = rate of force development
Table 5.
Female athlete dynamic strength index (DSI) case study.
| Female Athlete 1 | Female Athlete 2 | |||
|---|---|---|---|---|
| Variable | Volleyball | Volleyball | ||
| Outside Hitter | Middle Blocker / Right Side Hitter | |||
| Magnitude | Percentile | Magnitude | Percentile | |
| Body mass (kg) | 84.8 | - | 70.1 | - |
| Height (cm) | 179.0 | - | 181.0 | - |
| DSI | 0.46 | 30th | 0.45 | 30th |
| CMJ PF (N · kg-1) | 25.7 | 90th | 20.4 | 10th |
| CMJ height (cm) | 33.7 | 80th | 25.4 | 30th |
| RSImod | 0.47 | 90th | 0.28 | 20th |
| CMJ PP (W · kg-1) | 52.2 | 80th | 43.0 | 40th |
| IMTP PF (N · kg-1) | 55.4 | 90th | 44.9 | 50th |
| IMTP RFD (N · s-1) | 9125.5 | 90th | 5778.9 | 50th |
CMJ = countermovement jump; PF = peak force; RSImod = modified reactive strength index; PP = peak power; IMTP = isometric mid-thigh pull; RFD = rate of force development
Statistical Analyses
Normality of the performance data was examined using the Shapiro-Wilk test. Test-retest relative and absolute reliability of the CMJ and IMTP test variables was assessed using two-way mixed intraclass correlation coefficients (ICC) and typical error expressed as a coefficient of variation percentage (Hopkins et al., 2009), respectively. The relationships between DSI and the other performance variables for both male and female athletes were examined using Spearman’s rho correlation coefficients. The magnitude of each relationship was interpreted as trivial, small, moderate, large, very large, and nearly perfect when the values ranged from 0.00-0.09, 0.10-0.29, 0.30-0.49, 0.50-0.69, 0.70-0.89, and 0.90-1.00, respectively (Hopkins et al., 2009). Male and female data scales were constructed using percentile rank (Table 3). All statistical tests were performed using SPSS 25 (IBM, Armonk, NY, USA) and statistical significance was identified at an alpha level of 0.05.
Table 3.
Male (M) and female (F) countermovement jump (CMJ), isometric mid-thigh pull (IMTP), and dynamic strength index (DSI) descriptive and percentile statistics.
| CMJ PF (N · | kg-1) | CMJ height (cm) | RSImod (ratio) | CMJ PP (W · | kg-1) | IMTP PF (N · | kg-1) | IMTP (N · | RFD s-1) | DSI (ratio) | ||||
|---|---|---|---|---|---|---|---|---|---|---|---|---|---|---|
| M | F | M | F | M | F | M | F | M | F | M | F | M | F | |
| Mean | 24.0 | 22.4 | 36.7 | 28.0 | 0.44 | 0.34 | 56.5 | 45.4 | 52.1 | 45.2 | 8497 | 5569 | 0.47 | 0.51 |
| SD | 2.3 | 2.2 | 6.5 | 5.8 | 0.09 | 0.09 | 8.0 | 6.6 | 8.4 | 6.9 | 3172 | 1792 | 0.08 | 0.08 |
| 10th % | 21.5 | 19.9 | 28.2 | 20.3 | 0.32 | 0.22 | 46.4 | 37.8 | 42.0 | 35.8 | 4373 | 3112 | 0.38 | 0.43 |
| 20th % | 21.9 | 20.5 | 30.8 | 22.6 | 0.35 | 0.26 | 49.5 | 40.0 | 45.4 | 38.9 | 5810 | 3951 | 0.41 | 0.44 |
| 30th % | 22.5 | 20.8 | 32.9 | 25.0 | 0.37 | 0.29 | 51.8 | 41.7 | 47.4 | 41.7 | 6662 | 4658 | 0.43 | 0.45 |
| 40th % | 23.4 | 21.8 | 34.8 | 26.2 | 0.41 | 0.31 | 55.0 | 43.0 | 48.7 | 43.9 | 7506 | 5228 | 0.44 | 0.47 |
| 50th % | 24.2 | 22.4 | 36.4 | 27.0 | 0.44 | 0.34 | 56.4 | 44.4 | 50.8 | 44.9 | 8620 | 5518 | 0.46 | 0.49 |
| 60th % | 24.5 | 23.2 | 38.9 | 29.3 | 0.47 | 0.36 | 58.6 | 46.1 | 54.2 | 47.0 | 9414 | 5827 | 0.48 | 0.50 |
| 70th % | 24.9 | 23.8 | 40.4 | 31.9 | 0.49 | 0.38 | 60.0 | 48.8 | 56.6 | 48.4 | 9810 | 6229 | 0.51 | 0.55 |
| 80th % | 25.4 | 24.2 | 42.5 | 33.3 | 0.51 | 0.40 | 62.5 | 52.1 | 59.5 | 51.9 | 11280 | 6976 | 0.54 | 0.59 |
| 90th % | 26.8 | 24.6 | 43.4 | 35.0 | 0.54 | 0.44 | 66.2 | 54.6 | 63.8 | 53.4 | 13085 | 8004 | 0.57 | 0.62 |
PF = peak force; RSImod = modified reactive strength index; PP = peak power; RFD = rate of force development; SD = standard deviation; 10th % = 10th percentile
Results
The ICC values for each of the examined variables ranged from 0.93-0.98 and 0.87-0.98 for men and women, respectively. Except for RFD, typical error values ranged from 2.7-7.2% and 3.07.6% for men and women, respectively. RFD typical error values were 21.9% and 20.4%.
Relationships with Performance Outcomes
Correlation matrices for men and women are displayed in Tables 1 and 2, respectively. In addition, Table 3 displays the mean, standard deviation, and percentiles for each of the examined variables for both men and women. Statistically significant relationships existed between DSI and CMJ PF (r = 0.297, p = 0.005), RSImod (r = 0.174, p = 0.024), IMTP PF (r = -0.848, p < 0.001), and IMTP RFD (r = -0.341, p = 0.001), but not for CMJ height (r = 0.108, p = 0.315) or PP (r = 0.008, p = 0.941) for male athletes. Similarly, statistically significant relationships existed between DSI and CMJ PF (r = 0.313, p = 0.010), RSImod (r = 0.274, p = 0.025), IMTP PF (r = -0.746, p < 0.001), and IMTP RFD (r = -0.338, p = 0.005), but not for CMJ height (r = 0.167, p = 0.177) or PP (r = 0.191, p = 0.122) for female athletes.
Table 1.
Male relationships between dynamic strength index (DSI) and other countermovement jump (CMJ) and isometric mid-thigh pull (IMTP) performance variables.
| CMJ PF | CMJ height | RSImod | CMJ PP | IMTP PF | IMTP RFD | DSI | |
|---|---|---|---|---|---|---|---|
| CMJ PF | - | ||||||
| CMJ height | 0.551 | - | |||||
| RSImod | 0.754 | 0.842 | - | ||||
| CMJ PP | 0.461 | 0.779 | 0.597 | - | |||
| IMTP PF | 0.202 | 0.174 | 0.130 | 0.229 | - | ||
| IMTP RFD | 0.100 | 0.199 | 0.137 | 0.152 | 0.406 | - | |
| DSI | 0.297 | 0.108 | 0.240 | 0.008 | -0.848 | -0.341 | - |
Bold and italicized magnitudes indicate a statistically significant correlation (p < 0.04). PF = peak force; RSImod = modified reactive strength index; PP = peak power; RFD = rate of force development
Table 2.
Female relationships between dynamic strength index (DSI) and other countermovement jump (CMJ) and isometric mid-thigh pull (IMTP) performance variables.
| CMJ PF | CMJ height | RSImod | CMJ PP | IMTP PF | IMTP RFD | DSI | |
|---|---|---|---|---|---|---|---|
| CMJ PF | - | ||||||
| CMJ height | 0.520 | - | |||||
| RSImod | 0.709 | 0.889 | - | ||||
| CMJ PP | 0.576 | 0.830 | 0.836 | - | |||
| IMTP PF | 0.341 | 0.181 | 0.193 | 0.191 | - | ||
| IMTP RFD | 0.089 | 0.149 | 0.115 | 0.109 | 0.411 | - | |
| DSI | 0.313 | 0.167 | 0.274 | 0.191 | -0.746 | -0.338 | - |
Bold and italicized magnitudes indicate a statistically significant correlation (p < 0.03). PF = peak force; RSImod = modified reactive strength index; PP = peak power; RFD = rate of force development
DSI Case Study 1
The performance comparison and CMJ force-time comparison are displayed in Table 4 and Figure 1A, respectively. The DSI scores for Athlete 1 and 2 were the 2nd highest and the highest, respectively. Athlete 1 consistently ranked within the 80th and 90th percentiles except for IMTP PF and IMTP RFD. In contrast, Athlete 2 ranked within a wide variety of percentiles, depending on the variable (e.g. lowest IMTP PF and 90th percentile for RSImod). In the CMJ, the time to takeoff duration was longer for Athlete 1 (0.901 s) compared to Athlete 2 (0.680 s). Athlete 1 displayed a large peak force during the braking phase as well as a large drop in force when transitioning to the propulsion phase. In contrast, Athlete 2 displayed a smaller drop in force when transitioning from the braking phase to the propulsion phase; however, this occurred while using a visibly shorter displacement during the countermovement.
Figure 1.
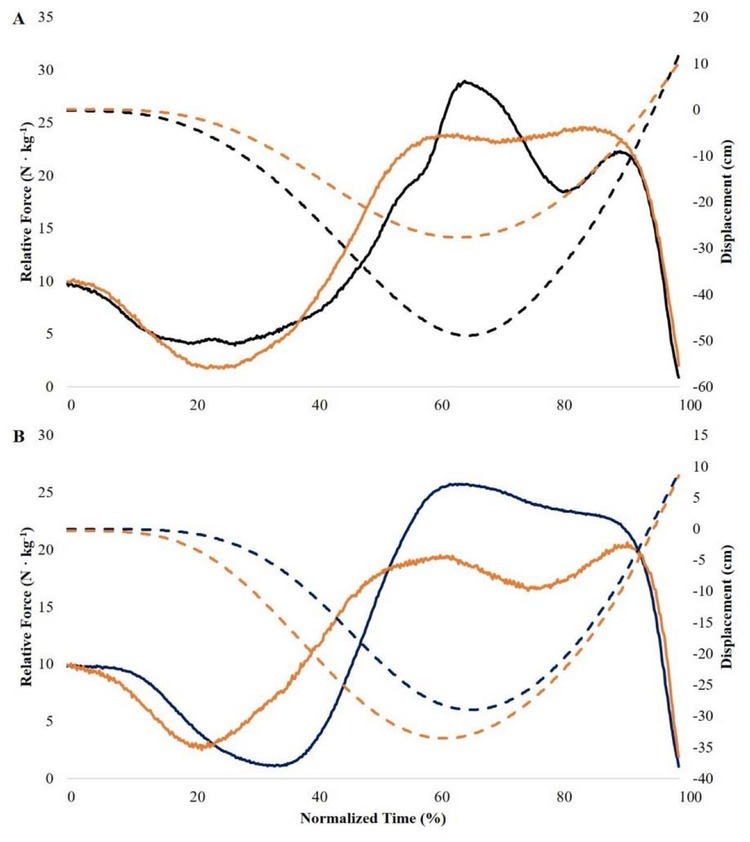
Time-normalized force-time and displacement-time curve comparison between two male (A) and two female (B) athletes with similar dynamic strength index magnitudes. Blue solid line = Athlete 1 force; blue dashed line = Athlete 1 displacement; Orange solid line = Athlete 2 force; orange dashed line = Athlete 2 displacement
DSI Case Study 2
The female athlete performance comparison and CMJ force-time comparison are displayed in Table 5 and Figure 1B, respectively. Apart from DSI, Athlete 1 ranked within the 80th and 90th percentiles for all the other performance variables. In contrast, Athlete 2 ranked no higher than the 50th percentile for any of the performance variables. In addition, the time to takeoff of Athlete 1 (0.722 s) was shorter than Athlete 2 (0.893 s). The force-time curve comparison showed that despite similar slopes during the unweighting phase, Athlete 1 appeared to produce a steeper slope during the braking phase which is indicative of greater eccentric RFD. In addition, Athlete 1 produced greater braking and propulsion forces than Athlete 2. Finally, Athlete 1 may have had a shorter displacement during their CMJ compared to Athlete 2.
Discussion
The purpose of this study was to examine the relationships between DSI and other commonly monitored performance variables and to contextualize DSI scores using case study analyses. Our results showed that DSI has very large and moderate negative relationships with IMTP PF and RFD, small to moderate relationships with CMJ PF and RSImod, and trivial relationships with CMJ height and PP in both male and female athletes. In addition, both case study analyses displayed the importance of contextualizing similar DSI scores by including other CMJ and IMTP performance variables and time-normalized force-time and displacement-time curves.
An interesting finding of the current study are differences in the magnitude of the relationships between DSI and both CMJ and IMTP PF. The current study showed that very large negative relationships existed between DSI and IMTP PF for both the male and female athletes. In contrast, small positive relationships were present between DSI and CMJ PF for both the men and women. Considering that 71.9% and 55.7% of the DSI variance is explained by IMTP PF while only 8.8% and 9.8% is explained by CMJ PF for men and women, respectively, it appears that isometric strength is a significant factor that may ultimately determine an athlete’s DSI. Therefore, it is important that athletes are familiarized with testing procedures given that several studies have shown that body position can have a significant effect on IMTP PF (Beckham et al., 2018). Moreover, these results emphasize the importance of developing muscular strength (Suchomel et al., 2018; Suchomel et al., 2016a). It should be noted that the correlations between DSI and IMTP PF are similar to those reported in previous research (Secomb et al., 2015), but in contrast regarding CMJ PF. This contrast is likely since the previous study calculated DSI using absolute values of PF for both the CMJ and IMTP, whereas the current study ratio scaled the PF magnitudes of both tests. These findings stipulate the importance of consistently using the same methodology when calculating DSI and other performance variables.
Previous literature has indicated that RFD and power development are two of the most influential fitness characteristics that can be developed (Cormie et al., 2011; Stone et al., 2019; Suarez et al., 2019; Suchomel et al., 2016a). Similarly, RSImod has been classified as an explosive strength characteristic (Kipp et al., 2016), an indicator of stretch-shortening cycle efficiency (Suchomel et al., 2016b), and has displayed moderate to large relationships with RFD and PP (Beckham et al., 2019; Suchomel et al., 2015). Given the potential influence that the above characteristics may have on sport performance, it would appear beneficial to increase the magnitudes of each characteristic. Therefore, if DSI may provide an indication of higher or lower RFD, PP, and RSImod magnitudes, practitioners may use this information to improve training programs. The results of the current study showed moderate negative, trivial, and small positive relationships existed between DSI and RFD, PP, and RSImod, respectively, for both male and female athletes. The moderate negative relationship between DSI and RFD suggests that as athletes increase their DSI by increasing ballistic force production, their RFD may decrease. Given that very little variance is explained by isometric RFD (~11.5%), this finding should be interpreted with caution since both ballistic training and maximal strength work may improve RFD characteristics (Aagaard et al., 2002; Andersen and Aagaard, 2006; Suarez et al., 2019; Suchomel et al., 2018). Due to the interplay between muscular strength and ballistic performance (Stone et al., 1981; Zamparo et al., 2002), it is not surprising that a trivial relationship existed between DSI and PP. Because similar magnitudes of PP may be developed with any combination of high and/or low force or velocity, it is important to determine whether each individual athlete is considered more force-dominant or velocity-dominant. Using this information individualized training programs may be developed to further improve an athlete’s performance.
Previous literature has suggested that athletes with a DSI of ≤ 0.60 may benefit more from ballistic training, while athletes with a DSI of ≥ 0.80 may benefit more from maximal strength training (Sheppard et al., 2011). The average male and female athlete within the current study had DSI scores of 0.47 and 0.51, respectively. Based on the previous DSI training recommendations, the average male and female athlete would benefit from additional ballistic training; however, as previously noted, it is important to consider the previous recommendations on an individual basis to determine the appropriate training prescription. Furthermore, it is important to use the information available from different performance tests, in addition to the DSI information, to provide the best overall prescription for each athlete (Suchomel et al., 2019). Within the current study, case studies were used to illustrate the importance of individualized training prescriptions based on similar DSI scores. In order to do this, evaluation of DSI data was supplemented using normative data (percentile rankings) of CMJ and IMTP performance data within a large sample of athletes of the same sex as well as a time-normalized CMJ force-time and displacement-time curve comparison. The current case studies revealed unique athlete profiles despite the existence of similar DSI scores. This suggests that the needs of each athlete may not be as similar as originally indicated.
Results of the male athlete case study comparison showed that although Athlete 1 was consistently ranked in the 80th and 90th percentiles, other variables suggest that they could improve their performance by increasing maximal strength and RFD characteristics. Similarly, Athlete 2 could benefit from improving their maximal strength; however, they may also benefit from ballistic strength training. Each athlete also displayed unique force-time characteristics during their CMJ. Considering the markedly different normalized force-time curves, we can assume that each athlete used a different jumping strategy to achieve their jump height as evidenced by their displacement-time data and time to takeoff. Athlete 1 displayed greater braking PF compared to Athlete 2, but also displayed a significant drop in force during the propulsion phase. Based on these data, it may be concluded that Athlete 1 descended into a deep countermovement position, which was less advantageous from a mechanical perspective. This in turn may have caused them to struggle to produce force in the lowest position of their countermovement, as displayed by the large drop in force during the propulsion phase. In contrast, the force-time curve of Athlete 2 displays much more coordination between braking and propulsion phases. While the recommendations by Sheppard and colleagues (2011) suggest the training emphasis for individuals with DSI ratios above or below 0.8 and 0.6, respectively, it is clear that both of the men compared within this case study could benefit from an emphasis on maximal strength training despite ratios of 0.70 and 0.68. While many methods of training can be implemented to improve this athlete’s maximal strength (Suchomel et al., 2018), it should be noted that each athlete’s profile may require unique force production adaptations to address their weaknesses. For example, Athlete 1 may benefit from more eccentric strength (load acceptance) work, whereas Athlete 2 would benefit from more traditional maximal strength work (e.g. squatting, deadlifting, etc.) and ballistic strength training exercises such as weightlifting movements and/or loaded jumps. It should be noted that although it appears that Athlete 1 also needs to focus on improving their RFD, further investigation of each athlete’s force-time curves displayed greater RFD magnitudes produced by Athlete 1 at earlier time intervals (50 and 90 ms) compared to Athlete 2. Therefore, while it appears that Athlete 1 is lacking in RFD, he may actually possess superior RFD compared to Athlete 2. These findings stress the importance of examining multiple variables when contextualizing DSI.
The female athlete case study compared two volleyball athletes with low DSI scores ranked within the 30th percentile of the female athletes examined. Despite playing similar positions, clear differences in the performance magnitudes were apparent between athletes. Athlete 1 was ranked in either the 80th or 90th percentile for every performance indicator whereas Athlete 2 did not exceed the 50th percentile in any variable. Moreover, Athlete 1 displayed superior characteristics from both a braking and propulsion force production standpoint, all while adapting a shallower countermovement and shorter time to takeoff. Athlete 2 appears to have adopted a compliant strategy during the braking phase of the CMJ as evidenced by a gradual increase in braking force. Furthermore, Athlete 2 displayed a greater drop in force production when transitioning from the braking to propulsion phase, indicating a lack of coordination during the jump. Previous recommendations suggest that both of these athletes may benefit from ballistic strength training (Sheppard et al., 2011); however, athletes who display relatively low PF magnitudes may still produce lower DSI values. Therefore, a focus on improving maximal strength instead of an emphasis on ballistic training may be preferable to improving the performance of Athlete 2. In contrast, it could be argued that Athlete 1 may be near her “optimal” force production profile and may thus benefit from a combination of both maximal strength and ballistic training methods (Haff and Nimphius, 2012). It should be noted that although this strategy may not result in a change in DSI, increases in both maximal strength and ballistic force production should be viewed as improvements.
Potential limitations to the current study should be acknowledged. The performance indicators discussed and compared within this study included only CMJ and IMTP variables. When monitoring athletes, IMTP PF may provide an indicator of an athlete’s relative strength; however, because familiarity and posture may alter force production characteristics (Beckham et al., 2018), a measure of lower body relative strength using a free weight exercise (e.g. back squat, deadlift, etc.) may provide more context regarding an athlete’s abilities (Suchomel et al., 2019). A second potential limitation may be inclusion of body mass within the PF magnitudes used to calculate DSI. The current study included body mass within the DSI calculations in order to accurately compare to previous research; however, from a biomechanical perspective, force produced above body mass (i.e. net force) dictates movement and therefore is more appropriate for ballistic tasks. Therefore, future research may consider examining the differences in DSI scores when it is calculated using PF that excludes body mass within the equation.
Very large negative relationships existed between DSI and IMTP PF for both male and female athletes. In addition, small to moderate relationships were present between DSI and CMJ PF, RSImod, and IMTP RFD, while trivial relationships existed with CMJ height and PP. IMTP performance may be a larger indicator of DSI score. Despite similar DSI scores and training recommendations, the needs of each individual athlete may not be readily apparent if practitioners only consider the DSI score. Case study analyses indicate that DSI scores should be contextualized using additional performance data such as percentile rank and time-normalized force-time characteristics. Practitioners should not focus on attaining specific DSI scores but should consider the overall development of the athlete when prescribing training methods to improve performance. Furthermore, resistance training prescriptions should be based on each athlete’s individual needs, but also on the training goals during different times of the year (e.g. offseason, pre-season, etc.).
Acknowledgements
The results of this study have not been published or are being considered for publication in any other journal.
References
- Aagaard P., Simonsen E.B., Andersen J.L., Magnusson P., Dyhre-Poulsen P.. Increased rate of force development and neural drive of human skeletal muscle following resistance training. Journal of Applied Physiology. 2002;93 doi: 10.1152/japplphysiol.00283.2002. 1318-26, Oct. [DOI] [PubMed] [Google Scholar]
- Andersen L.L., Aagaard P.. Influence of maximal muscle strength and intrinsic muscle contractile properties on contractile rate of force development. European Journal of Applied Physiology. 2006;96:46–52. doi: 10.1007/s00421-005-0070-z. [DOI] [PubMed] [Google Scholar]
- Beckham G.K., Sato K., Santana H.A.P., Mizuguchi S., Haff G.G., Stone M.H.. Effect of body position on force production during the isometric midthigh pull. Journal of Strength and Conditioning Research. 2018;32:48–56. doi: 10.1519/JSC.0000000000001968. [DOI] [PubMed] [Google Scholar]
- Beckham G.K., Suchomel T.J., Sole C.J., Bailey C.A., Grazer J.L., Kim S.B., Talbot K.B., Stone M.H.. Influence of sex and maximum strength on reactive strength index-modified. J Sports Sci Med. 2019;18:65–72. [PMC free article] [PubMed] [Google Scholar]
- Comfort P., Dos' Santos T., Beckham G.K., Stone M.H., Guppy S.N., Haff G.G.. Standardization and methodological considerations for the isometric midthigh pull. Strength Cond J. 2019;41:57–79. [Google Scholar]
- Comfort P., Thomas C., Dos'Santos T., Jones P.A., Suchomel T.J., McMahon J.J.. Comparison of methods of calculating dynamic strength index. Int J Sports Physiol Perform. 2018a;13:320–325. doi: 10.1123/ijspp.2017-0255. [DOI] [PubMed] [Google Scholar]
- Comfort P., Thomas C., Dos'Santos T., Suchomel T.J., Jones P.A., McMahon J.J.. Changes in dynamic strength index in response to strength training. Sports. 2018b;6:176. doi: 10.3390/sports6040176. [DOI] [PMC free article] [PubMed] [Google Scholar]
- Cormie P., McGuigan M.R., Newton R.U.. Developing maximal neuromuscular power: part 2 - training considerations for improving maximal power production. Sports Medicine. 2011;41:125–146. doi: 10.2165/11538500-000000000-00000. [DOI] [PubMed] [Google Scholar]
- Haff G.G., Nimphius S.. Training principles for power. Strength Cond J. 2012;34:2–12. [Google Scholar]
- Hopkins W.G., Marshall S., Batterham A., Hanin J.. Progressive statistics for studies in sports medicine and exercise science. Medicine and Science in Sports and Exercise. 2009;41:3–12. doi: 10.1249/MSS.0b013e31818cb278. [DOI] [PubMed] [Google Scholar]
- Kipp K., Kiely M.T., Geiser C.F.. The reactive strength index modified is a valid measure of explosiveness in collegiate female volleyball players. Journal of Strength and Conditioning Research. 2016;30:1341–1347. doi: 10.1519/JSC.0000000000001226. [DOI] [PubMed] [Google Scholar]
- McMahon J.J., Jones P.A., Dos’Santos T., Comfort P.. Influence of dynamic strength index on countermovement jump force-, power-, velocity-, and displacement-time curves. Sports. 2017;5:72. doi: 10.3390/sports5040072. [DOI] [PMC free article] [PubMed] [Google Scholar]
- McMahon J.J., Suchomel T.J., Lake J.P., Comfort P.. Understanding the key phases of the countermovement jump force-time curve. Strength Cond J. 2018;40:96–106. [Google Scholar]
- Moir G.L.. Three different methods of calculating vertical jump height from force platform data in men and women. Meas Phys Educ Exerc Sci. 2008;12:207–218. [Google Scholar]
- Secomb J.L., Lundgren L., Farley O.R.L., Tran T.T., Nimphius S., Sheppard J.M. Relationships between lower-body muscle structure and lower-body strength, power and muscle-tendon complex stiffness. J Strength Cond Res, Epub ahead of print. 2015. [DOI] [PubMed]
- Sheppard J.M., Chapman D., Taylor K.-L.. An evaluation of a strength qualities assessment method for the lower body. J Aust Strength Cond. 2011;19:4–10. [Google Scholar]
- Sole C.J., Mizuguchi S., Sato K., Moir G.L., Stone M.H.. Phase characteristics of the countermovement jump force-time curve: A comparison of athletes by jumping ability. Journal of Strength and Conditioning Research. 2018a;32:1155–1165. doi: 10.1519/JSC.0000000000001945. [DOI] [PubMed] [Google Scholar]
- Sole C.J., Suchomel T.J., Stone M.H.. Preliminary scale of reference values for evaluating reactive strength index-modified in male and female NCAA Division I athletes. Sports. 2018b;6:133. doi: 10.3390/sports6040133. [DOI] [PMC free article] [PubMed] [Google Scholar]
- Stone M.H., O'Bryant H., Garhammer J.. A hypothetical model for strength training. Journal of Sports Medicine and Physical Fitness. 1981;21:342–51. Dec. [PubMed] [Google Scholar]
- Stone M.H., O'Bryant H.S., Hornsby G., Cunanan A., Mizuguchi S., Suarez D.G., South S., Marsh D.J., Haff G.G., Ramsey M.W., Beckham G.K., Santana H.A.P., Wagle J.P., Stone M.E., Pierce K.P.. The use of the isometric mid-thigh pull in the monitoring of weightlifters: 25+ years of experience. UKSCA J. 2019;54:10–26. [Google Scholar]
- Suarez D.G., Mizuguchi S., Hornsby W.G., Cunanan A.J., Marsh D.J., Stone M.H.. Phase-specific changes in rate of force development and muscle morphology throughout a block periodized training cycle in weightlifters. Sports. 2019;7:129. doi: 10.3390/sports7060129. [DOI] [PMC free article] [PubMed] [Google Scholar]
- Suchomel T.J., Bailey C.A., Sole C.J., Grazer J.L., Beckham G.K.. Using reactive strength index-modified as an explosive performance measurement tool in Division I athletes. Journal of Strength and Conditioning Research. 2015;29:899–904. doi: 10.1519/JSC.0000000000000743. [DOI] [PubMed] [Google Scholar]
- Suchomel T.J., McKeever S.M., McMahon J.J., Comfort P.. The effect of training with weightlifting catching or pulling derivatives on squat jump and countermovement jump force-time adaptations. J Funct Morphol Kines. 2020;5:28. doi: 10.3390/jfmk5020028. [DOI] [PMC free article] [PubMed] [Google Scholar]
- Suchomel T.J., McMahon J.J., Lake J.P. Comfort P., Jones P.A., McMahon J.J. Performance assessment in strength and conditioning. New York, NY: Routledge; 2019. Combined assessment methods; pp. 275–290. [Google Scholar]
- Suchomel T.J., Nimphius S., Bellon C.R., Stone M.H.. The importance of muscular strength: Training considerations. Sports Medicine. 2018;48:765–785. doi: 10.1007/s40279-018-0862-z. [DOI] [PubMed] [Google Scholar]
- Suchomel T.J., Nimphius S., Stone M.H.. The importance of muscular strength in athletic performance. Sports Medicine. 2016a;46:1419–1449. doi: 10.1007/s40279-016-0486-0. [DOI] [PubMed] [Google Scholar]
- Suchomel T.J., Sole C.J., Stone M.H.. Comparison of methods that assess lower body stretch-shortening cycle utilization. Journal of Strength and Conditioning Research. 2016b;30:547–554. doi: 10.1519/JSC.0000000000001100. [DOI] [PubMed] [Google Scholar]
- Thomas C., Dos’Santos T., Jones P.A.. A Comparison of dynamic strength index between team-sport athletes. Sports. 2017;5:71. doi: 10.3390/sports5030071. [DOI] [PMC free article] [PubMed] [Google Scholar]
- Young K.P., Haff G.G., Newton R.U., Sheppard J.M.. Reliability of a novel testing protocol to assess upper-body strength qualities in elite athletes. Int J Sports Physiol Perform. 2014;9:871–875. doi: 10.1123/ijspp.2013-0332. [DOI] [PubMed] [Google Scholar]
- Zamparo P., Minetti A., di Prampero P.. Interplay among the changes of muscle strength, cross-sectional area and maximal explosive power: theory and facts. European Journal of Applied Physiology. 2002;88:193–202. doi: 10.1007/s00421-002-0691-4. [DOI] [PubMed] [Google Scholar]