Abstract
Background
Digital breast tomosynthesis (DBT) combined with digital mammography (DM) is increasingly used in the United States instead of DM alone for breast cancer screening. Early screening outcomes incorporating synthetic mammography (SM) with DBT have suggested that SM is an acceptable non–radiation dose alternative to DM.
Purpose
To compare multicenter outcomes from breast cancer screening with SM/DBT versus DM/DBT.
Materials and Methods
This was a retrospective study of consecutive screening mammograms obtained at two institutions. Eligible studies consisted of 34 106 DM/DBT examinations between October 3, 2011, and October 31, 2014, and 34 180 SM/DBT examinations between January 7, 2015, and February 2, 2018, at the University of Pennsylvania and 51 148 DM/DBT examinations between January 1, 2012, and May 31, 2016, and 31 929 SM/DBT examinations between June 1, 2016, and March 30, 2018, at the University of Vermont. Demographics of women who attended screening and results from screening were recorded. Recall rate, biopsy rate, false-negative rate, cancer detection rate, positive predictive value, sensitivity, and specificity were calculated according to modality and institution. Descriptive statistics, χ2 tests, and logistic regression were used in analysis.
Results
The study included 151 363 screening examinations among 151 363 women (mean age, 58.1 years ± 10.9 [standard deviation]). The unadjusted recall rate was lower with SM/DBT than with DM/DBT (7.0% [4630 of 66 109 examinations] for SM/DBT vs 7.9% [6742 of 85 254 examinations] for DM/DBT; P < .01). However, after multivariable adjustment, SM/DBT was associated with a slightly higher recall rate compared with DM/DBT (adjusted odds ratio [OR], 1.06; adjusted 95% CI: 1.01, 1.11; P = .02). Similarly, after multivariable adjustment, SM/DBT was associated with slightly lower specificity compared with DM/DBT (adjusted OR, 0.95; adjusted 95% CI: 0.90, 0.99; P = .02). There was no statistically significant difference in biopsy rate (P = .54), false-negative rate (P = .38), cancer detection rate (P = .55), invasive or in situ cancer detection rate (P = .52 and P = .98, respectively), positive predictive value (P = .78), or sensitivity (P = .33) for SM/DBT versus DM/DBT overall or within either institution (P > .05 for all).
Conclusion
Breast cancer screening performance is maintained within benchmarks when synthetic mammography replaces digital mammography in digital breast tomosynthesis imaging.
© RSNA, 2020
Online supplemental material is available for this article.
See also the editorial by Lång in this issue.
Summary
In this multicenter retrospective review, synthetic mammography combined with digital breast tomosynthesis (DBT) maintained acceptable recall rates and cancer detection rates compared with digital mammography combined with DBT.
Key Results
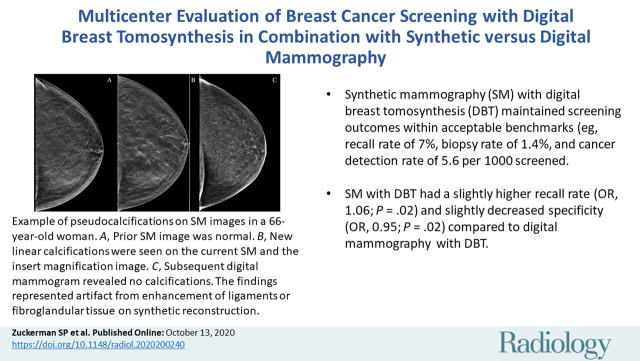
■ Synthetic mammography (SM) with digital breast tomosynthesis (DBT) maintained screening outcomes within acceptable benchmarks (eg, recall rate of 7%, biopsy rate of 1.4%, and cancer detection rate of 5.6 per 1000 women screened).
■ In an adjusted analysis, SM with DBT had a slightly higher recall rate (odds ratio, 1.06; P = .02) and slightly decreased specificity (odds ratio, 0.95; P = .02) compared to digital mammography with DBT.
Introduction
Since U.S. Food and Drug Administration approval in 2011, digital breast tomosynthesis (DBT) has increasingly been used for breast cancer screening and diagnostic purposes (1–3). DBT has been shown in European prospective screening studies to improve cancer detection rates and in American retrospective screening studies to lower recall rates in women of all ages and breast densities compared with screening with digital mammography (DM) alone (4–13). However, the combined DM/DBT examination results in a twofold increase in radiation dose to women compared with screening with DM alone (14–16).
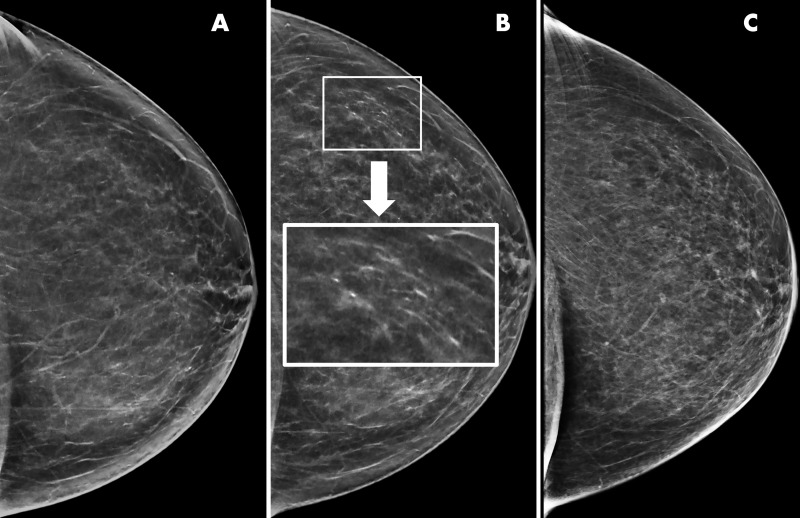
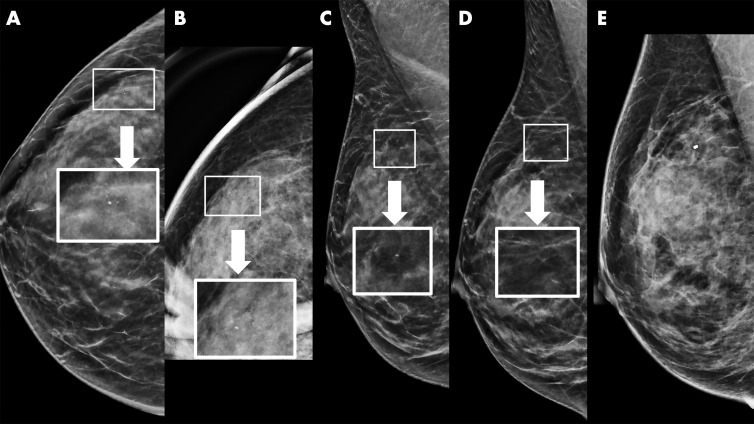
Synthetic mammography (SM) was developed to decrease the radiation dose to women undergoing DBT. SM is not meant to be an exact replica of DM; the reconstruction algorithm purposefully enhances areas, such as calcifications and potential areas of distortion, to make them more conspicuous to the reader (Figs 1, 2) (17,18). The synthetic reconstruction has led some imagers to anecdotally express concerns about SM image quality, specifically in regard to calcification detection and characterization (19). Concerns include both missing lower optical density, faint calcifications that represent ductal carcinoma in situ, and overcalling pseudocalcifications, lesions that are normal benign structures such as ligaments or fibroglandular tissue that appear to represent calcified lesions due to the reconstruction (Fig 1) (17–21). Although these concerns persist, a recent reader study (22) found no difference in specificity or sensitivity in SM/DBT versus DM detection and characterization of calcifications. An additional reader study (23) found no difference in SM/DBT versus DM/DBT calcification detection and characterization.
Figure 1:
Example of artifactual pseudocalcifications on synthetic images in a 66-year-old woman who presented for screening. A, Screening mammogram obtained with synthetic imaging in 2019 (craniocaudal view). Finding was classified as Breast Imaging Reporting and Data System (BI-RADS) category 1. B, Screening mammogram obtained with synthetic imaging in 2020 (craniocaudal view). New calcifications in a linear distribution are seen in the outer breast. Finding was classified as BI-RADS category 0. Inset image was obtained at ×3 magnification. C, Diagnostic digital mammogram obtained in 2020 (craniocaudal view) reveals no calcifications in the outer breast. Previously seen calcification-like findings represent artifact from enhancement of ligaments or fibroglandular tissue on synthetic reconstruction. Finding was classified as BI-RADS category 1.
Figure 2:
Example of synthetic imaging calcification enhancement in a 43-year-old woman who presented for screening. A, Screening mammogram obtained with synthetic imaging (craniocaudal view). New faint amorphous calcifications are seen in the outer breast. Finding was classified as Breast Imaging Reporting and Data System (BI-RADS) category 0. Inset image was obtained at ×3 magnification. B, Diagnostic mammogram, two-dimensional magnification view (craniocaudal view), confirms the presence of calcifications; however, they are of equal or less conspicuity compared with that seen with synthetic imaging. Inset image was obtained at ×3 magnification. Finding was classified as BI-RADS category 4. C, Screening mammogram obtained with synthetic imaging (mediolateral oblique view). New faint amorphous calcifications are seen in the superior breast. They are less conspicuous compared with those on the craniocaudal view in A. Finding was classified as BI-RADS category 0. Inset image was obtained at ×3 magnification. D, Diagnostic digital mammogram obtained at recall (mediolateral view). Calcifications are much less conspicuous on two-dimensional digital mediolateral view. Inset image was obtained at ×3 magnification. Finding was classified as BI-RADS category 4. E, Diagnostic mammogram obtained with two-dimensional imaging after biopsy (digital mediolateral view). The clip is in appropriate location. Pathologic examination showed ductal carcinoma in situ, intermediate grade.
Retrospective studies, prospective studies, and reader studies from the early clinical implementation of SM/DBT have thus far demonstrated no significant difference in overall screening outcomes compared with DM/DBT (14,24–28). However, these studies have some limitations. Early retrospective studies were from single sites and included a smaller number of SM/DBT examinations than DM/DBT examinations (Zuckerman et al [14]: 5366 SM/DBT examinations vs 15 571 DM/DBT examinations; Aujero et al (24): 16 173 SM/DBT examinations vs 30 561 DM/DBT and 32 076 DM examinations). Simon et al (26) published a cancer-enriched reader study comparing the performance of SM/DBT with that of DM/DBT but only included 189 women. Caumo et al (27) published a prospective study that compared 16 666 SM/DBT examinations with 14 423 DM examinations but did not compare SM/DBT with DM/DBT. The largest prospective studies had all women undergo DM, SM, and DBT and then performed a reader study to determine outcomes of combination imaging (Bernardi et al [25] included 9672 women and compared DM alone, DM/DBT, and SM/DBT; Skaane et al (28) included 24 301 women and compared DM, DM plus computer-aided detection, DM/DBT, and SM/DBT).
The purpose of this study was to compare multicenter outcomes from SM/DBT with those from DM/DBT in breast cancer screening.
Materials and Methods
This retrospective Health Insurance Portability and Accountability Act–compliant study was approved by the human subjects institutional review boards at both the Hospital of the University of Pennsylvania (center 1) and the University of Vermont (center 2). The requirement to obtain informed consent was waived.
Subgroups of data from center 1 have been previously published (4–6,14,29–32). These studies did not specifically evaluate the performance of SM/DBT versus DM/DBT and instead examined recall rates and cancer detection rates of DM versus DBT with DM. The studies included 24 767 examinations (5), 26 299 examinations (6,29,30), 44 468 examinations (31), 23 206 examinations (32), and 11 623 examinations (4). An additional study examined early outcomes of SM/DBT versus DM/DBT with the SM/DBT population limited to January 7, 2015, to June 30, 2015, a study overlap of 31 666 examinations (14). Our current study represents an expanded analysis with almost three additional years of outcomes.
No previous studies have used the SM/DBT data from center 2. Data from the 51 562 DM/DBT examinations from center 2 included in this study were previously included within a larger analysis of malignant and benign lesion detection rates with DBT using data pooled from multiple institutions (33), as well as a pooled analysis of learning curve in DBT performance within the Breast Cancer Surveillance Consortium (34). Data from 18 983 DM/DBT examinations from center 2 included in this study were also used in pooled analyses of DBT performance within the Population-based Research Optimizing Screening through Personalized Regimens, or PROSPR, Consortium (4,32).
Results from consecutive screening examinations from both institutions were reviewed. Center 1 performed 37 615 DM/DBT examinations between October 3, 2011, and October 31, 2014, and 37 854 SM/DBT examinations between January 7, 2015, and February 2, 2018. The gap between DM/DBT and SM/DBT screening was secondary to an overlap period where DM and SM were performed with DBT in November and December 2014; these studies were not included in the analysis. Center 2 performed 51 562 DM/DBT examinations between January 5, 2012, and May 31, 2016, and 37 227 SM/DBT examinations between June 1, 2016, and March 30, 2018. The difference in studies performed over time at center 2 is secondary to less DBT capability during the DM/DBT period versus the SM/DBT period. All women during all time points underwent DBT screening at both institutions. If a woman declined a DBT study during the study period for personal reasons, she was not included in our analysis. At each site, one faculty member finalized each study; trainees were often involved in preliminary interpretations. The time between studies varied across women.
Examinations were excluded if they were missing Breast Imaging Reporting and Data Systems (BI-RADS) final assessments (four were excluded from center 1 and 14 from center 2). Examinations interpreted by radiologists who had interpreted fewer than 100 examinations in each category were also excluded (7179 were excluded from center 1 and 5698 from center 2). The final number of examinations for center 1 was 34 106 DM/DBT studies and 34 180 SM/DBT studies; the final number of examinations for center 2 was 51 148 DM/DBT studies and 31 929 SM/DBT studies. The total number of studies was 85 254 DM/DBT and 66 109 SM/DBT. Examinations performed at center 1 were interpreted by six radiologists with 6–31 years of experience (including author E.F.C., with 31 years of experience). Examinations performed at center 2 were interpreted by six radiologists with 12–33 years of experience (including author S.D.H., with 32 years of experience). All radiologists in both groups are qualified according to the American College of Radiology Mammography Quality and Standards Act and trained in DBT interpretation as mandated by the Food and Drug Administration.
All studies were performed with the same imaging system (Selenia Dimensions 2D/3D system; Hologic, Marlborough, Mass), and all SM images were generated from the DBT images by using industry-specific processing software (C-view software module, Hologic).
For each study, age, race and/or ethnicity, body mass index (BMI), first-degree relative with breast cancer, breast density using BI-RADS terminology (35), baseline examination status, and final BI-RADS assessment were recorded. If a woman was recalled from screening, the outcome of the subsequent diagnostic examination, including if a biopsy was performed and final histologic findings from biopsy or final excision, were recorded. The final histologic finding was classified as either benign (including atypia) or malignant (invasive or in situ). Recall rate (percentage), biopsy rate, and cancer detection rate per 1000 women screened, positive predictive value of recall, and positive predictive value of biopsies performed were calculated for each institution. Sensitivity (proportion of screening-detected cancers among all breast cancers) and specificity (proportion of negative screening studies among all women without breast cancer) of DM/DBT and SM/DBT for each institution and in aggregate were also calculated. Each hospital’s electronic medical record or radiology information system was used to extract data (center 1: Epic Systems, Madison, Wis; center 2: GE Centricity RIS-IC, GE Healthcare, Burlington, Vt).
Statistical Analysis
Descriptive statistics and χ2 tests were used to characterize and compare population characteristics according to imaging modality and institution. Unadjusted screening performance measures (including recall rate, biopsy rate, cancer detection rate, false-negative rate, positive predictive value, sensitivity, and specificity) were calculated according to standard BI-RADS definitions (36). Cancer diagnoses for all outcomes were based on a 1-year period following the screening examination. Logistic regression was used to examine the association between imaging modality (SM/DBT vs DM/DBT) and various screening outcomes. We calculated unadjusted odds ratios (ORs) and 95% CIs, as well as adjusted ORs and 95% CIs, from separate models, including covariates for age, race, BMI, breast density, family history of breast cancer, baseline examination status, DBT round, radiologist, and institution. Tests of statistical significance were two-sided, with P < .05 considered indicative of a statistically significant difference. Cross-product interaction terms were evaluated to test for effect modification by institution. Interactions with P < .05 were considered statistically significant. SAS software (version 9.4; SAS Institute, Cary, NC) was used for all statistical analyses.
Results
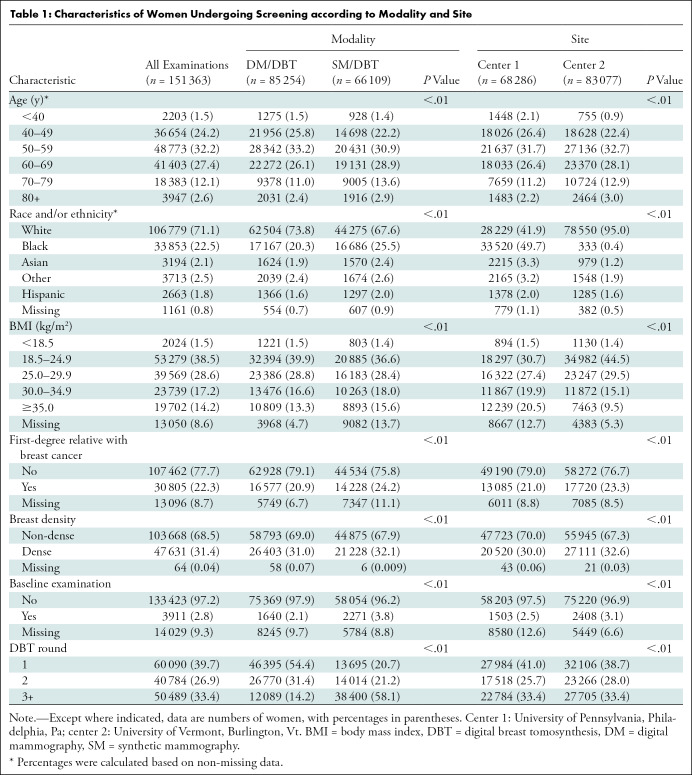
We included 151 363 screening examinations in 151 363 women (mean age, 58.1 years ± 10.9 [standard deviation]) (Table 1). There were small but statistically significant differences in age distribution, family history of breast cancer, breast density, and baseline examination status between both institutions. However, there was a substantial difference in reported race and/or ethnicity, with center 1 having a larger percentage of Black women (33 520 of 68 286, 49.7%) and center 2 having a larger percentage of White women (78 550 of 83 077, 95.0%) (P < .01). There was also a difference in BMI across sites, with center 1 having a larger proportion (24 106 of 68 286, 35.3%) of obese women (BMI ≥30 kg/m2) compared with center 2 (19 335 of 83 077, 23.3%) (P < .01). When all DM/DBT examinations from both institutions were compared with all SM/DBT examinations from both institutions, there were small but statistically significant differences in age distribution, race and/or ethnicity, BMI, family history of breast cancer, breast density, and baseline examination status (any mammographic examination, including DM or DBT examination). As expected, compared with DM/DBT examinations, SM/DBT examinations were less likely to be an individual’s first DBT examination (P < .01) because SM/DBT was implemented after DM/DBT at each institution.
Table 1:
Characteristics of Women Undergoing Screening according to Modality and Site
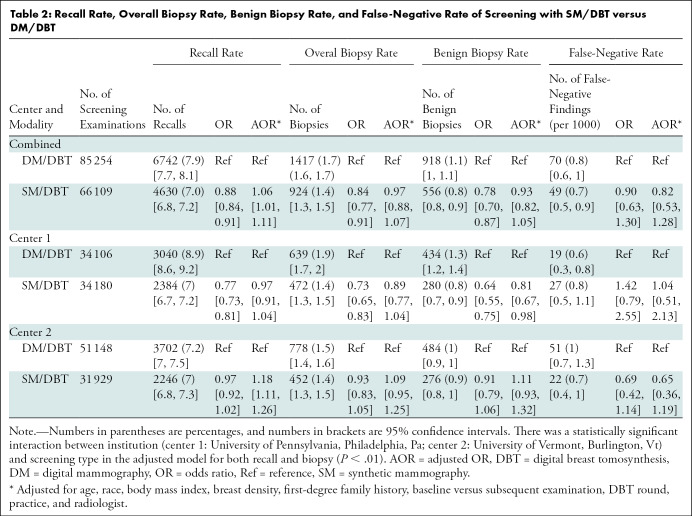
The unadjusted recall rate was lower with SM/DBT than with DM/DBT (7.0% [4630 of 66 109] for SM/DBT vs 7.9% [6742 of 85 254] for DM/DBT; P < .01) (Table 2). However, after multivariable adjustment for population characteristics, SM/DBT was associated with a slightly higher recall rate compared with DM/DBT (adjusted OR: 1.06; 95% CI: 1.01, 1.11; P = .02), indicating that the likelihood of recall for diagnostic imaging was approximately 6% higher in SM/DBT examinations compared with DM/DBT examinations after controlling for differences in population characteristics. There was a statistically significant interaction by institution (P < .01), such that the multivariable-adjusted increase in recall rate with SM/DBT was only experienced at center 2 (adjusted OR: 1.18; 95% CI: 1.11, 1.26).
Table 2:
Recall Rate, Overall Biopsy Rate, Benign Biopsy Rate, and False-Negative Rate of Screening with SM/DBT versus DM/DBT
The biopsy rate for SM/DBT examinations was 1.4% (924 of 66 109). The biopsy rate for DM/DBT examinations was 1.7% (1417 of 85 254). There was no statistically significant difference in overall biopsy rate for SM/DBT versus DM/DBT (P = .54) or within either institution (Table 2). There was also no statistically significant difference in overall benign biopsy rate for SM/DBT versus DM/DBT (P = .25). However, there was a statistically significant interaction by institution (P < .01), with a lower benign biopsy rate for SM/DBT compared with DM/DBT at center 1 (adjusted OR: 0.81; 95% CI: 0.67, 0.98; P = .03), indicating that the likelihood of a benign biopsy after SM/DBT was approximately 19% lower than that with DM/DBT after controlling for differences in population characteristics. No statistically significant difference was observed in the benign biopsy rate between SM/DBT and DM/DBT at center 2 (P = .24).
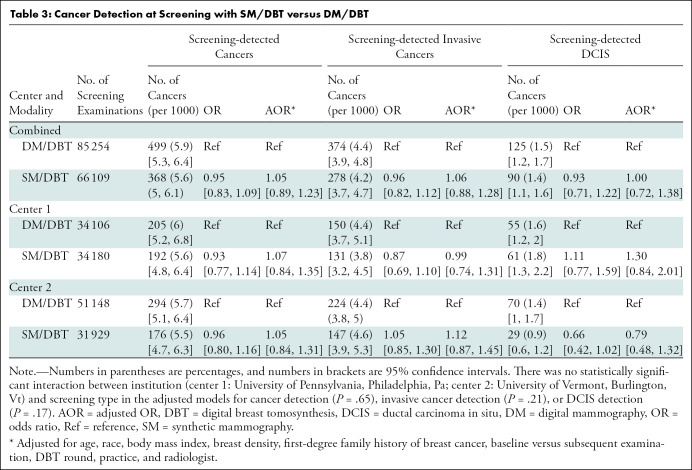
The cancer detection rate for SM/DBT examinations was 5.6 per 1000 woman screened (368 of 66 109). The cancer detection rate for DM/DBT examinations was 5.9 per 1000 women screened (499 of 85 254). There was no statistically significant difference in cancer detection rate (P = .55) for SM/DBT versus DM/DBT in aggregate or at either institution (Table 3). There was also no statistically significant difference in screening-detected invasive cancers (P = .52) or in situ cancers (P = .98) for SM/DBT versus DM/DBT in aggregate or at either institution. At each institution as well as in aggregate, there was no statistically significant difference in the false-negative rates between SM/DBT and DM/DBT (P = .38) (Table 3).
Table 3:
Cancer Detection at Screening with SM/DBT versus DM/DBT
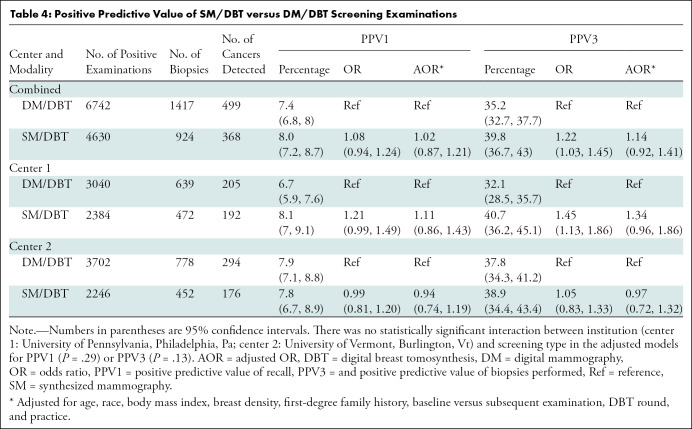
Among SM/DBT examinations, the positive predictive value of recall was 8% (368 of 4630) and the positive predictive value of biopsies performed was 39.8% (368 of 924). There was no statistically significant difference in positive predictive value of recall (P = .78) or positive predictive value of biopsies performed (P = .24) for SM/DBT versus DM/DBT in aggregate or at either institution (Table 4).
Table 4:
Positive Predictive Value of SM/DBT versus DM/DBT Screening Examinations
Overall sensitivity was unchanged between DM/DBT (87.7%, 499 of 569) and SM/DBT (88.3%, 368 of 417) (unadjusted OR: 1.05 [95% CI: 0.71, 1.56], P = .79; adjusted OR: 1.27 [95% CI: 0.79, 2.06], P = .33). Similarly, there was no difference between DM/DBT and SM/DBT sensitivity at either institution (P = .82 for center 1 and P = .17 for center 2) (Table E1 [online]).
Paralleling results seen in recall rate, overall unadjusted specificity was higher for SM/DBT (93.5%, 51 430 of 65 692 examinations) than for DM/DBT (92.6%, 78 442 of 84 685 examinations) (unadjusted OR: 1.15; 95% CI: 1.10, 1.19; P < .01). However, when this result was controlled for differences in population characteristics, the specificity of SM/DBT was lower than that of DM/DBT (adjusted OR: 0.95; 95% CI: 0.90, 0.99; P = .02). No difference was seen in specificity at center 1 (P = .34). At center 2, there was no difference in the unadjusted specificity of DM/DBT versus SM/DBT (P = .30), but there was a lower specificity of SM/DBT compared with DM/DBT when the result was adjusted for population characteristics (adjusted OR: 0.84; 95% CI: 0.79, 0.90; P < .01) (Table E1 [online]).
Discussion
To our knowledge, our study is the largest study and only multicenter study in the United States to compare screening outcomes using synthetic mammography (SM) with digital breast tomosynthesis (DBT) to those from digital mammography (DM) with DBT. As shown in smaller retrospective population studies and in reader studies, breast cancer screening performance is similar when SM replaces DM in combination DBT screening. All major screening outcomes with SM/DBT remained within acceptable benchmarks (37) at both institutions, such as recall rate (7% [4630 of 66 109 examinations]; adjusted odds ratio [OR]: 1.06; 95% CI: 1.01, 1.11), biopsy rate (1.4% [924 of 66 109 examinations]; adjusted OR: 0.97; 95% CI: 0.88, 1.07), and cancer detection rate (5.6 per 1000 women screened [368 of 66 109 examinations]; adjusted OR: 1.05; 95% CI: 0.89, 1.23). There were no statistically significant differences in screening performance measures for SM/DBT and DM/DBT (P > .05 for all), with the exception of a slightly increased recall rate of SM/DBT compared with DM/DBT (OR, 1.06; P = .02) and slightly decreased specificity of SM/DBT compared with DM/DBT (OR, 0.95; P = .02).
In this study, the unadjusted recall rate of SM/DBT examinations was lower than that of DM/DBT examinations. This appeared to be due to a higher propensity for DM/DBT examinations to be a woman’s first DBT examination (at which a higher recall rate is to be expected). This is most likely related to the incremental proficiency in using DBT over the years, as all DM/DBT examinations were performed and interpreted in the years before implementation of SM/DBT. After adjusting for covariates, including previous DBT studies, SM/DBT was associated with a slightly higher recall rate than DM/DBT. Similar to recall rate, unadjusted specificity of SM/DBT examinations was higher than that of DM/DBT examinations. However, when adjusted for population characteristics, the specificity with SM/DBT was lower than that with DM/DBT. This trend is not unexpected as specificity (the ratio of true-negative examinations and false-positive examinations) is closely related to recall rate.
Both differences in recall rate and specificity are entirely attributable to center 2; there was no difference in the adjusted recall rate or specificity between SM/DBT and DM/DBT at center 1. Notably, center 2 achieved low recall rates and high specificity with both DM/DBT and SM/DBT. Specific reasons for the slightly higher recall rate and lower specificity with SM/DBT at center 2 are unclear. Although we did not evaluate the specific finding type that prompted recall, reader experience with SM and calcification interpretation, specifically calling pseudocalcifications (Fig 1), may have contributed to the increase in recall rate. A limitation of our study is that we did not evaluate the mammographic finding type that prompted recall (specifically, calcified vs noncalcified lesions). Although we have previously published on this topic after early implementation of synthetic imaging (14), additional studies are recommended.
Some previous studies have observed a lower recall rate when SM replaces DM and questioned if the change in recall rate between SM and DM results in more false-negative screening examinations (14,19). Our study has shown no change in the rate of false-negative findings with SM/DBT compared with DM/DBT at either institution (P = .43); both recall rates and false-negative rates continue to be within national benchmarks (37). Further research with larger sample sizes is needed to confirm that false-negative rates are maintained within acceptable levels with SM/DBT.
Our study also demonstrates similar true-positive rates, false-positive rates, and sensitivity with SM/DBT compared with DM/DBT screening. All major screening outcomes remained within acceptable benchmarks (37): Overall cancer detection rate (including in situ and invasive cancer), positive predictive value of recall, and positive predictive value of biopsies performed remained comparable at both institutions and in aggregate. Overall biopsy rate was also unchanged in aggregate as well as at the institutional level. The benign biopsy rate was also unchanged overall, although there was a small decrease in benign biopsy rate at center 1 when comparing SM/DBT to DM/DBT; this decrease in benign biopsies is not well understood. Further evaluation including specific lesion types at recall and biopsy may help explain this finding.
There was a significant difference in the distribution of population characteristics (race and/or ethnicity and BMI) between institutions. This reflects a difference in the communities served by each institution: Center 1 serves an urban population and center 2 serves a more suburban and/or rural population. Despite these differences in populations, overall screening outcomes were similar between both institutions. Our results show that screening outcomes with SM/DBT can be maintained in a variety of practice settings with diverse populations.
Our study is not without limitations. All examinations were performed with equipment from one vendor. Future research should be conducted to determine if our results are translatable to other vendors with different synthetic reconstruction algorithms. In addition, our study was essentially a natural experiment in which SM/DBT replaced DM/DBT at each institution. All SM/DBT studies were performed after each site had experience with DM/DBT studies; some of the results may be confounded by our readers’ increased experience interpreting DBT examinations in the SM/DBT population versus the DM/DBT population. We were able to control for measured confounders (including DBT round) with rich woman-level data. However, we cannot rule out all sources of bias as radiologists who have had more experience with DBT may have evolved in how they interpret DBT examinations, with a change in their recall threshold. Nevertheless, our results should reflect the experiences of practices as they transition from DM/DBT to SM/DBT. Our results may not reflect outcomes when practices transition directly from DM to SM/DBT.
In summary, our study represents the first multicenter retrospective review of population-based outcomes using synthetic mammography (SM) combined with digital breast tomosynthesis (DBT) versus digital mammography (DM) combined with DBT. We found that SM/DBT maintains acceptable recall rates and cancer detection rates compared with DM/DBT.
SUPPLEMENTAL TABLE
B.L.S. and E.F.C. are supported by the National Cancer Institute (grants R03 CA223725, U54 CA163303, and P01 CA154292 to B.L.S. and grant U54CA163313 to E.F.C.).
Disclosures of Conflicts of Interest: S.P.Z. disclosed no relevant relationships. B.L.S. disclosed no relevant relationships. D.L.W. Activities related to the present article: disclosed no relevant relationships. Activities not related to the present article: received money for expert testimony from an insurance company; receives royalties from UpToDate. Other relationships: disclosed no relevant relationships. S.D.H. disclosed no relevant relationships. E.F.C. Activities related to the present article: disclosed no relevant relationships. Activities not related to the present article: is a board member of Hologic and iCAD; has grants/grants pending from Hologic and iCAD; receives payment for lectures including service on speakers bureaus from Hologic, World Class CME, and ICPME. Other relationships: disclosed no relevant relationships.
Abbreviations:
- BI-RADS
- Breast Imaging Reporting and Data System
- BMI
- body mass index
- DBT
- digital breast tomosynthesis
- DM
- digital mammography
- OR
- odds ratio
- SM
- synthetic mammography
References
- 1.Hardesty LA, Kreidler SM, Glueck DH. Digital Breast Tomosynthesis Utilization in the United States: A Survey of Physician Members of the Society of Breast Imaging. J Am Coll Radiol 2016;13(11S):R67–R73. [DOI] [PubMed] [Google Scholar]
- 2.Gao Y, Babb JS, Toth HK, Moy L, Heller SL. Digital Breast Tomosynthesis Practice Patterns Following 2011 FDA Approval: A Survey of Breast Imaging Radiologists. Acad Radiol 2017;24(8):947–953. [DOI] [PubMed] [Google Scholar]
- 3.Richman IB, Hoag JR, Xu X, et al. Adoption of Digital Breast Tomosynthesis in Clinical Practice. JAMA Intern Med 2019;179(9):1292. [DOI] [PMC free article] [PubMed] [Google Scholar]
- 4.Conant EF, Beaber EF, Sprague BL, et al. Breast cancer screening using tomosynthesis in combination with digital mammography compared to digital mammography alone: a cohort study within the PROSPR consortium. Breast Cancer Res Treat 2016;156(1):109–116. [DOI] [PMC free article] [PubMed] [Google Scholar]
- 5.Friedewald SM, Rafferty EA, Rose SL, et al. Breast cancer screening using tomosynthesis in combination with digital mammography. JAMA 2014;311(24):2499–2507. [DOI] [PubMed] [Google Scholar]
- 6.McCarthy AM, Kontos D, Synnestvedt M, et al. Screening outcomes following implementation of digital breast tomosynthesis in a general-population screening program. J Natl Cancer Inst 2014;106(11):dju316. [DOI] [PMC free article] [PubMed] [Google Scholar]
- 7.Skaane P, Bandos AI, Gullien R, et al. Prospective trial comparing full-field digital mammography (FFDM) versus combined FFDM and tomosynthesis in a population-based screening programme using independent double reading with arbitration. Eur Radiol 2013;23(8):2061–2071. [DOI] [PMC free article] [PubMed] [Google Scholar]
- 8.Ciatto S, Houssami N, Bernardi D, et al. Integration of 3D digital mammography with tomosynthesis for population breast-cancer screening (STORM): a prospective comparison study. Lancet Oncol 2013;14(7):583–589. [DOI] [PubMed] [Google Scholar]
- 9.Greenberg JS, Javitt MC, Katzen J, Michael S, Holland AE. Clinical performance metrics of 3D digital breast tomosynthesis compared with 2D digital mammography for breast cancer screening in community practice. AJR Am J Roentgenol 2014;203(3):687–693. [DOI] [PubMed] [Google Scholar]
- 10.Østerås BH, Martinsen ACT, Gullien R, Skaane P. Digital Mammography versus Breast Tomosynthesis: Impact of Breast Density on Diagnostic Performance in Population-based Screening. Radiology 2019;293(1):60–68. [DOI] [PubMed] [Google Scholar]
- 11.Conant EF, Zuckerman SP, McDonald ES, et al. Five Consecutive Years of Screening with Digital Breast Tomosynthesis: Outcomes by Screening Year and Round. Radiology 2020;295(2):285–293. [DOI] [PMC free article] [PubMed] [Google Scholar]
- 12.Chong A, Weinstein SP, McDonald ES, Conant EF. Digital Breast Tomosynthesis: Concepts and Clinical Practice. Radiology 2019;292(1):1–14. [DOI] [PMC free article] [PubMed] [Google Scholar]
- 13.Marinovich ML, Hunter KE, Macaskill P, Houssami N. Breast Cancer Screening Using Tomosynthesis or Mammography: A Meta-analysis of Cancer Detection and Recall. J Natl Cancer Inst 2018;110(9):942–949. [DOI] [PubMed] [Google Scholar]
- 14.Zuckerman SP, Conant EF, Keller BM, et al. Implementation of Synthesized Two-dimensional Mammography in a Population-based Digital Breast Tomosynthesis Screening Program. Radiology 2016;281(3):730–736 10.1148/radiol.2016160366. [DOI] [PMC free article] [PubMed] [Google Scholar]
- 15.Gennaro G, Bernardi D, Houssami N. Radiation dose with digital breast tomosynthesis compared to digital mammography: per-view analysis. Eur Radiol 2018;28(2):573–581. [DOI] [PubMed] [Google Scholar]
- 16.Svahn TM, Houssami N, Sechopoulos I, Mattsson S. Review of radiation dose estimates in digital breast tomosynthesis relative to those in two-view full-field digital mammography. Breast 2015;24(2):93–99. [DOI] [PMC free article] [PubMed] [Google Scholar]
- 17.Ratanaprasatporn L, Chikarmane SA, Giess CS. Strengths and Weaknesses of Synthetic Mammography in Screening. RadioGraphics 2017;37(7):1913–1927. [DOI] [PubMed] [Google Scholar]
- 18.Zuckerman SP, Maidment ADA, Weinstein SP, McDonald ES, Conant EF. Imaging With Synthesized 2D Mammography: Differences, Advantages, and Pitfalls Compared With Digital Mammography. AJR Am J Roentgenol 2017;209(1):222–229. [DOI] [PubMed] [Google Scholar]
- 19.Gilbert FJ, Tucker L, Gillan MG, et al. Accuracy of Digital Breast Tomosynthesis for Depicting Breast Cancer Subgroups in a UK Retrospective Reading Study (TOMMY Trial). Radiology 2015;277(3):697–706. [DOI] [PubMed] [Google Scholar]
- 20.Durand MA. Synthesized Mammography: Clinical Evidence, Appearance, and Implementation. Diagnostics (Basel) 2018;8(2):22. [DOI] [PMC free article] [PubMed] [Google Scholar]
- 21.Zuckerman SP, Sprague BL, Weaver DL, Herschorn SD, Conant EF. Survey Results Regarding Uptake and Impact of Synthetic Digital Mammography with Tomosynthesis in the Screening Setting. J Am Coll Radiol 2020;17(1 Pt A):31–37 10.1016/j.jacr.2019.07.020. [DOI] [PMC free article] [PubMed] [Google Scholar]
- 22.Lai YC, Ray KM, Lee AY, et al. Microcalcifications Detected at Screening Mammography: Synthetic Mammography and Digital Breast Tomosynthesis versus Digital Mammography. Radiology 2018;289(3):630–638. [DOI] [PubMed] [Google Scholar]
- 23.Dodelzon K, Simon K, Dou E, et al. Performance of 2D Synthetic Mammography Versus Digital Mammography in the Detection of Microcalcifications at Screening. AJR Am J Roentgenol 2020;214(6):1436–1444 10.2214/AJR.19.21598. [DOI] [PubMed] [Google Scholar]
- 24.Aujero MP, Gavenonis SC, Benjamin R, Zhang Z, Holt JS. Clinical Performance of Synthesized Two-dimensional Mammography Combined with Tomosynthesis in a Large Screening Population. Radiology 2017;283(1):70–76. [DOI] [PubMed] [Google Scholar]
- 25.Bernardi D, Macaskill P, Pellegrini M, et al. Breast cancer screening with tomosynthesis (3D mammography) with acquired or synthetic 2D mammography compared with 2D mammography alone (STORM-2): a population-based prospective study. Lancet Oncol 2016;17(8):1105–1113. [DOI] [PubMed] [Google Scholar]
- 26.Simon K, Dodelzon K, Drotman M, et al. Accuracy of Synthetic 2D Mammography Compared With Conventional 2D Digital Mammography Obtained With 3D Tomosynthesis. AJR Am J Roentgenol 2019;212(6):1406–1411. [DOI] [PubMed] [Google Scholar]
- 27.Caumo F, Zorzi M, Brunelli S, et al. Digital Breast Tomosynthesis with Synthesized Two-Dimensional Images versus Full-Field Digital Mammography for Population Screening: Outcomes from the Verona Screening Program. Radiology 2018;287(1):37–46 10.1148/radiol.2017170745. [DOI] [PubMed] [Google Scholar]
- 28.Skaane P, Bandos AI, Niklason LT, et al. Digital Mammography versus Digital Mammography Plus Tomosynthesis in Breast Cancer Screening: The Oslo Tomosynthesis Screening Trial. Radiology 2019;291(1):23–30. [DOI] [PubMed] [Google Scholar]
- 29.McDonald ES, McCarthy AM, Akhtar AL, Synnestvedt MB, Schnall M, Conant EF. Baseline Screening Mammography: Performance of Full-Field Digital Mammography Versus Digital Breast Tomosynthesis. AJR Am J Roentgenol 2015;205(5):1143–1148. [DOI] [PubMed] [Google Scholar]
- 30.McDonald ES, McCarthy AM, Weinstein SP, Schnall MD, Conant EF. BI-RADS Category 3 Comparison: Probably Benign Category after Recall from Screening before and after Implementation of Digital Breast Tomosynthesis. Radiology 2017;285(3):778–787. [DOI] [PMC free article] [PubMed] [Google Scholar]
- 31.McDonald ES, Oustimov A, Weinstein SP, Synnestvedt MB, Schnall M, Conant EF. Effectiveness of Digital Breast Tomosynthesis Compared With Digital Mammography: Outcomes Analysis From 3 Years of Breast Cancer Screening. JAMA Oncol 2016;2(6):737–743. [DOI] [PubMed] [Google Scholar]
- 32.Conant EF, Barlow WE, Herschorn SD, et al. Association of Digital Breast Tomosynthesis vs Digital Mammography With Cancer Detection and Recall Rates by Age and Breast Density. JAMA Oncol 2019;5(5):635–642. [DOI] [PMC free article] [PubMed] [Google Scholar]
- 33.Fujii MH, Herschorn SD, Sowden M, et al. Detection Rates for Benign and Malignant Diagnoses on Breast Cancer Screening With Digital Breast Tomosynthesis in a Statewide Mammography Registry Study. AJR Am J Roentgenol 2019;212(3):706–711. [DOI] [PMC free article] [PubMed] [Google Scholar]
- 34.Miglioretti DL, Abraham L, Lee CI, et al. Digital Breast Tomosynthesis: Radiologist Learning Curve. Radiology 2019;291(1):34–42. [DOI] [PMC free article] [PubMed] [Google Scholar]
- 35.Sickles E, D’Orsi CJ, Bassett LW, et al. ACR BI-RADS Mammography. In: ACR BI-RADS Atlas, Breast Imaging Reporting and Data System. Reston, Va: American College of Radiology, 2013. [Google Scholar]
- 36.D’Orsi CJ, Sickles E, Mendelson EB, et al. ACR BI-RADS Atlas, Breast Imaging Reporting and Data System. Reston, Va: American College of Radiology, YEAR. [Google Scholar]
- 37.Lehman CD, Arao RF, Sprague BL, et al. National Performance Benchmarks for Modern Screening Digital Mammography: Update from the Breast Cancer Surveillance Consortium. Radiology 2017;283(1):49–58. [DOI] [PMC free article] [PubMed] [Google Scholar]
Associated Data
This section collects any data citations, data availability statements, or supplementary materials included in this article.


