

Abstract
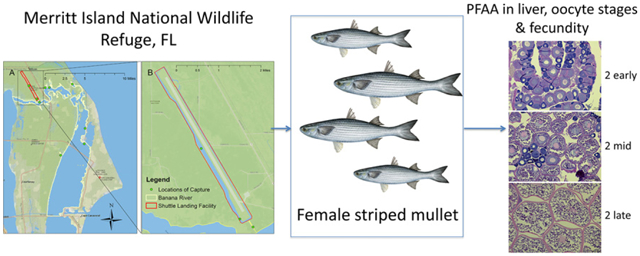
This study investigated wild caught striped mullet (Mugil cephalus) at Merritt Island National Wildlife Refuge (MINWR) for levels of 15 perfluoroalkyl acids (PFAA) in tandem with individual fecundity measurements (Oocyte sub-stage 2 late, n = 42) and oocyte reproductive stages (Stages 1–5, n = 128). PFAA measurements were quantified in striped mullet liver (n = 128), muscle (n = 49), and gonad (n = 10). No significant negative impacts of liver PFAA burden on wild-caught, mullet fecundity endpoints were observed in this study; however, changes in PFAA were observed in the liver as mullet progressed through different sub-stages of oocyte development. Of the PFAA with significant changes by sub-stage of oocyte development, the carboxylic acids (perfluorooctanoic acid, perfluorononanoic acid, and perfluorotridecanoic acid) increased in the liver with increasing sub-stage while the sulfonic acid and its precursor (perfluorooctanesulfonic acid (PFOS) and perfluorooctanesulfonamide, respectively) decreased in the liver with increasing sub-stage of oocyte development. This is a unique find and suggests PFAA change location of compartmentalization as mullet progress towards spawning. Investigations also revealed higher than expected median muscle and gonad levels of PFOS in striped mullet collected at MINWR (9.01 ng/g and 80.2 ng/g, respectively).
Keywords: PFOS, Teleost, Fecundity, PFOA, Wildlife
GRAPHICALABSTRACT
1. Introduction
Perfluoroalkyl acids (PFAA) are a commonly studied family within the larger group of chemicals known as perfluoroalkyl substances (PFAS). PFASs are organic chains (branched and linear) in which all hydrogen atoms attached to the carbon backbone have been substituted for a fluorine atom creating a carbon fluoride (C—F) bond. Two subclasses of the PFAA family that will be investigated in this study are perfluoroalkyl carboxylic acids (PFCAs) and perfluoroalkyl sulfonic acids (PFSAs). Structurally, PFCAs and PFSAs have the general chemistry formula CnF2n + 1COOH and CnF2n + 1SO3H, respectively (Buck et al., 2011).
With numerous applications in waterproofing, stain proofing, and firefighting products (Moody and Field, 2000; Kärrman et al., 2011; de Solla et al., 2012; Place and Field, 2012; Laitinen et al., 2014), PFAA have found their way into the environment (de Solla et al., 2012), humans (Homo sapiens) (Laitinen et al., 2014), and wildlife (Houde et al., 2011) across the globe. Recent investigations of PFAA levels in the American alligator (Alligator mississippiensis) in Florida and South Carolina revealed variations in PFAA burden by site, noting that alligators residing at Merritt Island National Wildlife Refuge (MINWR) maintained the highest PFAA burden compared to alligators present at other southeastern sampling sites (Bangma et al., 2017a). This would suggest that wildlife around MINWR is at higher risk to potential exposure to PFAA in comparison to other investigated sites within Florida and South Carolina. Within wildlife, studies have shown the highest levels of PFAA reside in protein heavy matrices such as the liver, kidney, and plasma (Kudo, 2015).
PFAA have shown a variety of health effects such as immunotoxicity (DeWitt et al., 2012), neurotoxicity (Liao et al., 2009), and reduced fertility and fecundity. These reduced fecundity rates, due to PFAA exposure, have been observed in human (Fei et al., 2009; Velez et al., 2015), copepod (Tigriopus japonicas) (Han et al., 2015), nematode (Caenorhabditis elegans) (Tominaga et al., 2004), and freshwater flea (Hyalella azteca) (Lee et al., 1986) studies, while some human (Whitworth et al., 2012) and zebra fish (Danio rerio) (Wang et al., 2011) studies have shown no adverse effects of the investigated PFAA on fecundity.
The pathways for possible mechanisms of action are still being elucidated for many of these effects. Some are peroxisome-proliferator activating receptor alpha (PPARα) dependent (Ren et al., 2009) and some are PPARα independent (Ren et al., 2009; Rosen et al., 2010). While PPARα is expressed in grey mullet (Chelon labrosus) liver and gonad tissue (Raingeard et al., 2006), potential PPARα independent mechanisms for changes in fecundity and fertility in teleosts have begun to be investigated as well. Changes in liver histology has been recorded in both male and female zebra fish exposed to perfluorooctanesulfonic acid (PFOS) (Cui et al., 2017), as well as changes in expression of vitellogenic genes recorded in tilapia (Oreochromis niloticus) hepatocytes (Liu et al., 2007) and zebra fish (Brachydanio rerio) livers (Cheng et al., 2012). In the case of the tilapia hepatocytes, the changes in expression of vitellogenic genes depended upon co-exposures with estrogen. While most of these studies have been conducted in a controlled laboratory setting, it is possible PFOS and other PFAA may impact or change a female teleost’s fecundity through impacts on the liver and gonad in the wild.
To date, no study published has attempted to measure potential fecundity effects in a wild population. MINWR is ideally suited to investigate potential wildlife fecundity effects of PFAA due to the higher levels of PFAA measured in organisms (American alligators) compared to other locations in Florida and South Carolina (Bangma et al., 2017a). Therefore, this study aimed to investigate PFAA levels and fecundity measures in a locally abundant marine species that is a prey species of alligators at MINWR and is also consumed by local fishermen in the surrounding areas outside of MINWR. Of the several fish species present at MINWR that met both of these criteria, the striped mullet (Mugil cephalus), was among the earliest to mature and was also one of the few species that undergoes isochronal spawning. These qualities ensure minimal effect of sampling on the population and provide highly accurate fecundity measurements. Overall, this study aimed to investigate PFAA burden and fecundity endpoints in sexually mature, female striped mullet early in the spawning season at MINWR.
2. Materials and methods
2.1. Sample collection
Collections of striped mullet were conducted at MINWR under the protocol GRD-06–044 reviewed by the Institutional Animal Care and Use Committee (IACUC). Sampling occurred during October 24–28 (n = 83) and December 4–7, 2016 (n = 45) to ensure that samples were collected during the time period where reproductive development was occurring for the spawning season (McDonough et al., 2003). Striped mullet were obtained from numerous locations throughout the Banana River (BR), as well as from the drainage ditch that runs the length of the Shuttle Landing Facility (SLF) at Kennedy Space Center (Supplemental Information (SI), Fig. S1). Unlike the fish in the Banana River, that were free to move about the entirety of the estuarine system, the fish within in the SLF were trapped within the surrounding SLF drainage ditch and were unable to move outside of that area for years at a time (only during infrequent large flood events can mullet move in and out of the SLF). Fish were caught using a cast net (n = 125) as the primary form of sampling gear with a few adult mullet (n = 3) obtained using a 183-m haul seine. Samples obtained using a 183-m haul seine are a result of collaborations with FWC’s Fish and Wildlife Research Institute (FWRI). Of the mullet captured, only adult female mullet larger than 30 cm were collected for this study to ensure that a high percentage of sampled mullet had reached sexual maturity (McDonough et al., 2005). Sex was assessed in the field by applying pressure to the abdomen and looking for the extrusion of milt or eggs (Kucherka et al., 2006).
All mullet identified as female were necropsied within 12 h of capture. Standard morphological measurements taken were total length (TL), standard length (SL), fork length (FL), total height (TH), and fish girth (FG) in cm, and fish weight (FW), liver weight (LW), and gonad weight (GW) in grams (g) (SI, Fig. S2). Fish girth was taken as fish circumference at the same location fish height was measured. Any subsequent mention of fish length in the remaining text will be total length unless otherwise noted. Sagittal otoliths were removed for estimating fish age (See Section 2.6. Aging). Livers were removed, using a clean stainless steel scalpel, stored in methanol rinsed foil, and frozen a −20 °C for later PFAA analysis. Gonads were collected and divided for analysis. One large section from the distal end of the left gonad was wrapped in methanol rinsed foil and frozen at −20 °C for later PFAA analysis. The whole right lobe of the gonad was weighed separately and preserved in 10% neutral buffered formalin (NBF) for fecundity counts. Additionally, a small section (~1 cm3) from the posterior portion of the gonad, where the lobes were joined, was removed and fixed in 10% NBF for histological confirmation of sex and reproductive stage. Muscle was also removed, using a clean stainless steel scalpel, stored in methanol rinsed foil, and frozen a −20 °C for later PFAA analysis.
2.2. Chemicals
Two solutions, National Institute of Standards and Technology (NIST) Reference Materials (RMs) 8446 Perfluorinated Carboxylic Acids and Perfluorooctane Sulfonamide in Methanol and RM 8447 Perfluorinated Sulfonic Acids in Methanol were combined to create calibration solutions for liquid chromatography-tandem mass spectrometry (LC-MS/MS). analysis. The final solution comprised of 15 PFAA as follows: perfluorobutyric acid (PFBA), perfluoropentanoic acid (PFPeA), perfluorohexanoic acid (PFHxA), perfluoroheptanoic acid (PFHpA), perfluorooctanoic acid (PFOA), perfluorononanoic acid (PFNA), perfluorodecanoic acid (PFDA), perfluoroundecanoic acid (PFUnA), perfluorododecanoic acid (PFDoA), perfluorotridecanoic acid (PFTriA), perfluorotetradecanoic acid (PFTA), perfluorobutanesulfonic acid (PFBS), perfluorohexanesulfonic acid (PFHxS), PFOS, and perfluorooctanesulfonamide (PFOSA).
All internal standards (IS) employed in this study were purchased from Cambridge Isotope Laboratories (Andover, MA), RTI International (Research Triangle Park, NC), and Wellington Laboratories (Guelph, Ontario), to create an internal standard (IS) mixture that was comprised of a total of eleven isotopically labeled PFAA. The IS mixture is as follows: [13C4]PFBA, [13C2]PFHxA, [13C8]PFOA, [13C9]PFNA, [13C9]PFDA, [13C2]PFUnA, [13C2]PFDoA, [18O2]PFBS, [18O2]PFHxS, [13C4]PFOS, and [18O2]PFOSA.
NIST Standard Reference Material (SRM) 1946 Organic Contaminants in Lake Superior Fish Tissue were co-analyzed as control materials during PFAA analysis (www.nist.gov/srm/). The PFAA levels of SRM 1946 processed during our extraction met established values reported on the Certificate of Analysis. Measured compounds were considered above the reporting limit (RL) if the concentration of an analyte in the sample was greater than the mean plus three standard deviations of all blanks.
2.3. Sample preparation
Briefly, approximately 1 g of tissue samples (nliver = 128, nmuscle = 49, ngonad = 10), calibrants, blanks, and SRM 1946 were extracted twice using 2.5 mL 0.01 mol/L KOH in methanol after being spiked with approximately 600 μL of the IS mixture which was gravimetrically weighed for each sample (Reiner et al., 2011a). All samples, blanks, SRMs, and calibrants were further purified in methanol using an Envi-carb cartridge (Supelco, Bellefonte, PA) and analyzed by LC-MS/MS.
Samples were analyzed using an Agilent 1100 High Performance Liquid Chromatography system (HPLC; Santa Clara, CA) coupled to an Applied Biosystems API 4000 triple quadrupole mass spectrometer (Applied Biosystems, Foster City, CA) with electrospray ionization in negative mode. An Agilent Zorbax Eclipse Plus C18 analytical column (2.1 mm × 150 mm × 5 μm) was used for separation of PFAA. Each individual sample run involved a ramping LC solvent gradient with methanol and de-ionized water both containing 20 mmol/L ammonium acetate (Reiner et al., 2011b). To ensure no interferences, two multiple reaction monitoring (MRM) transitions for each PFAA were employed. For all PFAA measured, one MRM transition was employed for quantitation and the other MRM transition was used for confirmation of the PFAA (Reiner et al., 2011b).
2.4. Histological processing and staging
Gonad tissues were processed using standard histological techniques (Humason, 1967) and embedded in paraffin and sectioned. Sections were placed on microscope slides and stained with standard haematoxylin and eosin-Y staining techniques. Histological criteria used to determine reproductive stage has been previously established by McDonough et al. (2005) (Table S1). Mullet captured in this study fell into three stages: Stage 2: Developing (n = 84), Stage 4: Atretic or spent (n = 2), and Stage 5: Inactive or resting (n = 42). Stage 2 encompasses a wide range of developing oocytes sizes and vitellogenic stages and therefore was separated into sub-stages for analysis: 2-early (n = 19), 2-mid (n = 24), and, 2-late (n = 42) (Table 1, Fig. S3).
Table 1.
Histological criteria used to determine reproductive sub-stage in stage 2 female striped mullet.
| Reproductive sub-stage | |
|---|---|
| 2 early | Developing oocytes are generally >120 μm and smaller than 200 μm. Cortical alveoli are present but oocytes are still mostly pre-vitellogenic. |
| 2 mid | Developing oocytes begin early stages of vitellogenesis ranging in size from 200 μm to 400 μm. Heterogeneous size structure of oocytes is common in this sub-stage. Nucleus is still visible. |
| 2 late | Developing oocytes are all consistent in size and are in the late stages of vitellogenesis. At this sub-stage, oocytes are all at least 400 μm or larger in size, and nuclear migration to the pole has occurred. |
2.5. Fecundity
Fecundity determinations were made for 42 mullet in the 2-late substage of oocyte development (Table 1). The 400 μm threshold has previously been established as the benchmark at which oocytes to be spawned were identifiable (Shehadeh et al., 1973). Striped mullet are isochronal spawners, so all developing oocytes would be spawned in a single event (McDonough et al., 2003). Fecundity was estimated using a modified gravimetric method as published by McDonough et al. (2003).
The fixed right gonad lobe was patted dry and re-weighed. The ovarian lobe was sampled three times creating three sub-samples for each mullet in the study: one at the posterior, one in the middle, and one at the anterior portion of the gonad. Three sub-samples were taken to account for any differential oocyte density throughout the ovarian lobe (McDonough et al., 2003). These sub-samples were preserved in 70% isopropanol until oocyte counts could be conducted. Sub-sample weights ranged from 0.011 g to 0.031 g. The sub-samples from each specimen were then teased apart, spread along a Bogorov tray, and counted using a dissecting microscope at 10× magnification. Each sub-sample was counted twice and averaged. If counts varied >10%, a third count was performed. Oocyte density was calculated by dividing the mean number of oocytes by the mean weight of all three subsamples for each mullet. The oocyte density was then used to calculate the total oocyte number for each ovary through expansion estimates using the whole gonad weight to produce a measure of fecundity.
2.6. Aging
Age was determined using the sagittal otoliths. After being embedded in epoxy resin, a 0.5-mm traverse section was cut with a low speed isomet saw with 4-in. diamond wafering blades (Buehler). The thin section of the otolith was viewed at 20× magnification. The number of annular rings present was recorded as a proxy for age.
2.7. Statistics
Statistical analysis was performed using IBM SPSS Statistics 22 (Armonk, NY: IBM Corp.) and SAS version 9.4 (Cary NC). Parametric tests were used when data were normally or log-normally distributed and non-parametric tests were employed when data were non-normal. Statistical tests were performed for any PFAA that was detected in 75% or more of samples measured for a tissue type (muscle, liver, gonad). The remaining PFAA were excluded from statistical analysis. For those PFAA included in statistical analysis, PFAA concentrations less than the RL were set equal to half the RL prior to running the statistical tests (Keller et al., 2005). Generalized linear regression models were created for investigations into the relationship between PFAA and fecundity as well as stage and PFAA. Two significant covariates (e.g. fish weight and total length) were included in the models while the remaining non-significant covariates (e.g. age) were excluded from the final models.
3. Results and discussion
3.1. Basic morphometrics
Female mullet collected at MINWR during October and December ranged in total length from 30.9 cm to 51.8 cm with a normal distribution and a mean of 42.1 cm total length. Mullet collected in December (n = 45) were significantly longer than mullet collected in October (n = 83) (p < 0.001) (SI, Table S2, Fig. S4). Sub-stages of collected mullet varied greatly with mullet collected in October showing a wider range of sub-stages than mullet collected in December (SI < Fig. S5). All mullet in sub-stage 2 late (n = 42) used for fecundity measurements were collected in December 2016 from the Banana River. The age of collected mullet ranged from 1 to 6 years of age and did not differ significantly by month of collection (Mann Whitney U, p = 0.126) (SI, Fig. S6). As has been seen by McDonough and colleagues, total length and fish weight were highly correlated for female striped mullet (p < 0.001, r = 0.959, n = 128) (SI, Fig. S7) (McDonough et al., 2003, 2005).
3.2. PFAA detection
Nine of the fifteen PFAA investigated were detected regularly (>75% detection frequency) in the mullet livers (n = 128), and they are as follows (in order of concentration): PFOS, PFHxS, PFUnA, PFDA, PFNA, PFDoA, PFOA, PFOSA, and PFTriA (Table 2). PFTA was detected in 46% of the samples, and the remaining PFAA investigated were below reporting limit (RL) in all liver samples. Of the mullet tissues investigated in this study, liver had the highest levels of investigated PFAA. Five PFAA were regularly detected in mullet gonad (ngonad = 10), and were as follows (in order of concentration): PFOS, PFHxS, PFDA, PFUnA, and PFNA. In addition, PFDoA was detected in 10% of the gonad samples and the remaining PFAA were below the RL in gonad. PFOS was regularly detected in mullet muscle (n = 49), while PFDA, PFNA, PFHxS and PFUnA were detected infrequently in muscle samples (67%, 61%, 13%, and 5%, respectively). All remaining investigated PFAA were below RL in muscle samples. Of the tissues investigated in this study, muscle had the lowest levels of investigated PFAA.
Table 2.
Perfluoroalkyl acid (PFAA) concentrations (ng/g wet mass) in striped mullet at MINWR.
| Organ | PFAA | PFOSA | PFOS | PFHxS | PFOA | PFNA |
|---|---|---|---|---|---|---|
| Liver (n = 128) | % > RL | 88 | 100 | 100 | 98 | 100 |
| Median | 0.102 | 124 | 4.26 | 0.227 | 0.705 | |
| Mean | 0.285 | 192 | 6.81 | 0.329 | 0.996 | |
| Max | 2.05 | 2770 | 113 | 1.82 | 4.11 | |
| Min | <0.009 | 12.6 | 0.386 | <0.010 | 0.120 | |
| PFDA | PFUnA | PFDoA | PFTriA | PFTA | ||
| % > RL | 100 | 95 | 93 | 100 | 46 | |
| Median | 2.07 | 1.98 | 0.385 | 0.217 | <0.011 | |
| Mean | 2.31 | 2.16 | 0.542 | 0.263 | <0.011 | |
| Max | 8.86 | 10.3 | 4.81 | 1.26 | 0.237 | |
| Min | 0.087 | <0.008 | <0.009 | 0.019 | <0.008 | |
| PFHxS | PFOS | PFNA | PFDA | PFUnA | ||
| Gonad (n = 10) | % > RL | 90 | 100 | 100 | 100 | 90 |
| Median | 1.25 | 80.2 | 0.476 | 0.642 | 0.941 | |
| Mean | 1.32 | 90.0 | 0.518 | 0.809 | 0.891 | |
| Max | 2.66 | 202 | 0.994 | 2.06 | 1.93 | |
| Min | <0.035 | 33.5 | 0.166 | 0.303 | <0.040 | |
| PFOS | PFNA | PFDA | ||||
| Muscle (n = 49) | % > RL | 100 | 61 | 67 | ||
| Median | 9.01 | 0.168 | 0.126 | |||
| Mean | 15.7 | 0.182 | 0.146 | |||
| Max | 95.3 | 0.315 | 0.504 | |||
| Min | 1.93 | <0.124 | <0.007 |
Values were calculated with half the RL substituted for non-detects as described in the methods section, but values shown as “<“a specified number describe the actual RL.
3.3. PFAA correlations
Correlations between the various measured PFAA within the mullet liver were investigated (Table 3) to determine if similar PFAA trends were observed in mullet liver compared to alligator plasma at MINWR. All significant correlations between the various measured PFAA were found to be positive. The highest correlations within the liver were between PFUnA and PFDA (r = 0.883). Similar to correlations between PFAA in MINWR alligators (Bangma et al., 2017b), some of the higher correlations in mullet liver were generally found between PFUnA, PFDA, PFDoA, and PFOS. Other PFAA, like PFOA and PFNA, are highly correlated in mullet liver as well, similarly to the alligators at MINWR. This would suggest these correlation similarities seen in both alligators and mullet could be due to exposure from similar sources at or around MINWR or from alligators consuming striped mullet and other prey species in MINWR waters and taking on a similar burden profile.
Table 3.
PFAA correlations in striped mullet liver from MINWR (n = 128). All values are spearman’s rank correlation coefficient rho for non-normal data except when indicated.
| PFNA | PFDA | PFUnA | PFDoA | PFTriA | PFOSA | PFHxS | PFOS | |
|---|---|---|---|---|---|---|---|---|
| PFOA | 0.771** | 0.125 | 0.007 | −0.129 | 0.256** | −0.331** | 0.025 | −0.065 |
| PFNA | 0.407** | 0.206* | −0.024 | 0.452** | −0.211* | 0.275** | 0.333** | |
| PFDA | 0.883** | 0.629** | 0.604** | 0.572** | 0.258** | 0.749** | ||
| PFUnA | 0.806** | 0.618** | 0.633** | 0.239** | 0.695** | |||
| PFDoA | 0.601** | 0.597** | 0.133 | 0.510** | ||||
| PFTriA | 0.221* | −0.051 | 0.296** | |||||
| PFOSA | 0.213* | 0.560** | ||||||
| PFHxS | 0.615** |
Results from Pearson’s for log normal data.
Correlation is significant at the 0.05 level (2-tailed).
Correlation is significant at the 0.01 level (2-tailed).
In addition, PFAA correlations between tissues were briefly investigated in this study. PFOS was the only PFAA measured over RL in 75% or more of the muscle samples, so PFOS correlations between liver and muscle were examined. Liver to muscle PFOS correlation was highly significant (p < 0.0001, r = 0.959, n = 49). Therefore, a measure of PFOS in muscle tissue can predict PFOS in the liver tissue and vice versa. On average liver PFOS was 12 times higher than muscle PFOS.
Even though PFAA were measured in only 10 gonads from the mullet sampled for this study, correlations between liver and gonad PFAA were briefly examined. Of the five PFAA measured regularly over RL in the gonads (Table 2), significant correlations were found for PFNA (p = 0.011, r = 0.757, n = 10) and PFDA (p = 0.019, r = 0.721, n = 10). PFAA measurements in the remaining mullet gonads (n = 118) should be investigated in the future to improve upon the strength of correlations determined here, as well as, possibly revealing additional correlations that were missed due to small sample numbers (n = 10).
3.4. PFAA by location
Since mullet were captured from two distinct locations, the SLF and BR, we investigated differences in PFAA concentration by location of capture. First, levels in mullet liver by location (SLF liver: n = 20, BR liver: n = 108) were investigated. Significant differences between SLF and the BR were found for PFOS (p < 0.001), PFHxS (p < 0.001), and PFDoA (p = 0.022) (Fig. 1) with mullet in the SLF containing significantly higher liver concentrations than mullet in the BR. In general, PFOS, PFHxS, and PFDoA were 4, 3.5 and 2 times higher in the SLF livers than the BR livers, respectively. This is not an unexpected result because the SLF site has held fire training events nearby using aqueous fire-fighting foams (AFFFs) in the past. In addition, AFFFs are a mixture of PFAA, most notably PFOS and PFHxS, and alligators captured in the SLF region have shown high levels of plasma PFOS (Bangma et al., 2017b). Higher variations were also found in the SLF livers, this may be due to infrequent flood events allowing fish to briefly move in and out of the SLF impoundment creating a mixture of fish that have been trapped in the SLF for long periods of time (resulting in higher liver PFAA) and fish who only recently swam into the SLF during a flood event (resulting in lower liver PFAA).
Fig. 1.

Median ng/g of PFOS (p < 0.001), PFHxS (p < 0.001), and PFDoA (p = 0.022) in mullet liver by location of capture (BR liver: n = 108, SLF liver: n = 20). Error bars represent 95% CI.
PFAA by location were also investigated in the muscle tissue of the collected striped mullet. Since higher levels of certain PFAA were observed in livers from SLF compared to BR, all 20 SLF collected mullet were included in the muscle analysis, and 29 randomly selected mullet were included from the BR. Muscle tends to maintain lower levels of PFAA than the liver in most vertebrates (Houde et al., 2011), and that was the case for the MINWR mullet. Only PFOS, PFDA, and PFNA were measureable above RL in 50% or more of the muscle samples (n = 49) (Table 2), of those three, PFOS (p < 0.001) was the only PFAA to show a significant difference by location of capture (SI, Fig. S8).
The levels of PFOS in mullet muscle exhibit a wide range (median, 9.48 ng/g; range, 1.93 ng/g–95.3 ng/g). These values of PFOS in mullet muscle at MINWR were higher than expected since mullet are low on the aquatic food web (Xue et al., 2017), and certain PFAA like PFOS tend to be higher at the upper trophic levels due to bioaccumulation up the food web (Houde et al., 2006; Muller et al., 2011). No studies have focused on PFAA concentration in muscle in fish low on the food chain from North or South American for comparison. One previous study focused on PFAA such as PFOS in the American alligator (Bangma et al., 2017a; Bangma et al., 2017b). However, that study examined PFOS burden in plasma in American alligators which was not directly comparable to the mullet muscle values obtained in this study.
Levels of PFOS in striped mullet muscle from MINWR were compared to Fish Consumption Screening Values (FCSV) developed for the Michigan Fish Consumption Advisory Program for PFOS in September of 2016 (Fig. 2, Table 4) (Michigan Department of Health and Human Services, 2016). Michigan’s FCSV is one of the only regulations on PFOS consumption in fish tissue in the United States and is the most recent regulation released to the public. Michigan’s FCSV values are intended to be guidelines for the general public in Michigan to delineate how often PFOS burdened fish should be consumed. While no commercial harvesting occurs on MINWR grounds, mullet travel long distances and are free to leave the BR into surrounding area where commercial fishing does occur, so this study will compare MINWR muscle PFOS levels to Michigan’s FCSV values.
Fig. 2.

Individual mullet muscle PFOS levels compared to total length of fish. Fish Consumption Screening Values (FCSV) developed for the Michigan Fish Consumption Advisory Program (September 2016) are indicated (Michigan Department of Health and Human Services, 2016).
Table 4.
Fish Consumption Screening Values (FCSV) as defined by the State of Michigan in September of 2016 (Michigan Department of Health and Human Services, 2016) and number and percent of striped mullet that fall within each consumption class for all location measured for mullet muscle, SLF muscle, and BR muscle.
| All locations (n = 49) | SLF (n = 20) | BR (n = 29) | |||||
|---|---|---|---|---|---|---|---|
| Muscle PFOS (ng/g) | Meals per month | n | % | n | % | n | % |
| ≤9 | 16 | 24 | 49 | 3 | 15 | 21 | 72 |
| >9 to 13 | 12 | 8 | 16 | 3 | 15 | 5 | 17 |
| >13 to 19 | 8 | 4 | 8 | 1 | 5 | 3 | 10 |
| >19 to 38 | 4 | 9 | 18 | 6 | 30 | 3 | 10 |
| >38 to 75 | 2 | 3 | 6 | 3 | 15 | 0 | 0 |
| >75 to 150 | 1 | 1 | 2 | 1 | 5 | 0 | 0 |
| >150 to 300 | 6 meals per year | 0 | 0 | 0 | 0 | 0 | 0 |
| >300 | Do not eat | 0 | 0 | 0 | 0 | 0 | 0 |
MINWR mullet muscle PFOS levels fall into a variety of the Michigan’s FCSV categories ranging from 16 meals per month to once a month (Fig. 2, Table 4). Mullet collected from the SLF consistently fell into stricter consumption categories compared to BR mullet. This follows logically with the significantly higher PFOS in SLF mullet muscle compared to BR mullet muscle. For the most part, mullet inside the SLF cannot make it to the BR except in the event of extreme flooding events which occur infrequently. No mullet collected from either the SLF or BR at MINWR fell into the “Do Not Eat” category. One interesting note, there is no ‘no limit’ category at the low end of PFOS muscle burden. The FCSV states this is due to
“the still emerging information on health effects from PFOS exposure, and background exposure to the general population, and potential health effects from exposure to multiple [perfluorinated substances].”
Like mullet muscle, female mullet ovaries, also known as mullet roe, are consumed by humans, and there is a significant commercial roe fishery for mullet in Florida waters (Chargaris et al., 2014). Therefore, human exposure to PFAA through roe consumption should be investigated, especially since mullet gonad contains higher levels of PFOS than mullet muscle (Table 2). No consumption advisories have been created for mullet roe due to the lack of knowledge on prevalence and portion size of mullet roe consumption. Since a roe consumption advisory does not exist, this study compared roe PFOS levels for the 10 gonads measured in this study to the Michigan FCSV for fish muscle. The comparison revealed that even among the 10 mullet gonad measured from BR in this study, one fell into the category six meals per year (Fig. S9). This would indicate that even mullet collected from the BR, have levels of PFAA in their roe that is a concern when it comes to consumption. No significant correlation between PFOS in the gonad and PFOS in the liver were found, In order to estimate the levels of PFOS in the remaining collected mullet roe, further chemical extraction and analysis of mullet gonads from BR and SLF would be required.
3.5. PFAA and fecundity
Of the 128 sampled female striped mullet, 42 collected in December had eggs in sub-stage 2 late that were included in the fecundity assessment. A generalized linear model for fecundity was created for each liver PFAA investigated (detected in over RL in >75% of samples). Each model included total length and fish weight which were significant covariates and excluded all other non-significant covariates such as age. While both fish weight and total length were significant, fish weight was more highly significant compared to total length in the model. No significant interaction was found between liver PFAA and total length, and liver PFAA and fish weight with one exception: PFHxS and fish weight (p = 0.0373).
By testing interaction terms in the models, we were able to assess whether the magnitude of association between the main effect, PFAA and fecundity, varied by fish weight or fish length. If no significant interaction is found, then the main effect may be generalized to all fish lengths and weights. Looking at the main effect parameter for the nine liver PFAA, we found that PFNA, PFDA, and PFUnA were significantly related to fecundity with increasing liver PFAA leading to increasing number of eggs (Table 5). In addition, PFUnA, PFDoA, PFTriA, and PFOSA all trended (0.05 < p < 0.10) to a similar pattern as PFNA, PFDA, and PFUnA with increasing PFAA and increasing total eggs. These results highlight that carboxylic acids ranging from 9 to 11 carbons show a stronger relationship than the longer carboxylic acids with >12 carbons. While no sulfonic acid showed significance, PFOSA, a precursor to PFOS, trended towards significance.
Table 5.
Results of a generalized linear regression model for fecundity and PFAA. p-Values shown above represent a significant or non-significant change in total eggs (fecundity) with changing PFAA concentration (ng/g). The main effect beta values represent the change in total eggs with 1 ng/g increase in liver PFAA. Interaction terms determine if changing fish weight or total length change the relationship of PFAA with fecundity.
| PFAA | p-value | Main effect beta value | Main effect standard error | PFAA & fish weight interaction p-value | PFAA & total length interaction p-value |
|---|---|---|---|---|---|
| PFOA | 0.136 | 109305 | 71698 | 0.8946 | 0.8445 |
| PFNA | 0.025 | 87668 | 37567 | 0.3334 | 0.7501 |
| PFDA | 0.033 | 53386 | 24083 | 0.1571 | 0.8315 |
| PFUnA | 0.030 | 37765 | 16720 | 0.9275 | 0.7264 |
| PFDoA | 0.067 | 61178 | 32382 | 0.6386 | 0.1197 |
| PFTriA | 0.081 | 183035 | 102140 | 0.9823 | 0.6856 |
| PFOSA | 0.066 | 290466 | 153405 | 0.1004 | 0.4652 |
| PFHxS | 0.875 | −2151 | 13564 | 0.0373 | 0.3745 |
| PFOS | 0.317 | 534 | 527 | 0.1048 | 0.9450 |
Red indicates p ≤ 0.05 while green indicates 0.05 < p ≤ 0.10.
We hypothesize that increasing PFAA is related to increasing number of eggs in this study because mullet with higher total length and greater fish weight would consume more food than smaller mullet. The consumption of more food would lead to both an increase in energy for production of more total eggs (fecundity) and an increase in the consumption (and accumulation) of PFAA via diet (Mortensen et al., 2011). Therefore, we do not propose a direct causal relationship between an increase in PFAA with increasing eggs, or vice versa, but rather that both are affected by the mullet’s diet. This would mean diet may confound the relationship between PFAA and measures of fecundity. Unlike some laboratory studies, no significant negative impacts of PFAA on wild-caught, mullet fecundity endpoints were observed in this study. While that was the case in this study, future aqua culture studies that control for diet fluctuations and dose at various levels of PFAA may still reveal subtle links between PFAA and fecundity in teleosts.
3.6. Sub-stage and PFAA
All 128 female mullet collected for this study were staged for oocyte development and a model created to assess the relationship between sub-stage and liver PFAA. Again, a generalized linear regression model was created and included significant covariates total length and fish weight while excluding all other non-significant covariates such as age. Sub-stages were investigated in this model due to the wide variety of developing oocytes sizes and vitellogenic stages found in stage 2. The progression of the histological changes within stage 2 is important to distinguish between because they correspond to physiological changes that might impact or be related to changes in PFAA levels. For this model, sub-stages were defined as an ordered variable. Since the mullet collected in this study were all of reproductively active age (no stage 1 (immature) fish were captured), stage 5 (resting) was considered a resting state prior to the 2016 spawning season, followed by stage 2 developing stages (early, mid, and late), stage 3 (hydrated oocytes, imminent spawning), and finally progressing to stage 4 (atresia). Stages 3 and 4 were excluded from statistical analysis due to sample sizes of 0 and 2, respectively.
Significant differences between sub-stages of oocyte development and liver PFAA were discovered for PFOA, PFNA, PFTriA, PFOSA, and PFOS (Table 6). PFDoA also trended towards significance (p = 0.0655 in the main effect beta value). The resulting beta value varies from positive to negative depending on the PFAA and seems to change depending on whether the PFAA is a carboxylic or sulfonic acid. Of the PFAA with significant changes by sub-stage, the carboxylic acids (PFOA, PFNA, and PFTRiA) increase in the liver with increasing sub-stage of oocyte development while the sulfonic acid and its precursor (PFOS and PFOSA, respectively) decrease in the liver with increasing stage of oocyte development. The liver plays an important physiological role in vitellogenesis for oocyte development in teleost (Ng and Idler, 1983), and these differences in PFAA by sub-stage may reflect physiological changes in protein abundance in the liver and/or locations in various organs that show affinities for carboxylic acids and sulfonic acids.
Table 6.
Results of generalized linear regression models for the main effect of sub-stage and PFAA and interaction terms. The main effect beta value represents the change in PFAA with one increase sub-stage development. The p-values determine whether the associated beta value represents a significant or non-significant change in PFAA with progressing egg development (sub-stage). Interaction term beta values determine the estimated change in PFAA by sub-stage based on the length or weight of the fish and can be used to calculate the change in various length or weight fish for each PFAA. Interaction term p-values determine if total length (Model 1) or Fish Weight (Model 2) beta values significantly affect the relationship between PFAA and sub-stage of development. Non-significant interaction terms were not included in the table.
| PFAA | Model 1. Substage, total length, and substage * length interactiona | Model 2. Substage, fish weight, and substage * weight interaction | ||
|---|---|---|---|---|
| Substage main effect | Substage * length interaction | Substage main effect | Substage * weight interaction | |
| Beta and p-value | Beta and p-value | Beta and p-value | Beta and p-value | |
| PFOA | −0.3895 (0.09) | 0.0113 (0.03) | −0.0758 (0.29) | 0.0002 (0.02) |
| PFNA | −2.2263 (<0.01) | 0.0563 (<0.01) | −0.6541 (< 0.01) | 0.0010 (<0.01) |
| PFDA | −0.10952 (0.44) | N/A | −0.1074 (0.45) | N/A |
| PFUnA | −0.0238 (0.88) | N/A | 0.07235 (0.65) | N/A |
| PFDoA | 0.9163 (0.06) | −0.0199 (0.08) | 0.3856 (0.01) | −0.0003 (0.07) |
| PFTriA | −0.2940 (0.053) | 0.0078 (0.03) | −0.0499 (0.30) | 0.0001 (0.03) |
| PFOSA | 0.8755 (<0.01) | −0.0238 (<0.01) | 0.2089 (0.01) | −0.0004 (<0.01) |
| PFOS | −56.817 (0.04) | N/A | −56.799 (0.04) | N/A |
| PFHxS | −1.5324 (0.16) | N/A | −1.6832 (0.12) | N/A |
We present model results with the interaction term if it was significant at p < 0.10. If not, we present the model results controlling for total length or fish weight, but not including the interaction term.
Interaction terms were assessed for these models, and a number of significant interactions were found between sub-stage and fish weight, as well as for sub-stage and total length (Table 6). A significant interaction value in this model indicated that the magnitude of association between PFAA and sub-stage depends on total length (or weight) of the fish. If the interaction beta value is positive, then fish with longer length have an increased main effect beta value for the relationship between PFAA level and sub-stage compared to shorter fish. This may represent a weakening or a strengthening of the magnitude of effect depending on whether the main effect parameter was positive or negative. If the interaction beta value is negative, then fish with longer length have a decreased main effect beta value for the relationship between PFAA level and sub-stage compared to shorter fish. In Table 6, we present the results of models with appropriate interaction terms if the interaction p-value was below 0.10. Otherwise, we present results from models controlling for fish weight or total length, but without fitting the interaction term. In models including the interaction term, the main effect and interaction beta values can be used together to calculate the change in PFAA as sub-stages progress for fish of varying total length and fish weight. We present a summary of these calculations for PFAA with significant interaction terms (PFOA, PFNA, PFDoA, PFTriA, and PFOSA) in Table 7 for fish at varying total length and fish weight (minimum, mean and maximum) to get an idea of how fish at various length and weight see changes in liver PFAA as they progress through sub-stages of oocyte development.
Table 7.
Changes in PFAA (ng/g) by sub-stage for fish of varying fish weight (g) and total length (cm) are calculated for PFAA that resulted in significant interaction terms in Table 6. Minimum, mean, and maximum for both fish weight and total length were included in calculations to represent the change in PFAA by sub-stage across all fish weights and lengths collected for this study.
| Fish weight (g) | Total length (cm) | |||||
|---|---|---|---|---|---|---|
| Minimum | Mean | Maximum | Minimum | Mean | Maximum | |
| 287 | 803 | 1557 | 30.9 | 42.1 | 51.8 | |
| PFOA | 2.854 | 8.684 | 17.205 | −0.070 | −0.067 | −0.065 |
| PFNA | 13.932 | 42.983 | 85.433 | −0.623 | −0.612 | −0.602 |
| PFDoA | −4.795 | −15.063 | −30.068 | 0.376 | 0.373 | 0.370 |
| PFTriA | 1.945 | 5.969 | 11.851 | −0.047 | −0.046 | −0.045 |
| PFOSA | −5.955 | −18.236 | −36.181 | 0.197 | 0.192 | 0.188 |
We hypothesize these interaction terms are likely due to the time of year the mullet were sampled. For example, all mullet from this study were sampled in late October and early December. This would place sampling for this study during the early portion of the mullet spawning season which runs from October through April (McDonough et al., 2003). During the spawning season, larger mullet tend to have more energy reserves and, therefore, develop oocytes earlier than smaller mullet. Therefore, this study collected of a variety of sized female mullet where the larger mullet were ahead in sub-stages of oocyte development compared to the smaller mullet due to the time of sampling. It is possible the interaction terms seen in this model would no longer be significant if mullet sampling events were taken at multiple time points that spanned the entire spawning season and not just the early spawning season.
4. Conclusions
This study revealed higher than expected muscle and gonad levels of PFOS in striped mullet collected at MINWR. While no PFOS levels measured in muscle and gonad fell within the Michigan FCSV “Do not eat” category for the consumption of fish muscle containing PFOS, many of the muscle and gonad (known as mullet roe) samples did fall within restriction levels ranging from between “16 meals a month” to only “1 meal a month.” Fish from the higher restriction categories came from the SLF sampling area and are potentially unlikely to reach commercial fisheries due to entrapment in the SLF impoundment.
This study also revealed changes in liver PFAA (a key organ in vitellogenesis) as mullet progress through different sub-stages of oocyte development. Of the PFAA with significant changes by sub-stage, the carboxylic acids (PFOA, PFNA, and PFTRiA) increase in the liver with increasing sub-stage of oocyte development while the sulfonic acid and its precursor (PFOS and PFOSA, respectively) decrease in the liver with increasing stage of oocyte development. This is a unique find and suggests PFAA change location of compartmentalization as mullet progress towards spawning. This is likely due to changes in abundance and location of various proteins that have affinity for various PFAA.
In addition, this study found an increase in PFAA with increasing number of oocytes (fecundity), however, increasing PFAA was not directly related to increasing fecundity of the mullet. The mullets’ diet represents a confounding variable in the study that cannot be removed without a more controlled experiment. Therefore, unlike some laboratory studies, no significant negative impacts of PFAA on wild-caught, mullet fecundity endpoints were observed in this study. Future aquaculture studies that control for diet fluctuations and dose at various levels of PFAA may still reveal links between PFAA and fecundity in teleosts.
Supplementary Material
HIGHLIGHTS.
High liver PFOS in Striped mullet (median, 124 /g; range, 12.6–2770 ng/g)
Liver PFOA, PFNA, & PFTriA increase with increasing oocyte development.
Liver PFOS and PFOSA decrease with increasing oocyte development.
No significant negative impacts of liver PFAA on wild-caught, mullet fecundity
Acknowledgements
We would like to thank Bonnie Ahr, Eric Reyier, and the Florida Fish & Wildlife Conservation Commission, Fish & Wildlife Research Institute’s Fisheries-Independent Monitoring program for their help in the field collecting mullet using their 183-m haul seine net. This is contribution number 779 of the Marine Resouces Research Institute of the South Carolina Dept. of Natural Resources.
Funding
Funding for this research was provided by Integrated Mission Support Service LLC [IMSS-MSA-16-0019]. The material presented here is also based on work supported by the South Carolina Clinical & Translational Research (SCTR) Institute, with an academic home at the Medical University of South Carolina through NIH/NCATS Grant Number UL1 TR001450.
Footnotes
Publisher's Disclaimer: Disclaimer
Publisher's Disclaimer: Certain commercial equipment or instruments are identified in the paper to specify adequately the experimental procedures. Such identification does not imply recommendations or endorsement by the NIST; nor does it imply that the equipment or instruments are the best available for the purpose.
Appendix A. Supplementary data
Supplementary data to this article can be found online at https://doi.org/10.1016/j.scitotenv.2017.11.141.
References
- Bangma JT, Bowden JA, Brunell AM, Christie I, Finnell B, Guillette MP, Jones M, Lowers RH, Rainwater TR, Reiner JL, Wilkinson PM, Guillette LJ Jr, 2017a. Perfluorinated alkyl acids in plasma of American alligators (Alligator mississippiensis) from Florida and South Carolina. Environ. Toxicol. Chem 36, 917–925. [DOI] [PMC free article] [PubMed] [Google Scholar]
- Bangma JT, Reiner JL, Jones M, Lowers RH, Nilsen F, Rainwater TR, Somerville S, Guillette LJ, Bowden JA, 2017b. Variation in perfluoroalkyl acids in the American alligator (Alligator mississippiensis) at Merritt Island National Wildlife Refuge. Chemosphere 166, 72–79. [DOI] [PMC free article] [PubMed] [Google Scholar]
- Buck RC, Franklin J, Berger U, Conder JM, Cousins IT, de Voogt P, Jensen AA, Kannan K, Mabury SA, van Leeuwen SPJ, 2011. Perfluoroalkyl and polyfluoroalkyl substances in the environment: Terminology, classification, and origins. Integr. Enviro. Assess. Manage 7, 513–541. [DOI] [PMC free article] [PubMed] [Google Scholar]
- Chargaris D, Addis D, Mahmoudi B, 2014. The 2014 Update of the Stock Assessment for Striped Mullet, Mugil cephalus. Florida Florida Fish and Wildlife Conservation Commission. Florida Wildlife Research Institute, St. Petersburg. [Google Scholar]
- Cheng Y, Cui Y, Dang Z, Xie W, Li H, Yin H, Chen H, 2012. Effects of perfluorooctane sulfonate (PFOS) exposure on vitellogenin mRNA level in zebrafish (Brachydanio rerio). Huan Jing Ke Xue 33, 1865–1870. [PubMed] [Google Scholar]
- Cui Y, Lv S, Liu J, Nie S, Chen J, Dong Q, Huang C, Yang D, 2017. Chronic perfluorooctanesulfonic acid exposure disrupts lipid metabolism in zebrafish. Hum. Exp. Toxicol 36, 207–217. [DOI] [PubMed] [Google Scholar]
- DeWitt JC, Peden-Adams MM, Keller JM, Germolec DR, 2012. Immunotoxicity of perfluorinated compounds: recent developments. Toxicol. Pathol 40, 300–311. [DOI] [PubMed] [Google Scholar]
- Fei C, McLaughlin JK, Lipworth L, Olsen J, 2009. Maternal levels of perfluorinated chemicals and subfecundity. Hum. Reprod 24, 1200–1205. [DOI] [PubMed] [Google Scholar]
- Han J, Won E-J, Lee M-C, Seo JS, Lee S-J, Lee J-S, 2015. Developmental retardation, reduced fecundity, and modulated expression of the defensome in the intertidal copepod Tigriopus japonicus exposed to BDE-47 and PFOS. Aquat. Toxicol 165, 136–143. [DOI] [PubMed] [Google Scholar]
- Houde M, Bujas TAD, Small J, Wells RS, Fair PA, Bossart GD, Solomon KR, Muir DCG, 2006. Biomagnification of perfluoroalkyl compounds in the bottlenose dolphin (Tursiops truncatus) food web. Environ. Sci. Technol 40, 4138–4144. [DOI] [PubMed] [Google Scholar]
- Houde M, De Silva AO, Muir DCG, Letcher RJ, 2011. Monitoring of perfluorinated compounds in aquatic biota: an updated review. Environ. Sci. Technol 45, 7962–7973. [DOI] [PubMed] [Google Scholar]
- Humason GL, 1967. Animal Tissue Techniques. 2nd ed W.H. Freeman and Company, San Francisco, California, USA: (426 pp). [Google Scholar]
- Kärrman A, Elgh-Dalgren K, Lafossas C, Møskeland T, 2011. Environmental levels and distribution of structural isomers of perfluoroalkyl acids after aqueous fire-fighting foam (AFFF) contamination. Environ. Chem 8, 372–380. [Google Scholar]
- Keller JM, Kannan K, Taniyasu S, Yamashita N, Day RD, Arendt MD, Segars AL, Kucklick JR, 2005. Perfluorinated compounds in the plasma of loggerhead and Kemp’s Ridley Sea turtles from the southeastern coast of the United States. Environ. Sci. Technol 39, 9101–9108. [DOI] [PubMed] [Google Scholar]
- Kucherka WD, Thomas P, Khan IA, 2006. Sex differences in circulating steroid hormone levels in the red drum, Sciaenops ocellatus L. Aquac. Res 37, 1464–1472. [Google Scholar]
- Kudo N, 2015. Metabolism and pharmacokinetics In: DeWitt JC (Ed.), Toxicological Effects of Perfluoroalkyl and Polyfluoroalkyl Substances. Springer, pp. 151–175. [Google Scholar]
- Laitinen JA, Koponen J, Koikkalainen J, Kiviranta H, 2014. Firefighters’ exposure to perfluoroalkyl acids and 2-butoxyethanol present in firefighting foams. Toxicol. Lett 231, 227–232. [DOI] [PubMed] [Google Scholar]
- Lee C, Kim H-M, Choi K, 1986. Toxicity assessment of PFOA and PFOS using freshwater flea Hyalella azteca. J. Environ. Toxicol 22, 271–277. [Google Scholar]
- Liao C, Wang T, Cui L, Zhou Q, Duan S, Jiang G, 2009. Changes in synaptic transmission, calcium current, and neurite growth by perfluorinated compounds are dependent on the chain length and functional group. Environ. Sci. Technol 43, 2099–2104. [DOI] [PubMed] [Google Scholar]
- Liu C, Du Y, Zhou B, 2007. Evaluation of estrogenic activities and mechanism of action of perfluorinated chemicals determined by vitellogenin induction in primary cultured tilapia hepatocytes. Aquat. Toxicol 85, 267–277. [DOI] [PubMed] [Google Scholar]
- McDonough C.J.a.R., William A, Wenner Charles A., 2003. Fecundity and spawning season of striped mullet (Mugil cephalus L.) in South Carolina estuaries. Fish. Bull 101, 822–834. [Google Scholar]
- McDonough C.J.a.R., William A, Wenner Charles A., 2005. Sexual differentiation and gonad development in striped mullet (Mugil cephalus L.) from South Carolina estuaries. Fish. Bull 103, 601–619. [Google Scholar]
- Moody CA, Field JA, 2000. Perfluorinated surfactants and the environmental implications of their use in fire-fighting foams. Environ. Sci. Technol 34, 3864–3870. [Google Scholar]
- Mortensen AS, Letcher RJ, Cangialosi MV, Chu S, Arukwe A, 2011. Tissue bioaccumulation patterns, xenobiotic biotransformation and steroid hormone levels in Atlantic salmon (Salmo salar) fed a diet containing perfluoroactane sulfonic or perfluorooctane carboxylic acids. Chemosphere 83, 1035–1044. [DOI] [PubMed] [Google Scholar]
- Muller CE, De Silva AO, Small J, Williamson M, Wang X, Morris A, Katz S, Gamberg M, Muir DC, 2011. Biomagnification of perfluorinated compounds in a remote terrestrial food chain: Lichen-Caribou-Wolf. Environ. Sci. Technol 45, 8665–8673. [DOI] [PubMed] [Google Scholar]
- Ng TB, Idler DR, 1983. 8 yolk formation and differentiation in teleost fishes. Fish Physiol. 9, 373–404. [Google Scholar]
- Place BJ, Field JA, 2012. Identification of novel fluorochemicals in aqueous film-forming foams used by the US Military. Environ. Sci. Technol 46, 7120–7127. [DOI] [PMC free article] [PubMed] [Google Scholar]
- Raingeard D, Cancio I, Cajaraville MP, 2006. Cloning and expression pattern of peroxisome proliferator-activated receptor alpha in the thicklip grey mullet Chelon labrosus. Mar. Environ. Res 62 (Suppl), S113–117. [DOI] [PubMed] [Google Scholar]
- Reiner JL, O’Connell SG, Moors AJ, Kucklick JR, Becker PR, Keller JM, 2011a. Spatial and temporal trends of perfluorinated compounds in beluga whales (Delphinapterus leucas) from Alaska. Environ. Sci. Technol 45, 8129–8136. [DOI] [PubMed] [Google Scholar]
- Reiner JL, Phinney KW, Keller JM, 2011b. Determination of perfluorinated compounds in human plasma and serum Standard Reference Materials using independent analytical methods. Anal. Bioanal. Chem 401, 2899–2907. [DOI] [PubMed] [Google Scholar]
- Ren H, Vallanat B, Nelson DM, Yeung LWY, Guruge KS, Lam PKS, Lehman-McKeeman LD, Corton JC, 2009. Evidence for the involvement of xenobiotic responsive nuclear receptors in transcriptional effects upon perfluoroalkyl acid exposure in diverse species. Reprod. Toxicol 27, 266–277. [DOI] [PubMed] [Google Scholar]
- Rosen MB, Schmid JR, Corton JC, Zehr RD, Das KP, Abbott BD, Lau C, 2010. Gene Expression Profiling in Wild-type and PPAR Alpha Null Mice Exposed to Perfluorooctane Sulfonate Reveals PPAR Alpha-independent Effects. PPAR Research. p. 2010. [DOI] [PMC free article] [PubMed] [Google Scholar]
- Shehadeh ZH, Kuo CM, Milisen KK, 1973. Validation of an in vivo method for monitoring ovarian development in the grey mullet (Mugil cephalus L.). J. Fish Biol 5, 489–496. [Google Scholar]
- de Solla SR, De Silva AO, Letcher RJ, 2012. Highly elevated levels of perfluorooctane sulfonate and other perfluorinated acids found in biota and surface water downstream of an international airport, Hamilton, Ontario, Canada. Environ. Int 39, 19–26. [DOI] [PubMed] [Google Scholar]
- State of Michigan, 2016. Michigan Fish Consumption Advisory Program: Guidance document, Michigan Department of Health and Human Services; http://www.michigan.gov/documents/mdch/MFCAP_Guidance_Document_500546_7.pdf, Accessed date: 4 April 2017. [Google Scholar]
- Tominaga N, Kohra S, Iguchi T, Arizono K, 2004. Effects of perfluoro organic compound toxicity on nematode Caenorhabditis elegans fecundity. J. Health Sci 50, 545–550. [Google Scholar]
- Velez MP, Arbuckle TE, Fraser WD, 2015. Maternal exposure to perfluorinated chemicals and reduced fecundity: the MIREC study. Hum. Reprod 30, 701–709. [DOI] [PMC free article] [PubMed] [Google Scholar]
- Wang M, Chen J, Lin K, Chen Y, Hu W, Tanguay RL, Huang C, Dong Q, 2011. Chronic zebrafish PFOS exposure alters sex ratio and maternal related effects in F1 offspring. Environ. Toxicol. Chem 30, 2073–2080. [DOI] [PMC free article] [PubMed] [Google Scholar]
- Whitworth KW, Haug LS, Baird DD, Becher G, Hoppin JA, Skjaerven R, Thomsen C, Eggesbo M, Travlos G, Wilson R, Longnecker MP, 2012. Perfluorinated compounds and subfecundity in pregnant women. Epidemiology 23, 257–263. [DOI] [PMC free article] [PubMed] [Google Scholar]
- Xue X, Xue J, Liu W, Adams DH, Kannan K, 2017. Trophic magnification of parabens and their metabolites in a subtropical marine food web. Environ. Sci. Technol 51, 780–789. [DOI] [PubMed] [Google Scholar]
Associated Data
This section collects any data citations, data availability statements, or supplementary materials included in this article.