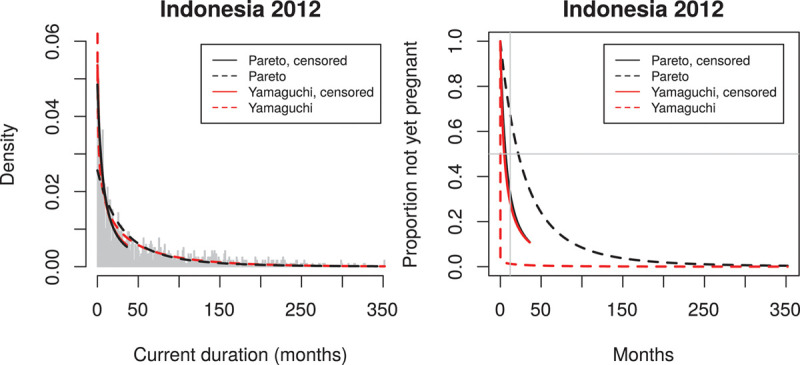
FIGURE 2.

A: Fit of the CD distribution. Broken lines: estimated densities gP(y) and gY(y) based on all 1183 observations; the estimate of gY(0) = 1.75 while estimated gP(0) = 0.27. Fully drawn lines: estimated densities gP(y) and gY(y) based on all 1183 observations, but censoring the 538 observations larger than 36 months at 36 months. B: Estimated survival functions for times to pregnancy (TTP) based on the fits in Fig. 2A.
