Abstract
Purpose
To investigate and quantify the potential benefits associated with the use of stopping-power-ratio (SPR) images created from dual-energy computed tomography (DECT) images for proton dose calculation in a clinical proton treatment planning system (TPS).
Materials and Methods
The DECT and single-energy computed tomography (SECT) scans obtained for 26 plastic tissue surrogate plugs were placed individually in a tissue-equivalent plastic phantom. Relative-electron density (ρe) and effective atomic number (Zeff) images were reconstructed from the DECT scans and used to create an SPR image set for each plug. Next, the SPR for each plug was measured in a clinical proton beam for comparison of the calculated values in the SPR images. The SPR images and SECTs were then imported into a clinical TPS, and treatment plans were developed consisting of a single field delivering a 10 × 10 × 10-cm3 spread-out Bragg peak to a clinical target volume that contained the plugs. To verify the accuracy of the TPS dose calculated from the SPR images and SECTs, treatment plans were delivered to the phantom containing each plug, and comparisons of point-dose measurements and 2-dimensional γ-analysis were performed.
Results
For all 26 plugs considered in this study, SPR values for each plug from the SPR images were within 2% agreement with measurements. Additionally, treatment plans developed with the SPR images agreed with the measured point dose to within 2%, whereas a 3% agreement was observed for SECT-based plans. γ-Index pass rates were > 90% for all SECT plans and > 97% for all SPR image–based plans.
Conclusion
Treatment plans created in a TPS with SPR images obtained from DECT scans are accurate to within guidelines set for validation of clinical treatment plans at our center. The calculated doses from the SPR image–based treatment plans showed better agreement to measured doses than identical plans created with standard SECT scans.
Keywords: proton therapy, stopping power ratio, dual energy CT, range uncertainty, treatment planning
Introduction
To address range uncertainties associated with proton (and ion beam) therapy, additional margins are added to clinical target volumes, which are treated with the full prescription dose [1–3]. Current standard clinical practice involves the use of a 3.5% + 1–2 mm [1, 2] margin with respect to the distal end of all treatment beams, which is added to the clinical target volume. As a result, these extra margins increase the volume of healthy tissues surrounding the tumor that receives a therapeutic dose. As a consequence, beam angles in which the proton beam would stop immediately in front of an adjacent organ at risk (OAR) cannot typically be used because the presence of range uncertainties imply that the beam may range into the OAR. It is widely acknowledged that the consequences of range uncertainties pose a limiting factor in particle-beam radiation-therapy planning. As a result, many researchers are actively pursuing methods of reducing the intrinsic uncertainties in proton and heavy-ion beam radiation therapy. These include the use of in vivo imaging and range-monitoring techniques to verify daily beam delivery [4–8], as well as methods to improve the precision of dose calculation in the patient, such as improved Monte Carlo models [2, 9], proton radiography and proton computed tomography (CT) [10–12], and the use of dual energy CT (DECT) for patient CT simulations [13–17].
A large part of the uncertainty in the beam-range prediction arises from limitations in the clinically accepted method for calculating the stopping power of patient tissues from CT scans [2]. Currently, the stopping-power ratio (SPR), with respect to water, of a given tissue (needed by the treatment planning system [TPS] for dose calculation) is determined from images acquired with a single-energy CT (SECT) scan with stoichiometric CT-to-SPR or CT-to-mass density calibration. However, with DECT, the relative electron density (ρe) and effective atomic number (Zeff) values are calculated directly from the pixel values of the DECT images. Using these values, several researchers have developed models for direct determination [13, 15, 18] and statistical or iterative determination [19, 20] of the proton stopping power. Comparison studies of the SPR values calculated with these direct-calculation models against measured values for aluminum and titanium plugs, tissue-equivalent plastics, and animal tissues have recently been performed [13, 14, 18, 21–23]. The DECT-calculated and the measured SPR values were shown to generally differ by < 1.5% for all tissue-equivalent plastics and animal tissues, with the largest reported differences being for cortical bone. For the metallic plugs, the DECT-calculated SPRs differed from the measured values by ≤ 9.4% as reported by Hünemohr et al [13]. Wohlfahrt et al [14] compared 2 methods for calculating SPRs directly from DECT scans with the use of a CT-to-SPR calibration curve in a complex anthropomorphic head phantom. They reported that treatment plans in which the dose was calculated from direct DECT-determined SPRs showed better agreement (compared with SECT-determined SPRs) with a dose measured in the phantom, particularly, in smooth homogeneous portions of the phantom. However, several researchers [13, 14, 24] have found that, in areas with small boney structures or air cavities, the agreement between doses calculated with DECT-determined SPRs and measured doses suffered because of image-smoothing effects.
Recent studies [25, 26] have investigated the feasibility of using DECT for proton treatment planning of tumors in the thoracic and head and neck regions. Taasti et al [25] report an approximately 1% SPR difference between DECT and SECT treatment plans in the head and neck region. Wohlfahrt et al [26] outline a methodology for combining DECT with time-resolved image acquisition to generate 4-dimensional (4D)-DECT, which they subsequently used for proton dose calculation. Their results indicate that deformable image registration can be used to reduce differences between 2 different 4D-DECT image acquisitions. Both studies have noted the expected improvements in proton treatment planning accuracy associated with the use of DECT for SPR estimation.
This study investigates the clinical implementation and potential benefits associated with the use of DECT images for proton dose calculation. Although there have been few studies regarding the use of DECT under clinical conditions, quantifications of the potential benefits of DECT over SECT, particularly with an end-to-end test approach and performing patient-specific quality assurance (PSQA) have not, to our knowledge, been performed. Through comparison of SECT- and DECT-calculated dose in a clinical TPS system with measurements, our results highlight the conditions in which the use of DECT may lead to significant improvements over the current clinical SECT approach.
Materials and Methods
To validate the calculation of SPR for the images, we compared the SPR values from DECT-derived SPR images of 26 tissue-equivalent plugs with SPR values of the plugs measured in a clinical proton beam. Next, the SPR images of 10 tissue-surrogate plugs individually inserted into a high-density polyethylene (HDPE) phantom were imported into a commercial TPS (version 13.7, Varian Medical Systems, Palo Alto, California), and clinical proton treatment plans were developed. To validate the doses calculated on the SPR images with the TPS, a procedure similar to the PSQA procedures used to validate clinical plans for treatment at the Maryland Proton Treatment Center (MPTC) was performed for the treatment plan for each tissue-surrogate plug. This consisted of 2 steps: (1) a single, absolute point-dose measurement in a region of high dose and low gradient within the treatment field, and (2) 2D γ-analysis [27] on 2 separate dose planes within the treatment field.
SPR Validation
Dual energy CT scans
Sixteen tissue-surrogate plugs (lung 300; lung 450; water; adipose; breast; solid water 1, 2, and 3; muscle; brain; liver; inner bone; bone B200; CB2 30%; CB2 50%; and cortical bone) from a model 467 phantom (Gammex Inc, Middleton, Wisconsin) and 10 tissue-surrogate plugs (lung-inhale, lung-exhale, adipose, breast, water, HDPE, muscle, liver, bone 200, bone 800) from a CIRS phantom (CIRS Tissue Simulation & Phantom Technology, Norfolk, Virginia) were inserted to a custom-made, single-insert HDPE phantom, shown in Figure 1a. The SECT and DECT scans of each plug were acquired individually with a Somatom Definition Edge CT scanner (Siemens, Erlangen, Germany). Each scan was acquired with a 0.6-mm collimation and was performed in sequential dual-energy acquisition mode at 140 kVp (128 mAs) and 80 kVp (540 mAs) tube voltages with the Siemens Care Dose protocol turned off to reduce image noise to a minimum, and for SECT, according to our clinical protocol, 120-kVp tube voltage (approximately 200 mAs) was used. The image reconstruction settings were as follows: sinogram-affirmed iterative reconstruction (SAFIRE; strength = 5), Q30f medium-smooth kernel for DECT and SAFIRE (strength = 3), I41s medium-smooth kernel for SECT, and a slice thickness of 3.0 mm in the superior-inferior direction and 0.6 mm in the other directions. These resolution settings are identical to the clinical protocols used at our institution.
Figure 1.
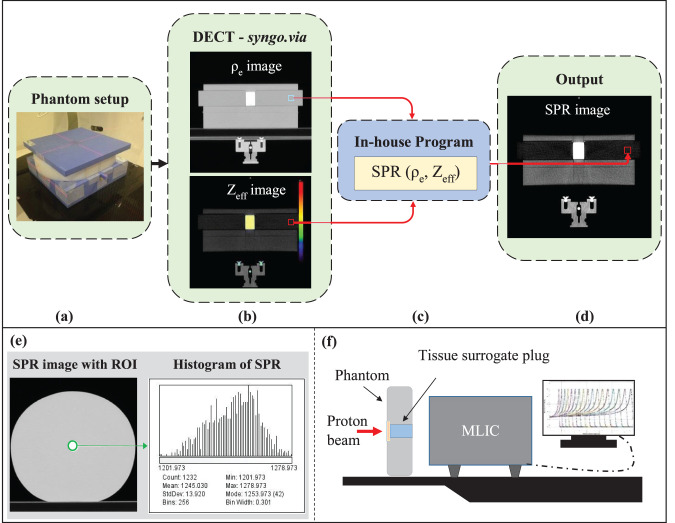
(a–d) Stopping power ratio (SPR) images of the phantom with each tissue-surrogate plug constructed from ρe and Zeff images with 1 of 5 different parameterized SPR models contained within the in-house program. (e) The SPR values with a region of interest (ROI; green circle) of the surrogate plug in the SPR image. (f) Measurement setup with multilayer ionization chamber (MLIC) to verify the SPR values. Abbreviation: DECT, dual-energy computed tomography.
SPR image construction
Currently, the TPS permits use of a single-calibration curve, such that the monoenergetic CT scans are not permitted to be used simultaneously. Therefore, as shown in Figure 1b–1d, the effective density (ρe) and atomic weight (Zeff ) images, constructed with the Siemens syngo.via (version 4.01) image-reconstruction software, were imported into an in-house program, and the SPR images of the phantom from each tissue-surrogate plug were generated according to 5 different SPR-calculation methods, including 4 previously published parameterized SPR models: (1) the Hünemohr et al model [13], (2) the Yang et al model [3], (3) a model with the Imean of the material (calculated from the Zeff [13, 15]) and the ρe as the input to the Bethe-Bloch equation, and (4) a model with SPR = ρe, as reported by Hünemohr et al [28]. Additionally, the fifth parameterization model (the MPTC model) used for SPR image creation consisted of a modification to model 1. Because the syngo.via software reports Zeff ≈ 0.0 when the relative electron density of a material is less than approximately half that of water, the mean excitation energy could not be determined for those densities, and the parameterized models (1 and 2) did not return accurate SPR values.
In those cases, because Zeff cannot be < 1.0 (pure hydrogen) for a material, we used an SPR calculation model based on the following SPR parameterization [24]:
 |
where a is 0.0591, b is 0.0947, C is 3.893, and D is 3.697, denoting calibration constants related to the parameterization of the mean ionization energy as a function of Zeff, with values that are unique to the DECT scanner.
The SPR values for each tissue-surrogate plug were extracted from a region of interest in the plug from the SPR image (Figure 1e). The mean SPR value within the region of interest was recorded for each calculation model studied [13, 15, 29].
SPR measurement
To verify the values in the SPR images, the water-equivalent thickness (WET) of each tissue-surrogate plug (consisting of the tissue-surrogate material plug and cap) was obtained by measuring the shift in the proton beam range through the plug with a multilayer ionization chamber (Giraffe, IBA Dosimetry, Schwarzenbruck, Germany) according to the setup shown in Figure 1f. The manufacturer-reported accuracy of range measured in a multilayer ionization chamber is 0.5 mm.
The physical thickness of the phantom was also measured with a digital caliper (precision = 0.1 mm; Stalwart, Inc, Lorain, Ohio) and was used to calculate the SPR of the phantom material. Because the cap of the plug was made of the same material as the phantom, WETcap = SPRphantom × thicknesscap. Therefore, the WET of the tissue-surrogate plug could be determined as WETplug = WETplug+cap − WETcap. Next, the SPR values for each plug were determined as follows:
 |
The SPR values from the WET measurements for each plug were then compared to the mean SPR values extracted from the DECT-generated SPR images.
SPR image-based TPS dose calculation and validation
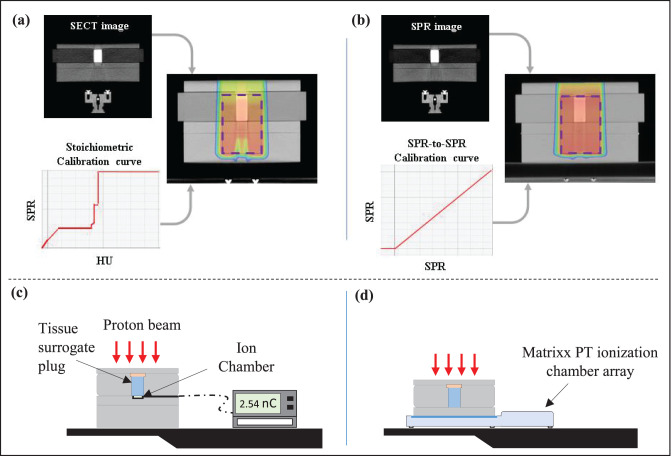
The SPR and SECT images of the tissue-surrogate plugs were imported into an Eclipse (version 13.7, Varian Medical Systems, Palo Alto, California) TPS. The SPR-to-SPR (straight line with a slope of 1) and clinical stoichiometric calibration curves were applied to the SPR and SECT image sets, respectively (Figure 2a and 2b). For comparison, several TPS-generated treatment plans calculated on a tissue-equivalent plastic phantom that contained a single tissue-surrogate plug were created on both image sets. Because the resolution of the scans was 0.6 mm in the beam direction, a 1-mm dose grid was used in the TPS calculation.
Figure 2.
Single-field treatment plans delivering their dose to a planning target volume (purple dashed rectangle) were created in the treatment planning system on (a) a single-energy computed tomography (SECT) image set with a clinical stoichiometric calibration curve, and (b) a stopping-power-ratio (SPR) computed tomography (CT) image set with an SPR-to-SPR curve (slope = 1). (c) Schematics of measurement setups for point-dose measurement with an ionization chamber. (d) Schematics of measurement setups for 2-dimensional (2D) planar dose measurement with a MatriXX PT detector array (IBA Dosimetry). Abbreviations: HU, Hounsfield unit; nC, nanoCoulomb.
The treatment plans consisted of a single-field treatment plan delivering a 2 Gy radiobiological equivalent (GyRBE) dose to a 10 × 10 × 10-cm3 single spread-out Bragg peak (SOBP) to a planning target volume (PTV) containing the tissue-surrogate plug. Dose optimization was performed according to the single-field uniform-dose method.
To assess the accuracy of the dose calculation on the SPR images (and the SECT images), the treatment plans for both image types were evaluated with a procedure that was similar to the PSQA procedure at the MPTC. The goal of PSQA is to verify and validate dose delivery of clinical patient treatment plans before the start of the patient's treatment course. According to this procedure, each treatment plan was delivered to the phantom-plug setup and the dose in a high-dose and low-dose gradient region, chosen as the mid SOBP depth beyond the plug, was measured with a PPC05 parallel plate ionization chamber (IBA Dosimetry) and compared with the TPS calculated dose for each planning method (Figure 2c). In addition, the 2D planar dose was measured with a MatriXX PT detector array (IBA Dosimetry) at 2 different dose planes located at the center and distal edge of the SOBPs, according to the setup shown in Figure 2d. The standard resolution of the planar measurements with the device is 7.6 mm, taken as equal to the detector spacing. However, we used a technique that merges 2 measurements acquired after a diagonal shift in the x-y direction (x, 3.8 mm; y, 3.8 mm). By merging the 2 measurements, we acquire a planar measurement with 5.1-mm resolution. A 2D γ-analysis was performed for each tissue-surrogate plan at each depth, based on our clinical protocol for PSQA. The TPS-calculated and measured dose distributions were evaluated for the percentage of differences and distance to agreement criteria of 3% and 3 mm, with a 10% threshold and global normalization and a 90% passing-rate tolerance.
Water phantom setup
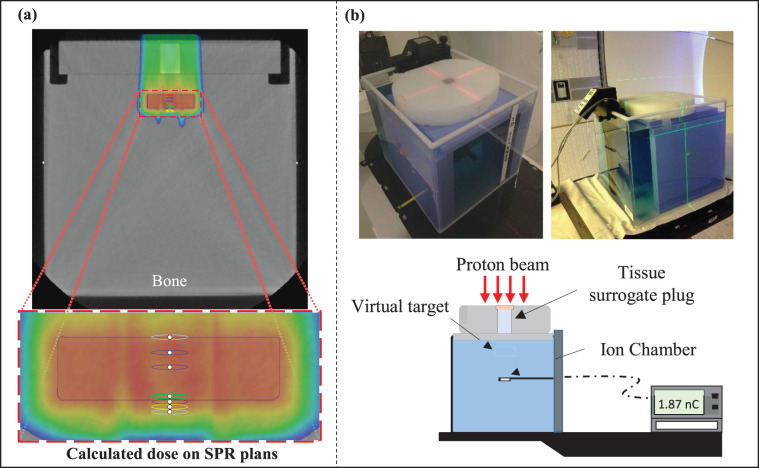
The HDPE phantom with a single tissue-surrogate plug located at its center was placed on top of a water tank (Figure 3). For 3 plugs, the DECT and SECT scans of the HDPE water phantom setup were acquired, and SPR images were created from the ρe and Zeff images from equation 1.
Figure 3.
(a) The single-plan treatment field for the tissue-surrogate plug phantom sitting on top of a water tank. The planning treatment volume (PTV; blue rectangle) was defined beyond the plug in the water tank. A single treatment field was used to deliver the dose to the PTV. (b) Experimental setup for delivery of the treatment plan with the tissue-surrogate phantom on top of the water tank. The plan was delivered and the dose was measured with an ion chamber at 7 depths in the water phantom corresponding to the depths of the red, blue, purple, green, brown, yellow, and orange circular contours defined in (a). Abbreviations: nC, nanoCoulomb; SPR, stopping power ratio.
The SPR and SECT images were also imported into the Eclipse TPS. The SPR-to-SPR and CT-to-SPR calibration curves were again used to perform direct-dose calculations on SPR images and SECT images, respectively. As shown in Figure 3, a PTV with a 2-cm-thick target was defined beyond each plug at a depth of 3 cm in the water phantom. A single-field treatment plan was used and optimized to deliver a 2 GyRBE uniform dose (per the PTV) for both the SPR and SECT image sets. The TPS-calculated average dose within contours drawn at 7 depths shown in Figure 3b was extracted and stored for subsequent analysis. The depths consisted of the following: 1 proximal (depth = 0 cm), 2 middle (depth = 0.5 and 1 cm), and 4 distal points (depth = 1.9, 2.1, 2.3, and 2.5 cm). To evaluate the accuracy of the dose calculation, both SECT and SPR image-based treatment plans were delivered to each phantom-plug setup, and the dose at those depths was measured with a parallel-plate ionization chamber (PPC05, IBA Dosimetry) and compared with those calculated by TPS.
Results
Validation of DECT-derived SPR Values
Figure 4 presents the percentage of difference in the tissue plug–measured SPR and the mean SPR values extracted from the DECT-derived SPR images calculated with the 5 different models. For all 4 lung equivalent plugs, in which the DECT images generated a Zeff ≈ 0, the Hünemohr et al [13] and Yang et al [3] models had > 10% disagreements with respect to the measurement. Differences between measured SPR and calculations with all other models were within 3%. Additionally, the MPTC and ρe models were within 2% agreement with respect to the measurements. For all other tissue-equivalent materials tested, the measured and calculated SPR differences were < 3% for all 5 models used. The average difference over all tissue surrogate plugs between measured and calculated SPR for the Hünemohr et al [13], Yang et al [3], MPTC, ρe, and Bethe-Bloch models was 2.92%, 2.82%, 0.82%, 1.47%, and 1.51%, respectively. Because, on average, the smallest difference between measured and DECT-generated SPR values was obtained with the MPTC model, the SPR images generated with that model were used for subsequent treatment planning and dose-delivery studies presented in this article.
Figure 4.
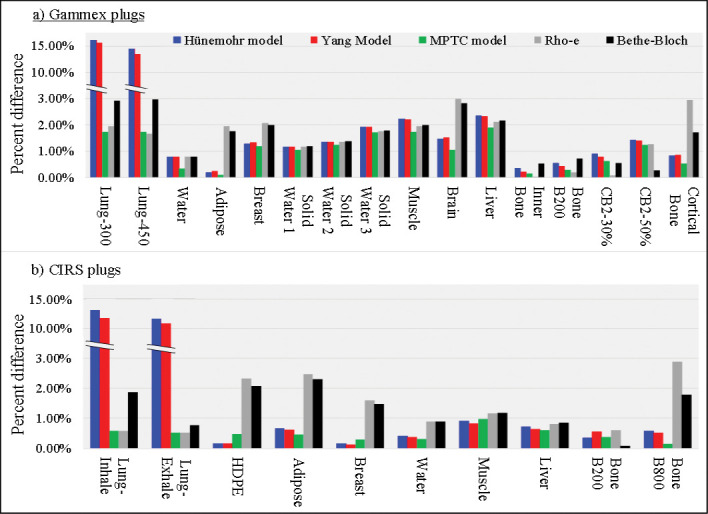
Absolute percentage of difference between measured topping power ratio (SPR) and 5 different models for calculating SPR from double-energy computed tomography (DECT) images for 26 different tissue-equivalent plugs from the commercial Gammex and CIRS computed tomography (CT) calibration phantoms. Abbreviations: CB2, calcium carbonate bone; HDPE, high-density polyethylene; MPTC, Maryland Proton Treatment Center.
Eclipse SPR Image Dose Calculation and Validation
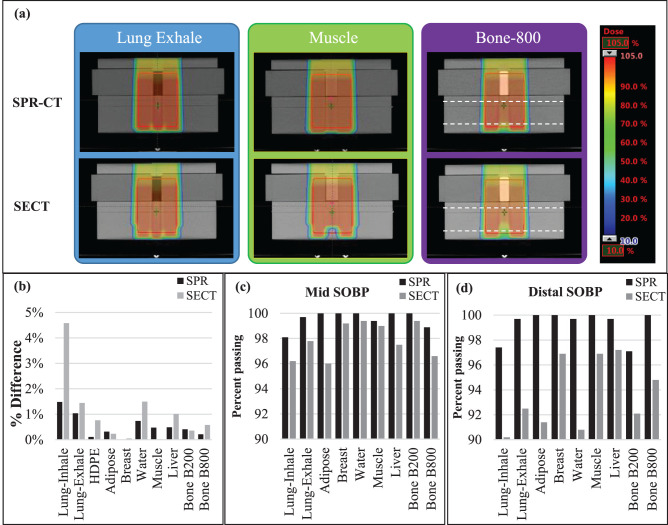
Figure 5 presents treatment plans created with the SPR and SECT images of the tissue-equivalent phantom for lung exhale, muscle, and bone B800 plugs. Except for the lung, the Eclipse TPS calculated dose of all tissue-surrogate materials were at the center of the SOBP on the SPR and SECT images and were within 1.0% and 1.5% of the ion chamber measurements, respectively. Larger disagreements of 1.5% and 4.5% were observed for SPR and SECT image of lung-inhale calculated doses, respectively.
Figure 5.
(a) Treatment plans created on the stopping-power-ratio (SPR) and single-energy computed tomography (SECT) images of the phantom with lung exhale, muscle, and bone B800 plugs in the high-density polyethylene (HDPE) phantom. (b) The percentage of difference ([Dmeasured − Dcalculated]/Dmeasured) of the ion chamber–measured dose and the treatment planning system–calculated (on SPR and SECT images) dose for HDPE and 9 tissue-surrogate plugs of the CIRS phantom. Dashed black lines represent the depth of planes used for the 2-dimensional MatriXX PT planar dose measurements. Percentage of image voxels with passing γ-index values for the mid–spread-out Bragg peak (SOBP) (c) and distal SOBP (d) dose planes for all tissue-surrogate plans.
As shown in Figure 5a, the TPS-calculated dose distributions on SPR and SECT images are very similar in the entrance, proximal, and central SOBP regions. However, there are significant differences in the dose calculations for each of the 3 tissue-surrogate plugs shown near the distal end of the SOBP. The SPR-image–based treatment plans showed a more-uniform dose near the distal end of the SOBP, particularly for the bone (B800) and lung surrogates (Figure 5a).
Figure 5c and 5d presents 2D γ-analysis results at the mid-SOBP and distal-SOBP dose planes. At both dose planes, and for all tissue-surrogate plug treatment plans, the 2D γ-passing rate (global normalization) was > 90% (our criteria for validation of a clinical plan at MPTC) for both the SECT and SPR image plans. Minimal differences (< 1%) were observed when local normalization was used. Additionally, for the mid-SOBP dose plan, the pass rate was > 95% for plans created on both image sets. However, for both measurement depths, the SPR image plans showed a higher γ-passing rate compared with SECT image-based plans (SPR, > 97% versus SECT, > 90%).
Water Phantom Setup
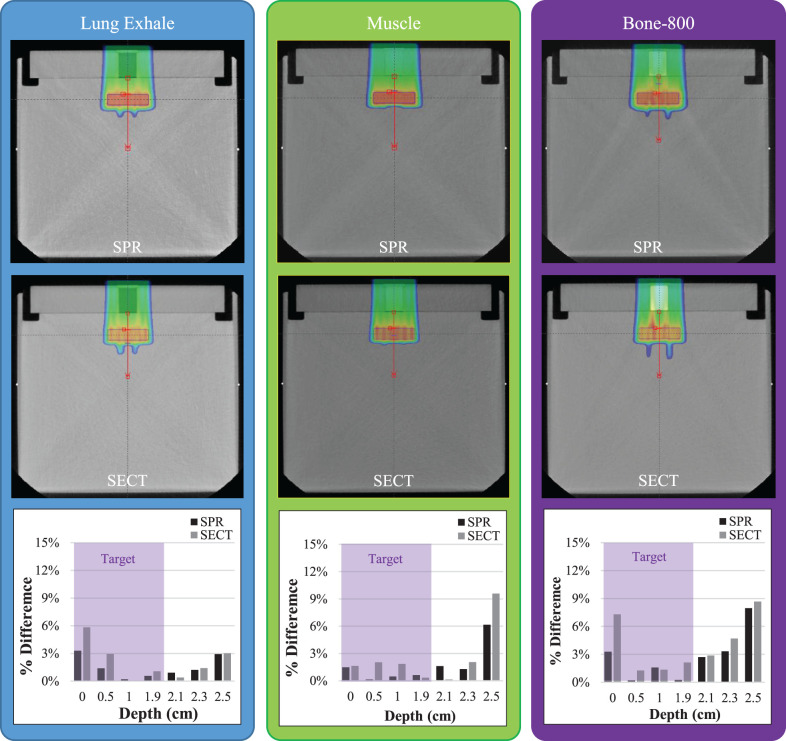
Figure 6 presents the TPS-calculated dose distributions for 3 plugs from the SPR and SECT images. The relatively nonhomogenous dose distribution was observed in more-heterogeneous media (lung and bone).
Figure 6.
Treatment plans created on stopping-power-ratio (SPR) and single-energy computed tomography (SECT) images for lung-exhale (left), muscle (middle), and bone 800 (right) plugs to deliver a uniform dose to the planning treatment volume located at a depth of 3 cm beyond each plug in the water phantom. Bottom row shows the percentage of difference relative to the prescription dose (dose Rx) of the calculated (based on SPR and SECT) and measured dose ([Dmeasured − Dcalculated]/DRx) for lung-exhale, muscle, and bone 800.
The percentage of difference relative to the prescription dose ([Dmeasured − Dcalculated]/DRx) was evaluated from those measurements. As shown in Figure 6, the SPR image TPS-calculated dose showed better agreement when compared with the SECT image plans, with the ion chamber measurements inside the target for muscle (2.0% SPR versus 2.5% SECT), bone-800 (3.5% SPR versus 8.0% SECT), and lung-exhale (3.5% SPR versus 6.0% SECT). Additionally, greater disagreements between measured dose and TPS-calculated dose were observed with SECT image treatment plans at the distal region of the target (Figure 6).
Discussion
This study investigated the potential benefit associated with the use of SPR images that were generated from DECT images for proton dose calculation with a clinical TPS. We compared such plans with identical plans created with SECT images, which are commonly used in the clinic. Our results indicate that, for the wide range of tissue surrogates used in this study, the SPRs determined from DECT images were within 2% agreement of the measured values. Greatest agreements between DECT-determined and measured SPRs were observed in the soft tissues with densities (and electron densities) approximately equal to or greater than water. Lower agreement was observed for low-density lung surrogate materials because of the reliance of SPR calculations on the effective atomic number (Hünemohr et al [13] and Yang et al [3] models) and the inability of DECT software to accurately estimate Zeff for those materials. With the relative electron density itself used, the MPTC and ρe models reduced those difference to within 2%.
Multiple studies [13, 14] have investigated the differences between measured and DECT-based SPR of tissue-equivalent materials. Their results suggest that the use of DECT can reduce SPR uncertainties to < 2%. In addition, ex vivo studies on biological tissue have shown that differences between measured and DECT-based SPR can be reduced to < 1%. [18, 21, 23] Those studies highlight the feasibility of DECT in the reduction of uncertainties associated with proton SPR, which can potentially improve proton treatment-delivery accuracy. Lacking in the aforementioned studies was the quantification of the expected effect associated with the use of DECT on metrics used during end-to-end tests and PSQA. Such tests are commonly performed during the final stages of TPS commissioning and are also used for the routine verification of clinical plans on a daily basis. Our study demonstrated that DECT-calculated treatment plans were robust enough to pass the clinical PSQA process and led to higher γ-passing rates and absolute dose agreement with the TPS.
Treatment plans generated on the SPR images with a commercial TPS passed the clinical-standard measurement-based treatment plan–verification procedures. In comparison with SECT-calculated doses, all plans created on SPR images had greater agreements with point-dose ion-chamber measurements and greater γ-index passing rates. The low γ-passing rates for SECT plans were partially due to our clinical stoichiometric calibration curve, which is designed to be used for biological tissues only. Using the water phantom setup, we found greater differences between SECT dose distributions and measurements. Our results showed the TPS-calculated dose on SPR image had better agreement with the ion chamber–measured dose. These improvements were particularly significant at the distal end of the target. Although requiring further investigation, these findings indicate the potential for better OAR sparing through the use of DECT images, particularly when end-ranging into OARs is of concern.
We believe these results indicate that SPR images created from DECT scans can be used to produce clinical-quality treatment plans in a commercial TPS. In fact, for the simple cases we studied, the agreement between planned dose and measured dose for the SPR image–based treatment plans was better than that achieved with the SECT-based plans. The treatment plans created in this study were, however, only simple one-field plans with the single field-uniform dose technique, and no intensity-modulated proton treatment planning was conducted. Therefore, no conclusions can yet be drawn about more-complex plans created with SPR images. In addition, the phantoms used for the treatment plans were all relatively homogeneous in that all tissue-surrogate materials were 3 cm in diameter and 5 cm tall. No plans containing smaller tissue structures or tissue-air interfaces were studied.
The SPR CT constructed from DECT images for proton dose calculations with a clinical TPS was shown to be accurate within clinical criteria (± 3% and 3 mm) for most tissue surrogates studied. The results of this study indicate that, in comparison with the use of SECT images, the SPR images constructed from DECT can improve the accuracy of range prediction and dose calculation, particularly for nonnatural materials.
ADDITIONAL INFORMATION AND DECLARATIONS
Conflicts of Interest: The authors have no relevant conflicts of interest to disclose.
Funding: The authors have no funding to disclose.
Ethical Approval: This study was reviewed by the authors' institutional research infrastructure and was determined to be exempt from IRB approval.
References
- 1. .Knopf AC, Lomax A. In vivo proton range verification: a review. Phys Med Biol. 2013;58:R131–60. doi: 10.1088/0031-9155/58/15/R131. [DOI] [PubMed] [Google Scholar]
- 2. .Paganetti H. Range uncertainties in proton therapy and the role of Monte Carlo simulations. Phys Med Biol. 2012;57:R99–117. doi: 10.1088/0031-9155/57/11/R99. [DOI] [PMC free article] [PubMed] [Google Scholar]
- 3. .Yang M, Zhu XR, Park PC, Titt U, Mohan R, Virshup G, Clayton JE, Dong L. Comprehensive analysis of proton range uncertainties related to patient stopping-power-ratio estimation using the stoichiometric calibration. Phys Med Biol. 2012;57:4095–115. doi: 10.1088/0031-9155/57/13/4095. [DOI] [PMC free article] [PubMed] [Google Scholar]
- 4. .Jones KC, Vander Stappen F, Bawiec CR, Janssens G, Lewin PA, Prieels D, Solberg TD, Sehgal CM, Avery S. Experimental observation of acoustic emissions generated by a pulsed proton beam from a hospital-based clinical cyclotron. Med Phys. 2015;42:7090–7. doi: 10.1118/1.4935865. [DOI] [PubMed] [Google Scholar]
- 5. .Knopf A, Parodi K, Paganetti H, Cascio E, Bonab A, Bortfeld T. Quantitative assessment of the physical potential of proton beam range verification with PET/CT. Phys Med Biol. 2008;53:4137–51. doi: 10.1088/0031-9155/53/15/009. [DOI] [PubMed] [Google Scholar]
- 6. .Krimmer J, Dauvergne D, Létang JM, Testa E. Prompt-gamma monitoring in hadrontherapy: a review. Nucl Instrum Methods Phys Res A. 2018;878:58–73. [Google Scholar]
- 7. .Polf JC, Parodi K. Imaging particle beams for cancer treatment. Physics Today. 2015;68:28–30. [Google Scholar]
- 8. .Xie Y, Bentefour EH, Janssens G, Smeets J, Vander Stappen F, Hotoiu L, Yin L, Dolney D, Avery S, O'Grady F, Prieels D, McDonough J, Solberg TD, Lustig RA, Lin A, Teo BK. Prompt gamma imaging for in vivo range verification of pencil beam scanning proton therapy. Int J Radiat Oncol Biol Phys. 2017;99:210–8. doi: 10.1016/j.ijrobp.2017.04.027. [DOI] [PubMed] [Google Scholar]
- 9. .Schuemann J, Dowdell S, Grassberger C, Min CH, Paganetti H. Site-specific range uncertainties caused by dose calculation algorithms for proton therapy. Phys Med Biol. 2014;59:4007–31. doi: 10.1088/0031-9155/59/15/4007. [DOI] [PMC free article] [PubMed] [Google Scholar]
- 10. .Farace P, Righetto R, Meijers A. Pencil beam proton radiography using a multilayer ionization chamber. Phys Med Biol. 2016;61:4078–87. doi: 10.1088/0031-9155/61/11/4078. [DOI] [PubMed] [Google Scholar]
- 11. .Sadrozinski HFW, Johnson RP, Macafee S, Plumb A, Steinberg D, Zatserklyaniy A, Hurley VB, Schulte R. Development of a head scanner for proton CT. Nucl Instrum Methods Phys Res A. 2013;699:205–10. doi: 10.1016/j.nima.2012.04.029. [DOI] [PMC free article] [PubMed] [Google Scholar]
- 12. .Schulte RW, Shahnazi K, Bashkirov V. Proton computed tomography for clinical applications—a research proposal to Loma Linda University Medical School Research Support Committee. 2002 http://scipp.ucsc.edu/∼hartmut/Radiobiology/pCT/Proton%20CT%20LLU%20App_1_9.pdf Published. Accessed January 10, 2002.
- 13. .Hünemohr N, Krauss B, Tremmel C, Ackermann B, Jakel O, Greilich S. Experimental verification of ion stopping power prediction from dual energy CT data in tissue surrogates. Phys Med Biol. 2014;59:83–96. doi: 10.1088/0031-9155/59/1/83. [DOI] [PubMed] [Google Scholar]
- 14. .Wohlfahrt P, Mohler C, Richter C, Greilich S. Evaluation of stopping-power prediction by dual- and single-energy computed tomography in an anthropomorphic ground-truth phantom. Int J Radiat Oncol Biol Phys. 2018;100:244–53. doi: 10.1016/j.ijrobp.2017.09.025. [DOI] [PubMed] [Google Scholar]
- 15. .Yang M, Virshup G, Clayton J, Zhu XR, Mohan R, Dong L. Theoretical variance analysis of single- and dual-energy computed tomography methods for calculating proton stopping power ratios of biological tissues. Phys Med Biol. 2010;55:1343–62. doi: 10.1088/0031-9155/55/5/006. [DOI] [PubMed] [Google Scholar]
- 16. .Almeida IP, Schyns L, Vaniqui A, van der Heyden B, Dedes G, Resch AF, Kamp F, Zindler JD, Parodi K, Landry G, Verhaegen F. Monte Carlo proton dose calculations using a radiotherapy specific dual-energy CT scanner for tissue segmentation and range assessment. Phys Med Biol. 2018;63:115008. doi: 10.1088/1361-6560/aabb60. [DOI] [PubMed] [Google Scholar]
- 17. .Wohlfahrt P, Möhler C, Hietschold C, Menkel S, Greilich S, Krause M, Baumann M, Enghardt W, Richter C. Clinical implementation of dual-energy CT for proton treatment planning on pseudo-monoenergetic CT scans. Int J Radiat Oncol Biol Phys. 2018;97:427–34. doi: 10.1016/j.ijrobp.2016.10.022. [DOI] [PubMed] [Google Scholar]
- 18. .Taasti VI, Michalak G, Hansen DC, Deisher A, Kruse JJ, Krauss B, Muren LP, Petersen JBB, McCollough CH. Validation of proton stopping power ratio estimation based on dual energy CT using fresh tissue samples. Phys Med Biol. 2018;63:015012. doi: 10.1088/1361-6560/aa952f. [DOI] [PubMed] [Google Scholar]
- 19. .O'Sullivan JA, Benac J. Alternating minimization algorithms for transmission tomography. IEEE Trans Med Imaging. 2007;26:283–97. doi: 10.1109/TMI.2006.886806. [DOI] [PubMed] [Google Scholar]
- 20. .Zhang S, Han D, Williamson JF, Zhao T, Politte DG, Whiting BR, O'Sullivan JA. Experimental implementation of a joint statistical image reconstruction method for proton stopping power mapping from dual-energy CT data. Med Phys. 2019;46:273–85. doi: 10.1002/mp.13287. [DOI] [PMC free article] [PubMed] [Google Scholar]
- 21. .Möhler C, Russ T, Wohlfahrt P, Elter A, Runz A, Richter C, Greilich S. Experimental verification of stopping-power prediction from single-and dual-energy computed tomography in biological tissues. Phys Med Biol. 2018;63:025001. doi: 10.1088/1361-6560/aaa1c9. [DOI] [PubMed] [Google Scholar]
- 22. .Taasti VT, Bäumer C, Dahlgren CV, Deisher AJ, Ellerbrock M, Free J, Gora J, Kozera A, Lomax AJ, De Marzi L. Inter-centre variability of CT-based stopping-power prediction in particle therapy: survey-based evaluation. Phys Imaging Radiat Oncol. 2018;6:25–30. doi: 10.1016/j.phro.2018.04.006. [DOI] [PMC free article] [PubMed] [Google Scholar]
- 23. .Xie Y, Ainsley C, Yin L, Zou W, McDonough J, Solberg TD, Lin A, Teo BKK. Ex vivo validation of a stoichiometric dual energy CT proton stopping power ratio calibration. Phys Med Biol. 2018;63:055016. doi: 10.1088/1361-6560/aaae91. [DOI] [PubMed] [Google Scholar]
- 24. .Polf JC, Mille MM, Mossahebi S, Chen H, Maggi P, Chen-Mayer H. Determination of proton stopping power ratio with dual-energy CT in 3D-printed tissue/air cavity surrogates. Medical Phys. 2019;46:3245–53. doi: 10.1002/mp.13587. [DOI] [PMC free article] [PubMed] [Google Scholar]
- 25. .Taasti VT, Muren LP, Jensen K, Petersen JBB, Thygesen J, Tietze A, Grau C, Hansen DC. Comparison of single and dual energy CT for stopping power determination in proton therapy of head and neck cancer. Phys Imaging Radiat Oncol. 2018;6:14–9. doi: 10.1016/j.phro.2018.04.002. [DOI] [PMC free article] [PubMed] [Google Scholar]
- 26. .Wohlfahrt P, Troost EGC, Hofmann C, Richter C, Jakobi A. Clinical feasibility of single-source dual-spiral 4D dual-energy CT for proton treatment planning within the thoracic region. Int J Radiat Oncol Biol Phys. 2018;102:830–40. doi: 10.1016/j.ijrobp.2018.06.044. [DOI] [PubMed] [Google Scholar]
- 27. .Low DA, Harms WB, Mutic S, Purdy JA. A technique for the quantitative evaluation of dose distributions. Med Phys. 1998;25:656–61. doi: 10.1118/1.598248. [DOI] [PubMed] [Google Scholar]
- 28. .Hünemohr N, Krauss B, Dinkel J, Gillmann C, Ackermann B, Jäkel O, Greilich S. Ion range estimation by using dual energy computed tomography. Z Med Phys. 2013;23:300–13. doi: 10.1016/j.zemedi.2013.03.001. [DOI] [PubMed] [Google Scholar]
- 29. .Taasti VT, Petersen JBB, Muren LP, Thygesen J, Hansen DC. A robust empirical parametrization of proton stopping power using dual energy CT. Med Phys. 2016;43:5547. doi: 10.1118/1.4962934. [DOI] [PubMed] [Google Scholar]


