. 2020 Oct 21;9:e54895. doi: 10.7554/eLife.54895

Figure 3. Individual mutations and residues reveal evolutionary and structural insights into β2AR function.

(A) Positional conservation across Class A GPCRs correlates with mutational tolerance (Spearman's ρ = −0.676, Pearson’s r = −0.681), the mean activity of all amino acid substitutions per residue at each agonist concentration, at EC100. However, four of the least conserved positions (C190, C184, A181, Y185) are highly sensitive to mutation and are located in ECL2, suggesting this region is uniquely important to the β2AR. The blue line is a simple linear regression. (B) Individual mutant activity correlates with EVmutation (Spearman's ρ = 0.521, Pearson’s r = 0.480) at EC100. The blue line is a simple linear regression. (C) Activity of individual mutants present in the human population from the gnomAD database stratified by allele frequency. Mutations are classified as potential loss of function (LoF) mutations (orange) are classified as such (shaded region) if the mean activity at EC100 plus the standard error of the mean (upper error bar) is more than two standard deviations below mean frameshift mutant activity (dashed line). (D) The distribution of the 100 most basally activating mutations across the β2AR snake plot reveals a clustering of mutants in the termini, TM1, TM5, and TM6. (E) Top: Distribution of the 100 most basally activating mutations stratified by domain. Bottom: The distribution of the 100 most basally activating mutations across the β2AR 3D structure (PDB: 3SN6). These positions (colored as in D) are concentrated on the surface of the β2AR (Gɑs shown in blue).

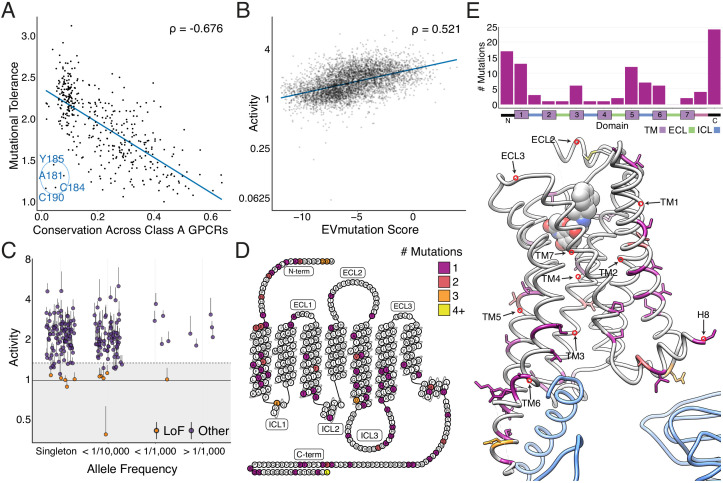
Figure 3.

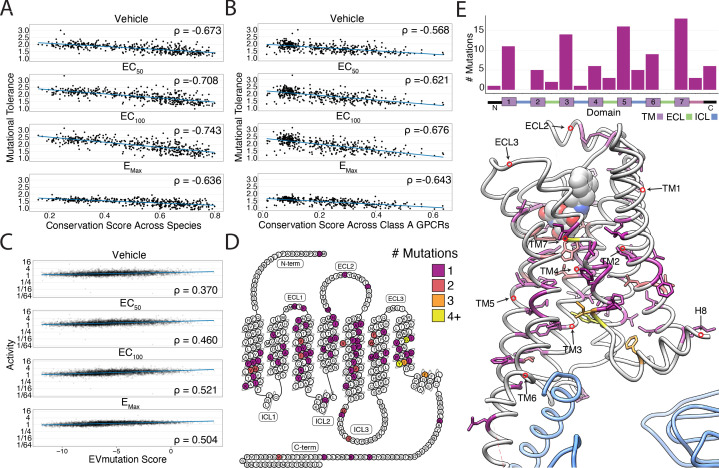
Figure 3—figure supplement 1. Correlation with sequence conservation and covariation and analysis of individual mutations.

Figure 3—figure supplement 1.

(A) Mutational tolerance is highly correlated with species-level sequence conservation and is maximized at EC100 (Spearman's ρ = −0.673, Pearsons r = −0.65; ρ = −0.71, r = −0.69; ρ = −0.74, r = −0.73; ρ = −0.64, r = −0.62; for -Iso, EC50 Iso, EC100 Iso, and EMax Iso, respectively; all p<<0.0001). Here, we calculated sequence conservation using the Jensen-Shannon divergence from a multiple alignment of 55 ADRB2 orthologs from the OMA database. The blue line is a simple linear regression. (B) Similarly, mutational tolerance of the individual positions is highly correlated with sequence conservation across Class A GPCRs and is also maximized at EC100 (ρ = −0.57, r = −0.57; ρ = −0.62, r = −0.63; ρ = −0.68, r = −0.68; ρ = −0.64, r = −0.65 for -Iso, EC50 Iso, EC100 Iso, and EMax Iso, respectively; all p<<0.0001). The blue line is a simple linear regression. (C) Activity measurements for individual substitutions correlates with predictions from EVMutation, and is maximized at EC100 (ρ = 0.37, r = 0.33; ρ = 0.46, r = 0.41; ρ = 0.52, r = 0.48; ρ = 0.50, r = 0.49; all p<<0.0001). The blue line is a simple linear regression. (D) The location of the 100 most deleterious mutations by activity score at EMax Iso on the β2AR snake plot. Mutations are concentrated in the transmembrane domain. (E) Top: Distribution of the 100 most deleterious mutations by activity score at EMax Iso stratified by domain. Bottom: Location of these mutants on the 3D structure of the β2AR. These positions (colored as in D) tend to face into the core of the β2AR (PDB: 3SN6; Gs in blue).