

Abstract
Ribosome profiling, also known as Ribo-seq, has become a popular approach to investigate regulatory mechanisms of translation in a wide variety of biological contexts. Ribo-seq not only provides a measurement of translation efficiency based on the relative abundance of ribosomes bound to transcripts, but also has the capacity to reveal dynamic and local regulation at different stages of translation based on positional information of footprints across individual transcripts. While many computational tools exist for the analysis of Ribo-seq data, no method is currently available for rigorous testing of the pattern differences in ribosome footprints. In this work, we develop a novel approach together with an R package, RiboDiPA, for Differential Pattern Analysis of Ribo-seq data. RiboDiPA allows for quick identification of genes with statistically significant differences in ribosome occupancy patterns for model organisms ranging from yeast to mammals. We show that differential pattern analysis reveals information that is distinct and complimentary to existing methods that focus on translational efficiency analysis. Using both simulated Ribo-seq footprint data and three benchmark data sets, we illustrate that RiboDiPA can uncover meaningful pattern differences across multiple biological conditions on a global scale, and pinpoint characteristic ribosome occupancy patterns at single codon resolution.
INTRODUCTION
Translation of mRNA messages into proteins is a fundamental process to decode genetic information. Given its essential function, translation is highly regulated by organisms across all kingdoms of life to ensure proper protein expression in the right contexts (1,2), while mis-translation or mis-regulation of translation has frequently been linked to disease (3,4). Protein production itself is carried out by ribosomes as well as key accessory protein complexes, which are conserved across species (5). Molecular and genetic dissection of translation has revealed the details of a complex process consisting of multiple steps, from initiation to elongation to termination and recycling. Translation initiation is perhaps the most-well characterized of these steps (6,7), although regulation at later steps has also been demonstrated to be critical (2,8–11). Importantly, cells have evolved strategies to adaptively regulate translation of mRNA messages in changing environments, including under various types of cellular stress, such as oxidative stress and starvation (12–18).
In the past decade, a new method called ribosome profiling (or Ribo-seq) has harnessed the power of next-generation sequencing technologies to provide a new way of quantitatively examining translation on a gene-by-gene basis (19). With technical improvements (20,21), Ribo-seq has allowed for more precise targeting of translational events and has been widely applied to many organisms (22,23). Ribosome profiling not only offers quantification of the translational efficiency of a gene, which is the number of ribosomes per mRNA molecule under a given condition, but also important information about the distribution of ribosomes across a mRNA transcript (23). For instance, this shape information has been used to identify upstream open reading frames (uORFs) (24,25), observe stop codon read-through (26), determine the sites of pausing during translation (27), and in many other applications.
As the popularity of ribosome profiling as a genomics approach has increased, the computational tools to analyze Ribo-seq data have rapidly proliferated. For extensive and excellent reviews of these tools, we refer the reader to (21,28,29). Briefly, the purposes of these tools range from data preprocessing (30–38), RNase footprint examination (39), data normalization (40), isoform-level footprint estimation (41,42), ORF discovery and annotation (43–53), and differential translation detection (54–61). In this work, we are particularly interested in statistical inference of translational differences between conditions using Ribo-seq data. The translational efficiency for each gene is typically quantified by Ribo-seq read count normalized by the RNA-seq gene expression. While the existing approaches for differential translation detection can provide insight into translational efficiency, the ribosome binding pattern along the gene body, which provides a more complete picture of translational variations across conditions, has been mostly ignored. For example, a given gene with similar translational efficiency quantified by the ratio of gene-wise total Ribo-seq over RNA-seq counts may have a differential Ribo-seq read distribution pattern along the transcript, which may be indicative of differences in translational mechanisms of interest. Nevertheless, there is yet no existing method or tool for rigorous testing of the differences of ribosome binding patterns. Here, we developed a novel method together with an R package named RiboDiPA for differential pattern analysis in Ribo-seq data. Using a systematic simulation study and three benchmark data sets, we demonstrate its feasibility to uncover regulatory mechanisms of translation solely based on differential patterns of ribosome footprints.
MATERIALS AND METHODS
Experimental data sets
We selected three experimental case studies to assess how our method performs. The first one is a high quality data set collected in yeast by Wu et al. (62). This study investigated the translational landscape of both wild type and mutant yeast strains under various cellular stress conditions. For our purposes, we compared yeast samples cultured under four different growth conditions—unstressed, osmotic stress, oxidative stress and starvation (stationary phase growth)—and also compared wild type to eRF1 depletion and RCK2 deletion yeast strains (eRF1d and rck2Δ). The second data set was also collected in yeast by Kasari et al. (63) and compared wild type yeast cells to yeast cells mutant for NEW1 (new1Δ), which is an non-essential translation termination factor with a cold sensitivity phenotype. Data was collected at both 30°C and 20°C, but all comparisons in this paper are for 20°C. The final data set comes from a mouse study from Sugiyama et al. (64), which compared wild type, heterozygous mutant, and null mouse embryonic stem cells for Nat1, a translational regulator. These data sets were selected because they represent two divergent model organisms of typical sample size (2–3 replicates per condition), and more importantly, have relatively high ribosome protected fragment (RPF) read counts.
Overview of RiboDiPA flow
RiboDiPA, implemented in an R package, provides a computational tool for pattern differentiation for Ribo-seq data. Figure 1 shows a flow chart of the RiboDiPA pipeline from exon concatenation, BAM file processing, P-site mapping, to differential pattern testing. The package takes the Ribo-seq alignment file (in .bam format) and Genome Transfer File (.GTF) as inputs, and outputs the differential pattern (DP) analysis results with statistical significance and supplementary pattern dissimilarity measure (T-value). In addition, it provides additional functions for visualization of Ribo-seq footprints with specified resolution. In terms of computing time, it takes about 10 min to run the entire pipeline for the wild type versus eRF1d comparison of yeast data (four samples) at single-codon resolution on a 20-core node on a Linux cluster. RiboDiPA can be downloaded at github (https://github.com/jipingw/RiboDiPA). The details of methods are described below.
Figure 1.

RiboDiPA package workflow. Input for the RiboDiPA package are: (A) the Genome Transfer File (GTF) of the experimental organism and (B) Ribo-seq alignment files in BAM format with one file per replicate. All exons, 5′UTR(s), and 3′UTR(s) from the same gene are concatenated to form a total transcript. RPFs are parsed and the P-site position is calculated for each RPF. (C) Mapped P-site data representing the P-site frequency at each nucleotide position along the total transcript (left) and the binned P-site data with customizable bin width (right). (D) Flow of differential pattern analysis and output of RiboDiPA including P-value, q-value and T-value for each gene under testing. For users’ convenience, the package also provides more options for adjusted P-value and complementary measure.
Exon concatenation, P-site mapping and data binning
Since true RPFs originate from ribosomes that are actively translating in coding regions, in cases where a gene has multiple splicing isoforms, it is difficult to distinguish which isoform an observed Ribo-seq read comes from. Therefore, our pattern analysis is performed on the gene-level by concatenating all exons from the same gene into a total transcript in order to get a merged picture of translation. We first mapped all RPFs to the genome, and then identified the P-site position of each RPF in the corresponding total transcript (see Supplementary Materials). The aggregated RPF count at each codon was binned at the specified bin width for the downstream pattern analyses.
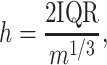
RiboDiPA allows for differential pattern analysis of Ribo-seq data with customizable bin width. The motivation for data binning is that the read coverage in Ribo-seq experiments sometimes can be sparse. The differential pattern analysis to be proposed below requires testing differential means of read counts at each location of the transcript. Therefore, binning helps alleviate excessive statistical tests on locations with zero or extremely low counts. Importantly, having more position-wise tests within the same gene increases the chance of type I error, and correction for which may undermine the power (to be further discussed below). In RiboDiPA the user can specify a fixed bin width as small as a single codon (3 nt), or optionally define each exon of a gene as a bin. In addition, we have implemented an adaptive bin width selection approach by Freedman and Diaconis (65) originally proposed for histogram construction. Our simulation results suggest that the Freedman-Diaconis rule empirically outperforms several other popular approaches including Sturges’ formula (66), Doane’s formula (67), Rice Rule (see Online Statistics Education: A Multimedia Course of Study (http://onlinestatbook.com/). Project Leader: David M. Lane, Rice University), Scott’s normal reference rule (68) and an improved Doane’s formula using a kurtosis criterion (69,70) (see Simulation section). Briefly, suppose there are m P-sites mapped at locations x1, …, xm of a transcript. The adaptive bin width is calculated as follows:
 |
(1) |
where IQR is the interquartile range of the data. In RiboDiPA, we first calculate the average P-site frequency at each position of the transcript across replicates. The adaptive bin width is calculated based on the average footprint using formula (1). The common empty bins shared by all replicates are removed after binning. In the following context, we shall refer to bin interchangeably as ‘position’ or ‘location’. Lastly, we only consider genes with at least one Ribo-seq read in every replicate for illustration of differential pattern analysis throughout this paper.
Differential pattern analysis
We begin with two examples from a study in yeast (62) to demonstrate the necessity to develop new methods for differential pattern analysis in Ribo-seq data. A naive test for differential translation is to test for mean or abundance equivalence based on the gene-wise total Ribo-seq read counts (equivalent to differential expression analysis in RNA-seq data). To avoid confusion below, we refer to this test as differential abundance (DA) analysis. Figure 2 shows the distribution of ribosome footprint of two genes, plotted in the form of mapped P-site count at each nucleotide location (unbinned) or at each bin (adaptively binned) along the transcript, for unstressed yeast cells and cells undergoing oxidative stress, in blue and red respectively with two replicates per condition. Neither TCB3 (YML072C) nor ABC1 (YGR037C) showed significant differences in terms of overall RPF abundance between conditions by DA analysis (P-value = 0.995 and 0.669 respectively). In contrast, TCB3 shows similar ribosome occupancy patterns between unstressed and stressed cells, while ABC1 shows a dramatic shift in the distribution of ribosome occupancy toward the middle of the gene under oxidative stress. Clearly, different ribosome binding patterns cannot be necessarily inferred by differential abundance analysis using total read counts, therefore we set out to establish a new framework for testing pattern differences in ribosome profiling data.
Figure 2.

Ribosome profiling data show examples of genes with differences in ribosome occupancy patterns, but similar abundance of RPFs. Plotted are the ribosome profiling data for two example genes from yeast (62), TCB3 (A) and ACB1 (B) with two replicates in unstressed conditions (blue) and under oxidative stress (red). Both TCB3 and ACB1 do not show a significant difference in the abundance of RPFs between conditions (via the DA test defined in text), but ACB1 shows clear pattern difference of ribosome occupancy across conditions, whereas TCB3 does not. For each panel, the distribution unbinned RPF counts mapped to P-site is shown on the left and the binned data on the right.
To define differential pattern (DP) analysis rigorously, we propose a statistical framework as follows. Suppose we have two conditions with n1 and n2 replicates respectively. For a given gene g of length J, denote the read count at position j in the ith replicate of condition k as Xijk, for j = 1, ..., J, i = 1, ..., nk, k = 1, 2 (we omit the gene index in notations for simplicity). We assume
 |
for i = 1, ..., nk, j = 1, ..., J, k = 1, 2, where
 |
and ρijk is the dispersion parameter. Note that sik is a gene- and sample-specific scale factor measuring the RPF abundance in the ith replicate in the kth condition, and qjk is a position- and condition- specific relative abundance parameter measuring ribosome binding affinity. For a given gene, the scale factor sik can vary across replicates and conditions (and hence mean μijk) due to differences in abundance level and sequencing depth. Our differential pattern analysis for a given gene is defined for testing the following hypothesis:
 |
(2) |
In words, the pattern equivalence can be interpreted as having parallel mean curves (μijk defined for j = 1, .., J) across different conditions.
The null hypothesis specified in (2) can be regarded as the intersection of a set of sub-hypotheses, i.e.,  where
where  , for j = 1, ..., J. This leads us to consider a point-wise approach by first testing each sub-hypothesis separately, i.e.,
 |
We convert this test into a standard differential expression analysis problem by treating sik as a sample- and gene-specific normalizing factor. Thus the first step is to estimate the normalization factor sik for each replicate of each gene. In RNA-seq analysis, there are many existing methods for calculation of normalization constants. For example, Anders and Huber (71) and Love et al. (72) took the median of the ratios of counts to geometric mean of counts across samples as a normalizing constant to avoid the influence of highly and differentially expressed genes:
 |
For the Ribo-seq data, the read count at each location for a given gene can still be very low even after binning, often causing near 0 normalization constants  . In contrast, we found the total read count is a more robust measure of the abundance level. To exclude the bins that represent the true differential pattern, we defined an outlier bin as that whose log2-fold change value is >1.5 interquartile ranges (IQRs) below the first quartile or above the third quartile. Denote the remaining non-outlier bin set as J′. The normalizing constant is defined based on the total read counts from each replicate for the same gene, i.e.
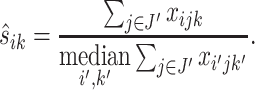 |
(3) |
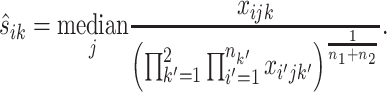
To perform a negative binomial test, one critical step is to estimate the dispersion parameter, typically modeled as a function of the mean. One challenge arises due to the small sample size such that the dispersion parameter cannot be well estimated on a gene-by-gene basis. Instead, the gene specific dispersion parameter is estimated by aggregating information from all genes. For instance, Robinson and Smyth (73) first estimated the gene-wise dispersion parameter from the conditional maximum likelihood conditioning on the total count for that gene, and then shrunk it towards a consensus value by an empirical Bayes model (‘edgeR’ R package). Anders and Huber (71) assumed a locally linear relationship between dispersion and mean to borrow information across genes (‘DESeq’ R package). As an update, Love et al. (72) first used gene-wise maximum likelihood estimate (MLE) of the dispersion parameter to fit a dispersion-mean curve, the fitted value of which was further used as the mean of a prior distribution to produce an estimate of gene-specific dispersion parameter shrunk towards the mean curve (‘DESeq2’). In this paper we adopt the method in DEseq2 to estimate the bin-wise dispersion parameter for its established competitive performance. For the same gene, the relatively small bin number (median is 13 for the eRF1d data of (62); for detailed bin number distributions of all data used in this paper, see Supplementary Figure S1 in the Supplementary Materials) makes it impossible to robustly estimate the gene-specific dispersion-mean function. Hence we pool all bins from all genes and feed the read count xijk together with corresponding scale normalization factor  into DESeq2 for estimation of the common dispersion-mean function, and thereafter the dispersion parameter for each bin within each gene. The bin-wise test for differential mean was subsequently carried out using DESeq2.
Let pj be the DESeq2 P-value for the jth bin of a given gene for j = 1, ..., J. The type I error for testing original hypotheses H0 versus H1 defined in (2) equals  , i.e., the family-wise error rate for testing
  . Thus to control the type I error rate for testing H0 versus H1, we need to control the family-wise type I error rate in the point-wise approach.
The well-known but conservative Bonferroni procedure is to adjust every P-value pj to min(Jpj, 1). Here we follow a recently proposed hybrid Hochberg–Hommel method by Gou and coauthors (74) (implemented in R package ‘elitism’) to calculate the adjusted P-values for each sub-hypothesis for its relatively more powerful performance. Briefly, let p[1] ≥ … ≥ p[J] be the ordered P-values. The adjusted bin-level P-values is given by
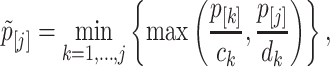 |
with ck = (k + 1)/(2k) and dk = 1/k. The gene-level P-value is defined as 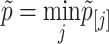 .
.
Denote  as the gene-level P-value for gene g, for g = 1, ..., G. For false discovery rate control, we input the gene-level P-value into the q-value package (75) to calculate the q-value for each gene.
A complementary pattern dissimilarity measure by SVD
The gene level P-value from the hybrid Hochberg–Hommel procedure only reflects the statistical significance at one individual location that achieves the the minimum P-value among J locations/bins. It is less indicative about the read count scale at the differential bin(s) or how many bins have differential patterns. To provide a supplementary and more direct measure of pattern dissimilarity, we consider an alternative approach based on singular value decomposition.
Let  and
and  be the count matrices from condition 1 and condition 2 respectively where each row stands for one sample and each column for one position. It is well known that the first right singular vector from singular value decomposition (SVD) of a matrix represents the first principal row pattern. Thus if
  and
and  preserve the same pattern, we expect to see similar first right singular vectors. Let
  and
and  be the first right singular vectors from sample
  and
and  respectively. Define the T value as follows:
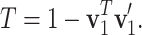 |
Note that 0 ≤ T ≤ 1 . Geometrically, it equals the 1- cosine of the angle of  and
and  (Figure 1d). A larger T may provide more evidence to reject H0. There are some known results on the null distribution of T when Xijk are i.i.d. Gaussian, which however are not applicable to non-i.i.d. count data here. In our case, T is not a pivotal quantity under H0 and its null distribution depends on the actual values of mean and variance at each location. In the RiboDiPA package, we output T value as a complementary statistic for users to prioritize positive genes with differential patterns (analogous to fold change in differential expression analysis). We shall demonstrate its usefulness below using both real and simulated data.
RESULTS
Differential pattern (DP) versus differential abundance (DA) analysis in Ribo-seq
To provide an overview of how DP analysis differs from DA analysis, we performed both analyses on wild type unstressed yeast cells versus wild type cells experiencing oxidative stress from (62). Scatter plots of RPF counts showed similar patterns for both DP and non-DP groups (Figure 3A, B), though genes identified with DP tend to have larger average RPF counts. This is not surprising as the DP test is based on bin-wise tests, and fewer reads within a bin may result in inadequate power for detection of differences due to large dispersion. Figure 3C summarizes the overlap between DP and DA genes in these comparisons. For example, out of the 5746 genes that met our criteria for analysis, 478 showed significance in DP but not in DA; and only 18 were significant in both DA and DP analyses (q-value ≤0.05). These results suggest that DP analysis can serve as a distinct and complimentary method to differential expression analysis to uncover new aspects of translational regulation.
Figure 3.

Differential pattern (DP) versus differential abundance (DA) analysis. The data shown compare WT unstressed yeast cells and WT cells responding to oxidative stress from (62). (A) Scatter plots of average Ribo-seq read counts in each condition for genes with DP and (B) without DP (at q-value ≤ 0.05). (C) Table for number of genes tested significant/insignificant in DP/DA analysis. Among 5746 genes analyzed, 5250 genes had no differential pattern (of which 5210 were DA negative), however 496 genes had a significant differential pattern (of which 478 were DA negative). Panels (D) and (E) present the P-site footprints before (left) or after (right) binning, with WT unstressed replicates in blue and WT oxidative stress in red. The large change in pattern in (E) is reflected in a larger T-value relative to (D), and shows that T-value can be used as a supplementary measure to identify genes with larger pattern differences beyond statistical significance measure P-value or q-value. Bins colored in black are those having significant adjusted P-value ≤0.05 in the DP test.
T-value as a supplementary measure for pattern differences
RiboDiPA outputs a list of genes with statistical significance in pattern difference. Practically, investigators may be more interested to identify genes with DP in more bins/positions or in bin(s) with larger read counts. The gene-wise P-value is not informative in this regard as it is dictated by the most significant bin/position in the gene and it does not reveal the read count magnitude or how many bins are DP significant. Analogous to the log fold change used in gene expression analysis, the T-value provides a metric to prioritize investigation of genes that have more pronounced changes in ribosomal occupancy patterns. As a demonstration, two example genes were selected from our DP analysis between unstressed yeast and yeast under oxidative stress (Figure 3D, E): MET6 (YER091C), a gene involved in methionine metabolism, and RPL39 (YJL189W), a large-subunit ribosomal protein. While the adjusted P-values of both genes are significant (<0.005), the T-value of MET6 is much smaller (0.036) than RPL39 (0.265). Examining the P-site frequency from mapped RPFs of RPL39 shows a dramatic shift in occupancy away from the 3′ end of the gene towards the interior of the gene body. Therefore, ranking genes that test positive for DP by their T-value could be a valuable way for investigators to focus their attention on genes with the most pronounced changes between experimental conditions.
DP analysis uncovers global translational differences
To investigate how DP analysis can help gain biological insights into global translational differences between conditions, we examined four additional comparisons from (62) including: WT osmotic stress and WT starvation response (the latter known as stationary phase growth) versus WT unstressed cells; and a rck2Δ strain versus WT cells in both oxidative and osmotic stress. Rck2 is a critical kinase involved in stress response, which has been shown to be involved in translation regulation during osmotic stress but not in response to oxidative stress (62). We plotted the empirical cumulative distribution function (ECDF) of P-value for all five comparisons for the DP test and the respective number of test-significant genes as a function of q-value threshold (Figure 4A, B). Consistent with the previous authors’ findings (62), we found no significant genes with DP in the WT versus rck2Δ comparison for oxidative stress at q-value threshold = 0.05, while for the rest, substantial numbers of genes with differential occupancy patterns were identified. For example, at the same q-value threshold, the method discovers hundreds of genes for the three stress conditions compared to unstressed cells, and ∼110 genes for the WT to rck2Δ comparison under osmotic stress (Figure 4B). The identities of the genes called in these comparisons are provided in Supplementary file 1. These results provide global pictures of translational differences between different biological conditions, and give investigators an overview of the magnitude of effect for a given perturbation of interest.
Figure 4.

DP analysis shows global differences in translational activities between conditions. Plotted are (A) the empirical cumulative distribution function (ECDF) of P-value for DP analysis for five different comparisons of stress conditions from (62), and (B) the corresponding number of discoveries under different q-value threshold values for each comparison.
RiboDiPA for single-codon resolution DP analysis
While the adaptive binning method may help improve the power to detect genes that have differential patterns in relatively large regions, the resulting bin sizes will vary from gene to gene, thus making it harder to assess details at key regions like the start and stop codons. Alternatively, RiboDiPA can perform DP analysis at single-codon resolution to identify fine pattern differences between conditions. To illustrate this, we turned to a different data set from the study by Wu et al. (62), which compares WT yeast cells (unstressed) to a Eukaryotic Release Factor 1 (eRF1) depletion strain (unstressed). eRF1 is a key factor in translation termination from all three stop codons in yeast, and it was previously shown that eRF1 depletion causes accumulation in ribosome occupancy at two locations near the stop codon on a genome-wide scale (62). Consistent with the previous finding, DP analysis with adaptive binning showed many genes had significant pattern differences towards the 3′ end of the gene (Supplementary Figure S2). To pinpoint the exact location of differential patterns, we carried out a single-codon DP analysis and examined the 50 codons downstream and upstream of the start and stop codons respectively. Figure 5A plots the number of genes that have significant DP at each given codon (adjusted codon-level P-value ≤ 0.05), where the positive direction indicates enrichment of RPF counts in eRF1d relative to WT (red), and the negative for down-regulated occupancy in eRF1d (cyan). RiboDiPA precisely identified two large spikes at the second and twelfth codons upstream from the stop codon, with all significant genes at these positions showing an increase in occupancy in the eRF1d condition relative to wild type. We speculate that this pattern of occupancy corresponds to ‘stacked’ ribosomes immediately adjacent to one another, and we show P-site counts of two genes, SUI3 and TEF2, to illustrate this (Figure 5B, C).
Figure 5.

RiboDiPA for single-codon resolution DP analysis: eRF1 depletion (A) Comparison of WT unstressed yeast cells versus eRF1 depletion strain (unstressed) from (62) shows significant enrichment of P-sites at the –12 and –2 codon position in the eRF1d cells (stop codon defined as -1 position), while no significant differential pattern is present around the start codon. Plotted in the vertical axis is the number of genes that have adjusted P-value ≤0.05 at each given codon, with positive direction for enrichment in eRF1d, and negative direction for depletion. Panels (B) and (C) show two example genes, SUI3, an eIF2β homolog, and TEF2, an eEF1A homolog respectively. Wild type data is shown in blue, while eRF1d data is shown in red, with significantly different bins highlighted in black. (D) Distribution of stop codons for DP genes in eRF1d data and for all yeast genes respectively. (E) Analysis of the positions in the vicinity of the stop codon in eRF1d DP genes shows no enrichment for particular sequences. Sequences are represented as a pLogo plot, with a log-odds score of ±3.28 representing enrichment or depletion with P-value ≤0.05. (F) GO term analysis found that the term ‘formation of translation preinitiation complex (GO:0001731)’ was enriched in DP genes (red), with eight out of a possible thirteen genes in yeast represented. Gene names and homologs, if known, are listed. (G) The GO term ‘translation reinitiation (GO:0002188)’ was also enriched, with six out of six genes annotated in yeast represented.
To further our analysis of the genes showing pattern differences near the stop codon upon depletion of eRF1, we analyzed the identities of the 643 genes that exhibit significant DP at the –12 or –2 codon position (stop codon defined as –1 position). Given eRF1’s role in translation termination, we first examined the stop codons of DP genes. Consistent with the results shown previously (62), there was no enrichment for DP genes with particular stop codons being affected by eRF1 depletion, compared to all stop codons genome-wide in yeast (Figure 5D). Additionally, there was no enrichment of particular nucleotide sequences in the vicinity of the stop codon in these DP genes as visualized by pLogo analysis (76) (Figure 5E).
Next, we turned to Gene Ontology (GO) term enrichment analysis to examine eRF1d DP genes, and found significant enrichment for terms associated with translation, including initiation, elongation, and termination (Supplementary Figure S3a). We note that RiboDiPA is more powered to detect DP genes with larger read counts. We further compared the GO term results of DP genes to those of the top 643 most abundant genes in wild type (Supplementary Figure S3b). Both lists were enriched for translation-associated GO terms (marked in red), though the list of the abundant gene set was much broader, and included many metabolism-related terms. We note 317 genes in common between the two lists (Supplementary Figure S3c), indicating substantial overlap, but also identified GO terms that were specific to DP genes and not found among the most abundant genes. For example, ‘formation of translation preinitiation complex (GO:0001731)’ was enriched in the eRF1d DP list, and of the thirteen genes in yeast associated with this term, eight were pulled out in single-codon DP analysis (Figure 5F), of which SUI3 is a member (Figure 5B). All six of the genes associated with ‘translation reinitiation (GO:0002188)’ were also returned by single-codon DP analysis (Figure 5G). When performing additional DP analyses on different Ribo-seq datasets, we noted that the pattern difference is not dictated by RPF counts although DP genes are often enriched with genes with higher read counts due to statistical power. The overlap between the most abundant gene set and DP gene set varies case by case (see additional comparisons in Supplementary Figures S4 and S5). In contrast to DP analysis of eRF1 depletion, we found no significant enrichment of GO terms in two additional comparisons (Supplementary file 2).
To extend our single codon analysis, we also applied the RiboDiPA pipeline to data collected from yeast lacking New1, a distinct translation termination regulator, which was published by Kasari et al. (63). NEW1 is a non-essential gene with a cold sensitivity knockout phenotype. Single codon DP analysis revealed 103 genes with DP at single-codon resolution, and a similar pattern of ‘stacked’ ribosomes as in eRF1 depletion (Figure 6A), while only 54 genes were shared with the eRF1d DP genes. We show triose phosphate isomerase (TPI1) and guanylate kinase (GUK1) as examples of genes with significant changes at the –12 and –22 positions upstream the stop codon (Figure 6B, C). When we examined the identity of the C-terminal amino acids in the new1Δ condition called as having DP, we found a pronounced enrichment for lysine, arginine, and asparagine, in direct accordance with the previous authors’ findings (Figure 6D). We found no such amino acid identity enrichment in the eRF1 depletion data (Figure 6E) though, which confirms that the eRF1 and New1 perturbations affect distinct sets of genes. The identities of all genes called as having DP in either the eRF1 or New1 perturbation conditions are included in Supplementary file 1. Taken together, these results demonstrate that DP analysis at single-codon resolution can discover differential patterns with fine details of ribosome positions.
Figure 6.

RiboDiPA for single-codon resolution DP analysis: NEW1 deletion (A) Single-codon DP analysis of data from (63), comparing wild type yeast to a NEW1 deletion strain at 20°C. Counts of genes that show DP at a particular codon near the start or stop codon are plotted, with genes with a positive log fold change in the new1Δ condition relative to the WT condition in red, and negative log fold change in cyan. (B, C) Binned RPF counts mapped to P-sites in wild type (blue) and new1Δ (red), shown as a representative examples of genes affected by NEW1 deletion for Triose phosphate isomerase (TPI1) and Guanylate kinase (GUK1) respectively. Positions with significant changes in pattern are labeled in black. (D) For DP genes in the new1Δ condition, the amino acid position immediately upstream of the stop codon was strongly enriched for lysine, arginine, and asparagine, as visualized by pLogo analysis, compared to the same positions for all genes in yeast genome-wide. Sequences exceeding a log-odds score of ±3.60 represent enrichment or depletion with P-value ≤0.05. (E) pLogo analysis revealed no enrichment in particular amino acids for genes called by single-codon DP analysis in the eRF1 depletion condition.
DP analysis for higher organism
RiboDiPA can be readily applied to other model organisms, including mammals. To demonstrate this, we examined data from Sugiyama et al. (64) in mouse embryonic stem cells, and were able to discover many genes that showed differential patterns when comparing Nat1 null cells to wild type cells. Supplementary Figure S6 in the Supplementary Materials shows four significant examples. Lefty1 and Epop, which are, respectively, a TGFβ family ligand and a Polycomb Repressive Complex 2-associated gene, show significant changes, in addition to the genes Keratin42 and Macf1, which is a cytoskeletal-associated factor.
Lower coverage can be an issue for single-codon resolution analysis for large genomes, as too many bins may have extremely low RPF counts. Therefore, we recommend to use single-codon DP analysis only when coverage permits, and use the default adaptive binning when coverage is sparser, or treat each exon as a bin if rich in multi-exonic genes, as is frequently the case in ribosome profiling experiments in mammalian systems.
Simulation studies
To further assess the performance of the proposed approach, we carried out two simulation studies as follows. In the first simulation, we constructed a two-condition Ribo-seq comparison experiment with m = 2, 3, 4 replicates within each condition respectively. To mimic the gene length and read count distributions observed in the real data, we selected the top 4000 genes that had largest total read counts under comparison of WT cells versus eRF1 depletion strain as templates. To avoid true differential patterns assigned to sparse regions frequently, we randomly chose 400 whose total RPF count was >10 000 as alternative genes, and the rest 3600 genes as the null. For a given selected gene designated as the template for the null gene, we generated ribosome footprint data at the codon level by simulating the read count for each codon within each replicate using a negative binomial model NB(μijk, ρijk) where i, j, k are indices for replicate, codon and condition respectively. To do that, we first calculated the relative mean qj for the jth codon based on all replicates. To generate the gene- and replicate-specific abundance/sequencing depth normalizing constant sik defined in (3) in a m versus m comparison (i.e. i = 1, ..., m, k = 1, 2), we first generated 2m random values from uniform [1,5] for each gene separately. Denote these random values as  . The normalizing constant sik is given by
  . In this way, we allow a possible range of abundance fluctuation between 0.2 and 5 for each gene. The mean parameter is given by μijk = sikqj. In the second step, we generate the dispersion parameter ρijk by plugging qj into the fitted dispersion-mean curve function obtained from the wild type vs. eRF1 depletion comparison using the DESeq2 package (i.e. output from ‘estimateDispersionsFit’ R function within DESeq2).
For the 400 alternative genes, we randomly chose 200 genes to contain  of codons with differential patterns, and the other 200 genes to bear
  of codons with differential patterns. For a given selected template gene, we treated qj for the jth codon of all replicates as the relative mean for the first condition, i.e. qj1. Considering that differential codons tend to be clustered in real data, we applied a Markov Chain model to simulate a sequence of the no-change or up-/down-regulated state path (see Supplementary Methods). If the codon is chosen to have a differential pattern with up-regulation, the relative mean for condition 2 is given by qj2 = cqj1, where c = 2, 4, 8 (or c = 1/2, 1/4, 1/8 for down-regulation) in three separate simulation settings. If a codon is chosen to have no differential pattern, then qj2 = qj1. The dispersion parameter was generated in the same way as for the null genes.
In summary, our simulation is a 3 × 3 design, three different samples size (m) by three different log2-fold change (lfc) with  true positive genes. We investigate how sample size, effect size and scale of differential patterns may affect the performance of the proposed approach.
We performed differential pattern analysis on both adaptively binned and un-binned data. We first examine the power achieved at nominal FDR level 0.05 of each setting (Figure 7). For both binned and un-binned data, the power consistently improves as sample size (m) or log2-fold change (lfc) increases, while the DP analysis based on binned data achieves significantly better power than the codon-level analysis in each setting (Figure 7A). For example, the codon-level analysis achieved  power when the mean difference was 4 fold (lfc = 2) with 2 replicates and
  with four replicates, whereas the binned analysis achieved
  and
and  power respectively at the same settings. While at lfc = 1 and m = 2, only
  and
and  power were achieved in the un-binned and binned analyses, suggesting small difference is difficult to decouple from the larger dispersion at small sample size and typical sequencing depth in current Ribo-seq studies.
Figure 7.

Simulation I results. (A) Power comparisons between binned and unbinned data (codon-level) in the simulation at nominal FDR level 0.05. (B) Power comparisons between groups of genes with 10 and 20
 differential codons. The log2 fold change (lfc) of relative means between conditions of the true positive set was varied from 1 to 3, the number of biological replicates (m) was varied from 2 to 4. The presented results were averaged over ten repeated simulations.
We further split the power curve for the alternative genes with  and
and  differential codons (Figure 7b). Unsurprisingly genes with
  of codons with differential patterns achieved larger power to be detected at the given sample size at nominal FDR level 0.05. Note the gene-level P-value from the multiple comparison procedure is determined by the minimum adjusted codon-level P-value across all codons within the same gene. In each simulation setting, regardless that the log2-fold change of q was fixed, more differential codons tend to result in more extreme minimum adjusted codon-level P-value and thus smaller gene-level P-value and larger power.
This simulation study provides new insights on the use of T-value as a complementary measure for pattern differences beyond statistical significance. A larger pattern difference could be defined as a larger change of the relative mean qjk at one given codon/bin, or it can refer to more codons/bins/regions that had differential ribosome occupancy. The gene-level P-value is a sensitive measure for the first situation while T-value is informative for the latter. We compared ECDF or gene-level P-value and the T-value of the true alternative genes with  and
and  differential bins in all nine settings in our simulation (Supplementary Figure S7). At lfc = 1, ECDF curve of P-value from the
  group shows a leap over the
  group at the left lower end (Supplementary Figure S7a, d, g), same for the T-value ECDF at larger T-value end (Supplementary Figure S7j, m, p). While the distinction of P-value curves diminishes at lfc = 2 and 3 (Supplementary Figure S7b, e, h), the T-values of the
  group maintain a significant gap over the
  group. This demonstrates that T-value can be used as a complementary measure to identify genes that have differential patterns over relatively larger regions.
We also compared Freedman-Diaconis rule with other binning methods including Sturges’ formula, Doane’s formula, Rice Rule, Scott’s normal reference rule, and the improved Doane’s formula. The ROC curve plots show that Freedman-Diaconis rule consistently outperforms all other methods under consideration in all simulation settings (Supplementary Figure S8).
We did a second simulation to further investigate how sequencing depth may affect statistical power for detection of differential patterns. Simulation II has the same settings as Simulation I except: (i) the alternative genes were completely randomly selected from the 4000 template genes; and (ii) the sequencing depth (RPF/codon) was varied up to 200-fold of original sequencing depth to evaluate how it affects the power behavior. Supplementary Table S1 in Supplementary materials tabulates the average RPF counts per codon required based on 100 simulations for targeted statistical power at 0.50, 0.75, 0.90 and 0.95. As expected, at lfc = 1, the average RPF/codon required is prohibitive if we only have two replicates (m = 2) per condition (‘NA’ stands for no actual power was achieved around the target level given a simulation setting). However when replicate number increases from m = 2 to m = 4, the required RPF/codon dramatically decreases in all simulation settings. For example, for target power and lfc = 2, from m = 2 to m = 4, the required count decreases from 48 RPF/codon to 13 for the
  differential proportion (dp) group. For target power
  , to detect lfc = 2, the required RPF/codon for
  dp group drops from 146 to 35; and at lfc = 3, from 46 to 13 respectively. These simulation results imply that at the experimental design stage, researchers should consider to increase the number of replicates instead of only increasing sequencing depth for each given replicate for better power efficiency if they aim to discover differential patterns in ribosome footprints.
DISCUSSION
In this paper, we have developed a new statistical framework for differential pattern analysis for Ribo-seq data. Our DP analysis is defined for testing parallel mean curve between different conditions. This test allows for quick identification of genes that exhibit differential ribosome binding patterns with rigorous quantification of statistical significance. We demonstrated that DP analysis can effectively uncover global differences in the translation landscape between conditions, as well as discover fine-detail pattern differences up to single-codon resolution in genes that may be regulated at distinct steps of translation.
One particular challenge in the DP analysis of Ribo-seq data arises due to small sample size and low read counts per codon. Currently available Ribo-seq experiments often contain one or two replicates per condition. Our first simulation showed that with two replicates and 2-fold change (lfc = 1) of relative mean pattern difference, we only achieved  and
and  statistical power (sensitivity) for unbinned (codon-level) and binned data respectively when controlling the nominal FDR ≤ 0.05 (Figure 7A). Multiple factors may contribute to the poor statistical power. First, it is difficult to decouple the small effect size from the large variance when the sample size is small. Second, the fitted dispersion-mean curve typically has larger dispersion for small means, which may further exacerbate the power for genes with small read counts (even after binning). We define the differential pattern in terms of the relative mean at every individual codon/bin in the entire coding region. An advantage of this framework is to enable one to pinpoint differential patterns at any specific bin/location. A downside is that the codon-wise/bin-wise read counts can be too low to detect true difference. Furthermore, the point-wise testing procedure requires a family-wise type I error correction for gene-level P-value calculation. The hybrid Hochberg–Hommel procedure improves over Bonferroni and some other correction methods in power, but still tends to be conservative overall (74). Our Simulation II results (Supplementary Table S1) point out a direction that researchers should consider if they aim to improve the power to identify fine-scale differential patterns of ribosome footprint. Instead of only increasing sequencing depth per replicate, increasing the replicate number from 2 to 4 per condition can result in significant power gain under the same total sequencing effort. For example, at lfc = 2 and m = 2, 48 RPF/codon is required to achieve
  power, whereas at m = 4, 25 RPF/codon (at about the same total sequencing effort) may achieve
  power.
In RiboDiPA we proposed a T-value divergence measure based on singular-value decomposition as a supplementary statistic and illustrated its usefulness to prioritize statistically significant DP genes. It should be noted that T-value itself does not reflect statistical significance as its distribution depends on parameters of underlying distribution of the read counts. There are a few other well-known measures in the literature for divergence of distributions including Kolmogorov–Smirnov (K–S) statistic (77,78) and Jensen–Shannon (J–S) statistic (79,80). Nevertheless for discrete distribution, it is known that the K–S test statistic does not follow a fixed asymptotic distribution as in the continuous case (see Dufour, J. M. and Farhat, A. (2001), Exact nonparametric two-sample homogeneity tests for possibly discrete distributions, unpublished manuscript). The actual distribution of K–S in the discrete case depends on the parameters of underlying distribution of read counts. Directly using the P-value of K-S test from continuous distribution may lead to erroneous interpretation of statistical significance for the Ribo-seq data. J–S statistic is also well known for measuring the divergence of two multinomial distributions, while its application in two-sample hypothesis testing is not well-established. There was recent work by Ann Marie Stewart (PhD thesis, 2019, (81)) on the asymptotic distribution of Jensen–Shannon divergence measure in the multinomial case. But this work appears to be unpublished yet. In our problem the read count follows the negative binomial distribution at each codon, not multinomial distribution. Furthermore our testing problem concerns two conditions that each has multiple samples. Both K–S and J–S divergence are generally defined for two samples. Their application to two-condition comparison that concerns multiple samples is not well known in the literature. Our simulation study in the Ribo-seq data suggested that P-value from both K–S (based on continuous distribution assumption) and J-S (from (81)) appear to be over small (results not shown). Thus we do not recommend using K-S and J-S for testing the pattern similarity before they are further verified rigorously. In RiboDiPA we pool all samples from the same condition and also output K–S and J–S statistics as two supplementary measures for pattern dissimilarity in addition to T-value.
RiboDiPA provides a new angle to investigate translational regulation based on the position information of ribosome footprints. Unlike most existing methods that use total read counts to quantify translation efficiency, Ribo-DiPA examines the ribosome footprint distribution along the transcript, which can provide additional insights into co-translational regulatory mechanisms. As an example, when we compared data from WT with eRF1 depleted yeast cells, approximately 600 genes were found to have significant differences at –12 or –2 codons upstream of the stop codon (see Figure 5A). The ternary complex formed by eRF1 with eRF3 and GTP plays an essential role in translation termination, and eRF1 recognizes all three canonical stop codons in yeast (82). Since all protein-coding transcripts require this complex in order to terminate translation, a priori it was possible that the genes with DP in the eRF1d strain would reflect the most highly translated genes in yeast. In contrast, we found many genes with significant DP were not the most highly expressed genes in yeast (i.e. top 643 genes by RPF abundance in wild type), although there was some overlap, suggesting that the identities of this subset of genes are not merely a reflection of higher-level expression. We speculate that translation dynamics, such as ribosome pausing or changes in the translation elongation rate, might result in genes with lower abundance showing DP when eRF1 is removed, although further investigation will be necessary to explore this hypothesis.
Our analysis of both data sets in yeast revealed overlapping but distinct sets of genes affected by perturbing the translation termination regulators eRF1 and New1. Interestingly, both sets of DP genes exhibited patterns of ribosome occupancy that correspond to ‘stacked’ ribosomes near stop codons (see Figures 5A and 6A). In eukaryotes, collided ribosomes are an important trigger of the Ribosome-associated Quality Control (RQC) pathway (83) (reviewed in (12,84–87), which results in ribosome subunit dissociation, mRNA degradation, and nascent polypeptide degradation. As demonstrated in our two case studies, we anticipate that RiboDiPA will be very useful to facilitate identification of genes regulated by the RQC and discovery of new features of translation dynamics imposed by the RQC during ribosome stalling stress. With more and more high-quality Ribo-seq data becoming available, we hope the computational tool presented in this study will aid in elucidating new mechanisms of translational regulation.
DATA AVAILABILITY
Accession numbers for all data used in this study are provided in the supplementary materials. The RiboDiPA package and associated code are available at: https://github.com/jipingw/RiboDiPA. RiboDiPA package will be deposited into Bioconductor later.
Supplementary Material
ACKNOWLEDGEMENTS
The authors also want to thank Dr Jiangtao Gou from Villanova University for helpful discussion on multiple comparison methods; Dr Yiben Yang and Oscar Zarate from Northwestern University for various discussions.
Contributor Information
Keren Li, Department of Statistics, Northwestern University, 633 Clark Street, Evanston, IL 60208, USA; NSF-Simons Center for Quantitative Biology, Northwestern University, 633 Clark Street, Evanston, IL 60208, USA.
C Matthew Hope, NSF-Simons Center for Quantitative Biology, Northwestern University, 633 Clark Street, Evanston, IL 60208, USA; Department of Molecular Biosciences, Northwestern University, 633 Clark Street, Evanston, IL 60208, USA.
Xiaozhong A Wang, NSF-Simons Center for Quantitative Biology, Northwestern University, 633 Clark Street, Evanston, IL 60208, USA; Department of Molecular Biosciences, Northwestern University, 633 Clark Street, Evanston, IL 60208, USA.
Ji-Ping Wang, Department of Statistics, Northwestern University, 633 Clark Street, Evanston, IL 60208, USA; NSF-Simons Center for Quantitative Biology, Northwestern University, 633 Clark Street, Evanston, IL 60208, USA.
SUPPLEMENTARY DATA
Supplementary Data are available at NAR Online.
FUNDING
NSF-Simons Center for Quantitative Biology [Simons Foundation/SFARI 597491-RWC]; National Science Foundation [1764421]. Funding for open access charge: NSF-Simons.
Conflict of interest statement. None declared.
REFERENCES
- 1. Sokabe M., Fraser C.S.. Toward a kinetic understanding of eukaryotic translation. CSH Perspect. Biol. 2019; 11:a032706. [DOI] [PMC free article] [PubMed] [Google Scholar]
- 2. Dever T.E., Dinman J.D., Green R.. Translation elongation and recoding in eukaryotes. CSH Perspect. Biol. 2018; 10:a032649. [DOI] [PMC free article] [PubMed] [Google Scholar]
- 3. Tahmasebi S., Khoutorsky A., Mathews M.B., Sonenberg N.. Translation deregulation in human disease. Nat. Rev. Mol. Cell. Biol. 2018; 19:791–807. [DOI] [PubMed] [Google Scholar]
- 4. Robichaud N., Sonenberg N., Ruggero D., Schneider R.J.. Translational control in cancer. CSH Perspect. Biol. 2019; 11:a032896. [DOI] [PMC free article] [PubMed] [Google Scholar]
- 5. Green R., Noller H.F.. Ribosomes and translation. Annu. Rev. Biochem. 1997; 66:679–716. [DOI] [PubMed] [Google Scholar]
- 6. Hinnebusch A.G. The scanning mechanism of eukaryotic translation initiation. Annu. Rev. Biochem. 2014; 83:779–812. [DOI] [PubMed] [Google Scholar]
- 7. Pelletier J., Sonenberg N.. The organizing principles of eukaryotic ribosome recruitment. Annu. Rev. Biochem. 2019; 88:307–335. [DOI] [PubMed] [Google Scholar]
- 8. Richter J.D., Coller J.. Pausing on polyribosomes: make way for elongation in translational control. Cell. 2015; 163:292–300. [DOI] [PMC free article] [PubMed] [Google Scholar]
- 9. Kramer G., Shiber A., Bukau B.. Mechanisms of cotranslational maturation of newly synthesized proteins. Annu. Rev. Biochem. 2019; 88:337–364. [DOI] [PubMed] [Google Scholar]
- 10. Hanson G., Coller J.. Codon optimality, bias and usage in translation and mRNA decay. Nat. Rev. Mol. Cell. Biol. 2018; 19:20–30. [DOI] [PMC free article] [PubMed] [Google Scholar]
- 11. Collart M.A., Weiss B.. Ribosome pausing, a dangerous necessity for co-translational events. Nucleic Acids Res. 2020; 48:1043–1055. [DOI] [PMC free article] [PubMed] [Google Scholar]
- 12. Brandman O., Hegde R.S.. Ribosome-associated protein quality control. Nat. Struct. Mol. Biol. 2016; 23:7–15. [DOI] [PMC free article] [PubMed] [Google Scholar]
- 13. Joazeiro C.A.P. Mechanisms and functions of ribosome-associated protein quality control. Nat. Rev. Mol. Cell. Biol. 2019; 20:368–383. [DOI] [PMC free article] [PubMed] [Google Scholar]
- 14. Liu B., Qian S.B.. Translational reprogramming in cellular stress response. WIRES RNA. 2014; 5:301–315. [DOI] [PMC free article] [PubMed] [Google Scholar]
- 15. Sidrauski C., McGeachy A.M., Ingolia N.T., Walter P.. The small molecule ISRIB reverses the effects of eIF2α ± phosphorylation on translation and stress granule assembly. Elife. 2015; 4:e05033. [DOI] [PMC free article] [PubMed] [Google Scholar]
- 16. Gerashchenko M.V., Lobanov A.V., Gladyshev V.N.. Genome-wide ribosome profiling reveals complex translational regulation in response to oxidative stress. Proc. Natl. Acad. Sci. U.S.A. 2012; 109:17394–17399. [DOI] [PMC free article] [PubMed] [Google Scholar]
- 17. Hinnebusch A.G. Translational regulation of GCN4 and the general amino acid control of yeast. Ann. Rev. Microbiol. 2005; 59:407–450. [DOI] [PubMed] [Google Scholar]
- 18. Saxton R.A., Sabatini D.M.. mTOR signaling in growth, metabolism, and disease. Cell. 2017; 168:960–976. [DOI] [PMC free article] [PubMed] [Google Scholar]
- 19. Ingolia N.T., Ghaemmaghami S., Newman J.R., Weissman J.S.. Genome-wide analysis in vivo of translation with nucleotide resolution using ribosome profiling. Science. 2009; 324:218–223. [DOI] [PMC free article] [PubMed] [Google Scholar]
- 20. McGlincy N.J., Ingolia N.T.. Transcriptome-wide measurement of translation by ribosome profiling. Methods. 2017; 126:112–129. [DOI] [PMC free article] [PubMed] [Google Scholar]
- 21. Wang Y., Zhang H., Lu J.. Recent advances in ribosome profiling for deciphering translational regulation. Methods. 2020; 176:46–54. [DOI] [PubMed] [Google Scholar]
- 22. Ingolia N.T., Hussmann J.A., Weissman J.S.. Ribosome profiling: global views of translation. CSH Perspect. Biol. 2019; 11:a032698. [DOI] [PMC free article] [PubMed] [Google Scholar]
- 23. Brar G.A., Weissman J.S.. Ribosome profiling reveals the what, when, where and how of protein synthesis. Nat. Rev. Mol. Cell. Biol. 2015; 16:651–664. [DOI] [PMC free article] [PubMed] [Google Scholar]
- 24. Brar G.A., Yassour M., Friedman N., Regev A., Ingolia N.T., Weissman J.S.. High-resolution view of the yeast meiotic program revealed by ribosome profiling. Science. 2012; 335:552–557. [DOI] [PMC free article] [PubMed] [Google Scholar]
- 25. Ingolia N.T., Lareau L.F., Weissman J.S.. Ribosome profiling of mouse embryonic stem cells reveals the complexity and dynamics of mammalian proteomes. Cell. 2011; 147:789–802. [DOI] [PMC free article] [PubMed] [Google Scholar]
- 26. Dunn J.G., Foo C.K., Belletier N.G., Gavis E.R., Weissman J.S.. Ribosome profiling reveals pervasive and regulated stop codon readthrough in Drosophila melanogaster. Elife. 2013; 2:e01179. [DOI] [PMC free article] [PubMed] [Google Scholar]
- 27. Liu B., Han Y., Qian S.B.. Cotranslational response to proteotoxic stress by elongation pausing of ribosomes. Molecular Cell. 2013; 49:453–463. [DOI] [PMC free article] [PubMed] [Google Scholar]
- 28. Wang H., Wang Y., Xie Z.. Computational resources for ribosome profiling: from database to Web server and software. Brief. Bioinform. 2019; 20:144–155. [DOI] [PubMed] [Google Scholar]
- 29. Kiniry S.J., Michel A.M., Baranov P.V.. Computational methods for ribosome profiling data analysis. WIRES RNA. 2020; 11:e1577. [DOI] [PubMed] [Google Scholar]
- 30. Dunn J.G., Weissman J.S.. Plastid: nucleotide-resolution analysis of next-generation sequencing and genomics data. BMC Genomics. 2016; 17:958. [DOI] [PMC free article] [PubMed] [Google Scholar]
- 31. Crappé J., Ndah E., Koch A., Steyaert S., Fijałkowska D., Keulenaer S., Meester E., Meyer T.D., Criekinge W., Damme P.V. et al.. PROTEOFORMER: deep proteome coverage through ribosome profiling and MS integration. Nucleic Acids Res. 2015; 43:e29. [DOI] [PMC free article] [PubMed] [Google Scholar]
- 32. Wang H., Mcmanus J., Kingsford C.. Accurate recovery of ribosome positions reveals slow translation of wobble-pairing codons in yeast. J. Comput. Biol. 2017; 24:486–500. [DOI] [PMC free article] [PubMed] [Google Scholar]
- 33. Michel A., Mullan J., Velayudhan V., O’Connor P., Donohue C., Baranov P.. RiboGalaxy: a browser based platform for the alignment, analysis and visualization of ribosome profiling data. RNA Biol. 2016; 13:316–319. [DOI] [PMC free article] [PubMed] [Google Scholar]
- 34. Popa A., Lebrigand K., Paquet A., Nottet N., Robbe-Sermesant K., Waldmann R., Barbry P.. RiboProfiling: a bioconductor package for standard Ribo-seq pipeline processing. F1000Research. 2016; 5:1309. [DOI] [PMC free article] [PubMed] [Google Scholar]
- 35. Chung B. Y.-W., Hardcastle T.J., Jones J.D., Irigoyen N., Firth A.E., Baulcombe D.C., Brierley I.. The use of duplex-specific nuclease in ribosome profiling and a user-friendly software package for Ribo-seq data analysis. RNA. 2015; 21:1731–1745. [DOI] [PMC free article] [PubMed] [Google Scholar]
- 36. de Klerk E., Fokkema I.F., Thiadens K.A., Goeman J.J., Palmblad M., den Dunnen J.T., von Lindern M., ’t Hoen P.A.. Assessing the translational landscape of myogenic differentiation by ribosome profiling. Nucleic Acids Res. 2015; 43:4408–4428. [DOI] [PMC free article] [PubMed] [Google Scholar]
- 37. Legendre R., Baudin-Baillieu A., Hatin I., Namy O.. RiboTools: a Galaxy toolbox for qualitative ribosome profiling analysis. Bioinformatics. 2015; 31:2586–2588. [DOI] [PubMed] [Google Scholar]
- 38. Backman H., Girke T.. systemPipeR: NGS workflow and report generation environment. BMC Bioinformatics. 2016; 17:388. [DOI] [PMC free article] [PubMed] [Google Scholar]
- 39. Ji Z., Song R., Huang H., Regev A., Struhl K.. Transcriptome-scale RNase-footprinting of RNA-protein complexes. Nat. Biotechnol. 2016; 34:410–413. [DOI] [PMC free article] [PubMed] [Google Scholar]
- 40. O’Connor P., Andreev D., Baranov P.. Comparative survey of the relative impact of mRNA features on local ribosome profiling read density. Nat. Commun. 2016; 7:12915. [DOI] [PMC free article] [PubMed] [Google Scholar]
- 41. Wang H., Mcmanus J., Kingsford C.. Isoform-level ribosome occupancy estimation guided by transcript abundance with Ribomap. Bioinformatics. 2016; 32:1880–1882. [DOI] [PMC free article] [PubMed] [Google Scholar]
- 42. Liu T.Y., Song Y.S.. Prediction of ribosome footprint profile shapes from transcript sequences. Bioinformatics. 2016; 32:i183–i191. [DOI] [PMC free article] [PubMed] [Google Scholar]
- 43. Ingolia N., Brar G., Stern-Ginossar N., Harris M., Talhouarne G., Jackson S., Wills M., Weissman J.. Ribosome profiling reveals pervasive translation outside of annotated protein-coding genes. Cell Rep. 2014; 8:1365–1379. [DOI] [PMC free article] [PubMed] [Google Scholar]
- 44. Fields A.P., Rodriguez E.H., Jovanovic M., Stern-Ginossar N., Haas B., Mertins P., Raychowdhury R., Hacohen N., Carr S.A., Ingolia N. et al.. A regression-based analysis of ribosome-profiling data reveals a conserved complexity to mammalian translation. Mol. Cell. 2015; 60:816–827. [DOI] [PMC free article] [PubMed] [Google Scholar]
- 45. Bazzini A., Johnstone T., Christiano R., Mackowiak S., Obermayer B., Fleming E., Vejnar C., Lee M., Rajewsky N., Walther T. et al.. Identification of small ORFs in vertebrates using ribosome footprinting and evolutionary conservation. EMBO J. 2014; 33:981–993. [DOI] [PMC free article] [PubMed] [Google Scholar]
- 46. Michel A.M., Choudhury K.R., Firth A.E., Ingolia N.T., Atkins J.F., Baranov P.V.. Observation of dually decoded regions of the human genome using ribosome profiling data. Genome Res. 2012; 22:2219–2229. [DOI] [PMC free article] [PubMed] [Google Scholar]
- 47. Raj A., Wang S.H., Shim H., Harpak A., Li Y.I., Engelmann B., Stephens M., Gilad Y., Pritchard J.K.. Thousands of novel translated open reading frames in humans inferred by ribosome footprint profiling. eLife. 2016; 5:e13328. [DOI] [PMC free article] [PubMed] [Google Scholar]
- 48. Ji Z., Song R., Regev A., Struhl K.. Many lncRNAs, 5′ UTRs, and pseudogenes are translated and some are likely to express functional proteins. eLife. 2015; 4:e08890. [DOI] [PMC free article] [PubMed] [Google Scholar]
- 49. Calviello L., Mukherjee N., Wyler E., Zauber H., Hirsekorn A., Selbach M., Landthaler M., Obermayer B., Ohler U.. Detecting actively translated open reading frames in ribosome profiling data. Nat. Methods. 2016; 13:165–170. [DOI] [PubMed] [Google Scholar]
- 50. Malone B., Atanassov I., Aeschimann F., Li X., Großhans H., Dieterich C.. Bayesian prediction of RNA translation from ribosome profiling. Nucleic Acids Res. 2017; 45:2960–2972. [DOI] [PMC free article] [PubMed] [Google Scholar]
- 51. Guttman M., Russell P., Ingolia N., Weissman J., Lander E.. Ribosome profiling provides evidence that large noncoding RNAs do not encode proteins. Cell. 2013; 154:240–251. [DOI] [PMC free article] [PubMed] [Google Scholar]
- 52. Chun S.Y., Rodriguez C.M., Todd P.K., Mills R.E.. SPECtre: a spectral coherence-based classifier of actively translated transcripts from ribosome profiling sequence data. BMC Bioinformatics. 2016; 17:482. [DOI] [PMC free article] [PubMed] [Google Scholar]
- 53. Chew G., Pauli A., Rinn J., Regev A., Schier A., Valen E.. Ribosome profiling reveals resemblance between long non-coding RNAs and 5′ leaders of coding RNAs. Development. 2013; 140:2828–2834. [DOI] [PMC free article] [PubMed] [Google Scholar]
- 54. Larsson O., Sonenberg N., Nadon R.. anota: analysis of differential translation in genome-wide studies. Bioinformatics. 2011; 27:1440–1441. [DOI] [PubMed] [Google Scholar]
- 55. Olshen A.B., Hsieh A.C., Stumpf C.R., Olshen R.A., Ruggero D., Taylor B.S.. Assessing gene-level translational control from ribosome profiling. Bioinformatics. 2013; 29:2995–3002. [DOI] [PMC free article] [PubMed] [Google Scholar]
- 56. Loayza-Puch F., Rooijers K., Buil L.C., Zijlstra J., Oude Vrielink J.F., Lopes R., Ugalde A.P., van Breugel P., Hofland I., Wesseling J. et al.. Tumour-specific proline vulnerability uncovered by differential ribosome codon reading. Nature. 2016; 530:490–494. [DOI] [PubMed] [Google Scholar]
- 57. Fang H., Huang Y.F., Radhakrishnan A., Siepel A., Lyon G.J., Schatz M.C.. Scikit-ribo enables accurate estimation and robust modeling of translation dynamics at codon resolution. Cell Systems. 2018; 6:180–191. [DOI] [PMC free article] [PubMed] [Google Scholar]
- 58. Zhong Y., Karaletsos T., Drewe P., Sreedharan V.T., Kuo D., Singh K., Wendel H.G., Rätsch G.. RiboDiff: detecting changes of mRNA translation efficiency from ribosome footprints. Bioinformatics. 2017; 33:139–141. [DOI] [PMC free article] [PubMed] [Google Scholar]
- 59. Li W., Wang W., Uren P.J., Penalva L. O.F., Smith A.D.. Riborex: fast and flexible identification of differential translation from Ribo-seq data. Bioinformatics. 2017; 33:1735–1737. [DOI] [PMC free article] [PubMed] [Google Scholar]
- 60. Xiao Z., Zou Q., Liu Y., Yang X.. Genome-wide assessment of differential translations with ribosome profiling data. Nat. Commun. 2016; 7:11194. [DOI] [PMC free article] [PubMed] [Google Scholar]
- 61. Tebaldi T., Dassi E., Kostoska G., Viero G., Quattrone A.. tRanslatome: an R/bioconductor package to portray translational control. Bioinformatics. 2014; 30:289–291. [DOI] [PMC free article] [PubMed] [Google Scholar]
- 62. Wu C.C., Zinshteyn B., Wehner K.A., Green R.. High-resolution ribosome profiling defines discrete ribosome elongation states and translational regulation during cellular stress. Mol. Cell. 2019; 73:959–970. [DOI] [PMC free article] [PubMed] [Google Scholar]
- 63. Kasari V., Pochopien A.A., Margus T., Murina V., Turnbull K., Zhou Y., Nissan T., Graf M., Novàček J., Atkinson G.C. et al.. A role for the Saccharomyces cerevisiae ABCF protein New1 in translation termination/recycling. Nucleic Acids Res. 2019; 47:8807–8820. [DOI] [PMC free article] [PubMed] [Google Scholar]
- 64. Sugiyama H., Takahashi K., Yamamoto T., Iwasaki M., Narita M., Nakamura M., Rand T.A., Nakagawa M., Watanabe A., Yamanaka S.. Nat1 promotes translation of specific proteins that induce differentiation of mouse embryonic stem cells. Proc. Natl. Acad. Sci. U.S.A. 2017; 114:340–345. [DOI] [PMC free article] [PubMed] [Google Scholar]
- 65. Freedman D., Diaconis P.. On the histogram as a density estimator: L2 theory. Zeitsch. Wahrsch. Verwandte Gebiete. 1981; 57:453–476. [Google Scholar]
- 66. Sturges H.A. The choice of a class interval. J. Am. Stat. Assoc. 1926; 21:65–66. [Google Scholar]
- 67. Doane D.P. Aesthetic frequency classifications. Am. Stat. 1976; 30:181–183. [Google Scholar]
- 68. Scott D.W. On optimal and data-based histograms. Biometrika. 1979; 66:605–610. [Google Scholar]
- 69. Wichard J., Kuhne R., ter Laak A.. Binding site detection via mutual information. 2008 IEEE International Conference on Fuzzy Systems (IEEE World Congress on Computational Intelligence). 2008; 1770–1776. [Google Scholar]
- 70. Li W. Mutual information functions versus correlation functions. J. Stat. Phys. 1990; 60:823–837. [Google Scholar]
- 71. Anders S., Huber W.. Differential expression analysis for sequence count data. Genome Biol. 2010; 11:R106. [DOI] [PMC free article] [PubMed] [Google Scholar]
- 72. Love M.I., Huber W., Anders S.. Moderated estimation of fold change and dispersion for RNA-seq data with DESeq2. Genome Biol. 2014; 15:550. [DOI] [PMC free article] [PubMed] [Google Scholar]
- 73. Robinson M.D., Smyth G.K.. Moderated statistical tests for assessing differences in tag abundance. Bioinformatics. 2007; 23:2881–2887. [DOI] [PubMed] [Google Scholar]
- 74. Gou J., Tamhane A.C., Xi D., Rom D.. A class of improved hybrid Hochberg-hommel type step-up multiple test procedures. Biometrika. 2014; 101:899–911. [Google Scholar]
- 75. Storey J., Bass A., Dabney A., Robinson D.. qvalue: Q-value estimation for false discovery rate control. R package version 2.22.0. 2020;
- 76. O’Shea J.P., Chou M.F., Quader S.A., Ryan J.K., Church G.M., Schwartz D.. pLogo: a probabilistic approach to visualizing sequence motifs. Nat. Methods. 2013; 10:1211–1212. [DOI] [PubMed] [Google Scholar]
- 77. Schmid P. On the Kolmogorov and Smirnov limit theorems for discontinuous distribution functions. Ann. Math. Stat. 1958; 29:1011–1027. [Google Scholar]
- 78. Arnold T.B., Emerson J.W.. Nonparametric goodness-of-fit tests for discrete null distributions. R Journal. 2011; 3:34–39. [Google Scholar]
- 79. Lin J. Divergence measures based on the Shannon entropy. IEEE T. Inform. Theory. 1991; 37:145–151. [Google Scholar]
- 80. Menéndez M., Pardo J., Pardo L., Pardo M.. The Jensen-Shannon divergence. J. Frankl. Inst. 1997; 334:307–318. [Google Scholar]
- 81. Stewart A.M. Jensen-Shannon Divergence: Estimation and Hypothesis Testing. 2019; The University of North Carolina at Charlotte; PhD thesis. [Google Scholar]
- 82. Hellen C. U.T. Translation termination and ribosome recycling in eukaryotes. CSH Perspect. Biol. 2018; 10:a032656. [DOI] [PMC free article] [PubMed] [Google Scholar]
- 83. Inada T. Quality controls induced by aberrant translation. Nucleic Acids Res. 2020; 48:1084–1096. [DOI] [PMC free article] [PubMed] [Google Scholar]
- 84. Ikeuchi K., Izawa T., Inada T.. Recent progress on the molecular mechanism of quality controls induced by ribosome stalling. Front. Genet. 2018; 9:743. [DOI] [PMC free article] [PubMed] [Google Scholar]
- 85. Simms C.L., Yan L.L., Zaher H.S.. Ribosome collision is critical for quality control during no-go decay. Mol. Cell. 2017; 68:361–373. [DOI] [PMC free article] [PubMed] [Google Scholar]
- 86. Juszkiewicz S., Chandrasekaran V., Lin Z., Kraatz S., Ramakrishnan V., Hegde R.S.. ZNF598 is a quality control sensor of collided ribosomes. Mol. Cell. 2018; 72:469–481. [DOI] [PMC free article] [PubMed] [Google Scholar]
- 87. Ikeuchi K., Tesina P., Matsuo Y., Sugiyama T., Cheng J., Saeki Y., Tanaka K., Becker T., Beckmann R., Inada T.. Collided ribosomes form a unique structural interface to induce Hel2-driven quality control pathways. EMBO J. 2019; 38:e100276. [DOI] [PMC free article] [PubMed] [Google Scholar]
Associated Data
This section collects any data citations, data availability statements, or supplementary materials included in this article.
Supplementary Materials
Data Availability Statement
Accession numbers for all data used in this study are provided in the supplementary materials. The RiboDiPA package and associated code are available at: https://github.com/jipingw/RiboDiPA. RiboDiPA package will be deposited into Bioconductor later.