

Abstract
Proper cytokine gene expression is essential in development, homeostasis and immune responses. Studies on the transcriptional control of cytokine genes have mostly focused on highly researched transcription factors (TFs) and cytokines, resulting in an incomplete portrait of cytokine gene regulation. Here, we used enhanced yeast one-hybrid (eY1H) assays to derive a comprehensive network comprising 1380 interactions between 265 TFs and 108 cytokine gene promoters. Our eY1H-derived network greatly expands the known repertoire of TF–cytokine gene interactions and the set of TFs known to regulate cytokine genes. We found an enrichment of nuclear receptors and confirmed their role in cytokine regulation in primary macrophages. Additionally, we used the eY1H-derived network as a framework to identify pairs of TFs that can be targeted with commercially-available drugs to synergistically modulate cytokine production. Finally, we integrated the eY1H data with single cell RNA-seq and phenotypic datasets to identify novel TF–cytokine regulatory axes in immune diseases and immune cell lineage development. Overall, the eY1H data provides a rich resource to study cytokine regulation in a variety of physiological and disease contexts.
INTRODUCTION
Transcriptional regulation of cytokine genes plays a central role in the development of the immune system, responses to pathogens, and inflammation (1,2). Indeed, dysregulation of cytokine expression, caused by mutations in cytokine gene regulatory regions, transcription factors (TFs) and genes belonging to upstream signaling pathways that impinge on cytokine transcriptional control regions, have been associated with autoimmune diseases, immunodeficiency, and susceptibility to infections (3). Thus, identifying the repertoire of TFs that regulate each cytokine gene is central to understanding the mechanisms that control immune responses, which will aid in the design of novel therapeutic strategies to modulate cytokine expression in immune diseases.
Research conducted for more than three decades has identified 170 TFs that bind to the transcriptional control regions and/or regulate 95 (of ∼140) human cytokine genes (4). This includes TFs that are activated by pathogen signals (e.g. NF-κB, AP-1 and IRFs), stress signals (e.g. HIF1A, TP53 and HSF1), cytokine signals (e.g. STATs and NF-κB), as well as lineage factors (e.g. SPI1 and CEBPA). However, analysis of this literature-derived human cytokine protein–DNA interaction (PDI) network suggests that this network is largely incomplete. For instance, no PDIs have been reported for nearly 30% of the cytokine genes, and new TFs and PDIs in the network are still being reported at a rate of 6.6 TFs and 35 PDIs per year (4). More importantly, most PDIs reported in the literature correspond to highly studied TFs and cytokines. Whether this bias has a biological basis or is due to research trends that arise from reagent availability or ‘fashionable’ TFs and cytokines, remains to be determined. Taken together, these facts suggest that comprehensive and unbiased screens are needed to delineate a more complete cytokine PDI network.
Different approaches have been used to identify PDIs in a high-throughput manner. Chromatin immunoprecipitation followed by next generation sequencing (ChIP-seq) has been widely used to identify the DNA regions where a TF binds. Although ChIP-seq has provided a wealth of information regarding TF genomic occupancy, ChIP-seq data are still largely incomplete. Only 30% of human TFs have been tested due to the lack of ChIP-grade anti-TF antibodies, and ChIP-seq has only been performed in a limited number of cell types and conditions, mostly in non-immune cell lines in basal conditions (5,6). Another approach to infer PDI networks involves integrating ATAC-seq or DNase-seq footprinting data with DNA-binding site preferences and expression levels of TFs (7). However, these analyses are challenging for multiple reasons: (i) transposition and cleavage preferences have to be distinguished from true DNA protection due to TF binding, (ii) DNA binding specificities have not been determined for approximately half of human TFs, (iii) similar DNA binding specificities between TF paralogs often lead to multiple TFs being predicted to bind a protected site and (iv) multiple cells need to be assayed in different conditions due to differences in chromatin landscape between cells.
Enhanced yeast one-hybrid (eY1H) assays is a powerful PDI mapping method that tests the binding of hundreds of TFs to a DNA region of interest (e.g. a cytokine promoter) in the milieu of the yeast nucleus (8,9). This approach circumvents the requirement of antibodies in ChIP-seq and testing in multiple cells and conditions in ChIP-seq, ATAC-seq, and DNase-seq. eY1H assays constitute a robust system to identify PDIs given that it uses a dual reporter system, each interaction is tested in quadruplicate, and positive interactions are identified by integrating image analysis software and manual curation (10,11). More importantly, PDIs identified by eY1H assays display a 30–70% validation rate in human cells and living animals, which is similar to the validation rate of ChIP-seq interactions, although likely because of different reasons (e.g., yeast versus mammalian system, DNA binding versus reporter activity) (10,12,13). We previously developed a high-throughput eY1H pipeline that interrogates the binding of approximately two-thirds (1086 of ∼1600) of all human TFs to defined regulatory regions, which we used to identify TFs that bind to human developmental enhancers, noncoding genetic variants, and repetitive DNA elements (10,14).
Here, we used eY1H assays to interrogate the binding of 1086 human TFs to human cytokine promoters, from which we derived a comprehensive cytokine PDI network comprising 1380 PDIs between 265 TFs and 108 cytokine promoters, substantially expanding the current literature-derived cytokine PDI network. Using orthogonal assays, we observed a validation rate similar to PDIs reported in the literature or identified by ChIP-seq, and we experimentally confirmed a regulatory function for 175 eY1H-derived PDIs in mammalian cell lines or primary macrophages. Finally, we leveraged the eY1H network as a framework to identify (i) pairs of TFs that can be targeted with commercially-available drugs to synergistically modulate cytokine production and (ii) novel TFs and TF–cytokine regulatory axes in the pathogenesis of immune diseases and in the development of immune cell lineages. Altogether, these studies demonstrate the use of the eY1H-derived network as a powerful resource to study cytokine regulation in a variety of cellular and disease contexts.
MATERIALS AND METHODS
Acquisition of literature-reported PDIs
A list of literature-reported PDIs was downloaded from CytReg (https://cytreg.bu.edu) (4). To expand the list of literature-reported physical and regulatory PDIs between TFs and cytokine genes, in February 2019 we searched for papers mentioning TF–cytokine pairs and key words ‘bind’, ‘direct’, ‘target’, ‘control’, ‘regulate’, ‘activate’, ‘repress’ or ‘suppress’. The resulting papers were manually curated to determine whether direct experimental evidence for the PDI was provided. Additionally, the species, type of assay, and functional activity (activating or repressing) when provided, were also annotated. In total, 160 additional literature-derived interactions were curated for this paper (Supplementary Table S1).
Annotation of TF and cytokine phenotypes and properties
The number of publications in PubMed for TFs and cytokines were retrieved from NCBI’s Gene database (https://www.ncbi.nlm.nih.gov/gene) on 16 August 2019. TFs and cytokines were ranked by the number of publications and then partitioned into equal-sized bins. The number of interactions in the literature-derived or the eY1H-derived PDI network between TFs and cytokines in each pair of bins in the two-dimensional matrix were counted.
The transcript per million (TPM) expression levels of TFs in 20 immune cell-types was obtained from data published by the Blueprint Epigenome Consortium (http://dcc.blueprint-epigenome.eu) (15). The maximum expression of each TF across the 20 immune cell-types was used to determine the average expression of TFs in immune cells in each bin.
The association between TFs and immune diseases was obtained from genome-wide association studies (GWAS) downloaded from the NHGRI-EBI Catalog (https://www.ebi.ac.uk/gwas) (16) on 27 July 2017 (Supplementary Table S2). Terms describing autoimmune diseases and susceptibility to infections were used to determine whether a TF is associated with an immune disease.
The association between TFs and immune phenotypes was determined from knockout mouse studies reported in the Mouse Genome Informatics (MGI) database (http://www.informatics.jax.org) (17) on 3 March 2019 (Supplementary Table S2). All terms classified as an ‘immune system phenotype’ in MGI were used to determine whether a TF is associated with an immune phenotype.
Enhanced yeast one-hybrid assays
eY1H assays were performed as previously described (8,9) to detect PDIs between TFs and cytokine gene promoters by mating ‘TF-prey strains’ with ‘DNA-bait strains’. DNA-bait strains for 112 human cytokine promoters (∼2 kb upstream of the transcription start sites) (Supplementary Table S3) were obtained by PCR amplification using Platinum Taq DNA Polymerase High Fidelity (ThermoFisher) from a pool of human genomic DNA (Clonetech). PCR products were Gateway cloned into the pDONR P1-P4 vector and entry clones were confirmed by Sanger sequencing. Then DNA-baits were Gateway cloned upstream of two reporter genes (HIS3 and LacZ) and both reporter constructs were integrated into the yeast genome to generate chromatinized DNA-bait strains (18,19). Yeast DNA-bait strains were confirmed by Sanger sequencing. DNA-bait strains were mated with an array of 1086 TF-prey yeast strains expressing human TFs fused to the yeast Gal4 activation domain (AD) (10). Matings were performed using a Singer Rotor robotic platform that manipulates yeast strains in a 1536-colony format. An interaction was detected when a TF-prey binds the DNA-bait and the AD moiety activates reporter gene expression, allowing the mated yeast to grow on media lacking histidine, overcome the addition of 3-amino-triazole (3AT), a competitive inhibitor of the His3p enzyme, and convert the colorless X-gal into a blue compound. Each interaction was tested in quadruplicate and interactions were considered positive if at least two of the four mated colonies tested positively (>90% of detected interactions tested positively for all four colonies).
Images of mated colonies on plates lacking histidine and containing 3AT and X-gal were processed using the Mybrid web-tool to detect positive interactions (11). Positive interactions detected by Mybrid were then manually checked and curated. False positives detected by Mybrid, which typically occur on plates with uneven background, were removed. False negatives missed by Mybrid, which typically occur when baits exhibit high background reporter gene expression or when interactions occur next to very strong positives, were included. A total of high-quality 1380 PDIs between 265 TFs and 108 cytokine promoters were included in the final dataset (Supplementary Table S4). The eY1H interactions from this publication have been submitted to the IMEx consortium (http://www.imexconsortium.org) through IntAct [X] and assigned the identifier IM-27908 (20). In addition, all the eY1H- and literature-derived PDIs are available in CytReg v2 (https://cytreg.bu.edu/search_v2.html).
Calculation of overlap between ChIP-seq and eY1H interactions
ChIP-seq peak coordinates were downloaded from the ENCODE Project (https://www.encodeproject.org) (5) and GTRD database (http://gtrd.biouml.org) (6) on 27 August 2018. Comparison between eY1H and ChIP-seq interactions were limited to 130 TFs that were both detected by eY1H and tested by ChIP-seq. ChIP-seq peaks were assigned to a particular promoter if the midpoint of the peak was located within the promoter sequence. Multiple ChIP-seq peaks mapping to the same promoter were counted as one TF-promoter interaction. We compared the PDIs derived from ChIP-seq to the PDIs observed in the eY1H network or in 10 000 randomized versions of the eY1H data to determine the significance of the overlap.
Calculation of overlap between TF binding sites and eY1H interactions
Position weight matrices (PWMs) for 194 human TFs in the eY1H network were downloaded from CIS-BP (http://cisbp.ccbr.utoronto.ca) (21). The presence of TF binding sites within the cytokine promoter baits were determined based on PWM matches. Each position within the cytokine promoters was scored by calculating the sum of logs for each PWM and significant scores were determined using TFM P-value (22). Scores above the TFM score threshold for P-value < 10−4 for a given PWM were considered significant hits and thereby predicted PDIs. To determine statistical significance of the overlap between eY1H and predicted PDIs, we compared the predicted PDIs to 10 000 randomized versions of the eY1H network.
Calculation of significance by network randomizations
The eY1H network was randomized by edge switching while preserving both overall network topology and individual node degree. Briefly, edge pairs (e.g. A–B and C–D) chosen at random from the network were swapped (i.e. A–D and C–B) (23). Edges were switched only if neither of the new edges were already present in the network. Each random network was generated from >20 000 edge switching events. We generated 10 000 random networks to calculate the PDI overlap with the ChIP-seq and TF binding site datasets, and the enrichment of shared inflammatory diseases between interacting TFs and cytokines. Based on the overlap with each of the 10 000 random networks, a Z-score was determined to calculate the P-value of the overlap corresponding to the eY1H-derived network.
Luciferase assays
Cytokine-promoter baits were cloned upstream of the firefly luciferase reporter gene in a Gateway compatible pGL4.23[luc2/minP] vector (10). TFs were cloned into the Gateway compatible pEZY3 vector (Addgene) or pEZY3-VP160 vector such that TFs are fused to 10 copies of the VP16 activation domain (4). To perform luciferase assays, HEK 293T cells were cultured in DMEM supplemented with 10% FBS and 1% antibiotic–antimycotic (100×) and plated in 96-well white opaque plates (∼1 × 10⁴ cells/well). Twenty four hours later, cells were transfected using Lipofectamine 3000 (Invitrogen) according to the manufacturer's protocol, with 80 ng of a TF-pEZY3 or TF-pEZY3-VP160 plasmid, 20 ng of a cytokine promoter-pGL4.23[luc2/minP] firefly luciferase plasmid, and 10 ng of the renilla luciferase plasmid as a transfection normalization control. An empty pEZY3 or pEZY3-VP160 plasmid co-transfected with the corresponding recombinant firefly luciferase plasmid were used as negative controls. Forty eight hours after transfection, firefly and renilla luciferase activities were measured using the Dual-Glo Luciferase Assay System (Promega) according to the manufacturer's protocol. Non-transfected cells were used to subtract background firefly and renilla luciferase activities, and then firefly luciferase activity was normalized to renilla luciferase activity in each well. Each TF–cytokine promoter pair was tested in three biological replicates.
Calculation of interaction profile similarity between TF or cytokine paralogs
The interaction profile similarity between TFs or cytokines was calculated using the Jaccard Index, which corresponds to the ratio between the number of shared interaction partners divided by the union of interaction partners (24). Interaction profile similarities range from 0 to 1, where a Jaccard Index of 0 indicates no shared interaction partners and a Jaccard index of 1 indicates all shared interaction partners. Paralogous TF and cytokine genes were downloaded from the Ensemble Compara database (https://uswest.ensembl.org/info/genome/compara/index.html) (25).
TF knockdown in human PBMC-derived macrophages
Peripheral blood mononuclear cells (PBMCs) were isolated from de-identified human leukapheresis-processed blood (New York Biologics, Inc.) by centrifugation through Lymphoprep (Stem Cell Technologies.) density gradient. Purified PBMCs were resuspended in serum-free RPMI medium and plated in 12-well or 6-well plates at a density of 5 × 10⁶ cells/ml. Cells were incubated at 37°C for 1–2 hours to allow binding of monocytes to the plates, then the medium and unbound cells were discarded and replaced with RPMI supplemented with 10% FBS, 10% human AB serum (Corning), 2 mM l-glutamine (Invitrogen) and 100U/ml of penicillin/streptomycin (Invitrogen). Monocytes differentiated into macrophages over 7 days at 37°C, with fresh medium replenished every 2–3 days. On day 8, cells were transfected using Lipofectamine 3000 according to the manufacturer's protocol, with 50 pmol/ml of ON-TARGETplus SMART-pool siRNA (GE Dharmacon) to knockdown the respective TFs. On day 10, cells were treated with 10 ng/ml LPS for 4 hours and then harvested in TRIzol and analyzed by RT-qPCR. For each PBMC donor, each experimental condition was performed in three biological replicates.
Generation of iBMDM stable cell lines and stimulation with ligands
HEK293T cells and immortalized bone-marrow-derived macrophages (iBMDMs) were cultured in DMEM supplemented with 10% FBS and 1% Pen-Strep under standard cell culture conditions. Control and gene-specific shRNAs (Supplementary Table S5) were cloned in pLKO.1 lentiviral vector and sequences were verified by Sanger sequencing (Genewiz). Stable iBMDMs cell lines were generated as described previously (26). In brief, HEK293T cells were co-transfected with pLKO.1 shRNA plasmid (500 ng) together with the packaging plasmids, psPAX (375 ng) and pMD2 (125 ng), using GeneJuice (Novagen). Culture supernatants containing viral particles were collected at 48 and 72 hours post transfection, pooled together and filtered through 0.45 mm PVDF membrane filter (Sigma). iBMDMs were transduced with viral particles in the presence of polybrene (8 mg/ml), and cells were selected with puromycin (3 ug/ml). iBMDMs were either stimulated with E. coli LPS (1 ug/ml) or infected with Sendai virus (200 HAU/ml) or E. coli strain DH5α (1 CFU/cell) for 6 hours. RNA was extracted using Trizol and analyzed by RT-qPCR. Each experimental condition was performed in three biological replicates and the experiment was performed twice.
RT-qPCR measurements
To measure the expression of TFs and cytokines in human PBMC-derived macrophages or mouse iBMDMs, total RNA was extracted using TRIzol (Invitrogen) and then purified using Direct-zol RNA MiniPrep kit (Zymo Research) including the DNAse I treatment step to remove contaminating DNA. cDNA was reverse-transcribed from RNA using random hexamers and M-MuLV reverse transcriptase (NEB). Primer sequences for qPCR were designed using Primer3 such that primers are located in different exons or in exon-exon junctions and checked for any off-targets using the NCBI Primer-BLAST tool. qPCRs were performed in two technical replicates using the PowerUp SYBR Green Master Mix (ThermoFisher Scientific) and primers listed (Supplementary Table S6). Relative transcript abundances were calculated using the ΔΔCt method and normalized to RPL13A and GAPDH mRNA levels for human and mouse genes, respectively.
Annotation of functional interactions between nuclear receptors and cytokine genes
The functional interactions between nuclear receptors (NRs) and cytokine genes were obtained from the literature-reported network (Supplementary Table S1) and the Nuclear Receptor Signaling Atlas (NURSA) Transcriptomine resource (https://www.nursa.org) (27) on 26 July 2019 (Supplementary Table S7). Functional interactions reported from genetic perturbation studies (e.g. NR knockout, knockdown, and overexpression) and ligand-based studies (e.g. NR activation or inhibition using agonists or antagonists) were considered. Ligands were assigned to the corresponding nuclear receptors based on assignments in NURSA, DrugBank, and Tocris (Supplementary Table S7).
Synergistic potentiation of IL10 production in M2-polarized THP-1 cells
THP-1 monocytes were cultured in RPMI supplemented with 10% FBS, 0.05 mM 2-mercaptoethanol and 1% antibiotic–antimycotic (100×), and differentiated into macrophages with 100 nM phorbol 12-myristate 13-acetate (PMA) for 72 hours, and then recovered in fresh media for 48 hours. To perform the functional assays, THP-1-derived macrophages were pre-treated with the respective NR agonists/antagonists for 15 min, and then polarized to M2 macrophages with 25 ng/ml IL4 and 25 ng/ml IL13 for 48 hours to promote IL10 production. The supernatants were collected and the amount of IL10 in the supernatants were measured using the Human IL10 ELISA MAX (Biolegend) kit according to the manufacturer's protocol. NR agonists/antagonists: NR1I2 agonist SR12813 (Tocris), NR1I2 antagonist SPA70 (Axon), RXR agonist Bexarotene (Tocris), RXR antagonist HX531 (Sigma Aldrich), and VDR agonist Ercalcitriol (Tocris). Each experimental condition was tested in quadruplicate and the experiment was performed twice.
Annotation of TF and cytokine associations with immune disorders and lineage differentiation abnormalities
The association between TFs or cytokines and abnormalities in immune cell differentiation or inflammatory diseases was obtained from DisGeNET (https://www.disgenet.org) (28), GWAS (16), or MGI (17). Gene-disease associations in DisGeNET were downloaded on 20 September 2019, associations in the NHGRI-EBI GWAS Catalog v1.0.2 were downloaded on 4 September 2019, and associations in MGI were downloaded on 24 June 2019. To determine whether a TF or cytokine is associated with one of the 12 immune diseases explored, terms describing allergy, asthma, eczema/psoriasis, fatty liver disease, general inflammation, inflammatory arthritis, inflammatory bowel disease, multiple sclerosis, primary biliary cholangitis, HIV, and susceptibility to infection, were considered (Supplementary Table S8). To determine whether a TF or cytokine is associated with abnormalities in immune cell differentiation, terms describing abnormal differentiation, abnormal proliferation, and abnormal cell count, were considered (Supplementary Table S9). In addition, TF associations with immune cell differentiation were further curated from the literature by searching papers mentioning a specific TF, immune cell lineage, and the key word ‘differentiation’ (Supplementary Table S10).
Analysis of bulk RNA-seq data
The non-alcoholic fatty liver disease data was downloaded from the GEO repository GSE126848 (29) as FASTQ files, and then were trimmed using Cutadapt (v2.2) for low quality bases and adapters. The trimmed FASTQ was aligned to the Ensembl Human Reference Genome (GrCh38.98) using STAR (v2.7.3a) (30), and then quantified using featureCounts from subread (v1.5.0) (31). The Immgen data was downloaded from the GEO repositories GSE122597 (32), GSE109125 (32), and GSE122108 (33). The International Human Epigenome Consortium (15) data were downloaded from http://www.cell.com/consortium/IHEC. The genes with lower read counts than 10 and standard deviations as 0 were excluded from the analyses.
The differential expression analyses for all dataset were conducted using DESeq2 (version 1.24.0) (34), and then the log2 fold change shrinkage to remove noise was conducted using the APEGLM algorithm (35). The Pearson correlation between TFs and cytokines were conducted using the log transformed TPM of genes and the Benjamini-Hochberg method was used to perform multiple hypothesis testing correction. The visualizations of data and results were conducted using the R package ggplot2 (v3.2.1) and PRISM (v8.4.0).
Analysis of single cell RNA-seq data
The Crohn's disease data was downloaded from the GEO repository GSE134809 (36). The hematopoietic progenitor cell data was downloaded from the GEO repository GSE117498 (37). Each dataset was merged using Seurat (v3) (38) and cells with <200 genes and >20% mitochondrial contents were removed. The Louvain community network clustering algorithm was used to cluster cells and the MAST algorithm (39) was used to find the top markers for each cluster. Canonical markers for immune cell types were used to find different immune cell types.
For the Crohn's disease dataset, we used the following markers described in the original article (36) to identify intestinal epithelial cells, dendritic cells, macrophages, B cells, and T cells (Supplementary Figure S1):
Intestinal epithelial cells: REG1B, REG1A, MUC13, ARL14, AGR2
Dendritic cells: ITGAM, ITGAX, ANPEP, CD33, CD80, CD7, CD83, CD86, CD27, CD28, CLEC4C, THBD, NRP1
Macrophages: CXCL2, MRC1, CD163, CD68, CSF1R, CD86, CD209, CD33, TLR2, TREM1, MSR1, CD63, LILRB1, IDO1, ENG, CD40, TGFB1, CXCL9, CXCL10, GPNMB, IL10, CD80, IRF4, STAT6
B cells: MS4A1, CD79A, CD79B, CD19, CD70
T cells: CD2, CD3D, CD4, CD5, CD7, CD8A, IL2RA, CD27, CD28
Pearson correlation analyses were conducted for interactions in which the TF and the cytokine were detected in at least 25% of cells, and the Benjamin Hochberg (‘BH’) method was used to adjust the P-value from correlation analyses and identify significantly correlated (FDR < 0.25) TF–cytokine pairs (Supplementary Tables S11 and S12).
Reconstruction of pseudo-time series
The R package monocle2 (v2.4.0) (40) was used to conduct the pseudo-time series analysis. Briefly, a differential expression analysis was performed to identify the top significantly differentially expressed genes (FDR < 0.05) between healthy and disease conditions to build the disease trajectory, and then each single cell was assigned a numeric pseudotime value and then ordered along the disease trajectory (Supplementary Figure S1). TFs and cytokines are included in the analyses if their expressions were detected in at least 10% of cells within a cluster and are significantly differentially expressed (FDR < 0.25) along the pseudo-temporal relationship among cells.
RESULTS
Biases and incompleteness of the literature-derived cytokine PDI network
We previously generated a literature-derived cytokine PDI network, in which biophysical (i.e. determined from binding assays – ChIP or EMSA) and functional (i.e. determined from reporter assays, or TF knockdown, knockout, or overexpression experiments) PDIs between TFs and cytokines genes were manually curated (4). We have updated this network to include an additional 160 PDIs from the literature, expanding the network to 899 PDIs in human, 740 PDIs in mouse, and 73 PDIs in other species (Supplementary Table S1). Although this literature-derived network constitutes the most comprehensive cytokine PDI network to date, we found marked research biases skewing the coverage of the network. When TFs and cytokines were ranked by the number of publications in PubMed and then partitioned into equal-sized bins, we found that nearly half of the reported PDIs were between the 10% most highly cited TFs and the 20% most highly cited cytokine genes (Figure 1A). Although an argument can be made that highly cited TFs and cytokines could have more pleiotropic roles, it is unlikely that lesser studied cytokines would be regulated by fewer or no TFs. Additionally, while the number of PDIs sharply decreases after the first TF bin, the expression levels of TFs in immune cells and the fraction of TFs associated with immune diseases in genome-wide association studies (GWAS) or with immune phenotypes in knockout (KO) mouse studies (MGI) show a more gradual decrease across the TF bins (Figure 1B and Supplementary Table S2). Taken together, these observations suggest that the skewed PDI distribution reflects a research bias towards highly studied TFs and cytokines.
Figure 1.

Cytokine PDI network. (A, E) Distribution of literature and eY1H PDIs based on the number of publications of TFs and cytokine genes. TFs and cytokine genes were ranked by the number of publications in PubMed and then partitioned into equal-sized bins. The intensity of blue in each matrix cell indicates the corresponding percentage of PDIs in the literature (A) or the eY1H network (E). (B) For each TF bin, the graph depicts the relative fraction of PDIs in the literature- or in the eY1H-derived network, the average relative expression of TFs in immune cells (Blueprint Epigenome), and the relative fraction of TFs associated with immune diseases in humans (GWAS) or immune phenotypes in KO mice (MGI). (C) Schematic of eY1H assays. A cytokine promoter (DNA-bait) is cloned upstream of two reporter genes (HIS3 and LacZ) and integrated into the yeast genome. The resulting yeast DNA-bait strain is mated with a collection of yeast TF-prey strains harboring human TFs fused to the Gal4 activation domain (AD). Positive PDIs are determined by the ability of diploid yeast to grow in the absence of histidine, overcome the His3p competitive inhibitor 3AT, and turn blue in the presence of X-gal. Each PDI is tested in quadruplicate. Red boxes indicate positive interactions. (D) The eY1H cytokine PDI network comprises 1380 PDIs (edges) between 265 TFs (turquoise nodes) and 108 cytokine gene promoters (orange nodes). TFs and cytokines are binned by the number of publications in PubMed. The eY1H PDIs reported in the literature (blue), ChIP-seq (pink), or both (purple) are indicated. (F) Overlap between literature and eY1H PDIs. The intensity of red indicates the percentage of eY1H PDIs reported in the literature. (G, H) eY1H PDIs significantly overlap with the occurrence of ChIP-seq peaks (G) and known TF binding sites (H) in the corresponding cytokine promoters. The Venn diagrams indicate the number of overlapping interactions. The histograms show the distribution of the overlap with each randomized eY1H network, where the eY1H network was randomized 10 000 times by edge-switching. The numbers under the histograms indicate the average overlap in 10 000 randomized networks, while the red arrows indicate the observed overlap with the actual eY1H-derived network. Statistical significance was calculated from Z-score values assuming normal distribution for overlap with the randomized networks. (I) Odds ratio for TFs in the eY1H cytokine network having an association with immune diseases in humans (GWAS) or immune phenotypes in KO mice (MGI). Statistical significance determined by Chi-square tests. (J) Schematic of luciferase reporter assays. HEK 293T are co-transfected with TFs fused to the VP160 (10 copies of VP16) activation domain and cytokine promoters (DNA-baits) cloned upstream of a luciferase reporter gene. After 48 hours, cells are harvested and luciferase assays performed to measure the level of luciferase light signal. Each PDI is tested in triplicate. (K) Volcano plot of luciferase reporter assays results. Each point represents the average luciferase light signal for each PDI tested in triplicate relative to cells co-transfected with the empty VP160-vector control. PDIs with a fold-change above 1.5 and an FDR-corrected P-value below 0.05 are considered positive PDIs. PDIs that did not pass the selected threshold are also shown. The positive control set consists of PDIs found in the literature or ChIP-seq, and the negative control set consists of non-interacting TF–cytokine pairs.
A comprehensive eY1H-derived cytokine PDI network
To delineate a comprehensive PDI network for cytokine genes, we used eY1H assays to systematically test 121 632 pairwise interactions between 1086 human TFs (66% of human TFs) and 112 cytokine promoters (83% of human cytokine genes) (Figure 1C). The resulting eY1H-derived network comprises 1380 PDIs between 265 TFs and 108 cytokine promoters (Figure 1D and Supplementary Table S4). All the interactions from the eY1H- and literature-derived networks are available in CytReg v2 (https://cytreg.bu.edu/search_v2.html).
The eY1H data substantially expands the current literature-derived cytokine PDI network by increasing the number of PDIs, TFs and cytokines genes. In total, we found 116 TFs that were not previously reported in the literature or by ChIP-seq to bind to or regulate cytokine transcriptional control regions (Supplementary Table S2). Of these, 31 TFs have previously been associated with immune diseases in GWAS and/or with immune phenotypes in KO mouse studies (MGI) (Supplementary Table S2). In addition, we identified PDIs for 32 human cytokine genes missing from the literature-derived network, expanding the number of cytokine genes with at least one PDI to 129 (out of ∼140) (Supplementary Tables S1 and S3).
We also found that the eY1H-derived network is less biased towards highly studied TFs and cytokines compared to the literature-derived network (Figure 1E). Importantly, we observed a similar distribution between the fraction of eY1H-derived PDIs, the expression of TFs in immune cells, and the association of TFs with immune diseases determined by GWAS, across the TF bins (Figure 1B and Supplementary Table S2). The association of TFs with immune phenotypes reported from KO mouse studies (MGI) shows an intermediate distribution pattern between the fraction of eY1H- and literature-derived PDIs in each bin, which is unsurprising given that the data in MGI was manually curated from the literature and would be subject to similar biases as the literature-derived PDIs. Overall, the eY1H network expands the cytokine gene PDI network by capturing a broader spectrum of TFs that bind to cytokine promoters and by providing coverage for lesser studied TFs and cytokine genes.
To assess the quality of the eY1H network generated, we compared the eY1H PDIs to interactions identified or predicted by other methods. First, we compared the overlap with literature-derived PDIs and found that among the most highly studied TFs and cytokines, where the literature-derived network is most complete, the overlap between the eY1H- and literature-derived networks is highest, with 44% of the PDIs found by eY1H assays being previously reported (Figure 1D and F). Second, we found a significant overlap with ChIP-seq interactions obtained from the ENCODE Project (5) and the GTRD database (6) (Figure 1G), showing that eY1H PDIs recover physical interactions found in vivo. This overlap is higher for highly studied TFs, which have been more frequently tested by ChIP-seq (Figure 1D). Third, we observed a significant overlap with PDIs predicted based on motif analyses (Figure 1H), indicating that the eY1H PDIs are likely a result of direct DNA binding. Finally, we found that TFs in the eY1H-derived network are more frequently associated with immune disorders in humans (GWAS) and with immune phenotypes in KO mice (MGI) compared to TFs that did not bind to the cytokine promoters in eY1H assays (Figure 1I and Supplementary Table S2), providing confidence that the TFs and PDIs identified by eY1H assays are immune-relevant.
In addition to the in silico validation, we experimentally evaluated the quality of the eY1H PDIs by performing luciferase reporter assays in human cells. We tested the ability of TFs fused to the VP160 (10 copies of VP16) activation domain to bind to their target cytokine promoters in HEK 293T cells (Figure 1J). We randomly tested 241 eY1H interacting pairs and, at a threshold of >1.5-fold-change (FC) with an FDR < 0.05, we observed a 63% validation rate (Figure 1K, Supplementary Table S13). Among the eY1H PDIs, we tested 61 PDIs that were previously reported in the literature (22 PDIs) and/or identified by ChIP-seq (43 PDIs) and observed a 72% validation rate, similar to the validation rate of eY1H PDIs for which experimental evidence was not available. As a negative control, we also tested 20 non-interacting TF–cytokine pairs absent from the eY1H-, literature- or ChIP-seq-derived networks, and none passed the threshold. Overall, the similarly high validation rates of the eY1H and the reported PDIs confirms the high quality of the eY1H PDI dataset.
To summarize the supporting evidence for the eY1H-derived PDIs, we have provided a table of supporting evidence and calculated a ‘supporting evidence score’ for each PDI (Supplementary Table S13).
Identification of known and novel PDIs
The eY1H network includes 37 PDIs that have been reported in the literature, such as interactions between TFAP2A and the promoters of CXCL8 and TNF, and between SPI1 and the IL12B promoter (Supplementary Table S1). Additionally, we provide physical binding evidence for 22 literature PDIs that were reported only from functional assays, such as interactions between TFAP2B and the TNF gene, and between MAFB and the IL10 gene (Supplementary Table S1). We also detected 18 PDIs that have been reported in mice but not yet in humans, such as interactions between ETS1 and the CCL5 promoter, and between SMAD4 and the promoters of CCL2, IFNB1, IL5, IL9 and IL10, showing that these PDIs are conserved between mouse and human.
We found that paralogous and functionally related cytokines often share TF interactors. While the majority of non-paralogous cytokine genes share few or no TF interactors, paralogous cytokine genes often share a larger fraction of TF interactors (Figure 2A). For example, we found that PPARA, which was reported to regulate the expression of IL17A (Supplementary Table S1), also binds to the promoter of IL17F (Figure 2B, C). Similarly, we detected multiple TFs interacting with the promoters of IL17A and IL17F, also binding to the promoter of IL25, an IL17 family member absent from the literature-derived network: RORA, RORC, PPARG, NR2F6 and ZNF281 (Figure 2B). Indeed, we confirmed that RORC and PPARG bind the IL25 promoter using luciferase assays in HEK 293T cells (Figure 2C). Additionally, we found novel TF interactors shared by IL17A, IL17F and IL25, including the nuclear receptors NR1H4, NR2C2 and RXRG (Figure 2B). Interestingly, the NR1H4 antagonist ursodeoxycholic acid was reported to inhibit IL17A production and attenuate rheumatoid arthritis, although through a different mechanism (41), and RXR agonists were found to suppress Il17a expression in mouse (42). Altogether, these observations show that in some cases, such as the IL17 family, functionally related cytokines are regulated by shared transcriptional networks.
Figure 2.
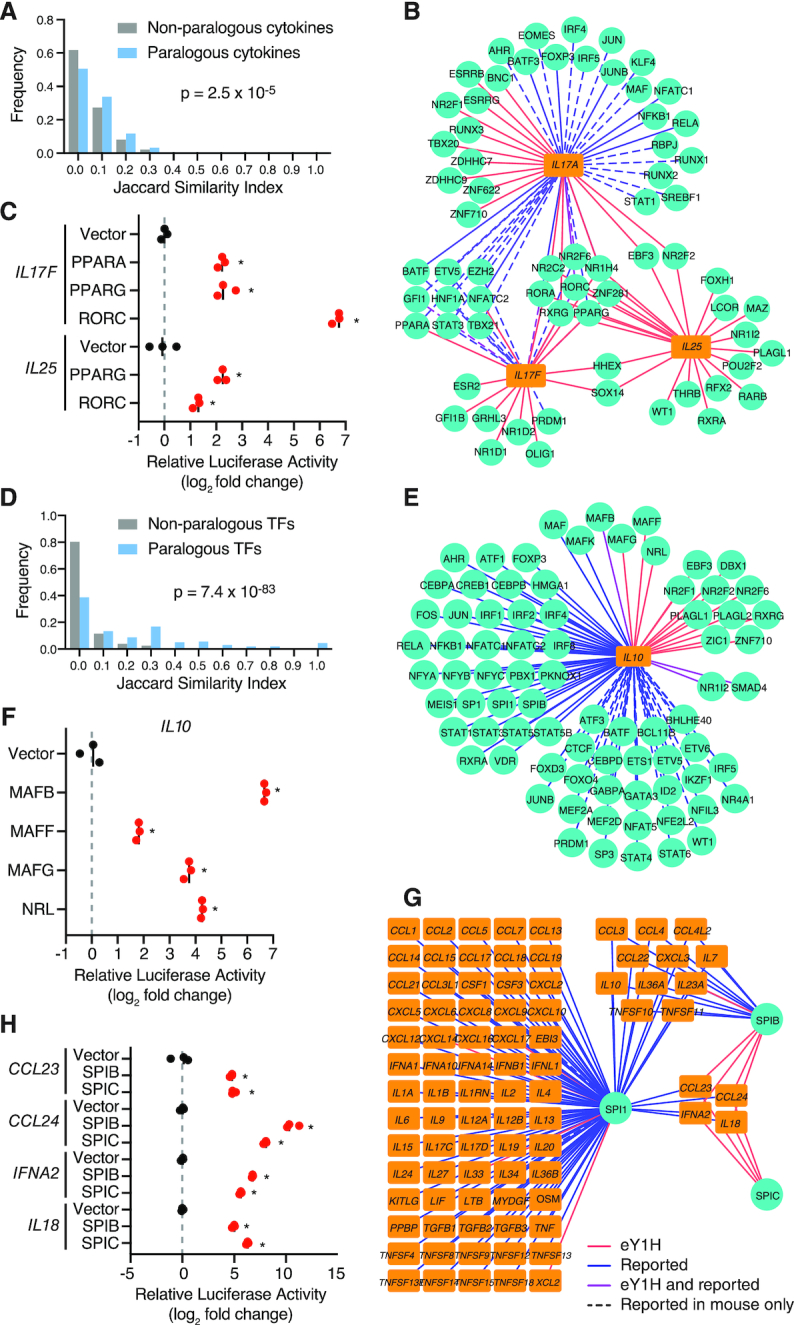
Identification of known and novel PDIs. (A, D) Interaction profile similarity between paralogous and non-paralogous cytokines (A) or TFs (D) as determined by the Jaccard Index. A Jaccard Index of 1 indicates all shared interaction partners, and a Jaccard Index of 0 indicates no shared interaction partners. Paralogous TFs and cytokines were obtained from the Ensemble Compara database. Statistical significance was determined by Mann-Whitney U test. (B, E, G) eY1H interactions involving IL17 cytokines (B), IL10 (E) and SPI TFs (G). TFs (turquoise circles) and cytokines (orange rectangles) are connected by edges based on PDIs identified in eY1H assays (red lines), literature or ChIP-seq (blue), or both (purple). PDIs reported in mice but not yet in humans are indicated by dashed lines. (C, F, H) Luciferase assays performed in HEK 293T cells to validate eY1H interactions. TFs fused to the VP160 activation domain were co-transfected with cytokine promoters cloned upstream of a luciferase gene. The relative luciferase activity is plotted as a fold-change compared to cells co-transfected with the vector control. Experiments were performed in triplicates and the average luciferase activity is indicated by the black line. *P<0.05 by unpaired two-tailed Student's t-test.
We also observed that TF paralogs often interact with the same cytokine promoters. While the majority of non-paralogous TFs interact with different cytokine promoters, TF paralogs interact with highly overlapping sets of cytokine promoters (Figure 2D). Although this may be due to similar DNA-binding specificities shared between TF paralogs, it may also be associated with TF redundancy, division of labor between TFs expressed in different cells or different biological contexts, and TFs with opposing functions as we have previously shown for TFs regulating developmental enhancers (10). The Maf TFs, MAF, MAFB and MAFK, have been shown to regulate IL10 (Supplementary Table S1). Using eY1H and luciferase assays we detected interactions between their paralogs, MAFF, MAFG and NRL, and the IL10 promoter (Figure 2E, F). Similarly, we found that highly related ETS TFs, SPIB and SPIC, bind to the promoters of four target cytokine genes, CCL23, CCL24, IFNA2, and IL18 (Figure 2G), which were previously found by ChIP-seq to be bound by their close paralog SPI1 (also known as PU.1) (5). We further confirmed these PDIs by luciferase assays in HEK 293T cells (Figure 2H). Interestingly, SPI1, SPIB, and SPIC have been reported to have redundant and opposing functions in B cell development (43–45).
In mouse immune cells reported by the Immunological Genome Project (ImmGen) (32), the expression of Spi1 and Spic are positively correlated, while the expression of Spib is generally negatively correlated with their target cytokines, Ccl24 and Il18 (Figure 3A). To our knowledge, SPIC has not yet been reported to directly regulate the expression of cytokines genes. When we knocked down the expression of SPIC by siRNA in human primary macrophages (83% knockdown efficiency in LPS stimulated macrophages, Figure 3B), the LPS-induced expressions of CCL23, CCL24, and IL18 were also downregulated (Figure 3C), suggesting that SPIC activates the expression of these cytokine genes. Spic is highly expressed in lymphocytes and lymphoid tissues, where it has been reported to regulate the development of macrophage populations (46,47). SPIC is also expressed in the liver (Human Protein Atlas, https://www.proteinatlas.org) (48), possibly in Kupffer cells. In published RNA-seq data from liver biopsies of patients diagnosed with non-alcoholic fatty liver disease (NAFLD) and its inflammatory subtype non-alcoholic steatohepatitis (NASH), in which Kupffer cells and recruited macrophages play a central role in disease progression (49), the expression of SPIC and its target cytokines, CCL23 and CCL24, were significantly downregulated (Figure 3D, E) (29). Given the role of CCL23 in monocyte chemotaxis and angiogenesis, and the role of CCL24 in eosinophil recruitment, all of which contribute to liver inflammation in NASH (50–52), SPIC downregulation may constitute a compensatory homeostatic mechanism to limit disease pathogenesis.
Figure 3.

Role of SPIC in modulating the expression of cytokine genes. (A) Correlations between the expression of Spi TFs and Ccl24 or Il18 in various immune cells reported in ImmGen. Correlations were determined by Pearson correlation coefficient. (B) Expression of SPIC in PBMC-derived macrophages transfected with control non-targeting siRNA or siRNA targeting SPIC, and stimulated with 10 ng/ml LPS for 4 hours. Experiments were performed in triplicates and the average expression of SPIC in each donor is shown. Column bars indicate the average expression of SPIC across all donors. Error bars indicate the standard error of the mean. *P< 0.05 by paired Wilcoxon signed-rank test. (C) Expression of SPIC target cytokines (CCL23, CCL24 and IL18) in PBMC-derived macrophages transfected with control non-targeting siRNA or siRNA targeting SPIC, and stimulated with 10 ng/ml LPS for 4 hours. Each line represents a different donor evaluated in biological triplicate. *P< 0.05 by paired Wilcoxon signed-rank test. (D) Volcano plot of differential gene expression between healthy and non-alcoholic steatohepatitis (NASH) liver biopsies. eY1H TFs (blue) and cytokines (orange) with FC ≥ 2.0 and adjusted P-value <0.05 are indicated. (E) Expression of SPIC and its target cytokines (CCL23, CCL24 and IL18) in liver biopsies from healthy, obese, non-alcoholic fatty liver disease (NAFLD), and NASH patients. *P< 0.05 by Kruskal–Wallis test with Dunn's multiple comparisons test when compared to healthy patients.
Role of nuclear receptors in modulating the expression of cytokine genes
We detected multiple TF families in the eY1H-derived cytokine network, including major families such as Cys2His2 zinc fingers (ZF-C2H2) and homeodomains (Figure 4A and Supplementary Table S4). We found an enrichment of interactions with the AP-2 and IPT/TIG families (P = 1.0 × 10⁻⁹ and P = 6.2 × 10⁻⁸ by proportion comparison test, respectively), which are known to play prominent roles in immune cell differentiation and immune responses (53). Interestingly, we also observed a significant enrichment of PDIs involving nuclear receptors (NRs) (P = 7.4 × 10⁻²⁸ by proportion comparison test). While NRs represent <4% of the 1086 TFs tested by eY1H assays, they constitute 18% of the PDIs (248 PDIs involving 28 NRs) in the eY1H network (Figure 4A, B). This also represents a 3.5-fold increase in the number of PDIs involving NRs compared to PDIs reported in the literature (Supplementary Table S1).
Figure 4.

Role of nuclear receptors in modulating the expression of cytokine genes. (A) Pie charts showing the distribution of TF families in the 1086 TFs tested by eY1H assays and the TFs and PDIs in the eY1H-derived network. AP2 – activating protein 2; bHLH – basic helix-loop-helix; HD – homeodomain; IPT/TIG – immunoglobulin-like, plexins, TFs/TF immunoglobulin; MH1 – Mad homology 1; NR – nuclear receptor; WH-ETS – winged-helix E-twenty six; ZF-C2H2 – zinc finger C2H2; ZF-DHHC – zinc finger DHHC. (B) eY1H-derived PDI network involving nuclear receptors (NRs) comprising 248 PDIs (edges) between 28 NRs (turquoise circles) and 48 cytokine promoters (orange rectangles). PDIs reported in the literature or NURSA from functional assays using ligands (purple edges), genetic perturbation studies (green edges), or both (black edges) are indicated. PDIs determined in mice but not yet in humans are indicated by dashed lines. The size of the node indicates the number of interactors. (C) Luciferase assays performed in HEK 293T cells co-transfected with an NR2F6 expressing vector and 18 cytokine promoters cloned upstream of a luciferase gene. The relative luciferase activity is plotted as a fold-change compared to cells co-transfected with the vector control. Experiments were performed in triplicate and the average luciferase activity is indicated by the black line. *P< 0.05 by unpaired two-tailed Student's t-test and FC > 1.5. (D) Expression of NR2F6 in human PBMC-derived macrophages transfected with control non-targeting siRNA or siRNA targeting NR2F6, and stimulated with 10 ng/ml LPS for 4 hours. Experiments were performed in triplicates and the average expression of NR2F6 in each donor is shown. Column bars indicate the average expression of NR2F6 across all donors. Error bars indicate the standard error of the mean. *P< 0.05 by paired Wilcoxon signed-rank test. (E) Expression of NR2F6 target cytokines in human PBMC-derived macrophages transfected with control non-targeting siRNA or siRNA targeting NR2F6, and stimulated with 10 ng/ml LPS for 4 hours. Each line represents a different donor evaluated in biological triplicate. *P< 0.05 by paired Wilcoxon signed-rank test. (F) Expression of TFs and cytokines in mouse iBMDMs transduced with control luciferase-targeting shRNA or shRNA targeting mouse nuclear receptors (Esrra, Nr1d2, Nr2c2, Nr2f6 or Rxra), and stimulated with 1 μg/ml LPS, 1 CFU E. coli, or 200 HAU Sendai virus. The log2 fold-change expression of TFs and cytokines in response to the ligands versus vehicle in control-shRNA iBMDMs are shown on the left (green-orange heatmaps). The log2 fold-change in relative expression of TFs and cytokines in response to the ligands between TF-shRNA and control-shRNA iBMDMs are shown on the right (blue-red heatmaps). The experiment was performed twice and in each experiment each condition was tested in biological triplicate. The average relative expression of each gene is shown. *P< 0.05 by unpaired two-tailed Student's t-test. (G) Heatmap showing the expression of IL10 (pg/ml) in THP-1-derived M2 macrophages treated with increasing concentrations of SR12813 (NR1I2 agonist) and Bexarotene (RXR agonist) or Ercalcitriol (VDR agonist). Experiments were performed in quadruplicate and the average expression of IL10 (pg/ml) is shown. Data is representative of 2 experiments. (H) Expression of IL10 (pg/ml) in THP-1-derived M2 macrophages treated with SR12813 (NR1I2 agonist) and Bexarotene (RXR agonist), SPA70 (NR1I2 antagonist), and/or HX531 (RXR antagonist). The experiment was performed twice and in each experiment each condition was tested in quadruplicate. The average expression of IL10 (pg/ml) is shown. Error bars indicate the standard error of the mean. *P< 0.05 by unpaired two-tailed Student's t-test when compared to THP-1-derived M2 macrophages treated with 10 μM SR12813 + 1 μM HX531.
NRs are a family of 48 ligand-activated TFs (54) that can sense multiple endogenous and exogenous ligands (e.g. steroids, retinoids, vitamins, xenobiotics, and other lipophilic substances) and modulate the expression of genes involved in a variety of biological processes including development, differentiation, metabolism, and immunity (55). Indeed, NRs have been shown to modulate the expression of key cytokines such as Il17a (56,57) and TNF (58) in immune cell differentiation and autoimmune disorders. To determine whether NRs identified by eY1H assays potentially regulate their target cytokine genes, we searched for functional evidence for the eY1H PDIs in the literature and in expression profiling datasets from the Nuclear Receptor Signaling Atlas (NURSA) Transcriptomine database (27). Notably, for 80 of the 248 PDIs, the NR has been found to functionally regulate its target cytokine gene (Figure 4B and Supplementary Table S7); in most cases, however, direct DNA binding had not been reported. The majority of reported regulatory interactions involving NRs have only been studied using natural or synthetic ligands. For example, NR1I2 (also known as PXR) is activated by a variety of compounds including steroids, antibiotics, bile acids, and plant metabolites (59), and 18 of the 20 cytokine genes found to interact with NR1I2 by eY1H assays were reported to be functionally regulated by NR1I2 ligands (Figure 4B and Supplementary Table S7). NR1I2 has been highly studied for its role in metabolism, but has also recently emerged as an important regulator of innate immune responses (60), T-cell function (61), and inflammatory bowel disease (IBD) (62). Similarly, 19 of the 29 cytokine genes found to interact with RXRG were reported to be regulated by RXR ligands such as vitamin A derivatives and fatty acids (Figure 4B and Supplementary Table S7). RXRA is well known to regulate inflammatory responses and attenuate host antiviral responses by modulating cytokine expression (63,64), and RXRA deficiency has been associated with autoimmune diseases (65). Less is known about its paralog RXRG, for which we found many previously observed functional and novel interactions by eY1H assays (Figure 4B and Supplementary Table S7).
Some NRs, such as NR2C2, NR2F2 and NR2F6, have no known natural or synthetic ligand but have been studied using genetic perturbations. For example, ChIP-seq and microarray analysis of NR2F2 knockdown in endometrial stromal cells show that NR2F2 primarily regulates the expression of genes involved in inflammation and cytokine signaling (66). Its paralog, NR2F6, has been reported to be a critical regulator of Th17 cell fate and function by binding to the Il17a promoter, thereby preventing the binding of NFAT/AP-1 and RORC (57). To determine whether NR2F6 can functionally regulate the promoters of other cytokine genes found by eY1H assays, we performed luciferase assays in HEK 293T cells and found that NR2F6 activated 10 of the 18 cytokine promoters tested (Figure 4C). Additionally, we found that in human primary macrophages in which we knocked down the expression of NR2F6 by siRNA (>95% knockdown efficiency, Figure 4D), the LPS-induced expressions of CCL15, CXCL3 and IL12B, were also downregulated (Figure 4E). Taken together, these observations show that, contrary to the mechanism described in mouse Th17 cells, NR2F6 activates the expression of cytokine genes in human macrophages.
Cytokines are often stimulated in response to pathogen-associated molecular patterns (e.g. LPS, CpG DNA and peptidoglycan) and pathogens. To determine whether other NRs in the eY1H network modulate cytokine expression in stimulated conditions, we knocked down five NRs in mouse immortalized bone marrow-derived macrophages (iBMDMs) using a constitutive shRNA system and treated the iBMDMs with LPS, E. coli, or Sendai virus (Figure 4F). Of the 16 TF–cytokine pairs tested, 15 resulted in the modulation of cytokine expression induced by at least one of the stimuli in at least one replicate, and 10 were significant for the same stimuli in both replicates. Some TFs showed stimuli-specific regulation of their target cytokines. For example, Esrra knockdown significantly increased the expression of Ccl20 only in E. coli-stimulated conditions, and Nr2c2 knockdown significantly increased the expression of Ccl20 only in LPS-stimulated conditions. Other TFs showed more general regulatory mechanisms that may be condition-independent, such as Nr2f6 knockdown that resulted in increased expression of Il7 and Il10 in nearly all conditions tested. Interestingly, while NR2F6 activated cytokine genes in human cells (Figure 4C and E), consistent with observations in mouse Th17 cells (57), NR2F6 repressed cytokine gene expression in mouse iBMDMs (Figure 4F), suggesting a different regulatory mechanism between human and mouse. Overall, these observations show that NRs can modulate the expression of cytokine genes, and that some of these regulatory interactions occur only under specific stimulated conditions.
Modulation of cytokine expression using synergistic TF combinations
Modulation of cytokine expression using small molecules or blocking cytokine activity using antibodies have been used as potent therapeutic strategies for multiple immune-related diseases (67). NRs present promising therapeutic drug targets to modulate cytokine expression because of the lipophilic nature of their ligands and because multiple NR agonists and antagonists have been approved as therapeutic agents (68). To explore the therapeutic potential of NRs in modulating cytokine expression, we focused on IL10, an important anti-inflammatory cytokine that is often downregulated in autoimmune diseases such as IBD (69). M2 macrophages are a major source of IL10 (70); however, THP-1-derived M2 macrophages do not readily produce IL10 (71) and thus serve as a fitting model to test for pairs of NRs that synergistically promote IL10 production. From eY1H assays, we found several NRs including NR1I2 and RXRG that bind to the IL10 promoter, while RXRA and VDR have been reported to regulate IL10 (Supplementary Table S1). Strikingly, we found that in THP-1-derived M2 macrophages, combinations of SR12813 (NR1I2 agonist) with Bexarotene (RXRA and RXRG agonist) or with Ercalcitriol (VDR agonist) synergistically promoted IL10 production (Figure 4G). Further, SPA70 (NR1I2 antagonist) and HX531 (RXRA and RXRG antagonist) dose-dependently reduced the IL10 production mediated by SR12813 and Bexarotene (Figure 4H). Altogether, these observations demonstrate the use of the eY1H- and literature-derived networks as a framework to identify combinations of TFs that synergistically modulate the expression of cytokine genes.
Prediction of TF–cytokine axes in inflammatory diseases
Cytokine imbalance is widely associated with the pathogenesis of immune disorders including autoimmunity and susceptibility to infections (3). Similarly, aberrant TF expression or activity is also associated with immune disorders, likely due to dysregulation of downstream target genes important for immune cell functions such as cytokines genes (72). Indeed, we found many TFs in the eY1H network that have been associated with the same immune disorders (reported in DisGeNET, GWAS, or MGI) as their corresponding target cytokines (Figure 5A). In total, we found 377 TF–cytokine-disease associations wherein both the TF and target cytokine have been associated with the same immune disease (Figure 5A and Supplementary Figure S1, and Supplementary Table S8), which is higher than expected by chance (Figure 5B). We found known TF–cytokine disease regulatory axes, such as RORC inducing IL17A and IL17F in inflammatory arthritis, psoriasis, and multiple sclerosis (56,73). In other cases, the link is less well-established. For example, while loss of GFI1 results in de-repression of Il17f in type 2 innate lymphoid cells (ILC2) in the course of infection (74), evidence of the GFI1-IL17F regulatory axis in asthma has not been determined. For most TF–cytokine–disease associations, the link has not yet been explored, and thus, the identified associations constitute a framework to generate hypotheses of regulatory axes in disease contexts.
Figure 5.

IBD-associated PDI network. (A) Heatmap showing TFs and number of target cytokines (shades of red) associated with the same immune disease (reported in DisGeNET, GWAS, or MGI). TFs not associated with the immune disease are shaded in grey. (B) eY1H PDIs include significantly more TF–cytokine–disease associations than expected by chance. The eY1H network was randomized 10 000 times by edge-switching and the overlap of TF–cytokine–disease associations with each randomized network was calculated. The numbers under the histogram indicates the average overlap in 10 000 randomized networks, while the red arrow indicates the observed overlap with the actual eY1H-derived network. Statistical significance was calculated from Z-score values assuming normal distribution for overlap with the randomized networks. (C) IBD-associated PDI network comprising 582 PDIs (edges) between 46 cytokines (yellow rectangle nodes) associated with IBD (reported in DisGeNET, GWAS, or MGI) and 195 TF interactors (circle nodes). TFs associated with IBD are represented by red nodes, while TFs not yet associated with IBD are represented by blue nodes. PDIs between TFs and cytokines that are both associated with IBD are indicated by red edges. PDIs correlated/anti-correlated in expression on a single-cell basis in intestinal epithelial cells (brown edges), dendritic cells (orange edges), macrophages (pink edges), B cells (purple edges), or T cells (green edges), are indicated. (D) Expression of RBPJ and CXCL9 along the pseudotime in macrophages are anti-correlated. (E, F) Relative expression of Rbpj (E) or log2 fold-change expression of Cxcl9 (F) in mouse iBMDMs transduced with control luciferase-targeting shRNA or shRNA targeting mouse Rbpj, and stimulated with 1 μg/ml LPS, 1 CFU E. coli or 200 HAU Sendai virus. Experiments were performed in triplicate and the average expression of Rbpj or Cxcl9 is shown. Error bars indicate the standard error of the mean. Data are representative of two experiments. *P< 0.05 by unpaired two-tailed Student's t-test.
To find supporting evidence for our predicted TF–cytokine–disease associations, we integrated scRNA-seq expression data to reveal correlated TF–cytokine pairs at the single-cell level that may contribute to pathogenesis of the disease. As a proof-of-concept, we focused on IBD given the important role of cytokines in IBD pathogenesis (75). The IBD-associated PDI network comprises of 582 PDIs between 46 cytokines associated with IBD (reported in DisGeNET, GWAS or MGI) and 195 TF interactors found by eY1H assays (Figure 5C). Importantly, we found 71 PDIs wherein the TF interactor was also found to be associated with IBD. To identify correlated TF–cytokine PDI pairs that may contribute to pathogenesis of IBD, we integrated scRNA-seq data collected from intestinal epithelial cells, dendritic cells, macrophages, B cells, and T cells, from IBD patients (36) (Supplementary Figure S2A, B). We found 62 TF–cytokine pairs correlated/anti-correlated in expression on a single-cell basis in at least one cell type, of which 12 PDIs were correlated/anti-correlated in multiple cell types (Figure 5C and Supplementary Table S11). Further, 18 PDIs correlated/anti-correlated in expression involve TFs associated with IBD, such as RORC, RUNX3 and NR1H4, which play a role in IBD by directly modulating the expression of cytokine genes (76–78). Notably, nine PDIs correlated/anti-correlated in expression have been reported in the literature. Five of these PDIs involve TFs that are associated with IBD (i.e., REL-CXCL8, REL-CCL20, RORC-IL17A, RORC-IL26 and NR4A2-CCL20), suggesting these TF–cytokine pairs may constitute disease regulatory axes in IBD. The other four PDIs involve TFs that are not yet associated with IBD (i.e. RORA-IL17F, MAFB-IL10, TFAP2A-CXCL8 and ELK1-CCL2), and further studies are needed to determine their role in IBD. Taken together, these findings show that the IBD-associated PDI network provides a framework to identify TF–cytokine regulatory axes that contribute to pathogenesis of the disease.
To determine whether TF–cytokine pairs in the IBD-associated PDI network could have a role in IBD progression, we used the scRNA-seq data from healthy and IBD patients to reconstruct a pseudotime trajectory of disease progression (Supplementary Figure S2C–G). Across intestinal epithelial cells, dendritic cells, macrophages, B cells, and T cells, we found that 141 of 195 TFs and 37 of 46 cytokines significantly changed in expression along the pseudotime trajectory in at least one cell type (Supplementary Figure S3). To identify novel TF–cytokine disease regulatory axes, we focused on the 42 PDIs between TFs and cytokines that are both associated with IBD and significantly change in expression along the pseudotime. For example, RBPJ and CXCL9, which are both associated with IBD, were found to be anti-correlated along the pseudotime in macrophages (Figure 5D). Interestingly, in PBMC-derived monocytes infected with Salmonella, a bacterial disease that affects the intestinal tract, RBPJ and CXCL9 were also anti-correlated in expression on a single-cell basis (79). Further, mice harboring a RBPJ deletion spontaneously develop IBD (80), while experimental IBD models and IBD patients manifest significantly increased CXCL9 levels (81,82). To determine whether RBPJ regulates CXCL9 in stimulated conditions, we knocked down RBPJ in iBMDMs and treated the iBMDMs with LPS, E. coli or Sendai virus (Figure 5E). RBPJ knockdown significantly increased the expression of CXCL9 across all conditions (Figure 5F), providing evidence of a disease regulatory axis involving a loss of RBPJ-mediated repression of CXCL9 during infection and inflammation. Altogether, these findings demonstrate the power of the eY1H network to identify novel TFs and PDIs that have a role in inflammatory diseases.
Identification of lineage TFs regulating cytokine genes
Cytokines have a fundamental role in the determination and commitment to specific immune cell lineages. For example, IFNG promotes Th1-cell differentiation and inhibits Th2-cell differentiation, whereas IL4 promotes Th2-cell differentiation and inhibits Th1-cell differentiation (83). Production of these lineage-directing cytokines is regulated by key transcription factors that ultimately determine the fate of the cell. For example, TBX21 (also known as T-bet) regulates the IFNG promoter in Th1 cells and GATA3 regulates the IL4 promoter in Th2 cells (83). Although cell-fate determining TFs have been identified for many immune cell lineages, TFs involved in early fate decisions and maintenance of the established cell lineages are still being discovered.
To predict novel TFs that have a role in development of immune cell lineages, we leveraged the eY1H network and gene associations with abnormalities in immune cell differentiation (reported in DisGeNET, GWAS or MGI) to generate lineage-associated PDI networks (Figure 6). Each lineage network consists of cytokines that are associated with abnormalities in lineage-specific differentiation and their TF interactors found by eY1H assays (Supplementary Table S9). Indeed, we found 100 TF–cytokine-lineage associations across all the lineage networks, wherein the cytokine and its TF interactor were both associated with differentiation abnormalities in the same lineage. For example, RORC and IL17A were associated with CD4+ T cell differentiation, SPIC and IL18 were associated with macrophage differentiation, and RUNX3 and XCL1 were associated with dendritic cell differentiation. Further, when we searched for additional TF-lineage associations in the literature, we found an additional 119 TF–cytokine-lineage associations wherein the TFs were reported to be associated with differentiation of the same lineage as their target cytokines (Figure 6 and Supplementary Table S10). We also found several TFs that have not yet been associated but have been predicted to regulate differentiation in the same lineage as their target cytokines. For example, ELF3 was predicted in neutrophil differentiation based on its expression patterns during differentiation (84), and PROX1 was predicted to play a role in CD4+ T cell differentiation by suppressing key lineage cytokines (85). Overall, the lineage-associated PDI networks, generated from cytokines associated with abnormalities in lineage-specific differentiation, identified many TF interactors found by eY1H assays that have themselves been associated with differentiation of the same cell lineage.
Figure 6.

Immune cell lineage PDI networks. Lineage-associated (LA) PDI networks. Each LA network consists of eY1H PDIs involving cytokines (yellow rectangle nodes) associated with lineage-specific differentiation (DisGeNET, GWAS or MGI), and their TF interactors (circle nodes). TFs associated with abnormalities in lineage-specific differentiation reported in DisGeNET, GWAS or MGI, are represented by green nodes. TFs associated with lineage-specific differentiation reported in the literature are represented by cyan nodes. TFs not yet associated with lineage-specific differentiation are represented by purple nodes. PDIs between TFs and cytokines both associated with the same lineage-specific differentiation are indicated by green or cyan edges, and listed next to each lineage network in green or cyan font. PDIs between TFs and cytokines found to be correlated by scRNA-seq in the specific lineages are indicated by blue edges for LA TFs, or red edges for non-LA TFs, and listed next to each lineage network in blue or red font, respectively.
To narrow our focus on PDIs likely involved in immune cell differentiation, we integrated scRNA-seq data collected from human hematopoietic stem/progenitor cells (HSPCs) during early cell fate commitment (37). We found 20 PDIs wherein the TF and cytokine are significantly correlated in expression on a single-cell basis in the corresponding cell lineage (Supplementary Table S12). Of these, six PDIs involve TFs that have been associated with differentiation of the corresponding lineage and 14 PDIs involve TFs not yet associated with differentiation of the corresponding lineage. For example, KLF3 was found to be correlated with TNF in CD4+ and CD8+ T cells. Interestingly, although KLF3 has not yet been associated with T cell differentiation, KLF3 is highly expressed in T cells (ImmGen, http://www.immgen.org) (32) and is predicted to regulate memory T cell formation (86). Additionally, several correlated TFs that have not yet been associated with lineage-specific differentiation have been observed to play a role in proliferation. For example, HEY1, a target of the NOTCH signaling pathway, was found to be correlated with the essential B cell cytokine IL7. In B cell lymphoma, HEY1 is overexpressed, and impairing either NOTCH signaling or downregulation of HEY1 results in reduced proliferation of B cell lymphoma cells (87). IL7 has also been found to be expressed and enhance the development of B cell lymphomas (88). These observations suggest that beyond the context of cancer, HEY1 may have a role in B cell development potentially by regulating IL7. In total, 26 TFs that have not yet been associated with lineage-specific differentiation have been implicated in proliferative disorders, such as neoplastic growth transformations or leukemia, in the same lineage as their target cytokines (Supplementary Table S10), suggesting that these TFs may also have roles in the proliferation stages during lineage development. Altogether, these findings demonstrate the use of the eY1H network to identify novel TFs that have a lineage-defining role in the development of immune cells.
Supporting evidence for eY1H-derived PDIs
We devised a ‘supporting evidence score’ for each eY1H PDI, in which we weighted the interactions based on: (i) literature-reported evidence, (ii) presence of ChIP-seq peaks in the cytokine promoter, (iii) presence of corresponding TF-binding motif in the cytokine promoter, (iv) functional evidence from genetic or drug perturbation experiments reported in NURSA Transcriptomine, (v) experimental evidence from this project (e.g. luciferase reporter assays and TF knockdown experiments in primary cells), (vi) TF–cytokine co-expression in bulk RNA-seq or single-cell RNA-seq datasets analyzed in this project and (vii) shared TF–cytokine associations with immune diseases or lineage differentiation (Supplementary Table S13). In total, 973 PDIs are supported by some evidence of a potential interaction, including 243 PDIs supported by reported experimental evidence (e.g. functional assays, binding assays, or ChIP-seq), and 175 PDIs experimentally validated in this study in mammalian cell lines or primary macrophages. Additionally, 79 PDIs are correlated/anti-correlated in bulk RNA-seq or scRNA-seq datasets suggesting that these PDIs have a regulatory function, and 313 PDIs share the same association with immune diseases or lineage differentiation. Overall, we found abundant evidence supporting the PDIs detected by eY1H assays.
DISCUSSION
In this study, we used eY1H assays to delineate a comprehensive cytokine PDI network comprising 1380 PDIs between 265 TFs and 108 cytokine gene promoters. We performed in silico and in vitro validations confirming the high quality of the network, and further investigated several TFs in primary macrophages showing that they can functionally regulate their target cytokines. Additionally, we found correlations/anti-correlations in expression between many TF–cytokine pairs in bulk or scRNA-seq datasets. Altogether, we found supporting evidence, either from external sources or validations we performed in this study, for over 70% of the PDIs found by eY1H assays. To summarize the supporting evidence, we provide a table (Supplementary Table S13) and an evidence score for each PDI providing a resource for researchers to prioritize PDIs for follow-up studies.
It is important to note that the data used to generate the ‘supporting evidence score’ are not complete and have their own confidence issues. For example, functional validations reported in the literature or phenotypic studies suffer from research biases towards highly studied TFs and cytokines. Additionally, only 30% of human TFs have been tested by ChIP-seq due to the lack of ChIP-grade anti-TF antibodies, and ChIP-seq has only been performed in a limited number of cell types and conditions, mostly non-immune and unstimulated cell lines. These factors likely contributed to the modest overlap observed between eY1H PDIs and ChIP-seq PDIs. The generation of additional ChIP-seq datasets in immune cells and in different stimulating conditions is likely to increase the number of eY1H PDIs overlapping with ChIP-seq peaks as we have previously reported (10). Further, interactions not supported by any evidence may still be physiologically relevant, and as new datasets are generated, evidence may be found to support these interactions.
eY1H assays provide a powerful high-throughput PDI mapping method to test the binding of hundreds of TFs to defined DNA regions of interest. However, eY1H assays are not without caveats. Foremost, eY1H assays are limited to detecting PDIs for 1086 (out of ∼1600) TFs that are in the TF array, and thus PDIs that occur with TFs missing from the array will not be detected. eY1H assays also cannot detect TFs that exclusively interact with DNA as heterodimers, in cooperative complexes, or after post-translational modifications (89). These include NF-κB heterodimers and phosphorylated STATs which have important roles in immunity and cytokine regulation. In addition, eY1H-derived PDIs occur within the yeast nucleus, outside of the endogenous chromatin context which plays an important role in immune regulation (90). Improvements to the eY1H method, such as co-expressing two TFs or expressing phosphomimetic TF variants, and integration with chromatin accessibility and histone marks, will likely reduce the false negative rate and identify the appropriate cellular contexts in which the PDIs are relevant. The rate of false positives is conceptually more complicated to define as interactions can be specific to a cell-type or condition in which they have not been tested. Nonetheless, we found that interactions identified by eY1H assays and interactions that have been reported in the literature or identified by ChIP-seq validated at similar rates.
The eY1H dataset is enriched in NRs. NRs are ligand-activated TFs and thus they present an opportunity to modulate cytokine activity using drugs, especially in inflammatory diseases. Although antibodies have proven to be effective approaches in autoimmune diseases, approved antibodies blocking cytokine activity are available for only nine cytokines (DrugBank, (91)). Additionally, a therapeutic strategy may require the induction of cytokine activity rather than inhibition, or the concomitant modulation of multiple cytokines. Thus, NRs may provide an alternative therapeutic approach to modulate cytokine expression. Here, we demonstrated the use of the eY1H and literature datasets as a framework to identify combinations of NR agonists that synergistically increase the production of IL10. Further exploration of the eY1H- and literature-derived datasets may identify other NRs that synergistically or concomitantly modulate the expression of multiple cytokine genes.
The eY1H data provides a resource of PDIs to integrate with other large-scale datasets and make functional predictions about TFs in cytokine regulation. Here, we present examples from integrating the eY1H data with scRNA-seq datasets to identify novel TFs and TF–cytokine regulatory axes in inflammatory diseases and lineage differentiation. Applying a similar approach, the eY1H data can be used to complement CRISPR screens to identify direct interactions between TFs and cytokine genes. Overall, the eY1H PDIs provides a powerful resource that can be mined in myriad additional ways to complement other datasets and delineate a more accurate understanding of cytokine gene regulatory networks.
Supplementary Material
ACKNOWLEDGEMENTS
We thank Dr. Marian Walhout and Dr. Katherine Fitzgerald for helpful discussions in conceiving the project, and members of the Fuxman Bass lab, Dr. Thomas Gilmore, and Dr. Trevor Siggers for helpful discussions and critically reviewing the manuscript. We thank Joseph Bloom for assistance in retrieving the ENCODE and GTRD ChIP-seq datasets. We thank Callen Bragdon and Andrew Munoz for assistance in retrieving the NURSA Transcriptomine dataset. We thank Kyle Pedro for assistance in culturing PBMCs.
Author contributions: C.S.S. and J.I.F.B. conceived the project, designed the experiments, and wrote the manuscript. C.S.S. and S.C.P. generated CytReg v2. J.I.F.B., C.S.S. and L.X., performed eY1H assays. C.S.S. and K.A.G. performed luciferase assays. C.S.S. and L.M.A. performed the PBMC experiments. S.L. and C.S.S. performed the iBMDM experiments. S.Y. and C.S.S. performed the THP-1 experiments. C.S.S., L.Z., J.I.F.B., S.C.P. and J.A.S., performed the data analysis. A.J.H. supervised L.M.A. and M.A. supervised S.L. All authors read and approved the manuscript.
Contributor Information
Clarissa S Santoso, Department of Biology, Boston University, Boston, MA 02215, USA.
Zhaorong Li, Bioinformatics Program, Boston University, Boston, MA 02215, USA.
Sneha Lal, Department of Immunology, University of Pittsburgh, Pittsburgh, PA 15261, USA.
Samson Yuan, Department of Biology, Boston University, Boston, MA 02215, USA.
Kok Ann Gan, Department of Biology, Boston University, Boston, MA 02215, USA.
Luis M Agosto, Department of Medicine, Section of Infectious Diseases, Boston University School of Medicine, Boston, MA 02118, USA.
Xing Liu, Department of Biology, Boston University, Boston, MA 02215, USA.
Sebastian Carrasco Pro, Bioinformatics Program, Boston University, Boston, MA 02215, USA.
Jared A Sewell, Department of Biology, Boston University, Boston, MA 02215, USA.
Andrew Henderson, Department of Medicine, Section of Infectious Diseases, Boston University School of Medicine, Boston, MA 02118, USA.
Maninjay K Atianand, Department of Immunology, University of Pittsburgh, Pittsburgh, PA 15261, USA.
Juan I Fuxman Bass, Department of Biology, Boston University, Boston, MA 02215, USA; Bioinformatics Program, Boston University, Boston, MA 02215, USA.
SUPPLEMENTARY DATA
Supplementary Data are available at NAR Online.
FUNDING
National Institutes of Health [R00 GM114296, R35 GM128625 to J.I.F.B., R01 AI138960, R01 AI122842 to A.H.J., 5T32HL007501-34 to J.A.S.]; amfAR Mathilde Krim Fellowship [109263-59-RKRL to L.M.A.]; Boston University's Undergraduate Research Opportunities Program and New England Biolabs’ Summer Undergraduate Research Award [to S.Y]. Funding for open access charge: National Institutes of Health [R35 GM128625].
Conflict of interest statement. None declared.
REFERENCES
- 1. Griffith J.W., Sokol C.L., Luster A.D.. Chemokines and chemokine receptors: positioning cells for host defense and immunity. Annu. Rev. Immunol. 2014; 32:659–702. [DOI] [PubMed] [Google Scholar]
- 2. Medzhitov R., Horng T.. Transcriptional control of the inflammatory response. Nat. Rev. Immunol. 2009; 9:692–703. [DOI] [PubMed] [Google Scholar]
- 3. Turner M.D., Nedjai B., Hurst T., Pennington D.J.. Cytokines and chemokines: at the crossroads of cell signalling and inflammatory disease. Biochim. Biophys. Acta. 2014; 1843:2563–2582. [DOI] [PubMed] [Google Scholar]
- 4. Carrasco Pro S., Dafonte Imedio A., Santoso C.S., Gan K.A., Sewell J.A., Martinez M., Sereda R., Mehta S., Fuxman Bass J.I.. Global landscape of mouse and human cytokine transcriptional regulation. Nucleic Acids Res. 2018; 46:9321–9337. [DOI] [PMC free article] [PubMed] [Google Scholar]
- 5. ENCODE Project Consortium An integrated encyclopedia of DNA elements in the human genome. Nature. 2012; 489:57–74. [DOI] [PMC free article] [PubMed] [Google Scholar]
- 6. Yevshin I., Sharipov R., Valeev T., Kel A., Kolpakov F.. GTRD: a database of transcription factor binding sites identified by ChIP-seq experiments. Nucleic Acids Res. 2017; 45:D61–D67. [DOI] [PMC free article] [PubMed] [Google Scholar]
- 7. Pokrovskii M., Hall J.A., Ochayon D.E., Yi R., Chaimowitz N.S., Seelamneni H., Carriero N., Watters A., Waggoner S.N., Littman D.R. et al.. Characterization of transcriptional regulatory networks that promote and restrict identities and functions of intestinal innate lymphoid cells. Immunity. 2019; 51:185–197. [DOI] [PMC free article] [PubMed] [Google Scholar]
- 8. Shrestha S., Liu X., Santoso C.S., Fuxman Bass J.I.. Enhanced yeast one-hybrid screens to identify transcription factor binding to human DNA sequences. J. Vis. Exp. 2019; doi:10.3791/59192. [DOI] [PMC free article] [PubMed] [Google Scholar]
- 9. Reece-Hoyes J.S., Diallo A., Lajoie B., Kent A., Shrestha S., Kadreppa S., Pesyna C., Dekker J., Myers C.L., Walhout A.J.. Enhanced yeast one-hybrid assays for high-throughput gene-centered regulatory network mapping. Nat. Methods. 2011; 8:1059–1064. [DOI] [PMC free article] [PubMed] [Google Scholar]
- 10. Fuxman Bass J.I., Sahni N., Shrestha S., Garcia-Gonzalez A., Mori A., Bhat N., Yi S., Hill D.E., Vidal M., Walhout A.J.. Human gene-centered transcription factor networks for enhancers and disease variants. Cell. 2015; 161:661–673. [DOI] [PMC free article] [PubMed] [Google Scholar]
- 11. Reece-Hoyes J.S., Pons C., Diallo A., Mori A., Shrestha S., Kadreppa S., Nelson J., Diprima S., Dricot A., Lajoie B.R. et al.. Extensive rewiring and complex evolutionary dynamics in a C. elegans multiparameter transcription factor network. Mol. Cell. 2013; 51:116–127. [DOI] [PMC free article] [PubMed] [Google Scholar]
- 12. Whitfield T.W., Wang J., Collins P.J., Partridge E.C., Aldred S.F., Trinklein N.D., Myers R.M., Weng Z.. Functional analysis of transcription factor binding sites in human promoters. Genome Biol. 2012; 13:R50. [DOI] [PMC free article] [PubMed] [Google Scholar]
- 13. Fuxman Bass J.I., Pons C., Kozlowski L., Reece-Hoyes J.S., Shrestha S., Holdorf A.D., Mori A., Myers C.L., Walhout A.J.. A gene-centered C. elegans protein-DNA interaction network provides a framework for functional predictions. Mol. Syst. Biol. 2016; 12:884. [DOI] [PMC free article] [PubMed] [Google Scholar]
- 14. Shrestha S., Sewell J.A., Santoso C.S., Forchielli E., Pro S.C., Martinez M., Bass J.I.F.. Discovering human transcription factor physical interactions with genetic variants, novel DNA motifs, and repetitive elements using enhanced yeast one-hybrid assays. Genome Res. 2019; 29:1533–1544. [DOI] [PMC free article] [PubMed] [Google Scholar]
- 15. Stunnenberg H.G., International Human Epigenome, C. International Human Epigenome, C. Hirst M. The international human epigenome consortium: a blueprint for scientific collaboration and discovery. Cell. 2016; 167:1145–1149. [DOI] [PubMed] [Google Scholar]
- 16. MacArthur J., Bowler E., Cerezo M., Gil L., Hall P., Hastings E., Junkins H., McMahon A., Milano A., Morales J. et al.. The new NHGRI-EBI Catalog of published genome-wide association studies (GWAS Catalog). Nucleic Acids Res. 2017; 45:D896–D901. [DOI] [PMC free article] [PubMed] [Google Scholar]
- 17. Eppig J.T., Smith C.L., Blake J.A., Ringwald M., Kadin J.A., Richardson J.E., Bult C.J.. Mouse Genome Informatics (MGI): resources for mining mouse genetic, genomic, and biological data in support of primary and translational research. Methods Mol. Biol. 2017; 1488:47–73. [DOI] [PubMed] [Google Scholar]
- 18. Deplancke B., Mukhopadhyay A., Ao W., Elewa A.M., Grove C.A., Martinez N.J., Sequerra R., Doucette-Stamm L., Reece-Hoyes J.S., Hope I.A. et al.. A gene-centered C. elegans protein-DNA interaction network. Cell. 2006; 125:1193–1205. [DOI] [PubMed] [Google Scholar]
- 19. Deplancke B., Vermeirssen V., Arda H.E., Martinez N.J., Walhout A.J.. Gateway-compatible yeast one-hybrid screens. CSH Protoc. 2006; 2006:doi:10.1101/pdb.prot4590. [DOI] [PubMed] [Google Scholar]
- 20. Orchard S., Ammari M., Aranda B., Breuza L., Briganti L., Broackes-Carter F., Campbell N.H., Chavali G., Chen C., del-Toro N. et al.. The MIntAct project–IntAct as a common curation platform for 11 molecular interaction databases. Nucleic Acids Res. 2014; 42:D358–D363. [DOI] [PMC free article] [PubMed] [Google Scholar]
- 21. Weirauch M.T., Yang A., Albu M., Cote A.G., Montenegro-Montero A., Drewe P., Najafabadi H.S., Lambert S.A., Mann I., Cook K. et al.. Determination and inference of eukaryotic transcription factor sequence specificity. Cell. 2014; 158:1431–1443. [DOI] [PMC free article] [PubMed] [Google Scholar]
- 22. Touzet H., Varre J.S.. Efficient and accurate P-value computation for position weight matrices. Algorithms Mol Biol. 2007; 2:15. [DOI] [PMC free article] [PubMed] [Google Scholar]
- 23. Martinez N.J., Ow M.C., Barrasa M.I., Hammell M., Sequerra R., Doucette-Stamm L., Roth F.P., Ambros V.R., Walhout A.J.. A C. elegans genome-scale microRNA network contains composite feedback motifs with high flux capacity. Genes Dev. 2008; 22:2535–2549. [DOI] [PMC free article] [PubMed] [Google Scholar]
- 24. Fuxman Bass J.I., Diallo A., Nelson J., Soto J.M., Myers C.L., Walhout A.J.. Using networks to measure similarity between genes: association index selection. Nat. Methods. 2013; 10:1169–1176. [DOI] [PMC free article] [PubMed] [Google Scholar]
- 25. Herrero J., Muffato M., Beal K., Fitzgerald S., Gordon L., Pignatelli M., Vilella A.J., Searle S.M., Amode R., Brent S. et al.. Ensembl comparative genomics resources. Database (Oxford). 2016; 2016:bav096. [DOI] [PMC free article] [PubMed] [Google Scholar]
- 26. Atianand M.K., Hu W., Satpathy A.T., Shen Y., Ricci E.P., Alvarez-Dominguez J.R., Bhatta A., Schattgen S.A., McGowan J.D., Blin J. et al.. A long noncoding RNA lincRNA-EPS acts as a transcriptional brake to restrain inflammation. Cell. 2016; 165:1672–1685. [DOI] [PMC free article] [PubMed] [Google Scholar]
- 27. Becnel L.B., Ochsner S.A., Darlington Y.F., McOwiti A., Kankanamge W.H., Dehart M., Naumov A., McKenna N.J.. Discovering relationships between nuclear receptor signaling pathways, genes, and tissues in Transcriptomine. Sci. Signal. 2017; 10:eaah6275. [DOI] [PubMed] [Google Scholar]
- 28. Pinero J., Bravo A., Queralt-Rosinach N., Gutierrez-Sacristan A., Deu-Pons J., Centeno E., Garcia-Garcia J., Sanz F., Furlong L.I.. DisGeNET: a comprehensive platform integrating information on human disease-associated genes and variants. Nucleic Acids Res. 2017; 45:D833–D839. [DOI] [PMC free article] [PubMed] [Google Scholar]
- 29. Suppli M.P., Rigbolt K.T.G., Veidal S.S., Heeboll S., Eriksen P.L., Demant M., Bagger J.I., Nielsen J.C., Oro D., Thrane S.W. et al.. Hepatic transcriptome signatures in patients with varying degrees of nonalcoholic fatty liver disease compared with healthy normal-weight individuals. Am. J. Physiol. Gastrointest. Liver Physiol. 2019; 316:G462–G472. [DOI] [PubMed] [Google Scholar]
- 30. Dobin A., Davis C.A., Schlesinger F., Drenkow J., Zaleski C., Jha S., Batut P., Chaisson M., Gingeras T.R.. STAR: ultrafast universal RNA-seq aligner. Bioinformatics. 2013; 29:15–21. [DOI] [PMC free article] [PubMed] [Google Scholar]
- 31. Liao Y., Smyth G.K., Shi W.. featureCounts: an efficient general purpose program for assigning sequence reads to genomic features. Bioinformatics. 2014; 30:923–930. [DOI] [PubMed] [Google Scholar]
- 32. Yoshida H., Lareau C.A., Ramirez R.N., Rose S.A., Maier B., Wroblewska A., Desland F., Chudnovskiy A., Mortha A., Dominguez C. et al.. The cis-regulatory atlas of the mouse immune system. Cell. 2019; 176:897–912. [DOI] [PMC free article] [PubMed] [Google Scholar]
- 33. Gal-Oz S.T., Maier B., Yoshida H., Seddu K., Elbaz N., Czysz C., Zuk O., Stranger B.E., Ner-Gaon H., Shay T.. ImmGen report: sexual dimorphism in the immune system transcriptome. Nat. Commun. 2019; 10:4295. [DOI] [PMC free article] [PubMed] [Google Scholar]
- 34. Love M.I., Huber W., Anders S.. Moderated estimation of fold change and dispersion for RNA-seq data with DESeq2. Genome Biol. 2014; 15:550. [DOI] [PMC free article] [PubMed] [Google Scholar]
- 35. Zhu A., Ibrahim J.G., Love M.I.. Heavy-tailed prior distributions for sequence count data: removing the noise and preserving large differences. Bioinformatics. 2019; 35:2084–2092. [DOI] [PMC free article] [PubMed] [Google Scholar]
- 36. Martin J.C., Chang C., Boschetti G., Ungaro R., Giri M., Grout J.A., Gettler K., Chuang L.S., Nayar S., Greenstein A.J. et al.. Single-cell analysis of Crohn's disease lesions identifies a pathogenic cellular module associated with resistance to anti-TNF therapy. Cell. 2019; 178:1493–1508. [DOI] [PMC free article] [PubMed] [Google Scholar]
- 37. Pellin D., Loperfido M., Baricordi C., Wolock S.L., Montepeloso A., Weinberg O.K., Biffi A., Klein A.M., Biasco L.. A comprehensive single cell transcriptional landscape of human hematopoietic progenitors. Nat. Commun. 2019; 10:2395. [DOI] [PMC free article] [PubMed] [Google Scholar]
- 38. Butler A., Hoffman P., Smibert P., Papalexi E., Satija R.. Integrating single-cell transcriptomic data across different conditions, technologies, and species. Nat. Biotechnol. 2018; 36:411–420. [DOI] [PMC free article] [PubMed] [Google Scholar]
- 39. Finak G., McDavid A., Yajima M., Deng J., Gersuk V., Shalek A.K., Slichter C.K., Miller H.W., McElrath M.J., Prlic M. et al.. MAST: a flexible statistical framework for assessing transcriptional changes and characterizing heterogeneity in single-cell RNA sequencing data. Genome Biol. 2015; 16:278. [DOI] [PMC free article] [PubMed] [Google Scholar]
- 40. Trapnell C., Cacchiarelli D., Grimsby J., Pokharel P., Li S., Morse M., Lennon N.J., Livak K.J., Mikkelsen T.S., Rinn J.L.. The dynamics and regulators of cell fate decisions are revealed by pseudotemporal ordering of single cells. Nat. Biotechnol. 2014; 32:381–386. [DOI] [PMC free article] [PubMed] [Google Scholar]
- 41. Lee E.J., Kwon J.E., Park M.J., Jung K.A., Kim D.S., Kim E.K., Lee S.H., Choi J.Y., Park S.H., Cho M.L.. Ursodeoxycholic acid attenuates experimental autoimmune arthritis by targeting Th17 and inducing pAMPK and transcriptional corepressor SMILE. Immunol. Lett. 2017; 188:1–8. [DOI] [PubMed] [Google Scholar]
- 42. Takeuchi H., Yokota-Nakatsuma A., Ohoka Y., Kagechika H., Kato C., Song S.Y., Iwata M.. Retinoid X receptor agonists modulate Foxp3(+) regulatory T cell and Th17 cell differentiation with differential dependence on retinoic acid receptor activation. J. Immunol. 2013; 191:3725–3733. [DOI] [PubMed] [Google Scholar]
- 43. Willis S.N., Tellier J., Liao Y., Trezise S., Light A., O’Donnell K., Garrett-Sinha L.A., Shi W., Tarlinton D.M., Nutt S.L.. Environmental sensing by mature B cells is controlled by the transcription factors PU.1 and SpiB. Nat. Commun. 2017; 8:1426. [DOI] [PMC free article] [PubMed] [Google Scholar]
- 44. Schweitzer B.L., Huang K.J., Kamath M.B., Emelyanov A.V., Birshtein B.K., DeKoter R.P.. Spi-C has opposing effects to PU.1 on gene expression in progenitor B cells. J. Immunol. 2006; 177:2195–2207. [DOI] [PubMed] [Google Scholar]
- 45. Li S.K., Solomon L.A., Fulkerson P.C., DeKoter R.P.. Identification of a negative regulatory role for spi-C in the murine B cell lineage. J. Immunol. 2015; 194:3798–3807. [DOI] [PubMed] [Google Scholar]
- 46. Kohyama M., Ise W., Edelson B.T., Wilker P.R., Hildner K., Mejia C., Frazier W.A., Murphy T.L., Murphy K.M.. Role for Spi-C in the development of red pulp macrophages and splenic iron homeostasis. Nature. 2009; 457:318–321. [DOI] [PMC free article] [PubMed] [Google Scholar]
- 47. Haldar M., Kohyama M., So A.Y., Kc W., Wu X., Briseno C.G., Satpathy A.T., Kretzer N.M., Arase H., Rajasekaran N.S. et al.. Heme-mediated SPI-C induction promotes monocyte differentiation into iron-recycling macrophages. Cell. 2014; 156:1223–1234. [DOI] [PMC free article] [PubMed] [Google Scholar]
- 48. Uhlen M., Fagerberg L., Hallstrom B.M., Lindskog C., Oksvold P., Mardinoglu A., Sivertsson A., Kampf C., Sjostedt E., Asplund A. et al.. Proteomics. Tissue-based map of the human proteome. Science. 2015; 347:1260419. [DOI] [PubMed] [Google Scholar]
- 49. Kazankov K., Jorgensen S.M.D., Thomsen K.L., Moller H.J., Vilstrup H., George J., Schuppan D., Gronbaek H.. The role of macrophages in nonalcoholic fatty liver disease and nonalcoholic steatohepatitis. Nat. Rev. Gastroenterol. Hepatol. 2019; 16:145–159. [DOI] [PubMed] [Google Scholar]
- 50. Hwang J., Son K.N., Kim C.W., Ko J., Na D.S., Kwon B.S., Gho Y.S., Kim J.. Human CC chemokine CCL23, a ligand for CCR1, induces endothelial cell migration and promotes angiogenesis. Cytokine. 2005; 30:254–263. [DOI] [PubMed] [Google Scholar]
- 51. Hart K.M., Fabre T., Sciurba J.C., Gieseck R.L. 3rd, Borthwick L.A., Vannella K.M., Acciani T.H., de Queiroz Prado R., Thompson R.W., White S. et al.. Type 2 immunity is protective in metabolic disease but exacerbates NAFLD collaboratively with TGF-beta. Sci. Transl. Med. 2017; 9:eaal3694. [DOI] [PubMed] [Google Scholar]
- 52. Forssmann U., Delgado M.B., Uguccioni M., Loetscher P., Garotta G., Baggiolini M.. CKbeta8, a novel CC chemokine that predominantly acts on monocytes. FEBS Lett. 1997; 408:211–216. [DOI] [PubMed] [Google Scholar]
- 53. Rao A., Luo C., Hogan P.G.. Transcription factors of the NFAT family: regulation and function. Annu. Rev. Immunol. 1997; 15:707–747. [DOI] [PubMed] [Google Scholar]
- 54. Zhang Z., Burch P.E., Cooney A.J., Lanz R.B., Pereira F.A., Wu J., Gibbs R.A., Weinstock G., Wheeler D.A.. Genomic analysis of the nuclear receptor family: new insights into structure, regulation, and evolution from the rat genome. Genome Res. 2004; 14:580–590. [DOI] [PMC free article] [PubMed] [Google Scholar]
- 55. Sever R., Glass C.K.. Signaling by nuclear receptors. Cold Spring Harb. Perspect. Biol. 2013; 5:a016709. [DOI] [PMC free article] [PubMed] [Google Scholar]
- 56. Ivanov I.I., McKenzie B.S., Zhou L., Tadokoro C.E., Lepelley A., Lafaille J.J., Cua D.J., Littman D.R.. The orphan nuclear receptor RORgammat directs the differentiation program of proinflammatory IL-17+ T helper cells. Cell. 2006; 126:1121–1133. [DOI] [PubMed] [Google Scholar]
- 57. Hermann-Kleiter N., Meisel M., Fresser F., Thuille N., Muller M., Roth L., Katopodis A., Baier G.. Nuclear orphan receptor NR2F6 directly antagonizes NFAT and RORgammat binding to the Il17a promoter. J. Autoimmun. 2012; 39:428–440. [DOI] [PMC free article] [PubMed] [Google Scholar]
- 58. Jiang C., Ting A.T., Seed B.. PPAR-gamma agonists inhibit production of monocyte inflammatory cytokines. Nature. 1998; 391:82–86. [DOI] [PubMed] [Google Scholar]
- 59. Willson T.M., Kliewer S.A.. PXR, CAR and drug metabolism. Nat. Rev. Drug Discov. 2002; 1:259–266. [DOI] [PubMed] [Google Scholar]
- 60. Wang S., Lei T., Zhang K., Zhao W., Fang L., Lai B., Han J., Xiao L., Wang N.. Xenobiotic pregnane X receptor (PXR) regulates innate immunity via activation of NLRP3 inflammasome in vascular endothelial cells. J. Biol. Chem. 2014; 289:30075–30081. [DOI] [PMC free article] [PubMed] [Google Scholar]
- 61. Dubrac S., Elentner A., Ebner S., Horejs-Hoeck J., Schmuth M.. Modulation of T lymphocyte function by the pregnane X receptor. J. Immunol. 2010; 184:2949–2957. [DOI] [PubMed] [Google Scholar]
- 62. Cheng J., Shah Y.M., Gonzalez F.J.. Pregnane X receptor as a target for treatment of inflammatory bowel disorders. Trends Pharmacol. Sci. 2012; 33:323–330. [DOI] [PMC free article] [PubMed] [Google Scholar]
- 63. Nunez V., Alameda D., Rico D., Mota R., Gonzalo P., Cedenilla M., Fischer T., Bosca L., Glass C.K., Arroyo A.G. et al.. Retinoid X receptor alpha controls innate inflammatory responses through the up-regulation of chemokine expression. Proc. Natl. Acad. Sci. U.S.A. 2010; 107:10626–10631. [DOI] [PMC free article] [PubMed] [Google Scholar]
- 64. Ma F., Liu S.Y., Razani B., Arora N., Li B., Kagechika H., Tontonoz P., Nunez V., Ricote M., Cheng G.. Retinoid X receptor alpha attenuates host antiviral response by suppressing type I interferon. Nat. Commun. 2014; 5:5494. [DOI] [PMC free article] [PubMed] [Google Scholar]
- 65. Roszer T., Menendez-Gutierrez M.P., Lefterova M.I., Alameda D., Nunez V., Lazar M.A., Fischer T., Ricote M.. Autoimmune kidney disease and impaired engulfment of apoptotic cells in mice with macrophage peroxisome proliferator-activated receptor gamma or retinoid X receptor alpha deficiency. J. Immunol. 2011; 186:621–631. [DOI] [PMC free article] [PubMed] [Google Scholar]
- 66. Li X., Large M.J., Creighton C.J., Lanz R.B., Jeong J.W., Young S.L., Lessey B.A., Palomino W.A., Tsai S.Y., Demayo F.J.. COUP-TFII regulates human endometrial stromal genes involved in inflammation. Mol. Endocrinol. 2013; 27:2041–2054. [DOI] [PMC free article] [PubMed] [Google Scholar]
- 67. Schett G., Elewaut D., McInnes I.B., Dayer J.M., Neurath M.F.. How cytokine networks fuel inflammation: toward a cytokine-based disease taxonomy. Nat. Med. 2013; 19:822–824. [DOI] [PubMed] [Google Scholar]
- 68. Sonoda J., Pei L., Evans R.M.. Nuclear receptors: decoding metabolic disease. FEBS Lett. 2008; 582:2–9. [DOI] [PMC free article] [PubMed] [Google Scholar]
- 69. Neumann C., Scheffold A., Rutz S.. Functions and regulation of T cell-derived interleukin-10. Semin. Immunol. 2019; 44:101344. [DOI] [PubMed] [Google Scholar]
- 70. Roszer T. Understanding the mysterious M2 macrophage through activation markers and effector mechanisms. Mediators Inflamm. 2015; 2015:816460. [DOI] [PMC free article] [PubMed] [Google Scholar]
- 71. Schildberger A., Rossmanith E., Eichhorn T., Strassl K., Weber V.. Monocytes, peripheral blood mononuclear cells, and THP-1 cells exhibit different cytokine expression patterns following stimulation with lipopolysaccharide. Mediators Inflamm. 2013; 2013:697972. [DOI] [PMC free article] [PubMed] [Google Scholar]
- 72. Barnes P.J., Karin M.. Nuclear factor-kappaB: a pivotal transcription factor in chronic inflammatory diseases. N. Engl. J. Med. 1997; 336:1066–1071. [DOI] [PubMed] [Google Scholar]
- 73. Venken K., Jacques P., Mortier C., Labadia M.E., Decruy T., Coudenys J., Hoyt K., Wayne A.L., Hughes R., Turner M. et al.. RORgammat inhibition selectively targets IL-17 producing iNKT and gammadelta-T cells enriched in Spondyloarthritis patients. Nat. Commun. 2019; 10:9. [DOI] [PMC free article] [PubMed] [Google Scholar]
- 74. Spooner C.J., Lesch J., Yan D., Khan A.A., Abbas A., Ramirez-Carrozzi V., Zhou M., Soriano R., Eastham-Anderson J., Diehl L. et al.. Specification of type 2 innate lymphocytes by the transcriptional determinant Gfi1. Nat. Immunol. 2013; 14:1229–1236. [DOI] [PubMed] [Google Scholar]
- 75. Neurath M.F. Cytokines in inflammatory bowel disease. Nat. Rev. Immunol. 2014; 14:329–342. [DOI] [PubMed] [Google Scholar]
- 76. Sawa S., Lochner M., Satoh-Takayama N., Dulauroy S., Berard M., Kleinschek M., Cua D., Di Santo J.P., Eberl G.. RORgammat+ innate lymphoid cells regulate intestinal homeostasis by integrating negative signals from the symbiotic microbiota. Nat. Immunol. 2011; 12:320–326. [DOI] [PubMed] [Google Scholar]
- 77. Gadaleta R.M., van Erpecum K.J., Oldenburg B., Willemsen E.C., Renooij W., Murzilli S., Klomp L.W., Siersema P.D., Schipper M.E., Danese S. et al.. Farnesoid X receptor activation inhibits inflammation and preserves the intestinal barrier in inflammatory bowel disease. Gut. 2011; 60:463–472. [DOI] [PubMed] [Google Scholar]
- 78. Brenner O., Levanon D., Negreanu V., Golubkov O., Fainaru O., Woolf E., Groner Y.. Loss of Runx3 function in leukocytes is associated with spontaneously developed colitis and gastric mucosal hyperplasia. Proc. Natl. Acad. Sci. U.S.A. 2004; 101:16016–16021. [DOI] [PMC free article] [PubMed] [Google Scholar]
- 79. Bossel Ben-Moshe N., Hen-Avivi S., Levitin N., Yehezkel D., Oosting M., Joosten L.A.B., Netea M.G., Avraham R.. Predicting bacterial infection outcomes using single cell RNA-sequencing analysis of human immune cells. Nat. Commun. 2019; 10:3266. [DOI] [PMC free article] [PubMed] [Google Scholar]
- 80. Obata Y., Takahashi D., Ebisawa M., Kakiguchi K., Yonemura S., Jinnohara T., Kanaya T., Fujimura Y., Ohmae M., Hase K. et al.. Epithelial cell-intrinsic Notch signaling plays an essential role in the maintenance of gut immune homeostasis. J. Immunol. 2012; 188:2427–2436. [DOI] [PubMed] [Google Scholar]
- 81. Singh U.P., Venkataraman C., Singh R., Lillard J.W. Jr. CXCR3 axis: role in inflammatory bowel disease and its therapeutic implication. Endocr. Metab. Immune Disord. Drug Targets. 2007; 7:111–123. [DOI] [PubMed] [Google Scholar]
- 82. Lacher M., Kappler R., Berkholz S., Baurecht H., von Schweinitz D., Koletzko S.. Association of a CXCL9 polymorphism with pediatric Crohn's disease. Biochem. Biophys. Res. Commun. 2007; 363:701–707. [DOI] [PubMed] [Google Scholar]
- 83. Ansel K.M., Djuretic I., Tanasa B., Rao A.. Regulation of Th2 differentiation and Il4 locus accessibility. Annu. Rev. Immunol. 2006; 24:607–656. [DOI] [PubMed] [Google Scholar]
- 84. Lee C.M., Gupta S., Parodo J., Wu J., Marshall J.C., Hu J.. The uncovering of ESE-1 in human neutrophils: implication of its role in neutrophil function and survival. Genes Immun. 2015; 16:356–361. [DOI] [PubMed] [Google Scholar]
- 85. Zhang S., Yu N., Wang L., Liu Y., Kong Y., Liu J., Xie Y.. Prox1 represses IL-2 gene expression by interacting with NFAT2. Oncotarget. 2017; 8:69422–69434. [DOI] [PMC free article] [PubMed] [Google Scholar]
- 86. Best J.A., Blair D.A., Knell J., Yang E., Mayya V., Doedens A., Dustin M.L., Goldrath A.W. Immunological Genome Project, C . Transcriptional insights into the CD8(+) T cell response to infection and memory T cell formation. Nat. Immunol. 2013; 14:404–412. [DOI] [PMC free article] [PubMed] [Google Scholar]
- 87. Cao Z., Ding B.S., Guo P., Lee S.B., Butler J.M., Casey S.C., Simons M., Tam W., Felsher D.W., Shido K. et al.. Angiocrine factors deployed by tumor vascular niche induce B cell lymphoma invasiveness and chemoresistance. Cancer Cell. 2014; 25:350–365. [DOI] [PMC free article] [PubMed] [Google Scholar]
- 88. Rich B.E., Campos-Torres J., Tepper R.I., Moreadith R.W., Leder P.. Cutaneous lymphoproliferation and lymphomas in interleukin 7 transgenic mice. J. Exp. Med. 1993; 177:305–316. [DOI] [PMC free article] [PubMed] [Google Scholar]
- 89. Sewell J.A., Fuxman Bass J.I.. Options and considerations when using a yeast one-hybrid system. Methods Mol. Biol. 2018; 1794:119–130. [DOI] [PubMed] [Google Scholar]
- 90. Smale S.T., Tarakhovsky A., Natoli G.. Chromatin contributions to the regulation of innate immunity. Annu. Rev. Immunol. 2014; 32:489–511. [DOI] [PubMed] [Google Scholar]
- 91. Wishart D.S., Feunang Y.D., Guo A.C., Lo E.J., Marcu A., Grant J.R., Sajed T., Johnson D., Li C., Sayeeda Z. et al.. DrugBank 5.0: a major update to the DrugBank database for 2018. Nucleic Acids Res. 2018; 46:D1074–D1082. [DOI] [PMC free article] [PubMed] [Google Scholar]
Associated Data
This section collects any data citations, data availability statements, or supplementary materials included in this article.