

Abstract
PURPOSE
To identify components of the patient-centered medical home (PCMH) model of care that are associated with lower spending and utilization among Medicare beneficiaries.
METHODS
Regression analyses of changes in outcomes for Medicare beneficiaries in practices that engaged in particular PCMH activities compared with beneficiaries in practices that did not. We analyzed claims for 302,719 Medicare fee-for-service beneficiaries linked to PCMH surveys completed by 394 practices in the Centers for Medicare & Medicaid Services’ 8-state Multi-Payer Advanced Primary Care Practice demonstration.
RESULTS
Six activities were associated with lower spending or utilization. Use of a registry to identify and remind patients due for preventive services was associated with all 4 of our outcome measures: total spending was $69.77 less per beneficiary per month (PBPM) (P = 0.00); acute-care hospital spending was $36.62 less PBPM (P = 0.00); there were 6.78 fewer hospital admissions per 1,000 beneficiaries per quarter (P1KBPQ) (P = 0.003); and 11.05 fewer emergency department (ED) visits P1KBPQ (P = 0.05). Using a patient registry for pre-visit planning and clinician reminders was associated with $29.31 lower total spending PBPM (P = 0.05). Engaging patients with chronic conditions in goal setting and action planning was associated with 4.62 fewer hospital admissions P1KBPQ (P = 0.01) and 11.53 fewer ED visits P1KBPQ (P = 0.00). Monitoring patients during hospital stays was associated with $22.06 lower hospital spending PBPM (P = 0.03). Developing referral protocols with commonly referred-to clinicians was associated with 11.62 fewer ED visits P1KBPQ (P = 0.00). Using quality improvement approaches was associated with 13.47 fewer ED visits P1KBPQ (P =0.00).
CONCLUSIONS
Practices seeking to deliver more efficient care may benefit from implementing these 6 activities.
Key words: Medicare, patient-centered care, primary health care
INTRODUCTION
Patient-centered medical home (PCMH) models include numerous activities. For example, the National Committee for Quality Assurance (NCQA)’s PCMH standards include 100 different expectations.1 Since PCMH accreditors typically only require practices to implement a minimum percentage of the PCMH standards, one practice that has adopted a PCMH model can look very different from another practice that has adopted the same PCMH model2; as one researcher has put it, “If you have seen one medical home, you have seen one medical home.”3 This variation in the care delivery models being implemented by practices may help explain the mixed findings generated by evaluations of PCMH efforts so far, which have led some researchers to call for studies to shift from thinking of the PCMH model as an “on-off switch”3—a model that has either been implemented or not—to identifying the components of the PCMH model that have actually been implemented and are having the biggest impact on outcomes.4,5
Some researchers have begun to explore this—isolating relationships between particular PCMH capabilities and outcomes for veterans,6,7 persons with diabetes,8-10 veterans with diabetes,11 persons with diabetes served by safety-net clinics,12 and children with chronic conditions.13,14 Studies have also looked at different health care settings, such as federally qualified health centers15-17 and NCQA Level 3 PCMHs in Minnesota.18 A few studies have focused on impacts on Medicare beneficiaries.19,20
To add to this nascent evidence base, this study identifies the relationship between specific PCMH activities and Medicare spending and utilization for 302,719 Medicare beneficiaries served by 394 practices that were recognized as PCMHs in 8 states. These patients and practices were selected because it was possible to obtain standardized PCMH provider survey data and Medicare claims data from them at a consistent point in time, through the evaluation of the Centers for Medicare & Medicaid Services’ Multi-Payer Advanced Primary Care Practice (MAPCP) Demonstration—which these practices and beneficiaries all participated in.
The MAPCP Demonstration was a multi-payer PCMH initiative set in Maine, Michigan, Minnesota, New York, North Carolina, Pennsylvania, Rhode Island, and Vermont—starting in July 2011, September 2011, or January 2012. Participating primary care practices became certified as PCMHs (using NCQA’s standards and/or state-specific standards) and received new monthly payments from fee-for-service Medicare, Medicaid (both fee-for-service programs and managed care plans), and participating private payers. Practices also received technical assistance (ie, learning collaboratives, coaching) and data reports.
Demonstration payments were intended to help practices pay for improvements like new care coordinators, expanded office hours, after-hours phone lines, or enhanced electronic medical records. Other organizations that supported or supplemented the care delivered by these practices also received demonstration payments in 5 states (eg, community health teams in Vermont, which provided care coordination and other supportive services to practices’ patients). Although states designed their own payment models, Medicare payments for practices and other organizations were capped at $10 per beneficiary per month (PBPM) on average. Medicaid and private payers were expected to use a similar payment model for their enrollees. Details on states’ payment models and PCMH requirements appear in the demonstration’s final evaluation report, in Section 3.3.21
We analyzed the first three years of each state’s participation in the demonstration, which varied by state but generally refers to the second-half of 2011 through the second-half of 2014.
METHODS
An online survey was fielded in early 2015, shortly after the end of the third year of the MAPCP Demonstration. A hyperlink to the online survey was e-mailed to the demonstration point-of-contact at each practice with instructions to forward the link to the practice’s physicians, nurse practitioners, and physician assistants. The survey (available in Appendix U of the MAPCP Demonstration report22) asked clinicians to identify which of 3 answer options best reflected the activities their practice engaged in for each of 23 PCMH topics (see Figure 1 for a sample survey question). The survey was adapted from an instrument used in the evaluation of the Centers for Medicare & Medicaid Services’ Comprehensive Primary Care Initiative,23 which had been adapted from the MacColl Center for Health Care Innovation’s PCMH-A survey instrument.24 Our study compares the outcomes of Medicare beneficiaries served by practices that reported engaging in the most advanced set of activities for a given PCMH expectation (ie, a score of 7-9 in Figure 1) relative to beneficiaries served by practices that selected a less-advanced answer option (ie, a score of 1-6 in Figure 1). This survey was approved or deemed exempt by all relevant Institutional Review Boards.
Figure 1.

Example question from the MAPCP Demonstration PCMH clinician survey.
MAPCP = Multi-Payer Advanced Primary Care Practice; PCMH = patient-centered medical home.
All 975 practices active in the MAPCP Demonstration at the end of 2014 were surveyed. At least 1 clinician from 522 practices completed the survey (54% response rate). The characteristics of nonresponding practices were similar to responding practices, although nonrespondents were more likely to work in larger practices (with an average of 87.7 clinicians, as opposed to 48.5). Nonrespondents were also 6.4 percentage points less likely to have participated in a pre-demonstration PCMH initiative. Some of the characteristics of the counties that practices operated in also varied slightly (see Section V.3 of the demonstration report appendix22).
For the analyses described in this article, we restricted our dataset to surveys that had responses to all 22 of our PCMH questions of interest (we did not use responses to a 23rd question about electronic health record use that exhibited insufficient variation). We averaged responses received from more than 1 clinician within the same practice. We also dropped responses from practices that did not have attributed Medicare beneficiaries with at least 3 months of participation in the demonstration (which were mostly pediatric practices), yielding surveys from a total of 394 practices (40% of all MAPCP practices).
We merged clinician survey data with Medicare fee-for-service claims data for the Medicare beneficiaries attributed to the 394 practices. Claims data included services rendered during a baseline period that started 5.5 years prior to states’ initiatives, which encompassed time before PCMH initiatives began, and the first 3 years of the MAPCP Demonstration. Beneficiaries’ claims were included in our analyses if the beneficiary was: alive, covered by fee-for-service Medicare as their primary payer, enrolled in Medicare Parts A and B, and attributed to a practice for at least 3 months during the demonstration period using algorithms developed by each state (see Appendix B of the demonstration report22).
Earlier in our study, we also requested permission from demonstration practices to access their PCMH scoring data from organizations that had certified them as being PCMHs (eg, NCQA), but ultimately did not receive signed releases from a sufficient number of practices to use such data sources for our analysis.
Measures
The claims-based outcome measures used in our analyses are: total health care spending; acute-care hospital spending; rate of all-cause hospital admissions; and rate of emergency department (ED) visits not leading to a hospitalization. Our total spending measure includes Medicare Parts A and B spending (including inpatient, hospital outpatient, physician, skilled nursing facility, home health agency, hospice, and durable medical equipment claims), but it excludes demonstration fees practices received from Medicare and Part D drug spending.
The main independent variables in our analyses indicate whether a practice engaged in the most advanced activity for a given PCMH expectation or not.
Statistical Analysis
We ran regression models that compared the change in quarterly spending or utilization between the pre-demonstration baseline period and the third year of the demonstration for PCMH practices that engaged in a specific activity relative to PCMH practices that did not. We focused on the third year because we expected practices to improve their mastery of a PCMH activity over time, and we fielded our practice survey shortly after the third year of the demonstration. To account for differences in states’ demonstration start dates, quarters were defined relative to the start of a state’s demonstration, rather than a calendar quarter.
Our regression models controlled for baseline beneficiary-, practice-, and area-level characteristics. We controlled for beneficiaries’ age, race, sex, urban place of residence, Hierarchical Condition Category risk score, Charlson comorbidity score, original enrollment due to disability, enrollment due to end-stage renal disease, dual enrollment in Medicare and Medicaid, and residence in an institutionalized setting. We also controlled for whether a practice was a solo practitioner, whether it participated in a PCMH initiative prior to the demonstration, the proportion of its clinicians in primary care specialties, and whether it was a federally qualified health center, a rural health clinic, or an outpatient clinic of a critical access hospital. We also included variables identifying the median household income and the population density of the beneficiary’s county of residence. We included seasonal variables to control for seasonal variation in outcomes, because the quarter variables used in our model represent different calendar quarters depending on a state’s demonstration start date. State fixed effects were incorporated to account for state differences in outcomes that do not vary over time. The Supplemental Appendix for this article, available at https://www.AnnFamMed.org/content/18/6/503/suppl/DC1/, provides more detail on the regression model.
We used linear, ordinary least squares specifications to model spending outcomes, and a negative binomial version of the specification for utilization outcomes. Although expenditures typically violate the normal distribution assumption of ordinary least squares models, the linear model is easily interpretable and still produces unbiased estimates as long as errors are uncorrelated and have a constant variance. We controlled for potential error correlation and nonconstant variance by adjusting standard errors in all models for beneficiary clustering within practices. Observations were weighted by the beneficiary’s time in Medicare during the quarter. Since different numbers of Medicare beneficiaries participated in each of the 8 demonstration states (with a disproportionately large number of participants in Michigan), we also weighted the claims data so that each state’s contribution to our results was equalized. We report results that are significant at P = 0.05 or less.
We ran regression models for the 4 outcomes for each PCMH activity. We ran our regression models separately for each of the 22 PCMH activities studied to avoid inaccurate results that could have resulted from multi-collinearity among our PCMH variables. The large number of regressions (88) increases the likelihood of a significant finding occurring by chance. We used the Bonferroni correction, which adjusts the effective P value required for statistical significance, to reduce the chance of a false positive result. With 88 regressions, the effective P value is 0.0006 (0.05/88). The Bonferroni correction is a conservative adjustment and it increases the risk of false negative findings, particularly when there is a large number of comparisons. Therefore, we report statistical significance with and without the adjustment for multiple comparisons.
RESULTS
Characteristics of Study Population
Characteristics of the practices and Medicare beneficiaries in our analysis appear in Tables 1 and 2. Table 1 shows that practices tended to be large, office-based practices in metropolitan areas. Table 2 shows that Medicare beneficiaries were relatively young, with an average age of 68, and a quarter were under the age of 65. Two-thirds had no comorbidities and only 1% were institutionalized, but nearly one-third were disabled, and the group’s Hierarchical Condition Category score predicted that they would be 2% more costly than the average Medicare fee-for-service beneficiary. One-quarter were dually eligible for Medicare and Medicaid. The majority of the beneficiaries were White (88%), female (58%), and resided in an urban area (59%).
Table 1.
Characteristics of Practices in the Third Year of the MAPCP Demonstration
| Characteristics | Value |
|---|---|
| Number of practices, No. | 394 |
| Number of clinicians, No. | 19,456 |
| Number of clinicians per practice, mean | 49.38 |
| Number of clinicians per practice, median | 19 |
| Practice type, % | |
| Office-based practice | 79.44 |
| Federally qualified health centera | 11.42 |
| Critical access hospital outpatient clinicb | 2.54 |
| Rural health clinicc | 6.60 |
| Location of practices’ attributed Medicare beneficiaries,d % | |
| Metropolitan | 69.06 |
| Micropolitane | 15.10 |
| Rural | 15.84 |
MAPCP = Multi-Payer Advanced Primary Care Practice.
Federally qualified health centers serve an underserved area or population, offer a sliding fee scale, provide comprehensive services (including dental, mental health, substance abuse, and transportation services), have an ongoing quality assurance program, and have a governing board of directors.
Critical access hospitals are located in a rural area at least 35 miles away from another hospital, have no more than 25 inpatient beds, maintain an annual average length-of-stay of no more than 96 hours for acute inpatient care, and offer 24-hour/7-day-a-week emergency care.
Rural health clinics are located in rural areas that have health care shortage designations, and provide outpatient primary care services and basic laboratory services by a team that includes a mid-level clinician (eg, nurse practitioner, physician assistant, or certified nurse midwife).
Reflects the average percentage of attributed Medicare beneficiaries that reside in metropolitan, micropolitan, or rural areas among the 394 practices.
Micropolitan areas contain an urban core of 10,000-49,999 people.
Table 2.
Characteristics of Medicare Fee-For-Service Beneficiaries in the Third Year of the MAPCP Demonstration, N = 302,719
| Characteristics | Value |
|---|---|
| Demographicsa | |
| Age, %, y | |
| <65 | 24.76 |
| 65-75 | 44.28 |
| 76-85 | 21.84 |
| >85 | 9.13 |
| Age, mean, y | 68.44 |
| White race, % | 88.18 |
| Urban place of residence, % | 59.04 |
| Female, % | 57.70 |
| Dually eligible for Medicare and Medicaid, % | 27.14 |
| Disabled, % | 31.77 |
| End-stage renal disease, % | 0.81 |
| Institutionalized, % | 0.96 |
| Health statusa | |
| Hierarchical Condition Categoryb score, mean | 1.02 |
| Low risk (< .48), % | 24.87 |
| Medium risk (0.48-1.25), % | 51.96 |
| High risk (>1.25), % | 23.17 |
| Charlson comorbidity indexc score, mean | 0.76 |
| Low (= 0), % | 64.72 |
| Medium (0 <1), % | 17.69 |
| High (>1), % | 17.59 |
MAPCP = Multi-Payer Advanced Primary Care Practice.
Demographic and health status characteristics calculated using the Medicare enrollment database and claims data for the 1-year period before a Medicare beneficiary was first attributed to a practice, after the start of the MAPCP Demonstration.
Hierarchical Condition Category scores use demographic information (age, sex, Medicaid dual eligibility, disability status) and major medical conditions in a base year to predict Medicare spending in the following year. A score of 1.02 means the Medicare beneficiaries in this group were predicted to be 2% more costly than the average Medicare fee-for-service beneficiary.
Charlson Comorbidity Index predicts patients’ mortality or higher health care utilization based on which of the 18 clinical conditions in the index a patient received medical care for in the year before their attribution to a practice. A score of 0 indicates that no comorbidities were found, while a higher score indicates a higher likelihood of mortality or higher health care utilization.
Association Between PCMH Activities and Spending and Utilization
We found 6 PCMH activities to be associated with at least 1 of our outcome measures at P <.05 (Table 3). After correcting for multiple comparisons, 4 PCMH activities were associated with at least 1 outcome measure.
Table 3.
PCMH Activities Associated With Slower Growth in Spending and Utilization From the Baseline Period to the 3rd Year of the MAPCP Demonstration
| PCMH Activity | Total Health Care Expenditures PBPM ($) | Acute-Care Hospital Expenditures PBPM ($) | All-Cause Hospital Admissions Ratea | ED Visit Ratea |
|---|---|---|---|---|
| Registries used to identify patients due for preventive services and patients reminded to schedule these visits | –69.77b,c (P = 0.000) |
–36.62b,c (P = 0.000) |
–6.78b (P = 0.003) |
–11.05b (P = 0.05) |
| Registries used for pre-visit planning, clinician reminders, patient out-reach, and population health monitoring across a comprehensive set of diseases and high-risk patients | –29.31b (P = 0.05) |
–11.64 (P = 0.13) |
–1.93 (P = 0.21) |
–5.49 (P = 0.18) |
| Practice staff, trained in patient education, engage patients with chronic conditions in goal setting and action planning, and ongoing support is available through individualized care or group interventions | –17.75 (P = 0.34) |
–14.13 (P = 0.09) |
–4.62b (P = 0.01) |
–11.53b,c (P = 0.000) |
| The practice monitors patients’ care during hospital and post-acute facility stays, and is involved as needed | –22.56 (P = 0.21) |
–22.06b (P = 0.03) |
–2.05 (P = 0.20) |
–4.99 (P = 0.22) |
| Relationships with commonly referred-to practices (eg, cardiology) are formalized with practice agreements and referral protocols | –16.57 (P = 0.28) |
–8.21 (P = 0.25) |
–2.10 (P = 0.25) |
–11.62b,c (P = 0.000) |
| Quality improvement activities are based on systematic approaches (eg, Plan-Do-Study-Act, tracking performance on quality measures) and used to meet organizational goals |
–7.83 (P = 0.71) |
–4.17 (P = 0.71) |
–0.20 (P = 0.94) |
–13.47b,c (P = 0.000) |
ED = emergency department; MAPCP = Multi-Payer Advanced Primary Care Practice; PBPM = per beneficiary per month; PCMH = patient-centered medical home.
Note: A negative value indicates slower growth in spending or utilization among beneficiaries served by practices that engaged in a particular PCMH activity relative to beneficiaries in practices that did not, which is considered a favorable outcome. A positive value indicates faster growth among beneficiaries served by practices that engaged in a particular PCMH activity relative to beneficiaries in practices that did not, which is an unfavorable outcome.
Utilization measures are the number of hospital admissions or the number of emergency department visits not leading to a hospitalization per 1,000 beneficiary quarters.
Statistically significant at the 95% confidence level without correction for multiple comparisons.
Statistically significant after correction for multiple comparisons.
The activity with the strongest association was using registries to identify patients due for preventive services (eg, cancer screenings) and then reminding those patients to schedule these services, which was associated with all 4 outcome measures. Practices that engaged in this activity had $69.77 lower total Medicare spending per beneficiary per month (PBPM) (P = 0.00) than practices that did not engage in this activity (significant after the Bonferroni correction). As a point of reference, the average spending in our 394 demonstration practices was $535.28 PBPM before the MAPCP Demonstration began. These practices also generated $36.62 less acute care hospital spending PBPM (P = 0.00) than other practices (significant after the Bonferroni correction). Before the demonstration, average spending on acute care was $176.28 PBPM. Practices that engaged in this activity generated 6.78 fewer hospital admissions per 1,000 beneficiaries per quarter (P1KBPQ) (P = 0.003) than practices that did not engage in this activity. Before the demonstration, practices’ patients had an average of 57.11 hospital admissions P1KBPQ. Finally, practices that engaged in this activity had 11.05 fewer ED visits P1KBPQ (P = 0.05). Before the demonstration, practice’s patients had an average of 124.77 ED visits P1KBPQ.
The other PCMH activity that was associated with lower total spending was using patient registries for pre-visit planning, provider reminders, patient outreach, and population health monitoring. Practices that engaged in this activity had $29.31 lower total spending PBPM (P =0.05).
Four other PCMH activities were not associated with lower total spending, but were associated with other outcomes.
Practices that engaged their patients with chronic conditions in patient goal setting and action planning generated less health care utilization than other practices: 11.53 fewer ED visits P1KBPQ (P = 0.00; significant after the Bonferroni correction); and 4.62 fewer hospital admissions P1KBPQ (P =0.01).
Practices in which clinicians monitored patients during hospital stays and became involved as needed had $22.06 lower acute care hospital spending PBPM (P = 0.03) than practices that did not do this.
Practices that agreed on referral protocols with commonly referred-to clinicians (eg, cardiologists) had 11.62 fewer ED visits P1KBPQ (P=0.00) than other practices (a significant finding after the Bonferroni correction).
Also, practices that used systematic quality improvement approaches had 13.47 fewer ED visits P1KBPQ (P = 0.00) than other practices (also significant after the Bonferroni correction).
The remaining 16 activities exhibited no relationship with spending or utilization (Table 4).
Table 4.
PCMH Activities Lacking Significant Differences in Spending and Utilization From the Baseline Period to the 3rd Year of the MAPCP Demonstration
| PCMH Activity | Total Health Care Expenditures PBPM ($) | Acute-Care Hospital Expenditures PBPM ($) | All-Cause Hospital Admissions Ratea | ED Visit Ratea |
|---|---|---|---|---|
| Appointment systems have the capacity for walk-ins or same-day visits | 7.34 (P = 0.79) |
5.76 (P = 0.60) |
–1.06 (P = 0.64) |
2.24 (P = 0.53) |
| Clinician/practice team has a system to triage patient problems through telephone or e-mail communications or face-to-face visits, with same-day visits usually available | 6.30 (P = 0.82) |
–1.37 (P = 0.92) |
–0.95 (P = 0.72) |
–1.54 (P = 0.73) |
| After-hours access to the practice team for urgent care is available by telephone, and in-person during some evenings or weekends; The practice also coordinates ED care, and follows-up with patients after ED visits | 3.53 (P = 0.80) |
–5.49 (P = 0.49) |
–0.69 (P = 0.67) |
0.50 (P = 0.90) |
| Alternate types of contact (e-mail, web portal, text message) are used in patient-practice communication, and responses are provided within a timely and consistent timeframe | 7.89 (P = 0.67) |
–7.37 (P = 0.44) |
–0.48 (P = 0.81) |
–7.66 (P = 0.06) |
| Tracking and follow-up with patients for important referrals is consistently done | –8.59 (P = 0.64) |
–5.97 (P = 0.50) |
2.21 (P = 0.41) |
0.67 (P = 0.83) |
| Patient referral information to specialists, hospitals, and other medical care providers is consistently transmitted by the practice | 14.09 (P = 0.62) |
5.47 (P = 0.75) |
–1.02 (P = 0.62) |
2.66 (P = 0.68) |
| Practices follow up with patients who have been referred to behavioral health supports or community-based resources (eg, social services) | 17.20 (P = 0.26) |
13.83 (P = 0.11) |
0.28 (P = 0.90) |
–2.86 (P = 0.46) |
| Follow-up with patients seen in the ED or hospital is done routinely after receiving notification from the ED or hospital | –31.05 (P = 0.16) |
–15.03 (P = 0.17) |
–1.65 (P = 0.37) |
–5.96 (P = 0.11) |
| Visit focus is organized around the reason for a patient’s visit, but with attention to ongoing chronic care and prevention needs | –16.67 (P = 0.42) |
–13.93 (P = 0.21) |
–1.93 (P = 0.36) |
–2.03 (P = 0.58) |
| Medication review for patients on multiple medications is done during care transitions, when patients receive new medications, and during all regularly scheduled visits | 11.51 (P = 0.48) |
–1.04 (P = 0.93) |
2.29 (P = 0.21) |
10.03 (P = 0.19) |
| Practice identifies complex patients who may benefit from clinical care management, and actively coordinates their care management with other clinicians and caregivers | –13.48 (P = 0.48) |
–2.89 (P = 0.76) |
–3.44 (P = 0.12) |
–10.14 (P = 0.13) |
| Tracking and follow-up with patients about test results is consistently done for all tests | –9.25 (P = 0.60) |
–16.94 (P = 0.09) |
–1.51 (P = 0.58) |
–5.41 (P = 0.32) |
| Care plans for patients with chronic conditions are recorded in patient medical records, used to guide care, and are given to the patient | –16.53 (P = 0.22) |
–9.65 (P = 0.17) |
–1.53 (P = 0.31) |
–0.64 (P = 0.84) |
| Assessing patient values and preferences (eg, for end-of-life care, role in decision-making) is done for all patients with significant health problems or who articulate values and preferences themselves | –15.92 (P = 0.28) |
–10.93 (P = 0.13) |
–0.28 (P = 0.85) |
–7.12 (P = 0.16) |
| Involving patients in shared decision-making is a priority and systematically done, through clinical decision aids, motivational interviewing, and/or teach-back techniques | 5.17 (P = 0.74) |
7.93 (P = 0.37) |
0.85 (P = 0.65) |
–5.54 (P = 0.12) |
| Feedback to the practice from patients is regularly and formally collected (eg, through a patient survey or focus group) and informally (eg, through specific patients’ concerns), and used to improve the practice | 0.46 (P = 0.97) |
2.67 (P = 0.75) |
1.00 (P = 0.63) |
–5.31 (P = 0.13) |
ED = emergency department; MAPCP = Multi-Payer Advanced Primary Care Practice; PBPM = per beneficiary per month; PCMH = patient-centered medical home.
Note: A negative value indicates slower growth in spending or utilization among beneficiaries served by practices that engaged in a particular PCMH activity relative to beneficiaries in practices that did not, which is considered a favorable outcome. A positive value indicates faster growth among beneficiaries served by practices that engaged in a particular PCMH activity relative to beneficiaries in practices that did not, which is an unfavorable outcome.
Utilization measures are the number of hospital admissions or the number of emergency department visits not leading to a hospitalization per 1,000 beneficiary quarters.
DISCUSSION
It is notable that the only 2 PCMH activities we found to be associated with lower total spending both involve using registries (to identify and remind patients about needed preventive services; and for pre-visit planning, reminders to clinicians, patient outreach, and population health monitoring). This suggests that using a proactive yet targeted approach to identify patients to focus additional attention may be a more efficient way to practice medicine than reactively treating medical problems once they become exacerbated enough to prompt patients to present for treatment.
Our finding that engaging patients with chronic conditions in goal setting and action planning generated fewer ED visits and hospital admissions suggests that taking the time to make sure these patients understand what they can do to manage or improve their health might keep them healthier and out of the hospital.
Two of our findings relate to obtaining and sharing medical records with other types of clinicians—suggesting that communication between clinicians may be worth prioritizing. Having more complete records could help specialists make more accurate diagnoses, and help primary care clinicians better manage patients’ care after they see a specialist, which could theoretically prevent the need for ED visits. And, allowing primary care clinicians to contribute knowledge of their patients by offering input to hospital clinicians during hospital stays could prevent unnecessary tests and produce more effective in-hospital treatment for patients.
Our finding that engaging in quality improvement activities generated fewer ED visits is surprising. It is possible that quality improvement activities might help a practice engage in a more consistent set of care processes, which could lead to fewer patients missing a needed service and ending up in the ED. Alternatively, it is possible that practices that are methodical and conscientious enough to engage in systematic quality improvement activities might carry these approaches over to the way they care for patients, and this unobserved characteristic might be keeping their patients healthy and out of the ED.
Our findings overlap with some studies mentioned earlier,8,13,14 yet each study has identified different subsets of PCMH activities being associated with favorable outcomes. One noteworthy finding from our study is that improving access to care—such as by talking to patients on the telephone or staying open nights or weekends—was not associated with lower spending or utilization. It is possible that in the MAPCP Demonstration, patients didn’t realize that practices had started to offer expanded access and did not avail themselves of it, or patients may have only used expanded access for non-urgent matters and may have continued to go to the hospital for the same types of issues as they had before—resulting in no impact on spending or utilization.
Our study has some limitations. First, it is possible that an unobserved characteristic, not included in our model (eg, the conscientiousness of a practice’s staff, their motivation for excellence), could be associated with decisions to engage in specific PCMH activities and health care utilization and spending patterns of patients. Second, our survey asked clinicians to self-report the PCMH activities they engaged in, which could not be independently validated. However, clinicians knew that their responses on our survey would be deidentified and have no bearing on their professional reputation, participation in the demonstration, or income, so they should have had no incentive to inflate their ratings. Even so, respondents may have overestimated how consistently they performed some activities. Third, we were unable to include Part D drug spending or demonstration fees in our analysis.
The 6 PCMH activities we found to be associated with spending and/or utilization (Figure 2) are a much more manageable number of activities to implement than the dozens of activities typically included in PCMH practice recognition standards. But, given the variation in findings across studies to date, additional research is needed to identify the subset of PCMH activities that consistently yield the greatest impacts.
Figure 2.
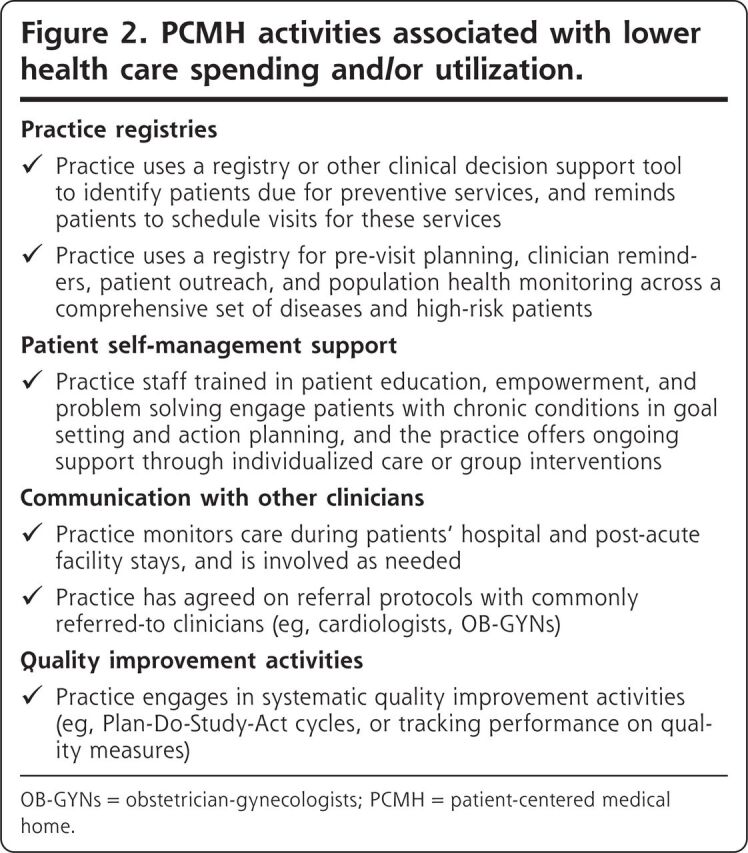
PCMH activities associated with lower health care spending and/or utilization.
OB-GYNs = obstetrician-gynecologists; PCMH = patient-centered medical home.
Figures and Tables
Supplementary Material
Acknowledgements
The authors thank Suzanne G. Wensky, PhD and Jody Blatt, MS at CMS for thoughtful feedback and suggestions throughout the evaluation of the MAPCP Demonstration.
Footnotes
Conflicts of interest: R.A.B. reports receiving an honorarium from the American Academy of Family Physicians for participating in a technical expert panel on the interaction between the patient-centered medical home and accountable care organization models. The other authors report none.
To read or post commentaries in response to this article, see it online at https://www.AnnFamMed.org/content/18/6/503.
Funding support: The Centers for Medicare and Medicaid Services (CMS) funded this work as part of the independent evaluation of the Multi-Payer Advanced Primary Care Practice (MAPCP) Demonstration, under contract #HHSM-500-2010-00021i.
Supplemental materials: Available at https://www.AnnFamMed.org/content/18/6/503/suppl/DC1/.
Contributor Information
Rachel A. Burton, The Urban Institute, Washington, DC.
Stephen Zuckerman, The Urban Institute, Washington, DC.
Susan G. Haber, RTI International, Waltham, Massachusetts.
Vincent Keyes, RTI International, Research Triangle Park, North Carolina.
References
- 1.Introduction to PCMH: foundational concepts of the medical home. National Committee for Quality Assurance; https://www.ncqa.org/wp-content/uploads/2018/12/20180329_Intro_to_PCMH_2017.pdf. Published Sep 13, 2018. Accessed Feb 17, 2019. [Google Scholar]
- 2.Phillips RS, Sullivan EE, Mayo-Smith MF.. The patient-centered medical home and the challenge of evaluating complex interventions. JAMA Netw Open. 2020;3(2):e1920827. [DOI] [PubMed] [Google Scholar]
- 3.Flieger SP. Impact of a patient-centered medical home pilot on utilization, quality, and costs and variation in medical homeness. J Ambul Care Manage. 2017;40(3):228-237. [DOI] [PMC free article] [PubMed] [Google Scholar]
- 4.Sinaiko AD, Landrum MB, Meyers DJ, et al. Synthesis of research on patient-centered medical homes brings systemic differences into relief. Health Aff (Millwood). 2017;36(3):500-508. [DOI] [PMC free article] [PubMed] [Google Scholar]
- 5.Nielsen M, Buelt L, Patel K, Nichols L.. The Patient-Centered Medical Home’s Impact on Cost and Quality: Annual Review of Evidence 2014-2015. Washington, DC: Patient-Centered Primary Care Collaborative; 2016. https://www.milbank.org/wp-content/files/documents/PCPCC_2016_Report.pdf. Published Feb 2016. Accessed Feb 14, 2019. [Google Scholar]
- 6.Yoon J, Rose DE, Canelo I, et al. Medical home features of VHA primary care clinics and avoidable hospitalizations. J Gen Intern Med. 2013;28(9):1188-1194. [DOI] [PMC free article] [PubMed] [Google Scholar]
- 7.Yoon J, Liu CF, Lo J, et al. Early changes in VA medical home components and utilization. Am J Manag Care. 2015;21(3):197-204. [PubMed] [Google Scholar]
- 8.Flottemesch TJ, Scholle SH, O’Connor PJ, Solberg LI, Asche S, Pawlson LG.. Are characteristics of the medical home associated with diabetes care costs? Med Care. 2012;50(8):676-684. [DOI] [PMC free article] [PubMed] [Google Scholar]
- 9.Stevens GD, Shi L, Vane C, Peters AL.. Do experiences consistent with a medical-home model improve diabetes care measures reported by adult Medicaid patients? Diabetes Care. 2014;37(9):2565-2571. [DOI] [PMC free article] [PubMed] [Google Scholar]
- 10.Bilello LA, Hall A, Harman J, et al. Key attributes of patient centered medical homes associated with patient activation of diabetes patients. BMC Fam Pract. 2018;19(1):4. [DOI] [PMC free article] [PubMed] [Google Scholar]
- 11.Meo N, Wong E, Sun H, et al. Elements of the Veterans Health Administration Patient-Centered Medical Home are associated with greater adherence to oral hypoglycemic agents in patients with diabetes. Popul Health Manag. 2018;21(2):116-122. [DOI] [PubMed] [Google Scholar]
- 12.Gunter KE, Nocon RS, Gao Y, Casalino LP, Chin MH.. Medical home characteristics and quality of diabetes care in safety net clinics. J Community Health. 2017;42(2):303-311. [DOI] [PMC free article] [PubMed] [Google Scholar]
- 13.Cooley WC, McAllister JW, Sherrieb K, Kuhlthau K.. Improved outcomes associated with medical home implementation in pediatric primary care. Pediatrics. 2009;124(1):358-364. [DOI] [PubMed] [Google Scholar]
- 14.Raphael JL, Rattler TL, Kowalkowski MA, Brousseau DC, Mueller BU, Giordano TP.. Association of care in a medical home and health care utilization among children with sickle cell disease. J Natl Med Assoc. 2013;105(2):157-165. [DOI] [PMC free article] [PubMed] [Google Scholar]
- 15.Shi L, Lock DC, Lee DC, et al. Patient-centered medical home capability and clinical performance in HRSA-supported health centers. Med Care. 2015;53(5):389-395. [DOI] [PMC free article] [PubMed] [Google Scholar]
- 16.Nocon RS, Sharma R, Birnberg JM, Ngo-Metzger Q, Lee SM, Chin MH.. Association between patient-centered medical home rating and operating cost at federally funded health centers. JAMA. 2012; 308(1):60-66. [DOI] [PMC free article] [PubMed] [Google Scholar]
- 17.Lebrun-Harris LA, Shi L, Zhu J, Burke MT, Sripipatana A, Ngo-Metzger Q.. Effects of patient-centered medical home attributes on patients’ perceptions of quality in federally supported health centers. Ann Fam Med. 2013;11(6):508-516. [DOI] [PMC free article] [PubMed] [Google Scholar]
- 18.Solberg LI, Asche SE, Fontaine P, Flottemesch TJ, Pawlson LG, Scholle SH.. Relationship of clinic medical home scores to quality and patient experience. J Ambul Care Manage. 2011;34(1):57-66. [DOI] [PubMed] [Google Scholar]
- 19.Stockbridge EL, Philpot LM, Pagán JA.. Patient-centered medical home features and expenditures by medicare beneficiaries. Am J Manag Care. 2014;20(5):379-385. [PubMed] [Google Scholar]
- 20.Peikes D, Anglin G, Dale S.. Evaluation of the Comprehensive Primary Care Initiative: Fourth Annual Report. Washington, DC: Mathematica Policy Research; 2018. https://downloads.cms.gov/files/cmmi/CPC-initiative-fourth-annual-report.pdf. Accessed Feb 17, 2019. [Google Scholar]
- 21.Nichols D, Haber S, Romaire M, et al. Evaluation of the Multi-Payer Advanced Primary Care Practice (MAPCP) Demonstration: Final Report. Baltimore, MD: Centers for Medicare & Medicaid Services (CMS); 2017. https://downloads.cms.gov/files/cmmi/mapcp-finalevalrpt.pdf. Accessed Apr 16, 2019. [Google Scholar]
- 22.Nichols D, Haber S, Romaire M, et al. Evaluation of the Multi-Payer Advanced Primary Care Practice (MAPCP) Demonstration: Final Report-Appendices. Baltimore, MD: Centers for Medicare & Medicaid Services (CMS); 2017. https://downloads.cms.gov/files/cmmi/mapcp-finalevalrpt-appendix.pdf. Accessed Apr 16, 2019. [Google Scholar]
- 23.Peikes D, Anglin G, Fries Taylor E, et al. Evaluation of the Comprehensive Primary Care Initiative: Third Annual Report. Baltimore, MD: Centers for Medicare & Medicaid Services (CMS); 2016. https://innovation.cms.gov/Files/reports/cpci-evalrpt3.pdf. Accessed Jul 16, 2018. [Google Scholar]
- 24.Patient-Centered Medical Home Assessment (PCMH-A). Seattle, WA: MacColl Center for Health Care Innovation; 2014. https://www.improvingchroniccare.org/downloads/pcmha.pdf. Accessed Jul 16, 2018. [Google Scholar]
Associated Data
This section collects any data citations, data availability statements, or supplementary materials included in this article.