Abstract
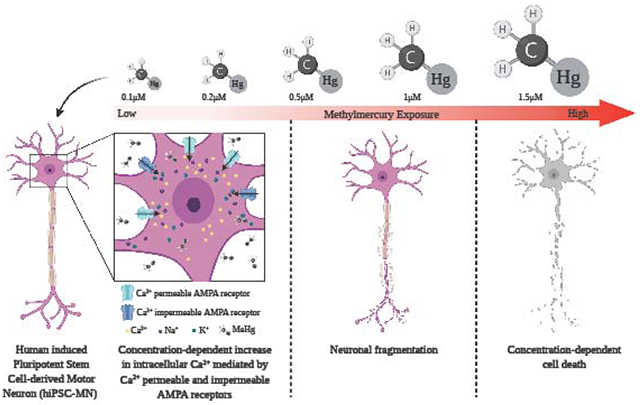
α motor neurons (MNs) are a target of the environmental neurotoxicant methylmercury (MeHg), accumulating MeHg and subsequently degenerating. In mouse spinal cord MN cultures, MeHg increased intracellular Ca2+ [Ca2+]i; the AMPA receptor (AMPAR) antagonist CNQX delayed the increase in [Ca2+]i, implicating the role of AMPARs in this response. Here we used human induced pluripotent stem cell-derived MNs (hiPSC-MNs), to characterize the role of MN AMPARs in MeHg neurotoxicity. Acute exposure to MeHg (0.1, 0.2, 0.5, 1 and 1.5 μM), fura-2 microfluorimetry, and a standard cytotoxicity assay, were used to examine MN regulation of [Ca2+]i, and cytotoxicity, respectively. Contribution of Ca2+-permeable and impermeable AMPARs was compared using either CNQX, or the Ca2+-permeable AMPAR antagonist N-acetyl spermine (NAS). MeHg-induced cytotoxicity was evaluated following a 24 hr delay subsequent to 1 hr exposure of hiPSC-MNs. MeHg caused a characteristic biphasic increase in [Ca2+]i, the onset of which was concentration-dependent; higher MeHg concentrations hastened onset of both phases. CNQX significantly delayed MeHg’s effect on onset time of both phases. In contrast, NAS significantly delayed only the 2nd phase increase in fura-2 fluorescence. Exposure to MeHg for 1 hr followed by a 24 hr recovery period caused a concentration-dependent incidence of cell death. These results demonstrate for the first time that hiPSC-derived MNs are highly sensitive to effects of MeHg on [Ca2+]i, and cytotoxicity, and that both Ca2+-permeable and impermeable AMPARs contribute the elevations in [Ca2+]i.
Graphical abstract
1. Introduction
Spinal motor neurons (MNs) regulate motor function as the final effector cells, thereby controlling both voluntary and involuntary (respiration) neuromuscular function. They exhibit unique characteristics such as long axons of large caliper (the length may exceed 1.5-2 meters in the lower limbs), with a significant volume of axoplasm to maintain (Kanning et al., 2010). Spinal MNs are activated by glutamatergic inputs from the upper motor cortex, and have extensive regulation, and both positive and negative feedback control in the ventral horn of the spinal cord. In view of their dependence on glutamate for activation, they contain both kainate/AMPA and N-methyl-D-aspartate (NMDA) type glutamate receptors. The AMPA receptors (AMPAR’s) are especially important, inasmuch as they have been demonstrated to be a principal source of Ca2+ entry during glutamate-induced excitation of MNs (Joshi et al., 2011). This feature is made more important by the fact that AMPARs have two properties affecting their Ca2+ permeability and conductance: RNA editing of the GluA2 subunit, and alternative splicing of the subunits. The first property affects the ratio of Na+/Ca2+permeability (Bettler and Mulle, 1995). The second property affects the desensitization of the receptor, thereby potentially prolonging the cationic influx. MNs lack significant levels of Ca2+ buffering proteins, such as calbindin (Ince et al., 1993; Laslo, Lipski, et al., 2000). This makes them especially vulnerable to Ca2+-mediated excitotoxicity, a pathway strongly implicated in their demise in the neurodegenerative disease amyotrophic lateral sclerosis (ALS) (Grosskreutz et al., 2010).
MNs are not typically considered as a target for environmental neurotoxicants, however several studies have reported that methylmercury (MeHg) and Hg disrupt MN function. MeHg can accumulate in murine α-MNs and cause their degeneration. This effect does not occur in medium or small-diameter MNs (Su et al., 1998). Another observation is that ataxia occurs when MNs accumulate MeHg (Møller-Madsen, 1990, 1991). While these studies have all demonstrated the ability of MeHg to induce MN toxicity, they shed no light on the mechanisms by which neurotoxicity occurred.
Only two studies have focused on characterizing the effects of MeHg on MNs or MN-like cells in vitro. The first study used NSC34 cells, which are a hybrid between mouse embryonic spinal cord MNs and neuroblastoma cells, and have been proposed as a surrogate model for spinal cord MNs (Cashman, Durham et al., 1992; Eggett, Crosier et al., 2000; Maier, Böhm et al., 2013). Exposures to mercuric chloride (HgCl2) and MeHg were made to identify their toxicity. The authors concluded that: 1) MeHg was more toxic than Hg (LD50 of 1.74 μM compared to Hg 7.95 μM), and 2) concentration-dependent incidence of cell death occurred after 48 hr of exposure to both mercurials (Chapman and Chan, 1999). A more recent study used primary cultures of MNs isolated from spinal cord of mice PND 4 - 7. The focus of this study was to identify if acute MeHg exposure led to alterations in intracellular Ca2+ ([Ca2+]i) and identify ion channels that could contribute to the observed alterations. Low concentrations (0.1 - 1.5 μM) of MeHg applied acutely (≤ 1 hr), to spinal cord MNs of mice altered [Ca2+]i. This effect was mediated in part by NMDA and AMPA-type glutamate receptors (Ramanathan and Atchison, 2011). Taken together these studies demonstrated that MNs degenerate after exposure to MeHg and this can be as a result of the observed alterations in [Ca2+]i that are mediated by ionotropic glutamate receptors. However, no further studies have characterized the role of the ionotropic glutamate receptors in MeHg-induced toxicity in MNs.
In the present study human induced pluripotent stem cell MNs (hiPSC-MNs), were used to characterize in more depth the ability of MeHg to disrupt [Ca2+]i regulation. We focused on the role of AMPA-type glutamate receptors in MeHg-induced toxicity in MNs because they have been implicated in glutamate-mediated excitotoxicity in MNs.
2. Materials and Methods
2.1. Materials
Methylmercury chloride (MeHg) was purchased from ICN Biomedical Inc. (Costa Mesa, CA). Calcein acetoxymethylester (calcein AM) and ethidium homodimer-1 (EthD-1) were purchased as a cell viability kit from Molecular Probes (Invitrogen, Eugene, OR). Poly-L-ornithine, laminin, CNQX (cyanquixaline, 6-cyano-7-nitroquinoxaline-2,3-dione), NAS (1-naphthylacethyl spermine), AMPA (α-amino-3-hydroxy-5-methyl-4-isoxazolepropionic acid), paraformaldehyde, tritonX-100, fura-2AM and ethylene glycol-bis (β-aminoethylether) N,N,N’,N’-tetra acetic acid (EGTA) were purchased from Sigma-Aldrich (St. Louis, MO). Normal goat serum and mounting medium Vecta shield with nuclear DNA stain 4, 6-diamino-2-phenylinndole (DAPI) were purchased from Vector Labs (Burlingame, CA).
Antibodies used were: rabbit anti-glutamate receptor subunit 1 (GluA1), rabbit anti-GluA2, rabbit anti-adenosine deaminase acting on RNA2 (ADAR2) conjugated with Alexa Fluor 488, and chicken anti-neurofilament heavy-200 (NFH) obtained from Abcam (Cambridge, UK). Mouse anti-neuronal specific nuclear protein NeuN (NeuN) were purchased from Millipore; secondary antibodies used were donkey anti-mouse Alexa Fluor 405, goat anti-rabbit Alexa Fluor 488 and goat anti-chicken Alexa Fluor 594 obtained from Abcam.
2.2. Chemicals and solutions
MeHg stock solution used for experiments was prepared with double-distilled water to a concentration of 10 mM. MeHg exposure solutions were prepared in HEPES Buffer Saline (HBS). All exposure solutions were prepared the day of the experiment using MeHg stock solution that was never older than 30 days. CNQX, NAS, AMPA and TPEN (N,N,N’,N’ – tetrakis (2-pyridylmethyl) ethylenediamine) were prepared as 10 mM stock solutions in double distilled water. Dilutions were made from these stocks with HBS for the performed experiments.
Experimental solutions for immunocytochemistry, including 4% (w/v) paraformaldehyde and the 10% (v/v) normal goat serum, were prepared in Phosphate Buffer Saline (PBS), which contained (in mM) 137 NaCl, 2.7 KCl, 1.4 NaH2PO4, and 4.3 NaH2PO4, pH 7.4 at room temperature of 23 −25 °C (Pardo et al., 2006). Solutions used in all other experiments were made in HBS, which contained (in mM) 150 NaCl, 5.4 KCl, 1.8 CaCl2, 0.8 MgSO4, 20 d-glucose, and 20 HEPES (free acid), pH 7.3 at room temperature of 23 −25 °C (Marty and Atchison, 1997). HBS pH was adjusted to 7.3 with TRIS. Ca2+-free HBS was prepared similarly to HBS, except that CaCl2 was omitted and 20 μM EGTA was added.
2.3. Human induced pluripotent stem cell derived motor neuron cell culture (hiPSC-MNs)
HiPSC-MNs and their culture medium (Motor Neuron Maintenance Medium®) were purchased from iX Cells Biotechnologies (San Diego, CA). These cells were derived from peripheral blood of an adult male and were differentiated into MNs by episomal reprograming. They had been cryopreserved after being terminally differentiated into MNs.
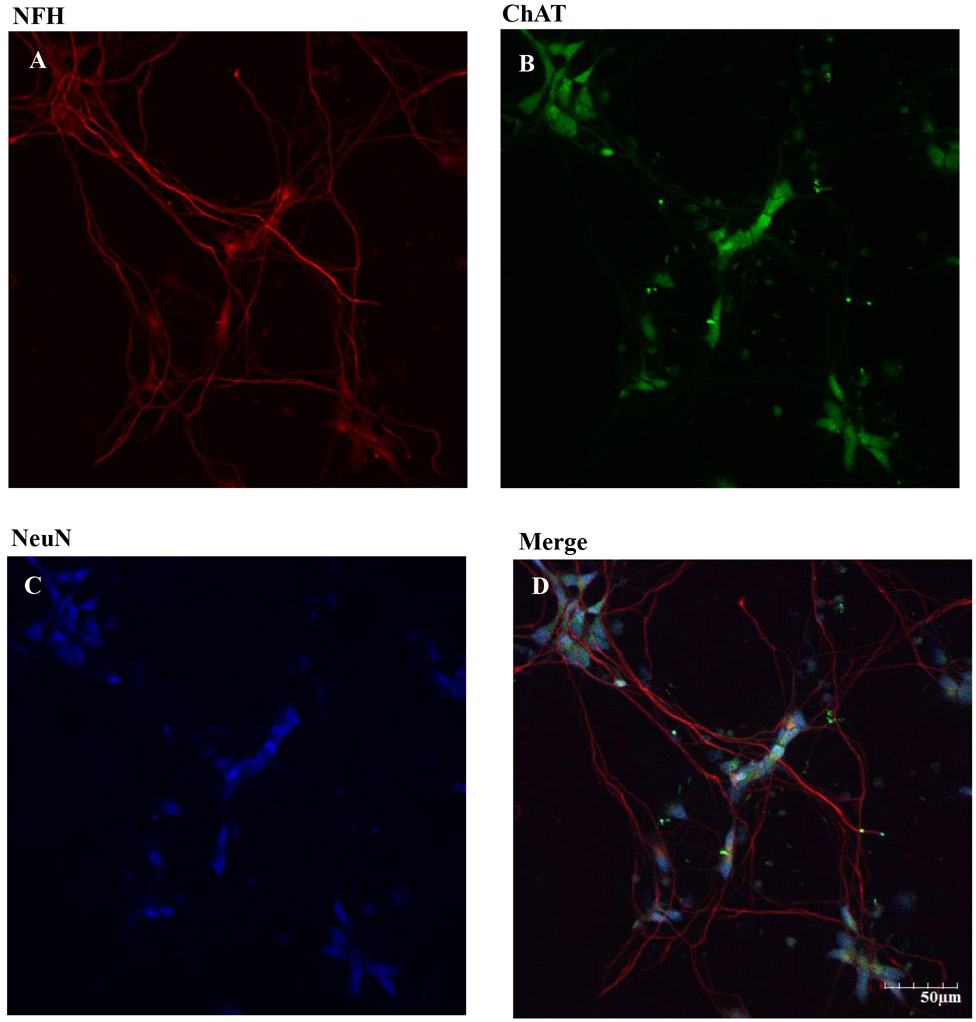
For plating, hiPSC-MNs were thawed for 1 min in a 37 °C water bath, then immediately combined with 1 ml of human Motor Neuron Maintenance Medium®. The cell suspension was transferred into a 15 ml conical tube containing 4 ml of Motor Neuron Maintenance Medium®. Cells were centrifuged for 3 min at 3,000 rpm to remove any trace of dimethyl sulfoxide (DMSO). Supernatant was removed, and cells were resuspended in 2 ml of Motor Neuron Maintenance Medium®. Approximately 1.2 x 10⁵ cells/ml were cultured in maintenance medium on pre-coated poly-L-ornitine (20 μg/ml) and laminin (5 μg/ml) 25 mm glass coverslips in 35 mm dishes. Cell quantification was performed with trypan blue in a Bio-Rad TC20 (Hercules, CA) automated cell counter. Cells were incubated at 37°C in an environment containing 5% CO2. After 48 hr of incubation (DIV 2) 50% of the medium was exchanged for fresh maintenance medium and then after every 72 hr. Cells developed MN phenotype after the first 24 hr in vitro (DIV1). After 6 DIV they expressed all MN markers including ChAT (choline acetyl transferase), NFH (neurofilament heavy) and NeuN (neuron-specific nuclear protein) (Figures 2-4).
Figure 2. Expression of neurofilament H (NFH), choline acetyl transferase (ChAT) and neuronal nuclear protein (NeuN) in hiPSC-MNs after 7 DIV.
DIV 7 hiPSC were fixed and immunolabeling was performed using mouse anti-NeuN primary antibody and anti-mouse Alexa Fluor 405 (A). Rabbit anti-ChAT primary antibody and goat anti-rabbit Alexa Fluor 488 secondary antibody was used (B). Chicken anti-NFH and goat anti-chicken Alexa Fluor 594 secondary antibody was used (C). Merged images of NeuN, ChAT, and NFH showed the abundance of α MNs in our hiPSC-MN cultures. Images were taken at 20x magnification with 2x zoom form the same field of cells. Scale bar = 50 μm.
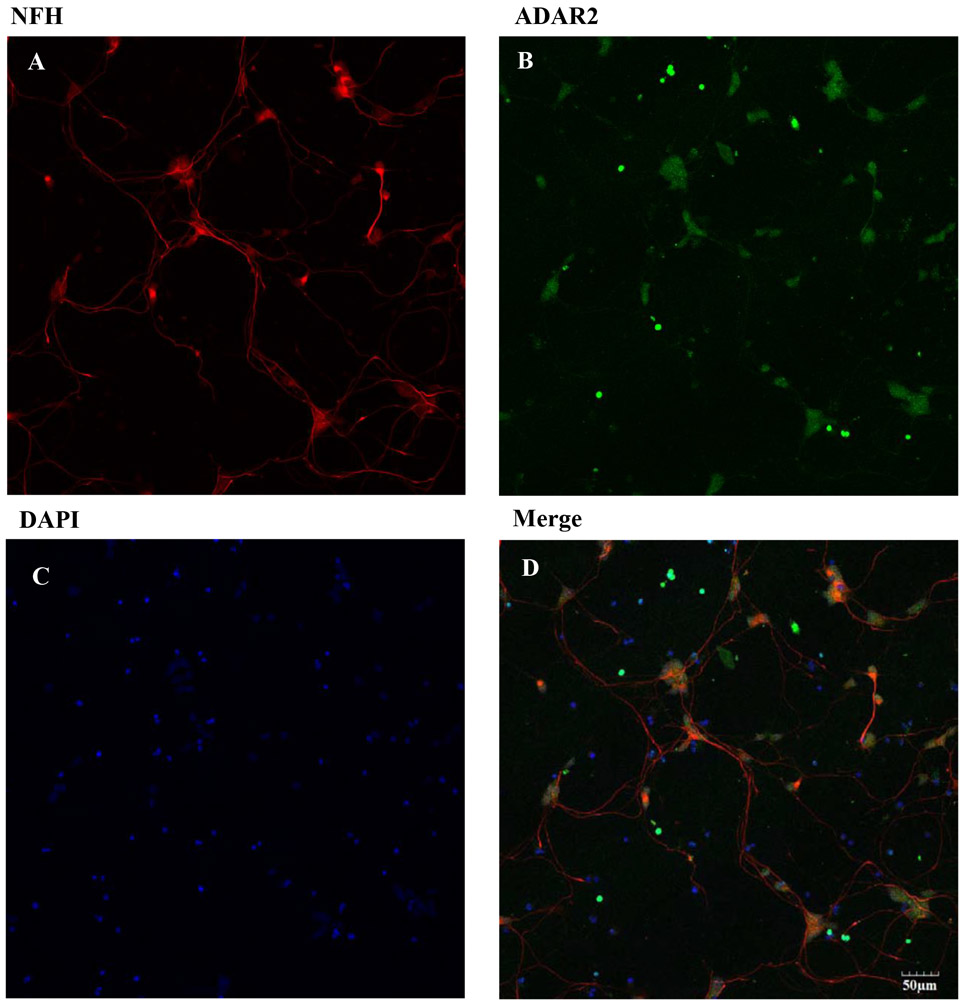
Figure 4. Expression of NFH, ADAR2 and DAPI on hiPSC-MNs after 7 DIV.
DIV 7 hiPSC-MNs were fixed and immunolabeling was performed using chicken anti-NFH primary antibody and anti-chicken Alexa Fluor 595 (A). Rabbit anti-ADAR2 primary antibody and goat anti-rabbit Alexa Fluor 488 secondary antibody was used (B). Nuclear DNA stain DAPI is shown in panel (C). Merged image show expression of RNA editing enzyme ADAR2 in hiPSC-MNs. Images were taken at 20x magnification from the same field of cells. Scale bar = 50 μm.
hiPSC-MNs were exposed to MeHg on DIV7. Exposure to MeHg was in HBS and for 1 hr in one of five concentrations (0.1, 0.2, 0.5, 1 and 1.5 μM), or no MeHg as control. These MeHg concentrations are toxicologically relevant (Clarkson and Magos, 2006) and in vitro they cause alterations of [Ca2+]i in murine primary MNs in culture (Ramanathan and Atchison, 2011).
2.4. hiPSC-MN cell viability assessment via calcein-AM/ethidium homodimer-1 cytotoxicity assay
A calcein-AM/ ethD-1 assay was used to assess cell viability in hiPSC-MNs following the established protocol by Marty and Atchison (1998). Briefly, hiPSC-MNs were rinsed three times with HBS and cells were then exposed to MeHg in HBS at 0, 0.1, 0.2, 0.5, 1.0 or 1.5 μM for 1 hr, after which MeHg was removed and replaced with Motor Neuron Maintenance Medium®. The duration of MeHg exposure (1 hr) was selected to correspond to increases in Fura-2 fluorescence caused by MeHg in this and other studies observed at the previously mentioned concentrations (Marty and Atchison, 1997; Limke and Atchison, 2002; Ramanathan and Atchison, 2011). Importantly, at this duration of exposure there was no significant decrease in cell viability or cellular damage at the structural level. Cell viability was assessed 24 hr post exposure. This was selected based on the turnover rate of AMPARs (18-23 hr) (Huh and Wenthold, 1999) and the known delayed effects of MeHg on neurons including MNs (Møller-Madsen, 1990, 1991, Rice, 1996). After 24 hr, cells were incubated with 0.1 μM calcein AM and 0.5 μM ethidium homodimer-1 for 30 min at 37°C. They were subsequently rinsed with 1X HBS and then imaged in a Nikon Eclipse epifluorescence microscope (Nikon Instruments America, Melville, NY). Cell viability was calculated by counting the number of live and dead cells from three different regions in each dish and averaging it. Then the following formula was used to calculate the percent viability. Percent viability = Total cells – Dead cells/ Total cells x 100.
2.5. Immunocytochemistry for MN markers in hiPSC-MNs
Immunocytochemistry was performed on hiPSC-MNs to identify MN markers. DIV 7 hiPSC-MNs were rinsed with PBS three times and fixed in 4% (w/v) paraformaldehyde in PBS for 30 min at room temperature. After washing, the cells were incubated in 0.1% (v/v) Triton-X for 30 min at room temperature. Afterwards, to prevent nonspecific binding, cells were blocked with 10% (v/v) normal goat serum in PBS for 30 min. Cells were then rinsed with PBS three times and the primary antibody was added. After an overnight (24 hr) incubation at 4 ° C cells were washed in PBS three times and the secondary antibody was applied and incubated for 2 hr in the dark at room temperature. Cells were rinsed in PBS three times and mounted to glass slides and were set to dry for 15 min at room temperature before examining. Cells labeled with one or two antibodies were mounted with Vecta Shield® that contained DAPI (Vector Labs, Burlingame, CA). Cells labeled with three antibodies were mounted with ProLong Antifade Mounting Medium® (Life Technologies, Fresno, CA). Images were collected using an Olympus FVI000 confocal microscope (Olympus USA, San Jose, CA) equipped with Fluoview viewer FV10 3.1 software. The antibodies and concentrations used for this study are: rabbit anti- GluA1 (1:100) and rabbit anti-GluA2 (1:50), the two most common AMPAR subunits in MNs, rabbit anti-ADAR2 (1:200), mouse anti-NeuN (1:100), chicken anti-NFH (1:2500), and rabbit anti-ChAT (1:200). Secondary antibodies used were donkey anti-mouse Alexa Fluor 405, goat anti-rabbit Alexa Fluor 405, goat anti-rabbit Alexa Fluor 488, goat anti-chicken Alexa Fluor 594. All secondary antibodies were used at a dilution of 1:200.
2.6. Single-cell Ca2+ microfluorimetry
Ratiometric Ca2+ imaging was performed using fura-2 acetoxy methyl ester (fura-2AM), an intracellular Ca2+ fluorophore (Grynkiewicz et al., 1985). Changes in fluorescence ratio, at 340 and 380 nm, representing the Ca2+bound and unbound forms of fura-2 (Grynkiewicz et al., 1985) were measured continuously. These changes were monitored simultaneously from the cell soma of 6 - 10 hiPSC-MNs per dish. A Nikon Diaphot microscope coupled to an Ionoptix cation fluorescence imaging system (Ionoptics; Milton, MA) and temperature regulated (37°C) perfusion system (2 ml/min) were used. hiPSC-MN were rinsed three times with HBS and incubated with 3 μM fura-2AM in HBS for 40 min at 37°C (Ramanathan and Atchison, 2011). After incubation, the cells were rinsed by perfusion for 15 min with HBS, before recordings commenced. This step allowed the de- esterification of the fluorophore and the removal of unattached cells. The first five minutes were recorded with HBS, then the cell’s ability to buffer Ca2+ was determined using a 1 – 1.5 min exposure to 40 mM KCl. Healthy cells responded with a rapid depolarization, and subsequent increase in 340/380 fluorescence ratio, that returned to baseline upon KCl removal. A 5 min wash with HBS was applied after KCl exposure to allow the cells to recover [Ca2+]i to baseline. For experiments performed in which glutamate receptor antagonists were used, the cells were exposed to 20 μM CNQX (Ramanathan and Atchison, 2011) or 50 μM NAS (Johnson, Yuan et al., 2011) for 10 min, then perfused simultaneously with MeHg in combination with CNQX or NAS respectively. Fluorescence at 340/380 was measured continually for at least 60 min. The 340/380 ratio is generally assumed to represent [Ca2+]i. However, that is only the case if Ca2+ is the only polyvalent cation whose concentration changes. Prior work from our lab has repeatedly demonstrated that the change in fura-2 fluorescence is associated in part with another cation which has putatively been identified as Zn2+ (Hare et al., 1993; Denny et al., 1993; Denny and Atchison, 1994; Edwards et al., 2005; Ohkubo et al., 2016). For this reason, all MeHg-induced changes in fura-2 fluorescence are reported as changes in ratio.
2.7. Data analysis and statistics
Each experiment was performed in triplicates and the n ≥ 3 unless indicated otherwise. Statistical analysis was performed using GraphPad Prism software version 6 (GraphPad Software, Inc., La Jolla, CA). For cell viability, comparison among groups were performed using One-Way ANOVA and Tukey’s post hoc test. Fura-2 fluorescence changes comparisons among groups were performed using Two-Way ANOVA and Bonferroni’s post hoc test. Statistical significance is considered at p ≤ 0.05.
3. Results
3.1. hiPSC-MNs grow in poly-l-ornitine and laminin coated dishes for up to 14 days in vitro
hiPSC-MNs used for this study only recently became commercially available. In the supplier’s protocol, it is suggested that the cells be cultured with astrocytes to prolong MNs lifespan in vitro. However, because we wanted to characterize MeHg effects on MNs in isolation we grew them without astrocytes. Thus, we needed first to optimize the cell density at which MNs could be plated in isolation without astrocytes to reduce cell loss, and obtain single cells to facilitate measurements of cell viability and Ca2+ microfluorimetry recordings. The selected cell density to perform our experiments was 1.2 × 10⁵ cells/ml seeded in poly-l-ornithine and laminin-coated glass coverslips. Poly-l-omithine and laminin are commonly used substrates when culturing human neural stem cells (Yang, Liu et al., 2014), so were selected as substrate for our experiments using hiPSC-MNs. After 24 hr in vitro, hiPSC-MNs started growing neurites Figure 1. After 7 DIV they have differentiated completely, and have long neurites and morphology similar to that of a mature MN Figure 1. In a pilot experiment, we were able to maintain the hiPSC-MN cultures for up to 14 days in vitro (results not shown). However, for our experiments only DIV 7 hiPSC-MNs were used.
Figure 1. Morphology of hiPSC-MNs plated in poly-l-ornithine and laminin coated dishes.
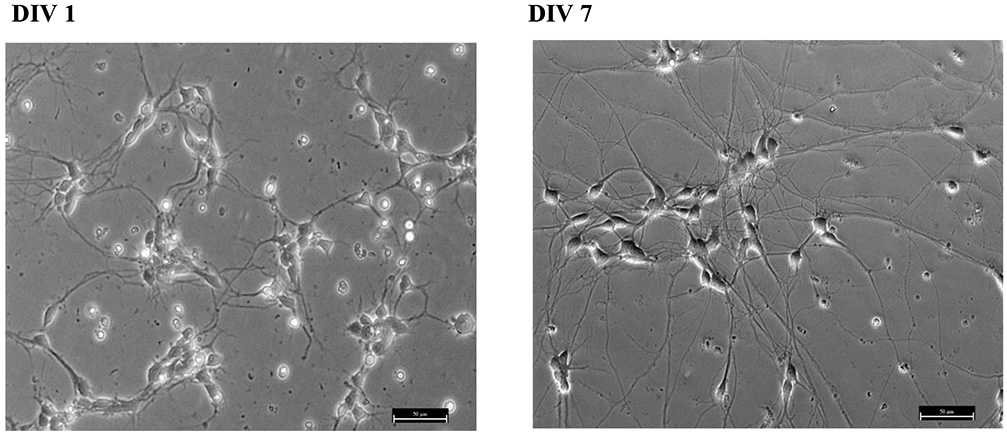
HiPSC-MNs present neurites after 1 DIV (A) and these extend and connect with neighboring neurons after at least 5 DIV. Panel (B) shows DIV 7 cell morphology. Long processes and morphological features as differentiated mature MNs can be observed. The micrograph was taken at 20x magnification. Scale bar = 50 μm.
3.2. HiPSC-MNs express ChAT, NFH, AMPAR subunits, and ADAR
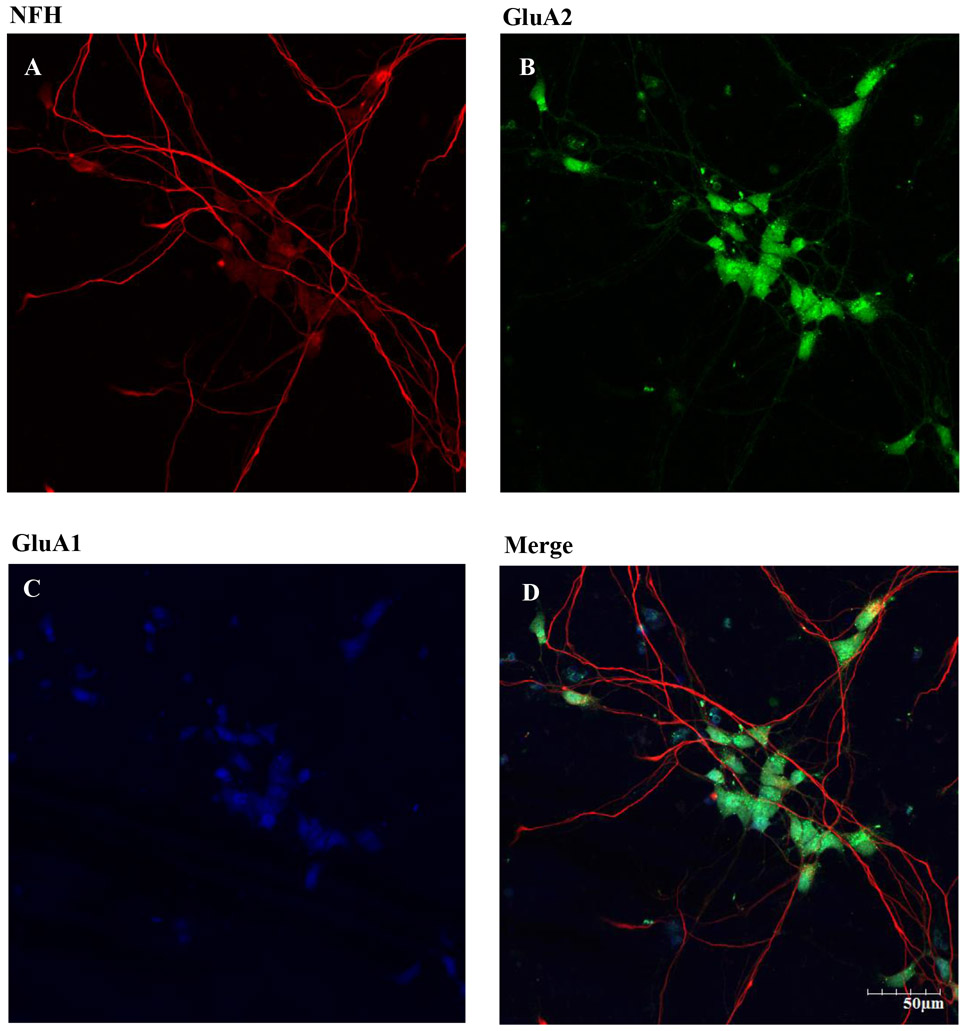
There are three classes of MNs: α, β and γ. They can be distinguished morphologically and by different patterns of fluorescent staining. Immunocytochemistry was used to identify the density of α MNs in the hiPSC-MN cell cultures, α MNs can express, as compared to γ MNs, the neuronal nuclear protein NeuN (Friese et al., 2009). Cells that express ChAT, NFH and NeuN are considered to be α MNs. The immunofluorescence results demonstrated that most of the cell population in our hiPSC-MN cultures are α MNs (Fig. 2). Because the main goal of this study was to identify the role of AMPARs in MeHg-induced toxicity, we identified the phenotype of AMPAR expressed. We specifically stained for the presence of GluA1, the most abundant subunit of the AMPARs, and GluA2, the subunit that confers Ca2+ permeability to the receptors. Expression of both was observed after 7 DIV (Fig. 3). Expression of the RNA editing enzyme ADAR2 was also identified in cultures from DIV 7 (Fig. 4). Based on these results DIV 7 was selected as the day on which to begin all experiments and MeHg exposures.
Figure 3. Expression of NFH, GluA2 and GluA1 subunit on hiPSC-MNs after 7 DIV.
DIV 7 hiPSC were fixed and immunolabeling was performed using chicken anti-NFH primary antibody and goat anti chicken Alexa Fluor 594 secondary antibody (A). Rabbit anti-GluA2 primary antibody conjugated with Alexa Fluor 488 secondary antibody was used (B). Rabbit anti-GluA1 and goat anti-rabbit Alexa Fluor 405 secondary antibody was used (C). Merged images of NFH, GluA1, and GluA2 showed these subunits in our hiPSC-MN cultures. Images were taken at 20x magnification with 2x zoom from the same field of cells. Scale bar = 50 μm.
3.3. Morphological changes on hiPSC-MNs are observed after MeHg exposure
Exposure to 1 μM MeHg for 1.5, 6 or 18 hr leads to fragmentation of neurites in cerebellar granule cells (Castoldi et al., 2000). After 1 hr exposure, the same MeHg concentration did not induce a significant level of cell death in hiPSC-MNs (p > 0.05). Studies using MNs in vitro have demonstrated that they are susceptible to MeHg toxicity in a similar manner and at similar MeHg concentrations to cerebellar granule cells (Marty and Atchison, 1997, 1998; Ramanathan and Atchison, 2011). Thus, before selecting the duration of exposure for the experiments of this study we first examined whether structural changes occurred in hiPSC-MNs that precede cell death (Castoldi et al., 2000). This allowed us to identify the level of exposure which would be appropriate for identifying molecular events that lead to cell death induced by MeHg. Fragmentation of neurites was observed after 12 hr exposure to 1 and 1.5 μM MeHg (Fig. 5). At 24 hr MeHg caused neurite beading and fragmentation in all concentrations (0.5 – 1.5 μM) (Fig. 5). The incidence in severity of these effects appeared to increase as the concentrations of MeHg increased (Fig. 5). These results and the significant decrease in gene expression of AMPAR subunits observed in this same exposure regimen (data not shown) led to abandon semi chronic exposures as a paradigm for this study.
Figure 5. Effect of 12 or 24 hr MeHg exposure on hiPSC-MNs morphology assessed immediately after exposure.
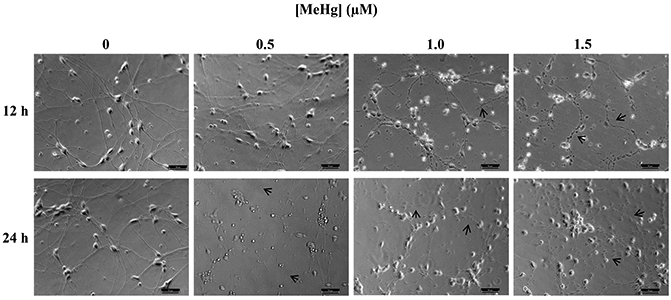
Micrographs of hiPSC-MNs exposed to MeHg for 12 or 24 hr present alterations in cell morphology (note arrows) in the form of neurite beading and fragmentation. Micrographs are brightfield images of hiPSC-MNs taken in 20x magnification. Scale bar = 50 μM.
Delayed MeHg effects are well known in vivo and in vitro (Rice, 1996; Marty and Atchison, 1998; Weiss et al., 2002). Thus, we sought to test whether they also occur in vitro for human MNs. Rodent spinal cord MNs accumulate MeHg. Cell death occurs but is delayed, not being observed until at least 10 days after MeHg exposure had stopped (Møller-Madsen, 1990, 1991; Su et al., 1998). Morphological changes were assessed in hiPSC-MNs 24 hr after a 1 hr exposure to 0.5 – 1.5 μM MeHg (Fig. 6). HiPSC-MNs did not show any morphological changes except at 24 hr after exposure to 1.5 μM MeHg (Fig. 6).
Figure 6. Effect of 1 hr MeHg exposure on hiPSC-MNs morphology assessed after 12 and 24 hr.
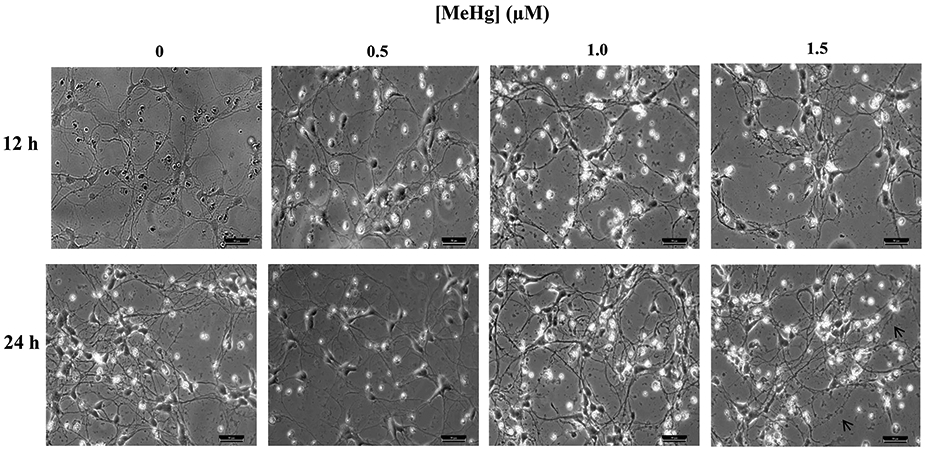
Micrographs of hiPSC-MNs exposed to MeHg for 1 hr and observed after 12 or 24 hr did not present alterations in cell morphology except at 1.5 μM for which fragmentation of neurites was observed (note arrows). Micrographs are brightfield images of hiPSC-MNs taken in 20x magnification. Scale bar = 50 μM.
3.4. Concentration-dependent incidence of cell death of hiPSC-MNs occurs after 1 hr MeHg exposure
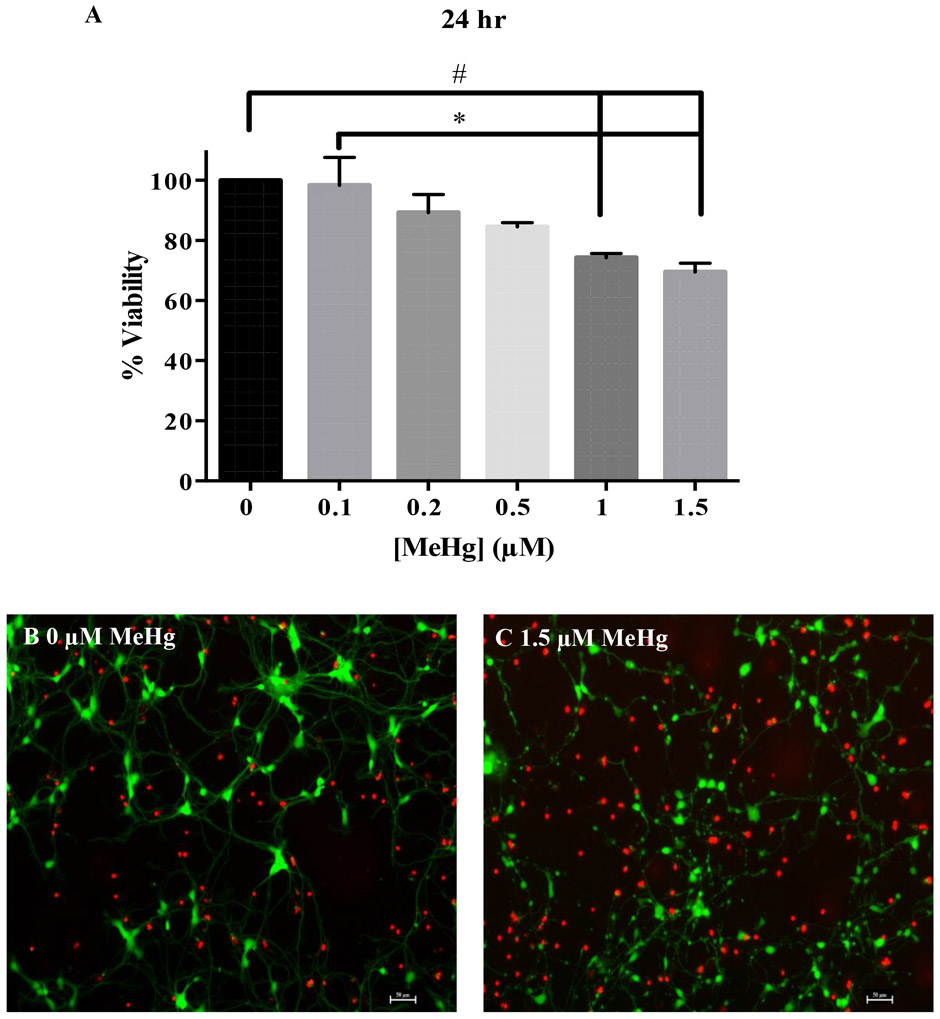
Incidence of cell viability was inversely proportional to MeHg concentrations 24 hr post exposure (Fig. 7). Effects of 1 hr MeHg exposure were assessed 24 hr after cessation of MeHg treatment. The percent of viable cells after exposure to 1 or 1.5 μM MeHg was compared to untreated controls after 24 hr of exposure. The response to 0.1 μM was significantly different from that of 1 or 1.5 μM MeHg. Representative micrographs of the cell viability assay show that untreated cells (0 μM MeHg) have long processes connected between each other and the number of live cells labeled by calcein-AM (green) is greater than the dead cells (red) labeled by ethidium homodimer (Fig. 7B). Cells exposed to 1.5 μM MeHg had a greater number of dead cells (red) and presented fragmentation and beading of axons (Fig. 7C) as observed in the morphological study (Fig. 5-6). These results demonstrate that 1 hr exposure to MeHg is sufficient to elicit cell death in hiPSC-MNs.
Figure 7. Delayed effects of MeHg in cell viability were assessed 24 hr after exposure.
Cell viability measured with calcein-AM/ethidium homodimer showed a concentration dependent cell death in hiPSC-MNs after exposure to 0.1 - 1.5 μM MeHg for 1 hr and assessed after 24 hr (A). Representative micrograph of 0 μM MeHg (B) and 1.5 μM MeHg-exposed hiPSC-MNs (C) after labeling for cell viability using calcein-AM (green) and Eth-D (red). The number sign (#) indicates a significant difference from control (0 μM MeHg). The asterisk (*) indicates a significant difference between 0.1 μM compared to 1.0 and 1.5 μM MeHg exposure (p ≤ 0.05) as determined by One-Way ANOVA and Tukey’s post hoc test. Values are represented as mean ± SEM (n = 3). Scale bar = 50 μM.
3.5. MeHg elicits a bi-phasic increase in [Ca2+]i in hiPSC-MNs
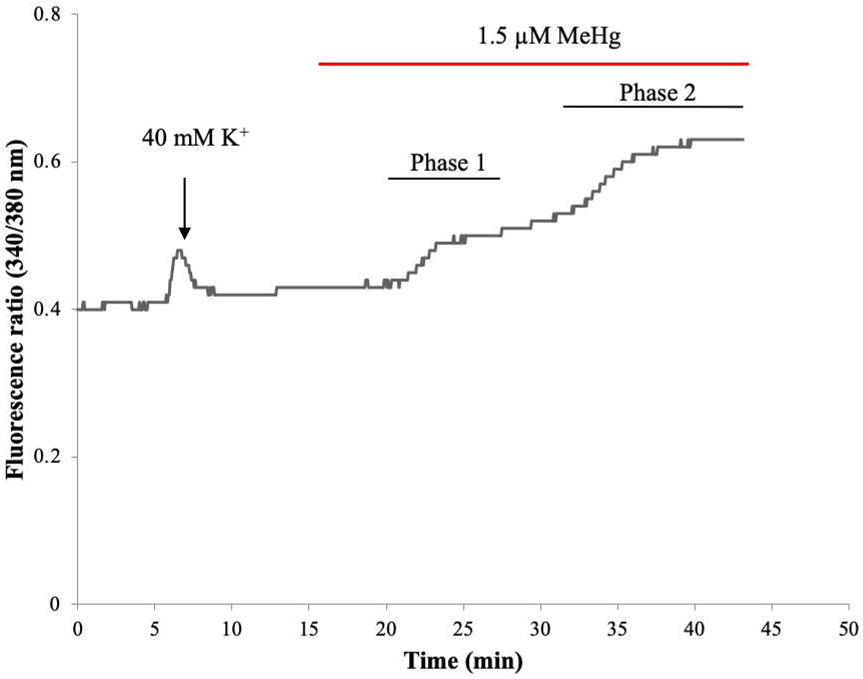
MeHg-induced increases in [Ca2+]i have been identified in vitro in spinal cord MNs from mice (Ramanathan and Atchison, 2011). These occur in a bi-phasic manner with a characteristic set of kinetically distinct changes. To test whether this occurred in a human MN cell model, recordings were performed using hiPSC-MNs. A similar response as seen in mouse MNs in culture was observed, which is characteristic of MeHg toxicity. A representative tracing of fura-2 fluorescence ratio F340/380 from a hiPSC-MN exposed to 1.5 μM MeHg is shown in Fig. 8. The first phase occurred after a latent period of 5 mins. In other cell types this phase is due to the release of Ca2+ from intracellular stores. The second phase, which occurs without delay from the first phase, has been shown to result from entry of Ca2+ from the extracellular fluid (Hare et al., 1993; Denny et al., 1993; Marty and Atchison, 1997). This pattern of response was recapitulated in hiPSC MNs at all MeHg exposures (0.1 - 1.5 μM). MeHg induced an increase in fura-2 fluorescence in a time- and concentration-dependent manner (Fig 9). In the first phase there is a significant difference between the time-to-onset of cells exposed to 0.1 μM MeHg and all other concentrations (Fig. 9A). In the second phase, there was a significant difference between the 0.1 μM and all other concentrations as well as 0.5 μM MeHg compared to all other concentrations (Fig. 9B). Increasing the concentration of MeHg does not reliably alter the extent of fura-2 fluorescence, but does hasten the onset of the effects (Hare et al., 1993; Marty and Atchison, 1997; Limke and Atchison, 2002; Ramanathan and Atchison, 2011).
Figure 8. Acute MeHg exposure alters [Ca2+]i homeostasis in hiPSC-MNs in a biphasic manner.
A representative tracing of fura-2 fluorescence ratio F(340/380) from a cell soma of a single hiPSC-MN during exposure to 1.5 μM MeHg.
Figure 9. Time-to-onset of increase in fura-2 fluorescence during perfusion of hiPSC-MNs with MeHg (0.1 - 1.5 μM) in normal HBS.
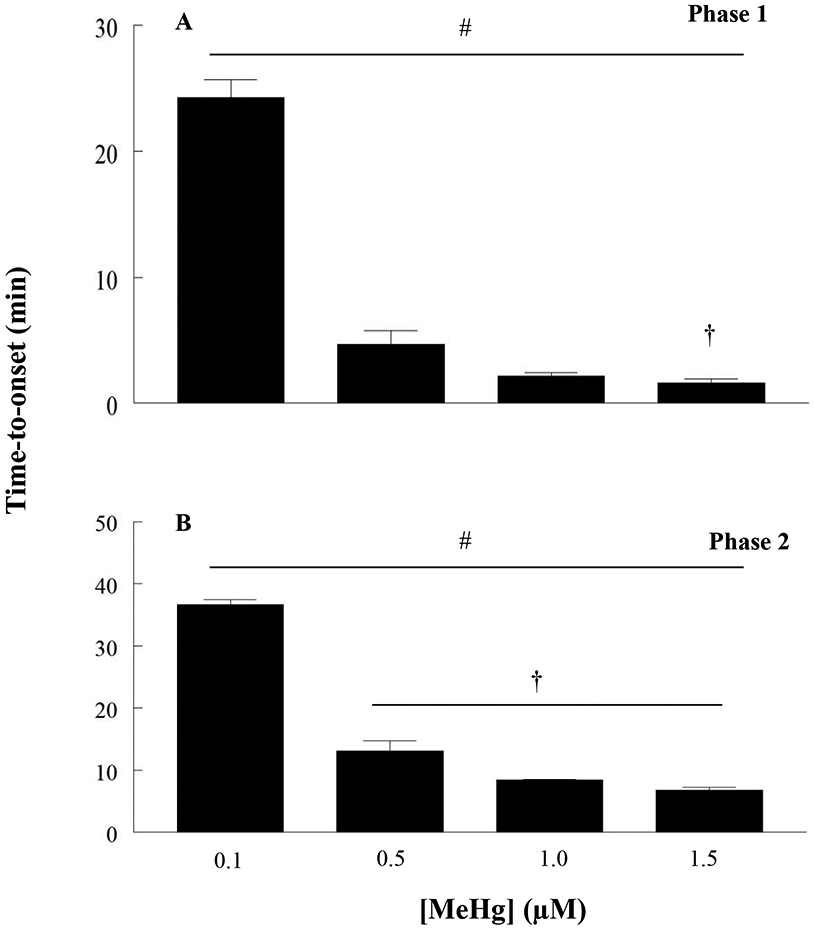
Untreated hiPSC-MNs maintain a basal fura-2 fluorescence for more than 60 min. The number sign (#) indicates a significant difference between 0.1 μM versus 0.5 μM, 1 μM and 1.5μM, the dagger (†) indicates a significant difference between 0.5 μM versus 1.5 μM. In phase 2, (#) indicates significant difference between 0.1 μM versus 0.5 μM, 1 μM and 1.5 μM, (†) indicates a significant difference between 0.5 μM versus 1.0 μM and 1.5 μM (p ≤ 0.05) as determined by Two-Way ANOVA and Bonferroni’s post hoc test. Values are represented as mean ± SEM (n ≥ 4). Each n represents the recording of fura-2 fluorescence value from the soma of 6 - 10 hiPSC-MNs per dish.
3.6. MeHg-induced increases in [Ca2+]i in hiPSC-MNs are mediated by AMPARs
The AMPA/KA receptor antagonist CNQX was used to identify if AMPARs contributed to the observed increases in fura-2 fluorescence in hiPSC-MNs in response to MeHg. Exposure to 20 μM CNQX delayed the time-to-onset of both the first and second phase of fura-2 fluorescence at all MeHg concentrations (0.1 - 1.5 μM) (Fig. 10). Effects were significant for each phase. This was the first indicator that AMPARs contribute to alterations in [Ca2+]i in human MNs. To identify if Ca2+-permeable AMPARs contributed to the increases in Ca2+, cells were exposed to NAS which significantly blocks Ca2+-permeable AMPARs. At 50 μM, NAS significantly slowed the development of the second phase of fura-2 fluorescence following exposure to 1.5 μM MeHg (Fig. 11). Exposure to both the blocker and MeHg occurred simultaneously.
Figure 10. Acute MeHg exposure-induced increases of Ca2+i in hiPSC-MN are mediated in part by AMPA/KA receptors.
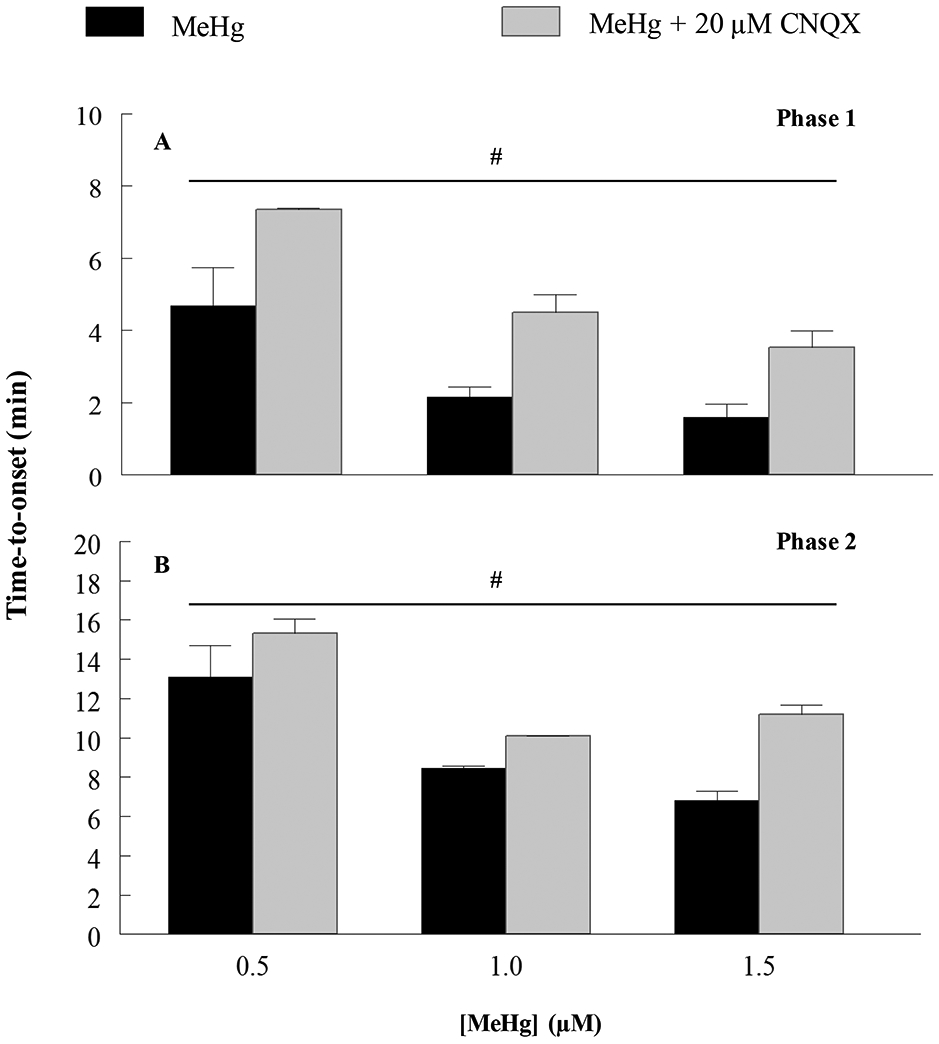
MeHg-induced increase in fluorescence time-to-onset is delayed by exposure to 20 μM CNQX, an AMPA/KA receptor antagonist, showing that this receptor is contributing to MeHg-induced increases in [Ca2+]i in hiPSC-MNs. (#) indicates significant difference between 0.5 μM versus 1.0 μM and 1.5 μM (p ≤ 0.05) as determined by Two-Way ANOVA and Bonferroni’s post hoc test. Values are represented as mean ± SEM (n ≥ 4). When not shown, the SEM is less than the diameter of the error bar.
Figure 11. Acute MeHg exposure-induced increases of Ca2+i in hiPSC-MNs are mediated in part by Ca2+-permeable AMPARs.
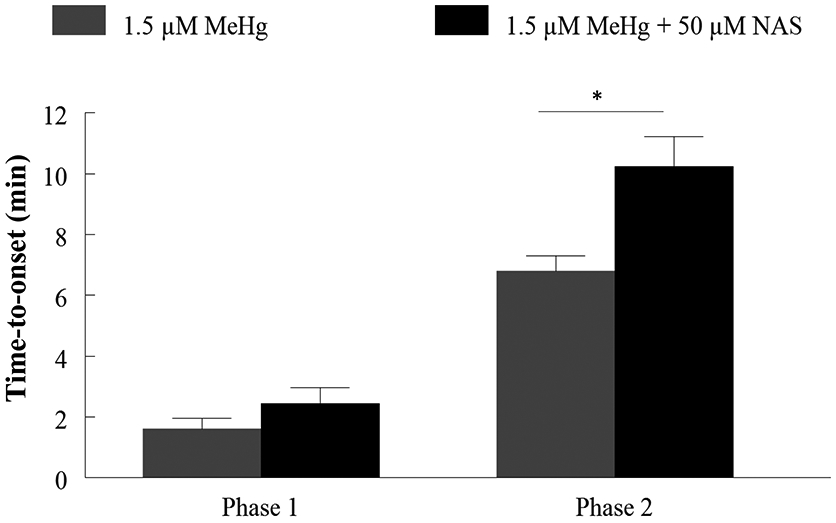
MeHg-induced increase in fluorescence time-to-onset is delayed by exposure to 50 μM NAS, a Ca2+ permeable AMPAR antagonist, confirming that this receptor is contributing to MeHg-induced increases in [Ca2+]i in hiPSC-MNs. The asterisk (*) indicates a significant difference between 1.5 μM MeHg alone vs 1.5 μM MeHg + 50 μM NAS (p ≤ 0.05) as determined by Two-Way ANOVA and Bonferroni’s post hoc test. Values are represented as mean ± SEM (n = 3).
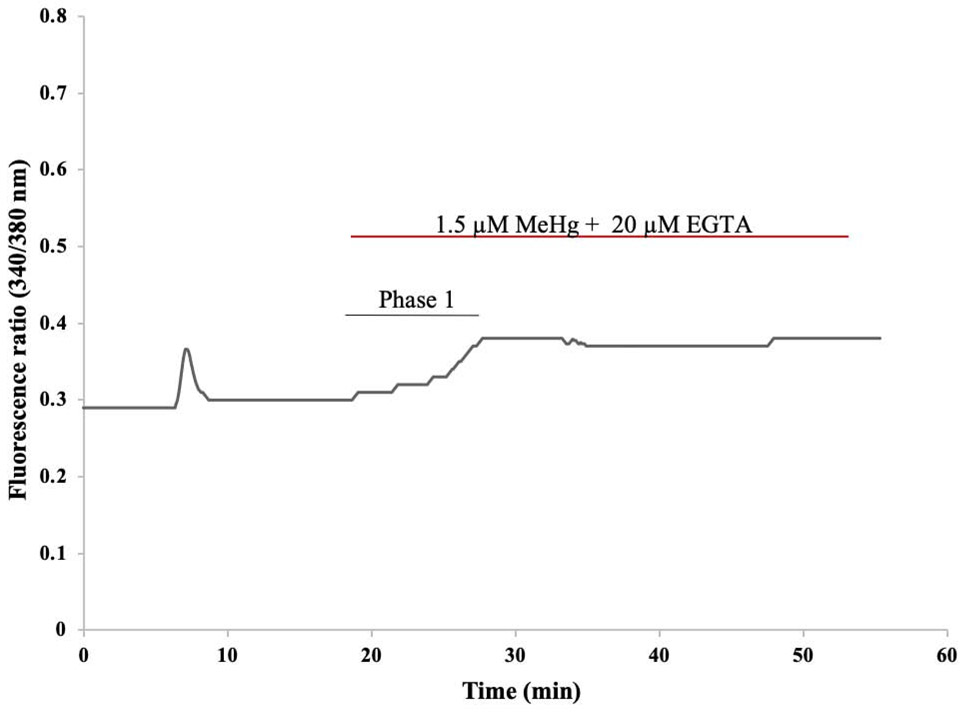
To confirm that the second phase observed after MeHg exposure was due the influx of extracellular Ca2+, recordings were made with Ca2+ free HBS containing 20 μM EGTA. MeHg used in this experiment was also prepared in Ca2+-free HBS. Exposure to MeHg in Ca2+ free HBS led only to a first phase increase in fura-2 fluorescence that is characteristic of release of Ca2+ from intracellular stores. The absence of the second phase indicates that in hiPSC-MNs this phase results from the influx of extracellular Ca2+. A representative tracing of one of our recordings is shown in Figure 12. This is similar to what has been observed in primary neuronal cells including mouse MNs after MeHg exposure (Ramanathan and Atchison, 2011).
Figure 12. Representative tracing of fura-2 fluorescence ratio F(340/380) from a hiPSC-MN during exposure to 1.5 μM MeHg + 20 μM EGTA.
The initial peak represents increase in Ca2+ as a result of depolarization of the cell after 1 min exposure to 40 mM KCl. Subsequent exposure to 1.5 μM MeHg + 20 μM EGTA-containing HBS (Ca2+ free HBS) removed the 2nd phase normally observed with MeHg exposure. This demonstrates that the 2nd phase is dependent on the influx of extracellular Ca2+.
4. Discussion
In human induced pluripotent stem cell derived MNs (hiPSC-MNs) low concentrations of MeHg cause 1) a bi-phasic increase in [Ca2+]i which occurs in kinetically-distinct phases, and with an inverse concentration-dependent time of onset; 2) these increases are mediated in part by AMPARs, and leads to 3) a concentration dependent incidence of cell death, and 3) at the highest concentration used, 1.5 μM, neurite fragmentation occurs. Taken together these results reinforce those of mouse brainstem (Johnson, Yuan, et al., 2011) and primary MN cultures (Ramanathan and Atchison, 2011) in that AMPARs are key players in MeHg-induced toxicity in MNs. They further demonstrate an essential role for Ca2+-permeable AMPAR-mediated depolarization, with subsequent activation of NMDA receptors, or voltage-gated Ca2+ channels, either route could initiate excitotoxicity. Because of the functional and structural properties of lower MNs, they are extremely sensitive to elevations in [Ca2+]i. Based on their paucity of Ca2+ -binding proteins such as calbindin, calretinin or parvalbumin (Ince et al., 1993; Laslo, Lipski, et al., 2000), their extensive expression of Ca2+ -permeable AMPARs, and their extensive membrane network, they are unable to manage increases in [Ca2+]i as effectively as other neurons in the spinal cord, particularly the Renshaw cells (see review by Alvarez and Fyffe, 2007), with which they make a coordinated and reciprocal synaptic circuit.
MeHg toxicity causes motor dysfunction, that has been associated with the degeneration of cerebellar granule cells (Hunter and Russell, 1954). There is no doubt that granule cells are an extremely sensitive target to MeHg, whether in vivo or in vitro, and for the latter, whether as cells in culture, or in situ in cerebellar slices. However, MeHg also accumulates and causes degeneration of spinal MNs. The effects are most pronounced in α MNs. This has been observed in in vivo studies using rodent models (Møller-Madsen, 1990, 1991; Su, Wakabayashi et al., 1998). Effects of MeHg on MNs have not been characterized to the extent that they have in the cerebellum, and this could indicate another potential mechanism by which MeHg causes motor impairment. The hiPSC-MN cultures described in this study were 90% α MNs, as determined by several neurochemical markers. MeHg caused degeneration of hiPSC-MNs in a concentration-dependent manner. This was observed as a delayed effect measured 24 hr after 1 hr MeHg exposure. Fragmentation of neurites was observed at the 1.5 μM MeHg exposure; this result is consistent with previous findings from cerebellar granule cells, the most susceptible neuronal cell to MeHg toxicity (Castoldi et al., 2000; Edwards et al., 2005). However, in our study 1 hr exposure to 1.5 μM MeHg caused neurite fragmentation and a significant incidence of cell death, which was not observed in the Castoldi et al., (2000) study. Also, in primary cultures of mouse MNs, low MeHg concentrations (0.1 – 1.5 μM) cause toxicity (Ramanathan and Atchison, 2011). The increase in [Ca2+]i like that in the present study was delayed by the AMPAR antagonist CNQX.
Apart from the in vitro study of effects of MeHg in primary cultures of spinal cord MNs from mouse (Ramanathan and Atchison, 2011), the chronic dosing study in SOD1-G93A mice (Johnson, Yuan et al., 2011), and a very recent study of acute exposure of lumbar spinal MNs to MeHg in spinal cord slice (Sceniak, Spitsbergen et al., 2020), the specific effects of MeHg on AMPARs have received little attention, and the role that Ca2+ -permeable AMPARs play in MeHg-induced toxicity remain virtually understudied. This is important in that Ca2+ -permeable AMPARs play an important role in generating increases in [Ca2+]i in MNs and they have been implicated as playing a major role in the MN-directed disease amyotrophic lateral sclerosis (ALS) (Kawahara, Ito, 2003; Kawahara, Kwak et al., 2003; Kwak, Kawahara, 2005; Kwak, Hideyama et al. 2010). The MeHg-induced increase in [Ca2+]i was modified by 50 μM NAS, a Ca2+ -permeable AMPAR antagonist. Specifically, NAS delayed the time-to-onset in fura-2 fluorescence ratio (F340/380), indicating that Ca2+ -permeable AMPARs contribute to increase in [Ca2+]i, and blocking them delayed the second phase of increase in fura-2 fluorescence response to MeHg. This, however does not diminish the potential role that voltage gated Ca2+ channels and non AMPARs such as NMDA could play on MeHg-induced increases in [Ca2+]i in MNs and should be the focus of future studies.
Of broader significance is the potential role which MeHg-induced interaction with AMPARs may play in gene X environment (G x E) types of exposure. A prior study from our lab demonstrated that chronic, low dose exposure to MeHg accelerated the onset of ALS-like phenotype in the superoxide dismutase-1-G93A (SOD1-G93A) mouse model (Johnson, Yuan, 2011), which expresses a humanized mutation found in ~20% of the patients expressing familial ALS. In that mouse model, Ca2+-permeable AMPARs contributed significantly to the MeHg toxicity. The observation in this study that MeHg-induced alterations in Ca2+i are mediated in part by AMPARs solidifies that hypothesis of a G x E further.
Our group was not the first to hypothesize that MeHg, through a possible G x E interaction, could be contributing to the development of ALS. It is known that MeHg is a prevalent environmental neurotoxicant mostly due to anthropogenic sources (Clarkson and Magos, 2006, Wade, 2013). This and the fact that the mechanism of toxicity of MeHg and the mechanism of pathogenesis observed in ALS patients share similarities strengthen this point which has been previously brought up in the literature (Johnson, Yuan et al., 2011; Praline, Guennoc et al., 2007; Roos, Vesterberg et al., 2006; Sutedja, Veldink et al., 2009; Andrew, Chen, et al., 2018).
In summary, our findings are the first to characterize the actions of MeHg to alter [Ca2+]i in a human MN model and to characterize the contribution of AMPARs, particularly Ca2+ - permeable AMPARs to these alterations. These findings can contribute to the understanding of the prospective role of MeHg in G x E interactions, such as those in ALS.
Highlights.
HiPSC-MNs are sensitive to acute MeHg exposure.
Acute MeHg exposure leads to a concentration dependent cell death in hiPSC-MNs.
MeHg-induced increases in [Ca2+]i in hiPSC-MNs are mediated in part by AMPARs.
ACKNOWLEDGMENTS
We would like to thank Dr. Ravindra K. Hajela for his technical assistance and suggestions for the experimental design, Dr. Alberto Perez for his assistance with the confocal microscopy, Ms. Duanghathai (Noge) Wiwatratana and Dr. Heidi Fogle for their advice on the cell viability and single cell Ca2+ microfluorimetry experiments.
This work was supported by the National Institute of Environmental Health Sciences (NIEHS) grant R01ES024064 (to William D. Atchison) and NIEHS T32 ES00725527 (Alexandra Colón-Rodríguez).
Footnotes
Publisher's Disclaimer: This is a PDF file of an unedited manuscript that has been accepted for publication. As a service to our customers we are providing this early version of the manuscript. The manuscript will undergo copyediting, typesetting, and review of the resulting proof before it is published in its final form. Please note that during the production process errors may be discovered which could affect the content, and all legal disclaimers that apply to the journal pertain.
Declaration of interests
The authors declare that they have no known competing financial interests or personal relationships that could have appeared to influence the work reported in this paper.
REFERENCES
- Alvarez FJ and Fyffe REW. The continuing case for the Renshaw cell. J Physiol. 2007; 584:31–45. [DOI] [PMC free article] [PubMed] [Google Scholar]
- Andrew AS, Chen CY, Caller TA, Tandan R, Henegan PL, et al. Toenail mercury levels are associated with amyotrophic lateral sclerosis risk. Muscle Nerve. 2018; 58:36–41. [DOI] [PMC free article] [PubMed] [Google Scholar]
- Bettler B, Mulle C. Review: neurotransmitter receptors. II. AMPA and kainate receptors. Neuropharmacology. 1995; 34:123–39. [DOI] [PubMed] [Google Scholar]
- Cashman NR, Durham HD, Blusztajn JK, Oda K, Tabira T, Shaw IT, et al. Neuroblastoma x spinal cord (NSC) hybrid cell lines resemble developing motor neurons. Dev Dyn. 1992; 194:209–21. [DOI] [PubMed] [Google Scholar]
- Castoldi A, Barni S, Turin I, Gandini C, Manzo L. Early acute necrosis, delayed apoptosis and cytoskeletal breakdown in cultured cerebellar granule neurons exposed to methylmercury. J Neurosci Res. 2000; 59:775–87. [DOI] [PubMed] [Google Scholar]
- Chapman LA, Chan HM. Inorganic mercury pre-exposures protects against methyl mercury toxicity in NSC-34 (neuron x spinal cord hybrid) cells. Toxicology. 1999; 132:167–78. [DOI] [PubMed] [Google Scholar]
- Clarkson TW, Magos L. The toxicology of mercury and its chemical compounds. Crit Rev Toxicol. 2006; 36:609–62. [DOI] [PubMed] [Google Scholar]
- Denny MF, Atchison WD. Methylmercury-induced elevations in intrasynaptosomal zinc concentrations: an 19F-NMR study. J Neurochem. 1994; 63(1):383–6. [DOI] [PubMed] [Google Scholar]
- Denny MF, Hare MF, Atchison WD. Methylmercury alters intrasynaptosomal concentrations of endogenous polyvalent cations. Toxicol Appl Pharmacol. 1993; 122(2):222–32. [DOI] [PubMed] [Google Scholar]
- Edwards JR, Marty MS, Atchison WD. Comparative sensitivity of rat cerebellar neurons to dysregulation of divalent cation homeostasis and cytotoxicity caused by methylmercury. Toxicol Appl Pharmacol. 2005; 208:222–32. [DOI] [PubMed] [Google Scholar]
- Eggett C, Crosier S, Manning P, Cookson M, Menzies F, et al. Development and characterization of a glutamate-sensitive motor neurone cell line. J Neurochem. 2000; 74:1895–902. [DOI] [PubMed] [Google Scholar]
- Friese A, Kaltschmidt J, Ladle D, Sigrist M, Jessell T, Arber S. Gamma and alpha motor neurons distinguished by expresion of transcription factor Err3. Proc Nat Acad Sci, USA. 2009; 106:13588–93. [DOI] [PMC free article] [PubMed] [Google Scholar]
- Grosskreutz J, Van Den Bosch L, Keller BU. Calcium dysregulation in amyotrophic lateral sclerosis. Cell Calcium. 2010; 47(2):165–174. [DOI] [PubMed] [Google Scholar]
- Grynkiewicz G, Poenie M, Tsien RY. A new generation of Ca2+ indicators with greatly improved fluorescence properties. J Biol Chem. 1985; 260:3440–50. [PubMed] [Google Scholar]
- Hare MF, McGinnis KM, Atchison WD. Methylmercury increases intracellular concentrations of Ca2+ and heavy metals in NG108-15 cells. J Pharmacol Exp Ther. 1993; 266:1626–35. [PubMed] [Google Scholar]
- Huh KH, Wenthold RJ. Turnover analysis of glutamate receptors identifies a rapidly degraded pool of the n-methyl-d-aspartate receptor subunit, NR1, in cultured cerebellar granulle cells. J Biol Chem. 1999; 274(1):151–7. [DOI] [PubMed] [Google Scholar]
- Hunter D, Russell D. Focal cerebral and cerebellar atrophy in a human subject due to organic mercury compounds. J Neurol Neurosurg Psychiat. 1954; 1954:235–41. [DOI] [PMC free article] [PubMed] [Google Scholar]
- Ince P, Stout N, Shaw P, Slade J, Hunziker W, et al. Parvalbumin and calbindin D-28k in the human motor system and in motor neuron disease. Neuropathol Appl Neurobiol. 1993; 19:291–9. [DOI] [PubMed] [Google Scholar]
- Johnson FO, Yuan Y, Hajela RK, Chitrakar A, Parsell DM, Atchison WD. Exposure to an environmental neurotoxicant hastens the onset of amyotrophic lateral sclerosis-like phenotype in human Cu2+/Zn2+ superoxide dismutase 1 G93A mice: glutamate-mediated excitotoxicity. J Pharmacol Exp Ther. 2011; 338:518–27. [DOI] [PMC free article] [PubMed] [Google Scholar]
- Joshi DC, Singh M, Krishnamurthy K, Joshi PG, Joshi NB. AMPA induced Ca2+ influx in motor neurons occurs through voltage gated Ca2+ channel and Ca2+ permeable AMPA receptor. Neurochem Int. 2011; 59(6):913–21. [DOI] [PubMed] [Google Scholar]
- Kanning KC, Kaplan A, Henderson CE. Motor neuron diversity in development and disease. Annu Rev Neurosci. 2010; 33:409–40. [DOI] [PubMed] [Google Scholar]
- Kawahara Y, Ito K, Sun H, Kanazawa I, Kwak S. Low editing efficiency of GluR2 mRNA is associated with a low relative abundance of ADAR2 mRNA in white matter of normal human brain. Eur J Neurosci. 2003; 18:23–33. [DOI] [PubMed] [Google Scholar]
- Kawahara Y, Kwak S, Sun H, Ito K, Hashida H, et al. Human spinal motoneurons express low relative abundance of GluR2 mRNA: an implication for excitotoxicity in ALS. J Neurochem. 2003; 85:680–9. [DOI] [PubMed] [Google Scholar]
- Kwak S, Kawahara Y. Deficient RNA editing of GluR2 and neuronal death in amyotropic lateral sclerosis. J. Mol. Med. (Berl) 2005; 83:110–20. [DOI] [PubMed] [Google Scholar]
- Kwak S, Hideyama T, Yamashita T, Aizawa H. AMPA receptor-mediated neuronal death in sporadic ALS. Neuropathology. 2010; 30:182–8. [DOI] [PubMed] [Google Scholar]
- Laslo P, Lipski J, Nicholson LF, Miles GB, Funk GD. Calcium binding proteins in motoneurons at low and high risk for degeneration in ALS. Neuroreport. 2000; 11 (15):3305–8. [DOI] [PubMed] [Google Scholar]
- Limke TL, Atchison WD. Acute exposure to methylmercury opens the mitochondrial permeability transition pore in rat cerebellar granule cells. Toxicol Appl Pharmacol. 2002; 178(1):52–61. [DOI] [PubMed] [Google Scholar]
- Maier O, Bóhm J, Dahm M, Brück S, Beyer C, Johann S. Differentiated NSC-34 motorneuron-like cells as experimental model for cholinergic neurodegeneration. Neurochem Int. 2013; 62:1029–38. [DOI] [PubMed] [Google Scholar]
- Marty MS, Atchison WD. Pathways mediating Ca2+ entry in rat cerebellar granule cells following in vitro exposure to methyl mercury. Toxicol Appl Pharmacol. 1997; 147:319–30. [DOI] [PubMed] [Google Scholar]
- Marty MS, Atchison WD. Elevations of intracellular Ca2+ as a probable contributor to decreased viability in cerebellar granule cells following acute exposure to methylmercury. Toxicol Appl Pharmacol. 1998; 150(1):98–105. [DOI] [PubMed] [Google Scholar]
- Møller-Madsen B Localization of mercury in CNS of the rat. II. Intraperitoneal injection of methylmercuric chloride (CH3HgCl) and mercuric chloride (HgCl2). Toxicol Appl Pharmacol. 1990; 103:303–23. [DOI] [PubMed] [Google Scholar]
- Møller-Madsen B Localization of mercury in CNS of the rat. III. Oral administration of methylmercuric chloride (CH3HgCl). Fundam Appl Toxicol. 1991; 16:172–87. [PubMed] [Google Scholar]
- Ohkubo M, Miyamoto A, Shiraishi M. Heavy metal chelator TPEN attenuates fura-2 fluorescence changes induced by cadmium, mercury and methylmercury. J Vet Med Sci. 2016; 78(5):761–7. [DOI] [PMC free article] [PubMed] [Google Scholar]
- Pardo NE, Hajela RK, Atchison WD. Acetylcholine release at neuromuscular junctions of adult tottering mice is controlled by N-(cav2.2) and R-type (cav2.3) but not L-type (cavl.2) Ca2+ channels. J Pharmacol Exp Ther. 2006; 319:1009–20. [DOI] [PubMed] [Google Scholar]
- Praline J, Guennoc AM, Limousin N, Hallak H, de Toffol B, Corcia P. ALS and mercury intoxication: a relationship? Clin Neurol Neurosurg. 2007; 109:880–3. [DOI] [PubMed] [Google Scholar]
- Ramanathan G, Atchison WD. Ca2+ entry pathways in mouse spinal motor neurons in culture following in vitro exposure to methylmercury. Neurotoxicology. 2011; 32:742–50. [DOI] [PMC free article] [PubMed] [Google Scholar]
- Rice D Evidence for delayed neurotoxicity produced by methylmercury. Neurotoxicology. 1996; 17:583–96. [PubMed] [Google Scholar]
- Roos PM, Vesterberg O, Nordberg M. Metals in motor neuron diseases. Exp Biol Med (Maywood). 2006; 231:1481–7. [DOI] [PubMed] [Google Scholar]
- Sceniak MP, Spitsbergen JB, Sabo SL, Yuan Y, and Atchison WD. Acute neurotoxicant exposure induces hyperexcitability in mouse lumbar spinal motor neurons. J. Neurophysiol 2020; 123:1448–59. [DOI] [PMC free article] [PubMed] [Google Scholar]
- Su M, Wakabayashi K, Kakita A, Ikuta F, Takahashi H. Selective involvement of large motor neurons in the spinal cord of rats treated with methylmercury. J Neurol Sci. 1998; 156:12–7. [DOI] [PubMed] [Google Scholar]
- Sutedja NA, Veldink JH, Fischer K, Kromhout H, Heederik D, et al. Exposure to chemicals and metals and risk of amyotrophic lateral sclerosis: A systematic review. Amyotroph Lateral Scler. 2009; 10:302–9. [DOI] [PubMed] [Google Scholar]
- Wade L Gold's dark side. Science. 2013; 341:1448–9. [DOI] [PubMed] [Google Scholar]
- Weiss B, Clarkson TW, Simon W. Silent latency periods in methylmercury poisoning and in neurodegenerative disease. Environ Health Perspect. 2002; 110 Suppl 5:851–4. [DOI] [PMC free article] [PubMed] [Google Scholar]
- Yang F, Liu Y, Tu J, Wan J, Zhang J et al. Activated astrocytes enhance the dopaminergic differentiation of stem cells and promote brain repair through bFGF. Nat Commun. 2014; 5:5627. [DOI] [PMC free article] [PubMed] [Google Scholar]


