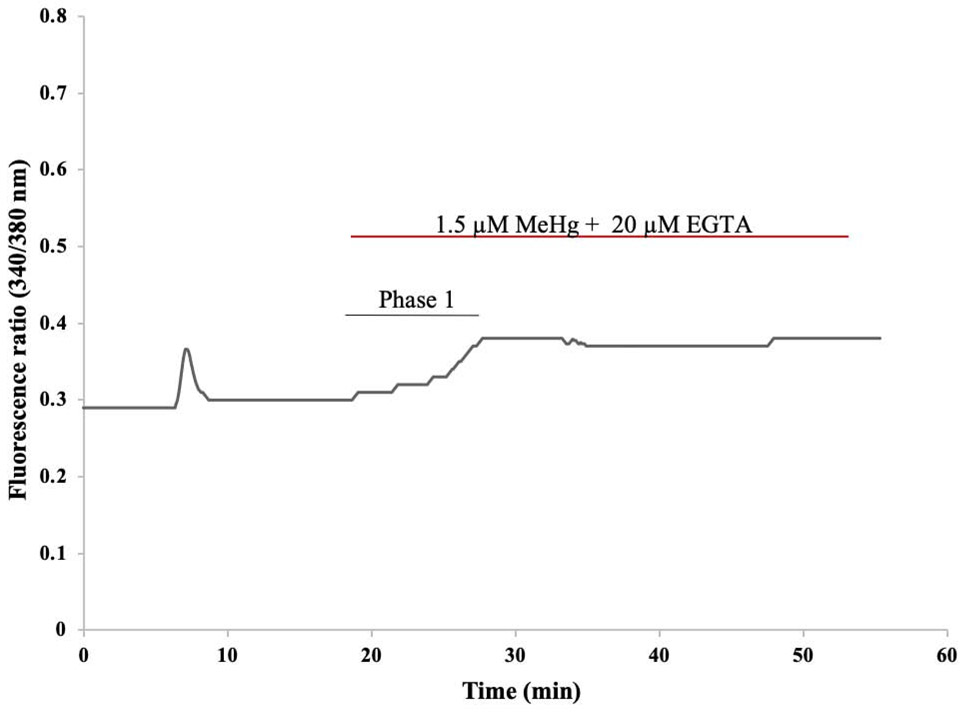
Figure 12. Representative tracing of fura-2 fluorescence ratio F(340/380) from a hiPSC-MN during exposure to 1.5 μM MeHg + 20 μM EGTA.
The initial peak represents increase in Ca2+ as a result of depolarization of the cell after 1 min exposure to 40 mM KCl. Subsequent exposure to 1.5 μM MeHg + 20 μM EGTA-containing HBS (Ca2+ free HBS) removed the 2nd phase normally observed with MeHg exposure. This demonstrates that the 2nd phase is dependent on the influx of extracellular Ca2+.

