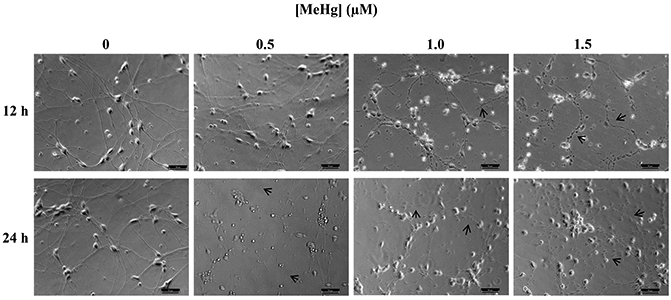
Figure 5. Effect of 12 or 24 hr MeHg exposure on hiPSC-MNs morphology assessed immediately after exposure.

Micrographs of hiPSC-MNs exposed to MeHg for 12 or 24 hr present alterations in cell morphology (note arrows) in the form of neurite beading and fragmentation. Micrographs are brightfield images of hiPSC-MNs taken in 20x magnification. Scale bar = 50 μM.
