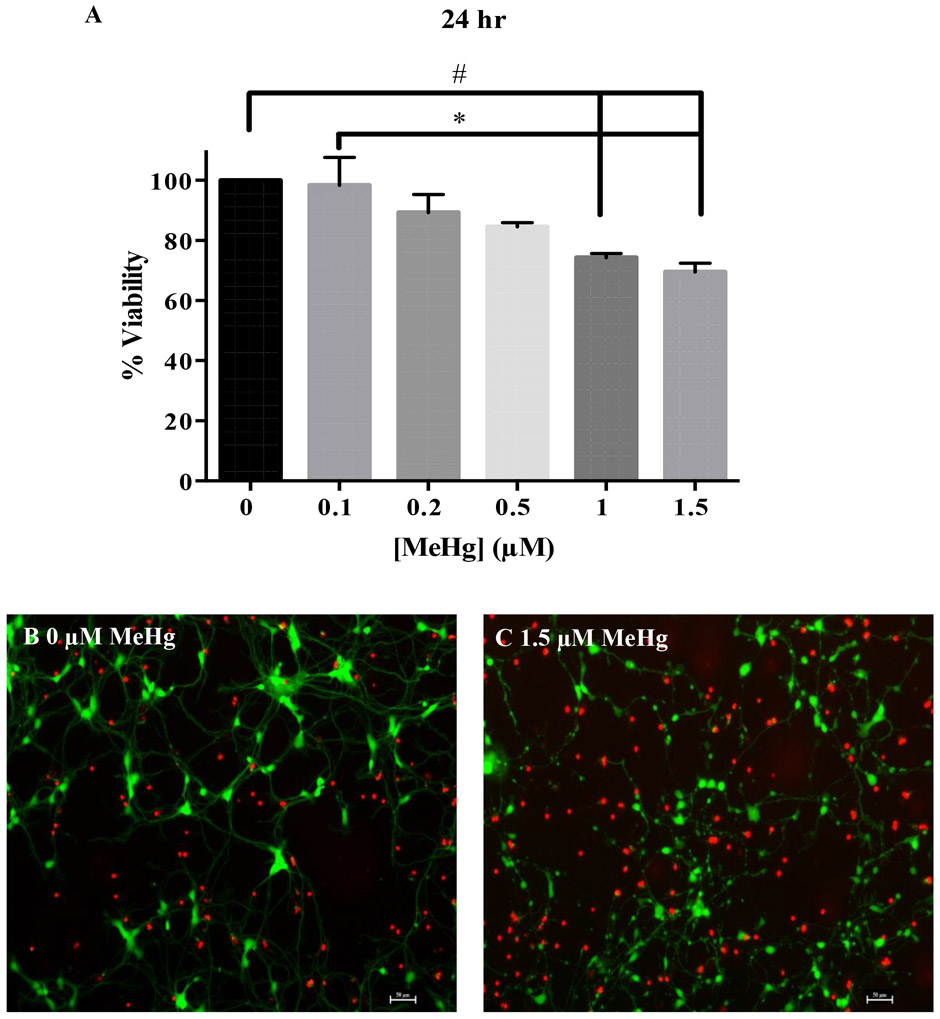
Figure 7. Delayed effects of MeHg in cell viability were assessed 24 hr after exposure.
Cell viability measured with calcein-AM/ethidium homodimer showed a concentration dependent cell death in hiPSC-MNs after exposure to 0.1 - 1.5 μM MeHg for 1 hr and assessed after 24 hr (A). Representative micrograph of 0 μM MeHg (B) and 1.5 μM MeHg-exposed hiPSC-MNs (C) after labeling for cell viability using calcein-AM (green) and Eth-D (red). The number sign (#) indicates a significant difference from control (0 μM MeHg). The asterisk (*) indicates a significant difference between 0.1 μM compared to 1.0 and 1.5 μM MeHg exposure (p ≤ 0.05) as determined by One-Way ANOVA and Tukey’s post hoc test. Values are represented as mean ± SEM (n = 3). Scale bar = 50 μM.

