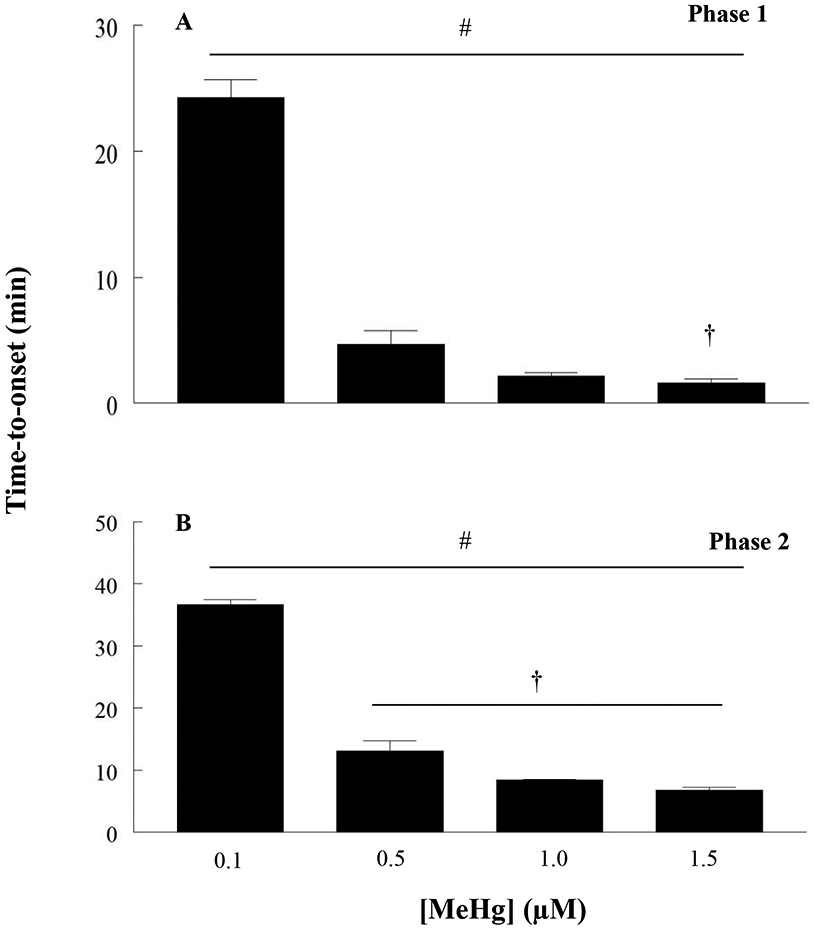
Figure 9. Time-to-onset of increase in fura-2 fluorescence during perfusion of hiPSC-MNs with MeHg (0.1 - 1.5 μM) in normal HBS.

Untreated hiPSC-MNs maintain a basal fura-2 fluorescence for more than 60 min. The number sign (#) indicates a significant difference between 0.1 μM versus 0.5 μM, 1 μM and 1.5μM, the dagger (†) indicates a significant difference between 0.5 μM versus 1.5 μM. In phase 2, (#) indicates significant difference between 0.1 μM versus 0.5 μM, 1 μM and 1.5 μM, (†) indicates a significant difference between 0.5 μM versus 1.0 μM and 1.5 μM (p ≤ 0.05) as determined by Two-Way ANOVA and Bonferroni’s post hoc test. Values are represented as mean ± SEM (n ≥ 4). Each n represents the recording of fura-2 fluorescence value from the soma of 6 - 10 hiPSC-MNs per dish.
