

Abstract
Objective
To characterise the symptoms of coronavirus disease 2019 (covid-19).
Design
Population based cohort study.
Setting
Iceland.
Participants
All individuals who tested positive for severe acute respiratory syndrome coronavirus 2 (SARS-CoV-2) by reverse transcription polymerase chain reaction (RT-PCR) between 17 March and 30 April 2020. Cases were identified by three testing strategies: targeted testing guided by clinical suspicion, open invitation population screening based on self referral, and random population screening. All identified cases were enrolled in a telehealth monitoring service, and symptoms were systematically monitored from diagnosis to recovery.
Main outcome measures
Occurrence of one or more of 19 predefined symptoms during follow-up.
Results
Among 1564 people positive for SARS-CoV-2, the most common presenting symptoms were myalgia (55%), headache (51%), and non-productive cough (49%). At the time of diagnosis, 83 (5.3%) individuals reported no symptoms, of whom 49 (59%) remained asymptomatic during follow-up. At diagnosis, 216 (14%) and 349 (22%) people did not meet the case definition of the Centers for Disease Control and Prevention and the World Health Organization, respectively. Most (67%) of the SARS-CoV-2-positive patients had mild symptoms throughout the course of their disease.
Conclusion
In the setting of broad access to RT-PCR testing, most SARS-CoV-2-positive people were found to have mild symptoms. Fever and dyspnoea were less common than previously reported. A substantial proportion of SARS-CoV-2-positive people did not meet recommended case definitions at the time of diagnosis.
Introduction
On 31 December 2019, the first cases of an atypical pneumonia of unidentified aetiology were reported in Wuhan, China.1 One week later, a novel betacoronavirus, later named severe acute respiratory syndrome coronavirus (SARS-CoV-2), was identified as the causative pathogen,2 3 and the disease subsequently termed coronavirus disease 2019 (covid-19). The World Health Organization (WHO) declared the covid-19 outbreak a pandemic on 11 March 2020.4
Covid-19 has a wide range of clinical manifestations, ranging from an asymptomatic state or mild respiratory symptoms to severe viral pneumonia and acute respiratory distress syndrome.5 6 7 Previous publications have suggested that, among identified symptomatic cases, approximately 81% have mild symptoms, 14% have severe symptoms, and 5% become critically ill.8 Besides respiratory symptoms, dysosmia, dysgeusia, abdominal pain, diarrhoea, and rash have been described.5 9 Most published studies on the clinical characteristics of covid-19 have been retrospective5 8 10 11 and limited to inpatients12 13 and therefore do not capture the full clinical spectrum of the disease.
The first case of covid-19 in Iceland was diagnosed on 27 February 2020.14 Icelandic health authorities responded immediately by isolating infected people and instituting systematic contact tracing and quarantine of exposed individuals.15 Broad access to real-time reverse transcriptase polymerase chain reaction (RT-PCR) testing became available in Iceland early in the course of the pandemic, resulting in one of the highest rates of SARS-CoV-2 testing in the world.16 Approximately one month after the first case was identified in Iceland, the incidence of undetected SARS-CoV-2 infections was found to be only 0.6% by random population screening using RT-PCR.14 A subsequent study found that only 56% of individuals positive for SARS-CoV-2 antibodies had been diagnosed by RT-PCR.17 All SARS-CoV-2-positive individuals were actively monitored at a newly established covid-19 outpatient clinic at Landspitali–The National University Hospital (LUH).15 18 The contact tracing and containment strategies implemented by the Icelandic authorities rapidly curbed the epidemic, with only 12 new cases diagnosed between 1 May and 15 June.14
In this paper, we describe the analysis of prospectively collected data on all people who tested positive for SARS-CoV-2 by RT-PCR in Iceland and characterise the epidemiology and full clinical spectrum of covid-19 in this nationwide cohort.
Methods
Study population and design
This population based cohort study included all people who tested positive for SARS-CoV-2 by RT-PCR between 27 February and 30 April 2020 and were actively monitored at LUH. All individuals in Iceland who tested positive for SARS-CoV-2 were immediately contacted, instructed to isolate, and enrolled in a telehealth monitoring service. Monitoring involved frequent telephone interviews by a nurse or physician, through which the patient’s clinical status was evaluated. From 27 February to 16 March 2020, the content and documentation of these interviews was at the discretion of the nurse or physician making the call. On 17 March, a standardised data entry form was built directly into the national electronic medical record system, facilitating a structured approach to the clinical evaluation of patients with covid-19. The study was approved by the National Bioethics Committee (VSN-20-078).
Virological testing
RT-PCR was used for detection of SARS-CoV-2 RNA in nasopharyngeal and oropharyngeal swabs, based on the WHO recommended protocol from Charité, Berlin,19 or using a commercial kit (TaqMan 2019-nCoV Assay from Thermo Fisher Scientific) as previously described.15 Three testing protocols were implemented: targeted testing, open invitation population screening, and random population screening. Targeted testing was performed at LUH, whereas population screening was carried out by deCODE genetics, a biopharmaceutical company based in Reykjavik.15 Targeted testing began on 31 January 2020 and included clinically suspected cases and individuals at high risk of exposure, though exposure was not a requirement for testing. Open invitation population screening began on 13 March 2020 and was available to all Icelandic residents who were not in quarantine and did not have symptoms that prompted targeted testing. Finally, a randomly chosen sample of 6782 Icelanders was offered testing via telephone text message on 31 March and 1 April 2020.
Data collection
To confirm the completeness of telehealth enrolment, results of all SARS-CoV-2 testing were obtained from databases of LUH and deCODE genetics. Negative samples were used for denominator calculations. Baseline characteristics of SARS-CoV-2-positive patients and longitudinal data on symptom progression until 22 May were obtained from the standardised data entry forms used by the covid-19 clinic. Data on clinical outcomes were extracted from LUH database. Data were linked using government issued national identification numbers. Population demographics were obtained from Statistics Iceland (https://www.statice.is/).
Telehealth monitoring service
The initial patient interviews were conducted by a physician who informed the patients of the diagnosis, evaluated their health, and instructed them to self isolate at home. A checklist of 19 specific symptoms was used during the initial and all subsequent interviews. The list of symptoms was developed based on findings reported in the literature at the time when the telehealth monitoring was being launched and with respect to symptoms reported by the first 200 Icelanders who contracted covid-19. The list was subsequently refined, taking into account symptoms described by patients during the early interviews and was formally introduced on 17 March. From this point onwards the checklist remained unchanged. Furthermore, the patients were asked during every interview if additional symptoms were present. Finally, the patients’ baseline characteristics were documented, including past medical history, medication use, and social history.
Based on the symptoms documented during the interviews, patients were classified into one of three categories of clinical severity: low severity (defined as mild and improving symptoms); moderate severity (mild dyspnoea, cough, or fever for less than five days); and high severity (worsening dyspnoea, worsening cough, high or persistent fever for five days or longer, or lethargy). The frequency of follow-up interviews ranged from daily to every fourth day depending on clinical severity, age, and underlying conditions. Patients with concerning symptoms were referred for evaluation at the covid-19 clinic.
Patients were released from isolation and discharged from telehealth monitoring when they met both of the following criteria: 14 days had passed since the diagnosis of covid-19, and they had been asymptomatic for the past seven consecutive days.
Case definitions
Patients were considered symptomatic due to covid-19 using three different definitions: (a) reporting at least one of the 19 symptoms; (b) WHO case definition of suspected covid-19, which included fever and at least one other symptom of acute respiratory infection, such as cough or shortness of breath20; (c) Centers for Disease Control and Prevention (CDC) interim case definition of covid-19, which included either two of the following symptoms—fever, rigor, myalgia, headache, sore throat, dysosmia, dysgeusia—or one of the following symptoms—cough, shortness of breath, difficulty breathing.21 Individuals who did not fulfill these definitions at the time of diagnosis or during follow-up were determined to be asymptomatic. Otherwise, they were considered presymptomatic at the time of diagnosis.
Statistical analysis
The incidence of covid-19 was calculated by age and sex, using both the Icelandic population and all SARS-CoV-2 tested individuals as denominators. Patients were followed until discharge from the telehealth monitoring service, hospital admission, death, or end of the study period (22 May 2020). Patients enrolled before the implementation of the standardised data entry form (17 March 2020) were excluded from the analysis of symptoms and symptom progression.
The progression of covid-19 symptoms was analysed using parametric cure-mixture models and logistic regression. The time frame used in the analyses was days from symptom onset to discharge from telehealth monitoring. The data were interval censored due to the intermittent schedule of the interviews. To account for this, the cumulative incidence of symptom occurrence was estimated with the non-parametric Turnbull estimator and a parametric cure-mixture model using the log-logistic distribution. The proportion of patients experiencing a specific symptom per day was estimated employing logistic regression that allowed for non-linear effects using a three-knot restricted cubic spline. Missing information between interviews was addressed by multiple imputation using chained equations, performed with additive regression, bootstrapping and predictive mean matching procedure.22 The number of imputations equaled the highest proportion of missing data for any variable multiplied by 100. The added uncertainty due to imputation was fully accounted for in the logistic regression models. The result was compared with a complete-case analysis and naive up-down filling procedure. All statistical analyses were performed in R version 3.6.3.
Patient and public involvement
Neither patients nor the public were involved in the design, conduct, reporting, or dissemination planning of the study. Members of the research team were instrumental in creating and implementing the local response to the pandemic and were involved in care of patients with covid-19. The urgency of designing and conducting the research precluded patient or public involvement.
Results
Demographics and clinical characteristics
A total of 45 105 individuals (12% of the Icelandic population) underwent 47 800 RT-PCR tests for SARS-CoV-2 from 31 January to 30 April 2020. Of those, 16 750 (37%) underwent targeted testing, 26 762 (59%) participated in open invitation population screening, and 3924 (8.7%) in random population screening (fig 1). A small proportion of people (3.5%) were tested by more than one of the three testing strategies. No individual tested positive by more than one testing strategy. The participation rate in random screening among the 6782 people invited was 56%. The population incidence of SARS-CoV-2-positive people was 4.9 per 1000 individuals, and 39 per 1000 individuals tested were positive. This rate differed between the three testing strategies; the rate was 96 per 1000 individuals who underwent targeted testing, 5.9 per 1000 tested in open invitation population screening, and 5.1 per 1000 tested in random population screening.
Fig 1.

Flowchart describing the derivation of the study cohort
All people who tested positive were enrolled in telehealth monitoring or admitted to hospital, with no exceptions. The median time from symptom onset until RT-PCR diagnosis and the enrolment interview was four days (interquartile range (IQR) 2-7 days), and a median of six (IQR 4-8) interviews were conducted per individual during telehealth monitoring. The median time between interviews was two days (IQR 1-3). The clinical progression from symptom onset for the 1797 positive individuals is shown in figure 2. Thirty two of those patients were diagnosed after being admitted to hospital, of whom one was diagnosed post mortem (fig 1). Table 1 shows the characteristics of the SARS-CoV-2-positive cohort categorised by testing strategy. We did not identify differences in relevant baseline characteristics between individuals diagnosed by targeted testing, open invitation population screening, or random population screening. However, the small size of the groups representing some of these features precludes meaningful analysis. Of the 1797 SARS-CoV-2-positive individuals, 101 (5.6%) were admitted to hospital, 27 (1.5%) were admitted to an intensive care unit, and 16 (0.9%) required mechanical ventilation. The median length of hospital stay was 8 days (IQR 3.5-19), and 10 (0.6%) patients died. The total number of documented symptoms at diagnosis was lower among people diagnosed before the implementation of standardised symptom monitoring compared with those diagnosed after the implementation (supplemental fig S1 on bmj.com). The latter group was therefore used to study symptom development and progression (fig 1).
Fig 2.

Changes in severity of symptoms from onset to end of follow-up among SARS-CoV-2-positive individuals. The category “not yet diagnosed” comprises people yet to be enrolled in telehealth monitoring, and whose clinical severity had therefore not been evaluated. The severity of symptoms was categorised as low (mild and improving symptoms), moderate (mild dyspnoea, cough, or fever for less than 5 days), or high (worsening dyspnoea, worsening cough, high or persistent fever for 5 days or longer, or lethargy). The top panel includes all SARS-CoV-2-positive people. The other panels show people categorised by age; 0-9, 10-19, 20-39, 40-64, and ≥65 years
Table 1.
Characteristics of SARS-CoV-2-positive individuals according to testing strategy
| Targeted testing | Open population screening | Random population screening | |
|---|---|---|---|
| No of people | 1619 | 158 | 20 |
| Median (IQR) age (years) | 42.0 (26.0-55.0) | 39.0 (29.0-49.0) | 45.0 (33.75-54.75) |
| No (%) of females | 822 (50.8) | 72 (45.6) | 9 (45.0) |
| Median (IQR) body mass index | 24.5 (22.6-29.6) | 27.5 (23.6-30.9) | 27.6 (24.5-31.2) |
| No (%) of people with: | |||
| Lung disease | 237 (14.6) | 22 (13.9) | 1 (5.0) |
| Diabetes | 71 (4.4) | 3 (1.9) | 1 (5.0) |
| Hypertension | 254 (15.7) | 19 (12.0) | 4 (20.0) |
| Cardiovascular disease | 141 (8.7) | 6 (3.8) | 1 (5.0) |
| Chronic kidney disease | 36 (2.2) | 1 (0.6) | 1 (5.0) |
| Cancer | 81 (5.0) | 4 (2.5) | 0 |
| Current smoking | 77 (4.8) | 7 (4.4) | 2 (10.0) |
| Clinical severity of covid-19 at enrolment (No (%)): | |||
| Low | 1276 (78.8) | 147 (93.0) | 19 (95) |
| Moderate | 227 (14.0) | 6 (3.8) | 1 (5.0) |
| High | 68 (4.2) | 2 (1.3) | 0 |
| Hospital admission (No (%)) | 100 (6.2) | 1 (0.6) | 0 |
| Admisison to intensive care unit (No (%)) | 27 (1.7) | 0 | 0 |
IQR=interquartile range.
Of the 1564 (87%) people who were followed using the standardised data entry form, 791 (51%) were female and their median age was 40 years (IQR 26-53, range 0-103). Among these 1564 people, 1055 (67%) were classified as having low disease severity throughout the follow-up period, 55 (3.5%) were admitted to hospital, and 13 (0.8%) required intensive care, with six (0.4%) also receiving mechanical ventilation. Two (0.1%) patients died. The median follow-up was 15 days (IQR 14-18), resulting in 69.2 person-years of follow-up time. A total of 1509 people completed the telehealth follow-up from diagnosis until discharge. The observation time of the remaining 55 patients who were admitted to hospital was censored at the time of admission, after a median follow-up of four days (IQR 2.5-8).
Symptoms at diagnosis
Of the 1564 people with standardised symptom documentation, 668 (43%) had experienced fever at diagnosis. Cough (n=940, 60%), dyspnoea (n=496, 32%), and gastrointestinal symptoms (n=558, 36%) were also commonly reported. Eighty three (5.3%) people reported no symptoms at diagnosis, which was more commonly noted among those diagnosed through open invitation population screening (n=32/135, 24%) and random population screening (n=6/20, 30%), than among individuals diagnosed by targeted testing (n=45/1409, 3.2%). Of the 83 people who were asymptomatic at diagnosis, 49 (59%) did not develop any symptoms throughout the telehealth monitoring, while the remaining 34 (41%) developed symptoms after a median of three days (IQR 3-4.75). All people diagnosed by random population screening who were asymptomatic at diagnosis remained so during follow-up, compared with 19 of 32 (59%) individuals identified by open invitation population screening and 24 of 45 (53%) diagnosed by targeted testing.
Using the CDC case definition, the symptoms reported by 216 of 1564 (14%) SARS-CoV-2-positive people were not consistent with covid-19 at the time of diagnosis. This was more common among individuals diagnosed through open invitation population screening (n=54/135, 40%) and random population screening (n=9/20, 45%), than by targeted testing (n=153/1409, 11%). Seventy two (33%) of those people developed symptoms compatible with the CDC case definition at a median of five days (IQR 3-6) from diagnosis, whereas the other 144 (67%) never met the CDC criteria. Similarly, 349 of 1564 (22%) individuals did not fulfill the WHO case definition at the time of diagnosis, a finding that was more commonly observed among those diagnosed through open invitation population screening (n=59/135, 44%) and random population screening (n=12/20, 60%), than by targeted testing (n=278/1409, 20%). The WHO criteria were later met by 115 (33%) individuals at a median of four days (IQR 3-6) from diagnosis, while the remaining 234 (67%) people never fulfilled the criteria.
The cumulative incidence and proportion of infected individuals meeting CDC and WHO criteria by number of days from symptom onset is shown in supplemental figure S2 on bmj.com. Among the 216 individuals who did not meet CDC criteria at diagnosis, four (1.9%) were admitted to hospital later in the course of their disease, and one required mechanical ventilation. Similarly, four (1.1%) of the 349 individuals who did not fulfill the WHO criteria at diagnosis were admitted to hospital for illness related to covid-19, two of whom required intensive care. Among the 372 people who did not have symptoms consistent with WHO or with CDC criteria at diagnosis, the most common symptoms were headache (n=140, 38%), rhinorrhoea (n=128, 34%), dysosmia (n=123, 33%), and dysgeusia (n=122, 33%), with 241 (65%) individuals experiencing at least one of these symptoms.
Symptoms at disease onset
As shown in table 2, the most common symptoms at the onset of covid-19 were myalgia (54.6% (95% CI 50.6% to 58.6%)), headache (51.2% (46.8% to 55.7%)), and non-productive cough (49.3% (45.2% to 53.3%)). Overall, 83.0% (80.6% to 85.1%) of individuals experienced at least one generalised symptom and 62.9% (59.1% to 66.6%) at least one upper respiratory symptom. Multiple imputation logistic regression produced acceptable results as compared with complete case analysis and a naive up-down filling procedure (supplemental figs S3-S6). Symptoms occurring on days when interviews were not conducted were imputed. The proportion of people with missing information on symptoms was highest during the first days following symptom onset (supplemental table S1).
Table 2.
Proportion of SARS-CoV-2-positive people who experienced specific symptoms and symptom constellations on days 1, 3, 7, and 14 from symptom onset. The cumulative incidence of the specific symptoms by day 14 is shown in the last column. All values are percentages with 95% confidence intervals
| Symptoms | Proportion of people experiencing a symptom per day* | Cumulative incidence by day 14† | |||
|---|---|---|---|---|---|
| Symptom onset | Day 3 | Day 7 | Day 14 | ||
| Generalised: | 83.0 (80.6 to 85.1) | 78.0 (75.9 to 80.0) | 65.3 (63.9 to 66.7) | 40.2 (39.0 to 41.5) | 92.7 (91.2 to 93.8) |
| Fever ≥38°C | 41.3 (36.9 to 45.8) | 32.0 (29.2 to 34.9) | 17.8 (16.6 to 19.2) | 7.3 (6.5 to 8.2) | 47.3 (44.8 to 49.8) |
| Rigor, chills | 31.4 (27.3 to 35.9) | 23.5 (21.0 to 26.3) | 12.5 (11.5 to 13.6) | 5.0 (4.6 to 5.6) | 41.6 (39.3 to 44.0) |
| Headache | 51.2 (46.8 to 55.7) | 45.7 (42.4 to 48.9) | 35.1 (33.5 to 36.6) | 20.7 (19.6 to 21.7) | 71.4 (69.0 to 73.7) |
| Myalgia | 54.6 (50.6 to 58.6) | 44.6 (41.7 to 47.5) | 26.9 (25.6 to 28.3) | 10.5 (9.8 to 11.3) | 61.4 (58.9 to 63.8) |
| Lethargy | 37.5 (33.3 to 41.9) | 37.1 (34.1 to 40.3) | 35.7 (34.3 to 37.2) | 26.6 (25.4 to 27.8) | 72.7 (70.3 to 74.7) |
| Loss of appetite | 23.1 (19.9 to 26.8) | 22.1 (19.7 to 24.7) | 19.6 (18.3 to 20.9) | 11.8 (11.0 to 12.6) | 44.4 (41.8 to 46.9) |
| Upper respiratory: | 62.9 (59.1 to 66.6) | 60.2 (57.4 to 63.0) | 54.0 (52.5 to 55.5) | 36.9 (35.7 to 38.1) | 85.9 (84.1 to 87.6) |
| Rhinorrhea | 33.3 (29.2 to 37.8) | 28.8 (26.0 to 31.7) | 21.0 (19.7 to 22.4) | 12.0 (11.2 to 12.9) | 52.9 (50.4 to 55.3) |
| Sore throat | 33.7 (29.3 to 38.5) | 27.6 (24.8 to 30.6) | 18.0 (16.9 to 19.2) | 9.7 (8.9 to 10.5) | 44.1 (41.5 to 46.5) |
| Dysosmia | 20.5 (17.4 to 23.9) | 23.0 (20.5 to 25.6) | 27.3 (25.9 to 28.8) | 23.2 (22.3 to 24.2) | 54.5 (51.9 to 56.9) |
| Dysgeusia | 23.1 (19.7 to 26.7) | 25.5 (22.9 to 28.4) | 29.7 (28.2 to 31.2) | 24.1 (23.1 to 25.0) | 55.8 (53.4 to 58.0) |
| Lower respiratory: | 63.1 (59.5 to 66.6) | 61.0 (58.4 to 63.6) | 56.3 (54.9 to 57.7) | 42.2 (41.0 to 43.5) | 79.2 (76.9 to 81.2) |
| Non-productive cough | 49.3 (45.2 to 53.3) | 45.2 (42.3 to 48.0) | 37.1 (35.7 to 38.5) | 23.6 (22.5 to 24.7) | 64.2 (61.8 to 66.6) |
| Productive cough | 13.4 (11.1 to 16.4) | 14.4 (12.5 to 16.6) | 16.0 (14.8 to 17.2) | 14.4 (13.6 to 15.3) | 35.4 (32.9 to 37.8) |
| Any dyspnoea | 25.2 (22.1 to 28.6) | 26.0 (23.7 to 28.5) | 27.0 (25.7 to 28.3) | 21.0 (20.0 to 22.1) | 49.5 (46.9 to 51.9) |
| Dyspnoea at rest | 4.5 (3.3 to 6.2) | 4.6 (3.6 to 5.8) | 4.5 (3.9 to 5.2) | 3.6 (3.2 to 4.1) | 13.7 (12.0 to 15.3) |
| Gastrointestinal: | 30.0 (26.0 to 34.4) | 26.9 (24.1 to 29.9) | 21.0 (19.6 to 22.5) | 11.1 (10.3 to 12.0) | 48.2 (45.7 to 50.6) |
| Nausea | 13.0 (10.6 to 15.7) | 11.8 (10.2 to 13.6) | 9.6 (8.7 to 10.5) | 5.1 (4.6 to 5.6) | 25.0 (22.9 to 27.2) |
| Vomiting | 3.4 (2.2 to 5.3) | 2.7 (1.9 to 3.8) | 1.7 (1.3 to 2.2) | 0.9 (0.6 to 1.3) | 4.8 (3.9 to 5.9) |
| Abdominal pain | 11.1 (8.7 to 14.0) | 9.2 (7.6 to 11.0) | 6.3 (5.6 to 7.2) | 3.8 (3.4 to 4.4) | 22.3 (20.3 to 24.2) |
| Diarrhoea | 13.7 (11.1 to 16.9) | 12.5 (10.6 to 14.6) | 10.1 (9.2 to 11.1) | 6.0 (5.4 to 6.6) | 28.0 (25.7 to 30.2) |
The predicted proportion of SARS-CoV-2-positive individuals who experience a symptom at the designated day from symptom onset, as estimated by multiple imputation logistic regression.
The cumulative incidence of a symptom by day 14 from symptom onset, as estimated by the parametric cure-mixture model.
Compared with people diagnosed by targeted testing, those diagnosed through either open invitation or random population screening were less likely to have experienced cardinal symptoms of covid-19 at disease onset, including fever (635/1409 (45%) v 33/155 (21%)), cough (877 (62%) v 63 (41%)), dyspnoea (473 (34%) v 23 (15%)) and gastrointestinal symptoms (530 (38%) v 28 (18%)). Other symptoms categorised according to testing strategy are shown in supplemental figures S7-S10.
The proportion of patients experiencing specific symptoms by sex and age group is displayed in supplemental figures S11-S14. The initial presentation of covid-19 varied only slightly between the sexes. The proportion experiencing fever or gastrointestinal symptoms at onset was similar between age groups, but cough and dyspnoea were more common among older individuals (supplemental fig S13).
Differences in symptoms at onset between patients who were admitted to hospital and those who were not are shown in supplemental figures S15-S18. Symptoms at disease onset were more common among patients who were later admitted to hospital, including generalised symptoms (94% v 83%), lower respiratory symptoms (70% v 63%), and gastrointestinal symptoms (48% v 29%). However, the proportion of patients who experienced upper respiratory symptoms was lower, 48% compared with 64% of those who were never admitted to hospital.
Progression of symptoms
By day 21 from disease onset, the most commonly experienced symptoms were lethargy (74.7% (95% CI 72.5% to 76.9%)), headache (73.0% (70.6% to 75.2%)), and productive or non-productive cough (72.8% (70.2% to 75.1%)). Overall, 93.1% (91.6% to 94.3%) had experienced at least one generalised symptom, 87.2% (85.2% to 88.8%) at least one upper respiratory symptom, and 80.3% (78.2% to 82.3%) at least one lower respiratory symptom. The cumulative incidence of fever, dyspnoea, and gastrointestinal symptoms by day 21 were 47.8%, 52.0%, and 50.1%, respectively (fig 3). Of those who eventually developed fever, 85.2% had done so by the third day of their illness. Similarly, 80.2% had experienced cough, 52.2% dyspnoea, and 62.0% gastrointestinal symptoms by day three. The proportion of people who had developed each symptom was comparable regardless of sex or age group (supplemental figures S19-S30).
Fig 3.
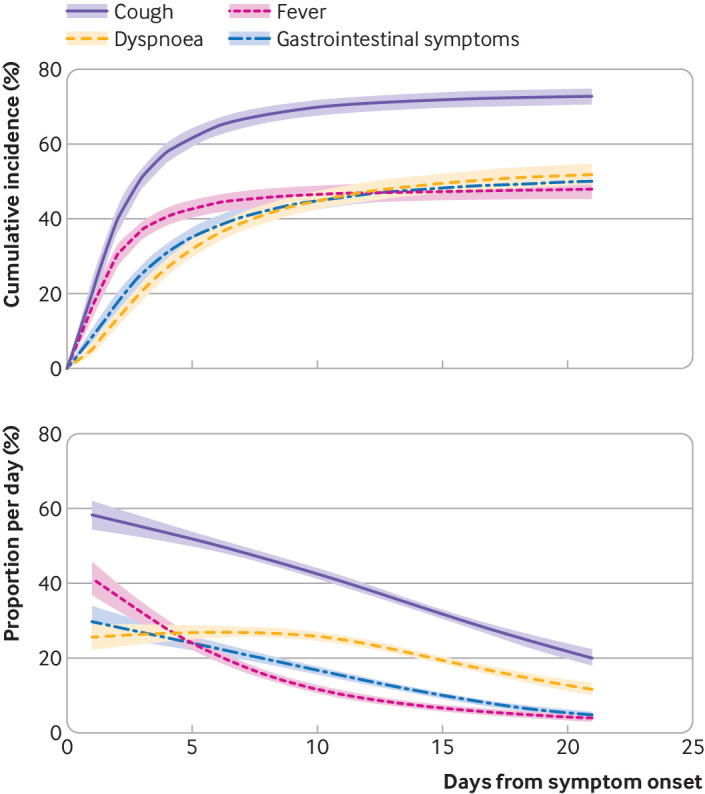
Cumulative incidence and proportion of SARS-CoV-2-positive individuals who experienced cough, dyspnoea, fever, and gastrointestinal symptoms by days from symptom onset. The parametric cure-mixture estimate of the cumulative incidence is illustrated in the upper panel with the 95% confidence interval shown as a shaded area. The lower panel depicts the logistic regression estimate of the proportion of infected individuals who experience each symptom by day (95% confidence intervals shown as a shaded area)
Of the 19 symptoms, only dysosmia and dysgeusia were more common later in the disease course than at symptom onset. Both symptoms peaked on day eight from diagnosis. The trend was most pronounced among individuals aged 25 to 55 years and was more marked among females (supplemental fig S12). Other symptoms attributed to covid-19 were most prevalent during the onset of the disease. No symptom exhibited a bimodal pattern (supplemental figs S11-S14). The cumulative incidence of each specific symptom was lower among people diagnosed through population screening compared with targeted testing, except for rhinorrhea and vomiting (supplemental figs S31-S34). By day 21, a large proportion of patients who were ever admitted to hospital for covid-19 had experienced cough (96.0% (95% CI 76.3% to 98.4%)), fever (91.0% (68.6% to 95.7%)), gastrointestinal symptoms (84.8% (64.7% to 91.5%)), and dyspnoea (82.7% (65.7% to 91.1%)) (supplemental figs S35-S38).
Discussion
In this study, we examined the clinical characteristics of covid-19 among people diagnosed by RT-PCR in a national population based cohort. Our prospectively collected data on symptoms and disease progression revealed that 73% experienced cough, 52% dyspnoea, and 48% fever. At the time of diagnosis, 5% were completely asymptomatic, 14% did not meet the CDC case definition for covid-19, and 22% did not fulfill the WHO criteria. Due to aggressive contact tracing and widespread virological testing it is likely that the cohort includes the majority of symptomatic cases in the population. This assumption is supported by the low prevalence of SARS-CoV-2 infection detected by random population screening using RT-PCR during the peak of the epidemic (0.6%),15 and by a subsequent population based study estimating that 56% of seropositive people had previously been diagnosed by RT-PCR.17
The comprehensive, nationwide characterisation of covid-19 symptoms was facilitated by broad access to diagnostic testing in Iceland. The RT-PCR test for SARS-CoV-2 was free of charge for both targeted testing and population screening, resulting in over 12% of the population being tested, which was higher than in any other country during the study period.16 As a result, we were able to describe the true spectrum of symptomatic SARS-CoV-2 infection, while previous studies were largely based on cohorts admitted to hospital or cases identified in the setting of more restrictive testing.6 12 23 Furthermore, subgroup analysis allowed us to quantify the degree by which cohorts that included only patients admitted to hospital might overestimate the presence of specific symptoms—such as fever, which was considerably more common at symptom onset in patients who were later admitted to hospital (74%) than in patients who were never admitted (40%).
Spectrum of symptoms and implications for case definition
The proportion of people with covid-19 who remain completely asymptomatic has been a focus of interest during the pandemic, with implications for the risk of disease dissemination. In the current study, 83 individuals reported no symptoms at the time of diagnosis, approximately half of whom developed symptoms in the ensuing days. Thus, only 3.1% of cases diagnosed by RT-PCR remained completely symptom-free during follow-up. However, as some degree of suspicion of covid-19 was needed to prompt an individual to be tested or to seek testing, symptomatic patients are likely to be overrepresented in our sample. The true proportion of SARS-CoV-2-positive people who never develop symptoms can be estimated by longitudinal follow-up of individuals diagnosed by random population screening. In the current study, six (30%) of the 20 individuals diagnosed by random population screening never developed symptoms. This finding is supported by a recent seroprevalence study in Iceland demonstrating that 44% of individuals with antibodies against SARS-CoV-2 had either not undergone RT-PCR testing or had tested negative, suggesting only mild or no symptoms among this group.17 A potential limitation of the random screening approach are uncertainties regarding the sensitivity and specificity of RT-PCR for detection of SARS-CoV-2.
Most of the included people experienced only minor symptoms. Only 22% of patients developed moderate symptoms, 8% severe symptoms, and 3.5% required hospital admission. The standardised prospective recording of clinical symptoms made it possible to evaluate the sensitivity of the widely used CDC21 and WHO20 case definitions for the diagnosis of covid-19 throughout the course of the disease. By applying these definitions, we demonstrate that a substantial number of cases would have been missed; approximately 9% by the CDC criteria and 15% by the WHO criteria. The identification of additional 4% and 7% of cases would have been delayed by a median of five days and four days, respectively. These are concerning observations with immediate implications for current efforts to curtail the pandemic. Our data show that most patients have mild symptoms that may not have prompted the consideration of covid-19 by either patients or healthcare providers in more resource-limited settings, and indicate a need for revising and widening the CDC and WHO case definitions to increase their sensitivity.
Comparison with other studies
Symptoms observed among patients with mild forms of covid-19 have previously been examined in a multicentre European study of 1420 people with positive RT-PCR test results who answered a questionnaire.10 Severely ill patients were excluded, and the remaining cohort was predominantly female (68%), young (94% <60 years old), and biased towards healthcare workers (31% of the group).10 While these results are not easily generalisable to the entire population, the investigators found that only 7% of patients required hospital admission,10 compared with 3.5% in the present study. Headache, loss of smell, and nasal obstruction were the most common symptoms identified.10 Although these symptoms were also frequently identified in our cohort, we found cough and myalgia to be more common. The predominance of loss of smell identified in the aforementioned study agrees with our observation that olfactory symptoms are most common in the younger age groups.10
We found that slightly less than half of patients developed fever during the course of the disease, already present in 85% of those by day 3. This is consistent with the study by Lechien et al, who noted fever ≥38.0°C in 45.4% of cases,10 while it is higher than what was reported by Guan et al (21.7%)5 and Goyal et al (25%).12 A meta-analysis by Sun et al found that 89% of covid-19 patients had a fever ≥37.3°C,6 but this definition of fever is rarely used in clinical practice. Over the follow-up period, 70% of patients in our study experienced cough, which is consistent with the findings of Lechien et al, who observed cough in 63% of cases.10 In total, 52% of patients reported any dyspnoea and only 14% described dyspnoea at rest during the course of the disease. The reported incidence of dyspnoea ranges from 22% to 49%,7 10 24 but most previous studies do not differentiate between dyspnoea at rest and dyspnoea on exertion. Gastrointestinal symptoms were common in our study, reported by almost half of patients at some point during the first 14 days. Abdominal pain (22%) and diarrhoea (28%) were frequent, as in previous studies.12 25 Interestingly, although a quarter of patients experienced nausea, vomiting was rare.
Our findings indicate a lower rate of hospital admissions and mortality in Iceland compared with many other countries. The reasons for these disparate outcomes are likely multifactorial. Iceland has a relatively young population, with 85.8% under 65 years old, compared with 77.1% in Italy, 80.6% in Spain, 81.6% in the UK, and 83.5% in the US.26 27 The relatively young population, in addition to a strong emphasis on limiting the exposure of elderly and multimorbid individuals, resulted in a low median age of confirmed covid-19 cases of 40 years (IQR 26-53) in Iceland compared with 51 years (IQR 36-65) among all cases reported to the WHO28 and 48 years (IQR 33-63) in the US.29 Hence, the strategy to protect susceptible individuals seems to have been effective. In the recent seroprevalence study in Iceland, the infection fatality rate was estimated to be 0.3%.17 Different rates of specific risk factors for inferior outcomes in covid-19 are unlikely to explain this difference as they seem to have a similar distribution in Iceland as in other countries. For instance, 29% of Icelandic adults have hypertension30 and 27% are obese.31 Nevertheless, these differences and the homogenous population in Iceland may limit the generealisability of our findings to other nations and geographical areas.
Strengths and limitations
This study does have limitations. We do not have information on SARS-CoV-2-negative individuals, and therefore the baseline rate of symptoms that resemble those of covid-19 in the population is unknown. The rate of such symptoms in the community is not zero, and therefore some of the symptoms attributed to SARS-CoV-2 in this study may be due to other causes. However, this is unlikely to affect the overall interpretation of our findings as there was a strong temporal relation between the diagnosis and the onset and resolution of symptoms. It is also noteworthy that, in order to accurately describe symptom progression, cases diagnosed before the implementation of the standardised clinical data entry form were excluded from the analysis of symptom development, representing 11% of all SARS-CoV-2-positive cases in Iceland. The date of implementation of the standardised data entry form was not influenced by the clinical characteristics of the patients being diagnosed, and therefore should not introduce bias. Furthermore, the demographics and clinical characteristics of excluded cases were largely comparable to those that were included in the study.
Another limitation is that daily standardised documentation of symptoms was not available during hospital admission. This could conceivably lead to an underestimation of severe symptoms such as dyspnoea. However, only 3.5% of the included patients were admitted to hospital, and symptoms before hospitalisation were included in the analysis. It is important to note that the data were based on self reported symptoms via telephone calls. This shortcoming is mitigated by the fact that experienced nurses and physicians conducted the interviews.
Finally, our study was concerned with the symptomatology of the acute phase of covid-19. It has become apparent that patients may experience prolonged symptoms after their initial infection.32 Telehealth monitoring was discontinued after the resolution of the acute illness, and we therefore cannot characterise the nature of long term symptoms of covid-19.
A principal strength of the study is its population based approach, which included all confirmed cases in the country during the study period regardless of their need for medical care.
Conclusions
This report describes the symptomatology and clinical severity of covid-19 in Iceland. The incidence of covid-19 was high due to extensive testing of both symptomatic and asymptomatic individuals, while disease severity was lower than previously reported. Symptoms such as fever and dyspnoea were less common than has been observed in earlier studies. Our findings suggest that both the CDC and WHO case definitions of covid-19 lack sensitivity and miss a substantial proportion of patients, including patients who later develop severe disease.
What is already known on this topic
The symptoms of SARS-CoV-2 infection are predominantly respiratory in nature with fever, cough, and sore throat being commonly reported, and loss of smell and taste identified as more specific symptoms
However, most studies describing the symptomatology have been limited to patients who required hospital admission and often ascertained symptoms only at a single point in time
What this study adds
In this population based cohort, common presenting symptoms of SARS-CoV-2 included myalgia (55%), headache (51%), and non-productive cough (49%)
Most infected individuals had mild symptoms. At diagnosis, 14% did not meet the Centers for Disease Control and Prevention case definition for suspected covid-19, and 22% did not meet the World Health Organization definition
Acknowledgments
We thank Pall Melsted, Hilma Holm, Daniel F Gudbjartsson, and Kari Stefansson at deCODE genetics, Reykjavik, Iceland, for their invaluable assistance in providing access to data and reviewing the manuscript; Clifford Anderson-Bergman at Lawrence Livermore National Laboratory, Livermore, CA, USA for statistical advice; and Andrea Haraldsson, Reykjavik, Iceland, for secretarial assistance.
Web extra.
Extra material supplied by authors
Appendix: Supplementary table S1 and supplementary figs S1 to S38
Contributors: EE, DH, RFI, HKB, LBO, BA, AB, BJ, OG, MG, MIS, OSI, and RP developed the concept of the study. EE, DH, HKB, LBO, VB, HLR, SB, ASA, KO, HHT, and GK participated in aquiring data. EE, LBO, MIS, and RP were responsible for data curation. EE developed the methodology. EE, DH, MIS, OSI, and RP analysed the data. MIS, OSI, and RP provided supervision. EE, DH, RFI, HKB, LBO, and AB wrote the original draft of the manuscript. EE, DH, RFI, HKB, LBO, VB, HLR, SB, ASA, KO, HHT, GK, BA, AB, BJ, OG, MG, MIS, OSI, and RP reviewed and edited the manuscript. The corresponding author attests that all listed authors meet authorship criteria and that no others meeting the criteria have been omitted. RP is guarantor for the study.
Funding: No specific funding was provided for the study.
Competing interests: All authors have completed the ICMJE uniform disclosure form at www.icmje.org/coi_disclosure.pdf and declare: no support from any organisation for the submitted work; no financial relationships with any organisations that might have an interest in the submitted work in the previous three years; and no other relationships or activities that could appear to have influenced the submitted work.
Ethical approval: The study was approved by the National Bioethics Committee (VSN-20-078).
Data sharing: The data that support the findings of this study are available from the corresponding author on reasonable request.
The lead author affirms that this manuscript is an honest, accurate, and transparent account of the study being reported; that no important aspects of the study have been omitted; and that any discrepancies from the study as planned (and, if relevant, registered) have been explained.
Dissemination to participants and related patient and public communities: Once the manuscript is published, dissemination of the findings will be carried out by issuing a press release that we anticipate will lead to domestic media coverage. The results will be shared on social media, both from individual authors and from our institutions, Landspitali–The National University Hospital and the University of Iceland. The results will be presented at medical conferences. Neither patients nor the public will be involved in dissemination of the findings, but will have access to the results.
Provenance and peer review: Not commissioned; externally peer reviewed.
References
- 1.World Health Organization. Pneumonia of unknown cause—China. 2020. https://www.who.int/csr/don/05-january-2020-pneumonia-of-unkown-cause-china/en/.
- 2. Zhou P, Yang XL, Wang XG, et al. A pneumonia outbreak associated with a new coronavirus of probable bat origin. Nature 2020;579:270-3. 10.1038/s41586-020-2012-7 [DOI] [PMC free article] [PubMed] [Google Scholar]
- 3. Zhu N, Zhang D, Wang W, et al. China Novel Coronavirus Investigating and Research Team A novel coronavirus from patients with pneumonia in China, 2019. N Engl J Med 2020;382:727-33. 10.1056/NEJMoa2001017 [DOI] [PMC free article] [PubMed] [Google Scholar]
- 4.World Health Organization. Coronavirus disease 2019 (COVID-19): situation report—51. 2020. https://www.who.int/docs/default-source/coronaviruse/situation-reports/20200311-sitrep-51-covid-19.pdf.
- 5. Guan WJ, Ni ZY, Hu Y, et al. China Medical Treatment Expert Group for Covid-19 Clinical characteristics of coronavirus disease 2019 in China. N Engl J Med 2020;382:1708-20. 10.1056/NEJMoa2002032 [DOI] [PMC free article] [PubMed] [Google Scholar]
- 6. Sun P, Qie S, Liu Z, Ren J, Li K, Xi J. Clinical characteristics of hospitalized patients with SARS-CoV-2 infection: A single arm meta-analysis. J Med Virol 2020; 10.1002/jmv.25735. [DOI] [PMC free article] [PubMed] [Google Scholar]
- 7. Rodriguez-Morales AJ, Cardona-Ospina JA, Gutiérrez-Ocampo E, et al. Latin American Network of Coronavirus Disease 2019-COVID-19 Research (LANCOVID-19). Clinical, laboratory and imaging features of COVID-19: a systematic review and meta-analysis. Travel Med Infect Dis 2020;34:101623. 10.1016/j.tmaid.2020.101623 [DOI] [PMC free article] [PubMed] [Google Scholar]
- 8. Wu Z, McGoogan JM. Characteristics of and important lessons from the coronavirus disease 2019 (COVID-19) outbreak in China: summary of a report of 72 314 cases from the Chinese Center for Disease Control and Prevention. JAMA 2020;323:1239-42. 10.1001/jama.2020.2648 [DOI] [PubMed] [Google Scholar]
- 9. Tian S, Hu N, Lou J, et al. Characteristics of COVID-19 infection in Beijing. J Infect 2020;80:401-6. 10.1016/j.jinf.2020.02.018 [DOI] [PMC free article] [PubMed] [Google Scholar]
- 10. Lechien JR, Chiesa-Estomba CM, Place S, et al. COVID-19 Task Force of YO-IFOS Clinical and epidemiological characteristics of 1420 European patients with mild-to-moderate coronavirus disease 2019. J Intern Med 2020;288:335-44. 10.1111/joim.13089 [DOI] [PMC free article] [PubMed] [Google Scholar]
- 11. COVID-19 National Emergency Response Center, Epidemiology and Case Management Team, Korea Centers for Disease Control and Prevention Early epidemiological and clinical characteristics of 28 cases of coronavirus disease in South Korea. Osong Public Health Res Perspect 2020;11:8-14. 10.24171/j.phrp.2020.11.1.03 [DOI] [PMC free article] [PubMed] [Google Scholar]
- 12. Goyal P, Choi JJ, Pinheiro LC, et al. Clinical characteristics of Covid-19 in New York City. N Engl J Med 2020;382:2372-4. 10.1056/NEJMc2010419 [DOI] [PMC free article] [PubMed] [Google Scholar]
- 13. Wu J, Liu J, Zhao X, et al. Clinical characteristics of imported cases of coronavirus disease 2019 (covid-19) in Jiangsu province: a multicenter descriptive study. Clin Infect Dis 2020;71:706-12. [DOI] [PMC free article] [PubMed] [Google Scholar]
- 14.The Directorate of Health in Iceland and The Department of Civil Protection and Emergency Management. COVID-19 in Iceland - statistics. 2020. https://www.covid.is/data.
- 15. Gudbjartsson DF, Helgason A, Jonsson H, et al. Spread of SARS-CoV-2 in the Icelandic population. N Engl J Med 2020. 10.1056/NEJMoa2006100. [DOI] [PMC free article] [PubMed] [Google Scholar]
- 16.Hasell J, Ortiz-Ospina E, Mathieu E, et al. Daily COVID-19 tests per thousand people. 2020. https://ourworldindata.org/grapher/full-list-daily-covid-19-tests-per-thousand?country=ECU+IND+IDN+SEN+KOR+USA+LTU+NZL+ISL.
- 17. Gudbjartsson DF, Norddahl GL, Melsted P, et al. Humoral immune response to SARS-CoV-2 in Iceland. N Engl J Med 2020;383:1724-34. 10.1056/NEJMoa2026116 [DOI] [PMC free article] [PubMed] [Google Scholar]
- 18. Helgason D, Eythorsson E, Olafsdottir LB, et al. Beating the odds with systematic individualized care: Nationwide prospective follow-up of all patients with COVID-19 in Iceland. J Intern Med 2020. 10.1111/joim.13135 [DOI] [PMC free article] [PubMed] [Google Scholar]
- 19. Corman VM, Landt O, Kaiser M, et al. Detection of 2019 novel coronavirus (2019-nCoV) by real-time RT-PCR. Euro Surveill 2020;25:2000045. 10.2807/1560-7917.ES.2020.25.3.2000045 [DOI] [PMC free article] [PubMed] [Google Scholar]
- 20.World Health Organization. Global Surveillance for human infection with coronavirus disease (COVID-19). 2020. https://www.who.int/publications-detail/global-surveillance-for-human-infection-with-novel-coronavirus-(2019-ncov).
- 21.Centers for Disease Control and Prevention. Coronavirus disease 2019 (COVID-19): 2020 interim case definition, approved April 5, 2020. https://wwwn.cdc.gov/nndss/conditions/coronavirus-disease-2019-covid-19/case-definition/2020/.
- 22.Hmisc: Harrell Miscellaneous. R package version 4.4-0. 2020.
- 23. Colaneri M, Sacchi P, Zuccaro V, et al. COVID19 IRCCS San Matteo Pavia Task Force Clinical characteristics of coronavirus disease (COVID-19) early findings from a teaching hospital in Pavia, North Italy, 21 to 28 February 2020. Euro Surveill 2020;25:2000460. 10.2807/1560-7917.ES.2020.25.16.2000460 [DOI] [PMC free article] [PubMed] [Google Scholar]
- 24. Li LQ, Huang T, Wang YQ, et al. COVID-19 patients’ clinical characteristics, discharge rate, and fatality rate of meta-analysis. J Med Virol 2020;92:577-83. 10.1002/jmv.25757 [DOI] [PMC free article] [PubMed] [Google Scholar]
- 25. Nobel YR, Phipps M, Zucker J, et al. Gastrointestinal symptoms and coronavirus disease 2019: a case-control study from the United States. Gastroenterology 2020;159:373-375.e2. 10.1053/j.gastro.2020.04.017 [DOI] [PMC free article] [PubMed] [Google Scholar]
- 26.United States Census Bureau. National population by characteristics: 2010-2019. https://www.census.gov/data/tables/time-series/demo/popest/2010s-national-detail.html.
- 27.Eurostat. Population by age group. 2020. https://ec.europa.eu/eurostat/databrowser/view/tps00010/default/table?lang=en.
- 28.World Health Organization. Coronavirus disease 2019 (COVID-19): situation report – 89. 2020. https://www.who.int/docs/default-source/coronaviruse/situation-reports/20200418-sitrep-89-covid-19.pdf?sfvrsn=3643dd38_2.
- 29. Stokes EK, Zambrano LD, Anderson KN, et al. Coronavirus disease 2019 case surveillance - United States, January 22-May 30, 2020. MMWR Morb Mortal Wkly Rep 2020;69:759-65. 10.15585/mmwr.mm6924e2 [DOI] [PMC free article] [PubMed] [Google Scholar]
- 30.European Society of Cardiology. Country report Iceland - December 2013. https://www.escardio.org/static-file/Escardio/Subspecialty/EACPR/iceland-country-report.pdf.
- 31.OECD/European Observatory on Health Systems and Policies. 2019. Iceland: Country Health Profile 2019, State of Health in the EU. https://ec.europa.eu/health/sites/health/files/state/docs/2019_chp_is_english.pdf..
- 32. Carfì A, Bernabei R, Landi F, Gemelli Against COVID-19 Post-Acute Care Study Group Persistent symptoms in patients after acute COVID-19. JAMA 2020;324:603-5. 10.1001/jama.2020.12603 [DOI] [PMC free article] [PubMed] [Google Scholar]
Associated Data
This section collects any data citations, data availability statements, or supplementary materials included in this article.
Supplementary Materials
Appendix: Supplementary table S1 and supplementary figs S1 to S38