

Abstract
Background
Fetal growth restriction (FGR) is associated with an increased susceptibility for various noncommunicable diseases in adulthood, including cardiovascular and renal disease. During FGR, reduced uteroplacental blood flow, oxygen and nutrient supply to the fetus are hypothesized to detrimentally influence cardiovascular and renal programming. This study examined whether developmental programming profiles, especially related to the cardiovascular and renal system, differ in human umbilical vein endothelial cells (HUVECs) collected from pregnancies complicated by placental insufficiency-induced FGR compared to normal growth pregnancies. Our approach, involving transcriptomic profiling by RNA-sequencing and gene set enrichment analysis focused on cardiovascular and renal gene sets and targeted DNA methylation assays, contributes to the identification of targets underlying long-term cardiovascular and renal diseases.
Results
Gene set enrichment analysis showed several downregulated gene sets, most of them involved in immune or inflammatory pathways or cell cycle pathways. seven of the 22 significantly upregulated gene sets related to kidney development and four gene sets involved with cardiovascular health and function were downregulated in FGR (n = 11) versus control (n = 8). Transcriptomic profiling by RNA-sequencing revealed downregulated expression of LGALS1, FPR3 and NRM and upregulation of lincRNA RP5-855F14.1 in FGR compared to controls. DNA methylation was similar for LGALS1 between study groups, but relative hypomethylation of FPR3 and hypermethylation of NRM were present in FGR, especially in male offspring. Absolute differences in methylation were, however, small.
Conclusion
This study showed upregulation of gene sets related to renal development in HUVECs collected from pregnancies complicated by FGR compared to control donors. The differentially expressed gene sets related to cardiovascular function and health might be in line with the downregulated expression of NRM and upregulated expression of lincRNA RP5-855F14.1 in FGR samples; NRM is involved in cardiac remodeling, and lincRNAs are correlated with cardiovascular diseases. Future studies should elucidate whether the downregulated LGALS1 and FPR3 expressions in FGR are angiogenesis-modulating regulators leading to placental insufficiency-induced FGR or whether the expression of these genes can be used as a biomarker for increased cardiovascular risk. Altered DNA methylation might partly underlie FPR3 and NRM differential gene expression differences in a sex-dependent manner.
Keywords: Developmental programming, DNA methylation, Epigenetics, Fetal growth restriction, FPR3, Gene set enrichment analysis, Human umbilical cord vein endothelial cells, LGALS1, NRM, RNA-sequencing, Sex differences
Introduction
Fetal growth restriction (FGR) describes the condition in which the fetus fails to reach its genetically determined growth potential. FGR most commonly results from placental insufficiency, in which a reduced uteroplacental blood flow, oxygen, and nutrients toward the fetus lead to aberrant fetal growth. Compensatory physiological mechanisms are set in motion, such as fetal hemodynamic redistribution over organs and epigenetic alterations; while these fetal adaptations might improve fetal survival, they are considered to be unfavorable in the long run.
FGR is linked to an increased susceptibility for various noncommunicable diseases in adulthood, including cardiovascular and renal disease [1–4]. The Developmental Origins of Health and Disease (DOHaD) hypothesis states that this predisposition originates in the womb, when the adverse in utero environment influences epigenetic developmental programming [5–7]. Preclinical research strongly supports sex-specific programming of cardiovascular and renal disease in FGR offspring [8]. However, evidence for this concept has been less evident in humans [9, 10]. Epigenetic differences have been observed in placental tissue and cord blood collected from pregnancies in which babies were born with a low birth weight (as a surrogate marker for FGR). Most studies investigated DNA methylation and identified epigenetic DNA methylation markers related to impaired fetal growth [11, 12].
While placental tissue can be used to examine gene expression or epigenetic changes in pregnancies complicated by FGR, this tissue consists of a combination of maternal and fetal cells. Therefore, human umbilical vein endothelial cells (HUVECs) can be used to examine the fetal profile of disrupted growth without contamination by maternal cells. Therefore, HUVECs are especially relevant cell type in context of the fetal origin of cardiorenal disease. The few studies performed in cultured HUVECs report different proteome profiles in cultured HUVECs from FGR compared to control donors and differential protein expression and DNA methylation in the eNOS pathway [13–15]. However, transcriptomic profiling by RNA-sequencing of primary HUVECs derived from FGR compared to control donors, without culturing bias, has to our knowledge not yet been reported. In addition, the expression of gene sets related to cardiovascular or renal development and function has not been analyzed in this condition.
This study aims to examine whether developmental programming profiles, especially related to the cardiovascular and renal systems, differ in HUVECs collected from pregnancies complicated by placental insufficiency-induced FGR compared to normal growth pregnancies. We explored this by whole-genome RNA-sequencing to map differential expression per gene and gene set enrichment analysis (GSEA) focussed on cardiovascular and renal development, function and health. Additionally, we performed targeted DNA methylation assays in candidate genes to gain insight in whether DNA methylation plays a regulatory role in the different expression. This approach contributes to the identification of early targets that can be aimed at to predict or prevent long-term diseases.
Methods
Study population
Pregnant women with placental insufficiency-induced FGR and pregnant woman with normal grown fetuses were included in this prospective observational study in the Wilhelmina Children’s Hospital from July 2016 to December 2017. Inclusion criteria for placental insufficiency-induced FGR cases were described [16], but in short were diagnosed by prenatal ultrasound when (1) estimated fetal weight or abdominal circumference was below 10th percentile for gestational age, in combination with (2) signs of placental insufficiency defined as abnormal blood flow patterns in umbilical artery, fetal middle cerebral artery, cerebral–placental ratio, or deflecting fetal growth rate in at least three consecutive measurements. The control group consisted of pregnancies with normal fetal growth defined as estimated fetal weight or abdominal circumference between p10–90. Percentiles of prenatal biometry were determined using the perinatology biometry calculator (http://www.perinatology.com/calculators/biometry.htm). Exclusion criteria were congenital disorders, multiple pregnancies and stillbirth. The Medical Ethical Committee of the University Medical Center Utrecht approved the study on July 19, 2016, protocol number 16-302. Written informed consent was obtained from parents prior to delivery.
Clinical data
Clinical data were derived from electronic patient records (HiX, Chipsoft B.V., the Netherlands). Maternal comorbidities and cardiovascular familiarities included BMI, and smoking, preexisting hypertension, cardiovascular or renal diseases (including congenital disorders), preeclampsia, diabetes, autoimmune disorders. Use of maternal medication was registered. Percentiles for weight and head circumference at birth were determined with Intergrowth-21st [17]. Neonatal complications included infant respiratory distress syndrome, intraventricular hemorrhage, sepsis and necrotizing enterocolitis.
HUVECs isolation
Directly after placental delivery, the umbilical cord was stored in phosphate buffered saline (PBS) solution (pH 7.2;) at 4 °C. HUVECs isolation occurred preferably within 12 h, but always within 24 h after placental delivery as described [18]. Umbilical cords from n = 8 control and n = 12 FGR cases were collected. Cannulation of the umbilical vein at one end allowed access to wash with sterile PBS (pH 7.4; Gibco by Life Technologies, Grand Island, NY). Hereafter, the umbilical cord was clamped at both ends in order to incubate with accutase (0.02 µg/ml DNase; Innovative cell technologies Inc, San Diego, CA) for 5 min in sterile PBS at 37 °C to detach the endothelial cells from the umbilical vein. Detached HUVECs in accutase were flushed out of the umbilical vein with endothelial cell growth medium-2 (97% EGM-2; basal medium and SingleQuots supplement [1.9% FBS, 0.04% hydrocortisone, 0.4% hFGF-B2, 0.1% VEGF, 0.1% R3-IGF-1, 0.1% ascorbic acid, 0.1% hEGF, 0.1% GA-1000, 0.1% heparin], Lonza Bioscience, Walkersville, MD) and centrifuged in two separate tubes for 5 min 330 g at room temperature. One pellet was resuspended in 600 μl RA1 lysis buffer (Macherey–Nagel, Düren, Germany) and 6 μl 1 M DTT and stored at − 80 °C until RNA isolation. The second pellet was resuspended in 0.5 ml EMG-2 medium and 0.5 ml freezing medium with 20% DMSO and was frozen in a freezing container overnight and stored in liquid nitrogen the next day until DNA isolation.
RNA isolation and RNA-sequencing
RNA was isolated using NucleoSpin RNA® (Macherey–Nagel), with RNA elution in 40 μl nuclease-free water. The concentration of RNA was quantified using Qubit RNA HS assay and Qubit fluorometer (Thermo Fisher). RNA-sequencing was performed as described [19]. In short, libraries were generated using NEXTFlexTM Rapid RNA-seq Kit (Bio Scientific) and sequenced by the Nextseq500 platform (Illumina) to produce 75 bp single-end reads through the Utrecht DNA sequencing facility. Reads were aligned to the human reference genome GRCh37 using STAR.
Gene set analysis
Gene set enrichment testing was performed on the hallmark (H), canonical pathway (C2-CP) and select GO term (C5) gene set collections from the Molecular Signatures Database (version 7.1) [20, 21]. Only gene sets with relation to renal or cardiovascular development, function and health were selected from the GO term gene sets (Additional file 1: Table S1). Gene sets with less than five genes in the set of selected genes (based on expression, see below) were excluded from the analysis, eventually resulting in 2167 included gene sets.
DNA isolation and methylation
Genomic DNA from HUVEC was isolated with the allprep DNA/RNA mini kit (Qiagen, Venlo, the Netherlands), following the manufacturer’s protocol. DNA quantity was measured with a Nanodrop 2000c (Thermo Scientific, Pittsburgh, PA). DNA was stored at − 80 °C until further analysis.
Targeted DNA methylation assaying was performed blindly in the significant differential expressed genes. Bisulfite conversion of 200 ng DNA was performed with the EZ DNA Methylation-Gold kit (Zymo Research, Leiden, the Netherlands) according to the manufacturers’ protocol. Pyrosequencing primers were designed for the top three differentially expressed genes targeting the promoter regions (Additional file 2: Table S2) using the PyroMark Assay design 2.0 software (Qiagen). HotStarTaq master mix (Qiagen) was used for amplification of 20 ng of bisulfite-treated DNA using the following steps: DNA polymerase activation (95 °C, 15 min), three-step cycle of denaturation (94 °C, 30 s), annealing (FPR3 54 °C, LGALS1 56 °C, and NRM 56 °C; 30 s), and extensions (72 °C, 30 s) repeated for 45 cycles in a row. The final extension was carried out at 72 °C for 7 min.
The polymerase chain reaction product was analyzed for the extent of methylation per selected CpG positions on a PyroMark Q24 (Qiagen). Data were analyzed using the PyroMark Q24 Analysis Software 2.0 (Qiagen).
Statistical analysis
Clinical data
Statistical analysis was performed in IBM SPSS Statistics 25 for Windows, version 25 (IBM Corp, Armonk, NY). Parametric data are presented as mean ± SD and tested with independent t test, nonparametric data are presented as median (minimum–maximum) and tested with Mann–Whitney, and nominal data are presented as n (%) and tested with Fisher exact. A two-sided p value of ≤ 0.05 was considered significant.
Differential expression of genes
Read counts per gene, per sample, were analyzed for global expression differences using R (version 3.5.3). Genes were selected with an expression of one count per million reads (CPM) in at least eight samples (n = 13,760 genes selected). Read counts were TMM-normalized using the calcNormFactors function from the edgeR package (version 3.24.3) [22]. TMM-normalized counts were used to assess global transcriptional profile differences of all samples by principal component analysis (PCA). Ten principal components (PC) were analyzed in the PCA analysis; values from each PC were checked for correlation to sample characteristics by the Mann–Whitney U test implemented in the SciPy package (version 0.19.0) in python (version 2.7.10). Outliers in RNA-seq data were identified and removed when (1) the number of reads was less than 1.000.000; (2) the number of nonzero genes was less than 10.000 or (3) a combination of number of nonzero genes was between 10.000 and 12.000 and a visible outlier on one of the PCA components. One outlier was identified; thus, n = 11 FGR and n = 8 control samples were selected for differential expression analysis.
Differential gene expression analysis was performed with the edgeR package (version 3.24.3) in R (version 3.5.3). Gene expression was modeled using the glmQLFit function in EdgeR [22], to a model that included patient group variables, as well as factors to capture Mode of Delivery (caesarean section vs. spontaneous delivery), Sex (male vs. female), and Gestational stage (preterm vs. term)-related gene expression variation. Differential gene expression was determined between study population groups (FGR vs. control). Differential expression statistics were obtained using the glmQLFTest functionality in edgeR; false discovery rates (FDRs) were determined using the Benjamini–Hochberg method to adjust for multiple testing and considered significant when below 0.1 (in combination with p value below 0.05) [23].
Gene set analysis
Gene set enrichment testing was performed with CAMERA, using the same linear model and contrasts as in the differential gene expression analysis (see above), and FDRs were also determined using the Benjamini–Hochberg method [23]. When a module showed ≥ 50% overlap with a higher ranking gene set, we selected the more significant gene set. Heatmaps for the gene sets related to the cardiovascular and renal development or function were created.
DNA methylation
The level of DNA methylation is given as a percentage, and since sex-specific differences have been reported in HUVECs and DNA methylation assays in other reproductive tissue, the data were analyzed with two-way ANOVA with Bonferroni multiple comparison using GraphPad Prism (version 8.4.3, San Diego, California, USA)[18, 24, 25].
Results
Study characteristics
Study characteristics are presented in Table 1. There were no maternal cardiovascular diseases diagnosed besides preexisting hypertension or preeclampsia/HELLP. Severe FGR, defined as estimated fetal weight and/or abdominal circumference below the third percentile, was observed in ten out of 11 cases within the FGR group. One out of eight in the control group and four out of 11 in the FGR group were born prematurely. No neonatal death prior to discharged occurred. None of the neonates suffered from necrotizing enterocolitis or sepsis during neonatal intensive care unit admission, interventricular hemorrhage occurred in two control patients, and idiopathic respiratory distress syndrome was diagnosed in one control and one FGR neonate.
Table 1.
Maternal and neonatal characteristics
| Control (n = 8) | FGR (n = 11) | p value | |
|---|---|---|---|
| Maternal characteristics | |||
| Age (years) | 29 ± 4 | 32 ± 5 | 0.11 |
| (Pre-pregnancy) BMI (kg/m3) | 25 ± 4 | 25 ± 4 | 0.96 |
| Preexisting hypertension, n (%) | 0 (0) | 2 (18) | 0.49 |
| Renal disease, n (%) | 0 (0) | 1 (9) | 1.00 |
| Preexistent diabetes, n (%) | 1 (13) | 0 (0) | 0.42 |
| Autoimmune disease, n (%) | 1 (13) | 1 (9) | 1.00 |
| Preeclampsia, n (%) | 0 (0) | 5 (46) | 0.05 |
| HELLP, n (%) | 0 (0) | 1 (9) | 1.00 |
| PPROM, n (%) | 3 (38) | 0 (0) | 0.06 |
| Smoking, n (%) | 2 (25) | 5 (46) | 0.63 |
| Maternal medication during pregnancy | |||
| Antihypertensive drugs, n (%) | 0 (0) | 6 (55) | 0.02 |
| Antenatal steroids, n (%) | 8 (100) | 9 (82) | 0.49 |
| MgSO4, n (%) | 3 (43)# | 4 (36) | 1.00 |
| Delivery | |||
| Caesarean section, n (%) | 2 (25) | 7 (64) | 0.17 |
| Apgar at 5 min | 8 ± 2 | 8 ± 2 | 0.28 |
| Neonatal characteristics | |||
| Sex, n (%male) | 3 (38) | 6 (55) | 0.65 |
| GA at birth (weeks) | 31.1 ± 2.6 | 34.6 ± 3.5 | 0.02 |
| Birth weight (gram) | 1681 ± 416 | 1596 ± 459 | 0.69 |
| Birth weight (percentile) | 66 ± 20 | 6 ± 12 | < 0.01 |
| - < 3rd percentile, n (%) | 0 (0) | 8 (73) | < 0.01 |
Data expressed as mean ± SD or n (%), respectively, tested with independent t test or Fisher's exact test. # represents missing data, and therefore, the percentages are calculated based on the number of observations/measurements within the control group with 7 being the lowest number of patients in a group (maximum 13% missing data). Pre-existing hypertension, preeclampsia and HELLP were defined according to the National Institute for Health and Care Excellence (NICE) guidelines [26]. GA: gestational age; HELLP: hemolysis, elevated liver enzymes and low platelet syndrome; and PPROM: preterm premature rupture of membranes
Differential expression of genes
Multidimensional scaling (MDS) plots showed clustering in the study population (FGR vs. CON) as potential modifiers, but not in delivery route, prematurity or sex (Additional file 3: Figure S1). PCA plots also showed clustering between FGR vs. CON (Additional file 4: Figure S2). All of the study characteristics were tested for association for all the first ten PCs, and study population was associated with PC1, PC3, PC4 and PC6; delivery route was associated with PC1 and PC7, and gestational stage with PC6 (Additional file 5: Table S3). Therefore, differences in expression due to sex, mode of delivery, and gestational stage were accounted for in the modeling of gene expression.
Three protein-coding genes and one long intergenic noncoding (linc)RNA gene were significantly regulated (with a FDR < 0.1; Additional file 6: Table S4) in FGR compared with control samples: 1) lectin, galactoside-binding, soluble, 1 (LGALS1), 2) formyl peptide receptor 3 (FPR3), 3) nurim nuclear envelope membrane protein (NRM), 4) lincRNA RP5-855F14.1; all protein-coding genes were downregulated and lincRNA gene was upregulated (Fig. 1).
Fig. 1.
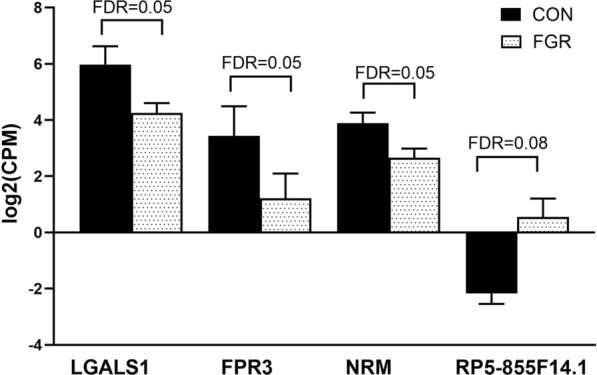
Gene expression values of the genes that significantly differed between fetal growth restriction and control. TMM normalized gene expression of lectin galactoside-binding soluble 1 (LGALS1), formyl peptide receptor 3 (FPR3), nuclear envelope membrane protein (NRM) and RP5-855F14.1 in human umbilical vein endothelial cells collected from pregnancies complicated by fetal growth restriction (FGR) compared to control (CON). CPM, count per million. Data shown as mean ± SD
Differential expression of gene sets
In total, 336 gene sets were significantly different between FGR and CON (with a FDR < 0.1; Additional file 7: Table S5). Selection of only the highest ranking gene set module (overlapping modules excluded) resulted in 193 downregulated and 22 upregulated gene sets in FGR versus control samples. The downregulated gene sets are mostly involved with immune, inflammatory or cell cycle pathways. As we were interested in risk of developing cardiovascular or renal disease, we noticed that the several gene sets related to renal development were significantly upregulated and a few related to cardiovascular health and function were downregulated in FGR samples vs. CON samples (Table 2). Heatmaps were made to study the extent of up and downregulation for the distinct genes in these gene sets in each sample (Additional file 8: Figure S3). From this analysis, most genes were up- and downregulated in accordance with the differential gene set analysis results.
Table 2.
Significantly different gene sets related to renal and cardiovascular development, function or health
| Gene set name | Up or down | p value | FDR | Brief description |
|---|---|---|---|---|
| KEGG_CARDIAC_MUSCLE_CONTRACTION | Down | 0.0002 | 0.0052 | Contraction of the heart is a complex process initiated by the electrical excitation of cardiac myocytes |
| GO_KIDNEY_EPITHELIUM_DEVELOPMENT | Up | 0.0003 | 0.0080 | The process whose specific outcome is the progression of an epithelium in the kidney over time, from its formation to the mature structure |
| GO_RENAL_FILTRATION | Up | 0.0003 | 0.0081 | Renal system process in which fluid circulating through the body is filtered through a barrier system |
| GO_RENAL_SYSTEM_VASCULATURE_DEVELOPMENT | Up | 0.0007 | 0.0126 | The process whose specific outcome is the progression of vasculature of the renal system over time, from its formation to the mature structure |
| GO_CARDIAC_SEPTUM_DEVELOPMENT | Up | 0.0009 | 0.0145 | The progression of a cardiac septum over time, from its initial formation to the mature structure |
| REACTOME_ERYTHROPOIETIN_ACTIVATES_PHOSPHOINOSITIDE_3_KINASE_PI3K | Down | 0.0012 | 0.0172 | Erythropoietin activates phosphoinositide-3-kinase |
| GO_RENAL_SYSTEM_DEVELOPMENT | Up | 0.0015 | 0.0207 | The process whose specific outcome is the progression of the renal system over time, from its formation to the mature structure |
| REACTOME_SIGNALING_BY_ERYTHROPOIETIN | Down | 0.0026 | 0.0296 | Signaling by erythropoietin |
| GO_KIDNEY_MESENCHYME_DEVELOPMENT | Up | 0.0042 | 0.0426 | The biological process whose specific outcome is the progression of a kidney mesenchyme from an initial condition to its mature state. This process begins with the formation of kidney mesenchyme and ends with the mature structure |
| REACTOME_CELL_SURFACE_INTERACTIONS_AT_THE_VASCULAR_WALL | Down | 0.0067 | 0.060 | Cell surface interactions at the vascular wall |
| REACTOME_SYNTHESIS_OF_VERY_LONG_CHAIN_FATTY_ACYL_COAS | Down | 0.0079 | 0.0671 | Synthesis of very long-chain fatty acyl-CoAs |
| GO_CELL_DIFFERENTIATION_INVOLVED_IN_KIDNEY_DEVELOPMENT | Up | 0.0088 | 0.0712 | The process in which relatively unspecialized cells acquire specialized structural and/or functional features that characterize the cells of the kidney as it progresses from its formation to the mature state |
| GO_REGULATION_OF_GLOMERULAR_FILTRATION | Up | 0.0115 | 0.0847 | Any process that modulates the frequency, rate or extent of glomerular filtration. Glomerular filtration is the process in which blood is filtered by the glomerulus into the renal tubule |
| REACTOME_TRIGLYCERIDE_METABOLISM | Down | 0.0141 | 0.0947 | Triglyceride metabolism |
Ordered according to lowest false discovery rate (FDR)
DNA methylation
The percentage methylation was measured at each individual CpG position for selected areas of the promoters of the three protein-encoding genes LGALS1, FPR3 and NRM per study population (Table 3). LGALS1 showed similar percentage of methylation at each individual CpG position between groups, independent of sex (Fig. 2). DNA hypomethylation differed between in FGR males versus CON males at CpG2 of FPR3 only (Additional file 9: Figure S4). NRM was significantly hypermethylated at CpG1 in FGR compared to control, especially in male FGR offspring (Fig. 3).
Table 3.
DNA methylation of each CpG position for the three highest significantly different expressed genes
| Gene | CpG position | Methylation (%) Control (n = 8) |
Methylation (%) FGR (n = 11) |
p value |
|---|---|---|---|---|
| LGALS1 | CpG1 | 15.88 ± 8.87 | 13.61 ± 9.44 | 0.60 |
| CpG2 | 10.71 ± 6.24 | 9.58 ± 7.30 | 0.73 | |
| CpG3 | 11.16 (9.22–23.78)† | 14.80 (8.08–23.24) | 0.86 | |
| CpG4 | 8.63 ± 4.71† | 8.05 ± 5.32 | 0.82 | |
| FPR3 | CpG1 | 93.55 ± 1.21 | 92.60 ± 1.24 | 0.11 |
| CpG2 | 96.15 ± 1.31 | 94.68 ± 2.14 | 0.10 | |
| NRM | CpG1 | 0.98 ± 0.31 | 1.72 ± 0.47 | 0.001 |
| CpG2 | 2.20 ± 0.53 | 2.21 ± 0.63 | 0.96 | |
| CpG3 | 6.97 (2.21–10.71) | 6.78 (6.03–10.30) | 0.72 | |
| CpG4 | 5.09 (3.67–10.31) | 5.76 (4.39–8.63) | 0.31 | |
| CpG5 | 3.01 ± 0.88 | 2.89 ± 0.84 | 0.77 | |
| CpG6 | 2.68 ± 0.89 | 3.09 ± 1.05 | 0.38 |
Data expressed as mean ± SD tested with independent t test or median (min–max) tested with Mann–Whitney. †7 instead of eight samples
Fig. 2.

DNA methylation at individual CpG positions for LGALS1. a The examined CpG positions in relation to the transcription start site (TSS); b DNA methylation at CpG1; c DNA methylation at CpG2; d DNA methylation at CpG3; e DNA methylation at CpG4 in fetal growth restriction (FGR) (n = 11) vs. control (n = 8). Data shown as Mean ± SD. Tested with two-way ANOVA with Bonferroni multiple comparison. LGALS1, lectin galactoside-binding soluble 1
Fig. 3.
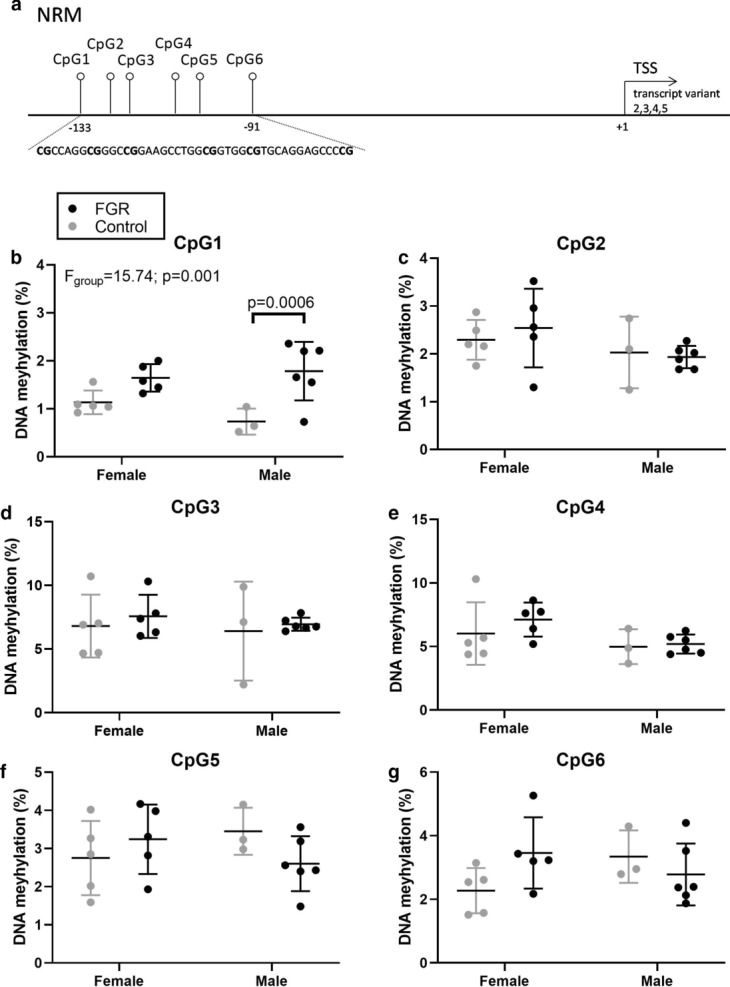
DNA methylation at individual CpG positions for NRM. a The examined CpG positions in relation to the transcription start site (TSS); b DNA methylation at CpG1; c DNA methylation at CpG2; d DNA methylation at CpG3; e DNA methylation at CpG4; f DNA methylation at CpG5; g DNA methylation at CpG6 in fetal growth restriction (FGR) (n = 11) vs. control (n = 8). Data shown as mean ± SD. Tested with two-way ANOVA with Bonferroni multiple comparison. NRM, nurim nuclear envelope membrane protein
Discussion
This study examined developmental cardiovascular and renal programming profiles in HUVECs collected from pregnancies complicated by placental insufficiency-induced FGR compared to normal growth pregnancies to identify targets underlying long-term cardiovascular and renal diseases. We report downregulated expression of the protein-coding genes LGALS1, FPR3 and NRM and upregulation of the lincRNA RP5-855F14.1 in FGR samples compared to controls. Sex-dependent DNA methylation might partially underlie FPR3 and NRM gene expression, but we did not observe this for LGALS1. Additionally, of the significantly differentially expressed gene sets, the downregulated ones were mostly involved with immune, inflammatory, or cell cycle pathways. Interestingly, seven of the 22 significantly upregulated gene sets related to kidney development and four gene sets related to cardiovascular function and health differed between FGR and control.
Downregulated expression of LGALS1
LGALS1 is the protein coding gene for galectin-1 (Gal-1) [27]. During pregnancy, Gal-1 is important for immunomodulatory and vascular adaptions required for healthy placentation [28–30]. In HUVECs, Gal-1 mediates angiogenesis via vascular endothelial growth factor receptor (VEGFR)-2 but also the neuropilin receptor (NPR)-1 which enhances the binding between VEGF and VEGFR-2 [29, 31]. Freitag et al. also showed that LGALS1 expression was downregulated in placentas derived from early-onset preeclamptic patients, which is a placental insufficiency syndrome just as in FGR and part of our study population [30]. In addition, in a mouse model inhibition of Gal-1 mediated angiogenesis resulted in preeclamptic symptoms and fetal growth restriction [30]. However, higher or no difference in Gal-1 expression was observed in term placentas from pregnancies complicated by respectively preeclampsia or FGR [32, 33]. Considering the different histopathology between early-onset and late-onset FGR (or preeclampsia), the downregulated LGALS1 expression in early-onset FGR speculatively contributes directly to placental insufficiency, while the upregulated expression observed in late-onset FGR might be secondary to relative placental–umbilical hypoxia or reduced umbilical flow [30, 32, 34]. Gal-1 has been suggested as an early marker of endothelial dysfunction, and dysregulated Gal-1 has been linked to poor blood pressure regulation and development of cardiovascular disease [27, 28]. Therefore, the finding of downregulated LGALS1 expression in our FGR samples might be the key regulator leading to placental insufficiency-induced FGR, as well as an indication for the possible higher risk of developing long-term cardiovascular dysfunction in these offspring. Epigenetic processes or post-transcriptional modifications other than DNA methylation might be involved in reduced LGALS1 expression.
Downregulated expression of FPR3 and NRM and upregulation of lincRNA RP5-855F14.1
In contrast to LGALS1, FPR3, NRM, and RP5-855F14.1 are less studied genes, especially in the context of FGR and pregnancy. To our knowledge, this is the first study reporting downregulated expression of FPR3 and NRM and upregulation of RP5-8551F14.1 in HUVECs or other pregnancy tissues collected from pregnancies complicated by FGR. One study in mice suggested that NRM might be involved in early cardiac development [35]. While lincRNAs in general have been described to be epigenetic process-associated with cardiovascular disease and development, the exact function of this specific lincRNA is unknown [24, 36]. In humans, circulating FPR3 mRNA in combination with three other circulating mRNA had a high specificity and sensitivity to predict early-onset PE [37], but little is known on FPR3 expression or function. Recent studies did link downregulated expression of FPR2—another member of the FPR family with high analogies in sequencing identity and downstream responses [38]—in placental tissue to endothelial dysfunction and placental insufficiency via impaired immunomodulatory and angiogenic processes, leading to FGR [39, 40]. FPR2 has also been described to play a protective and repairing role in ischemic heart disease and stroke [41, 42]. Considering the similarities between FPR2 and FPR3 [38], the observed downregulation of FPR3 in our placental insufficiency-induced HUVECs samples could potentially contribute to placental insufficiency in a similar manner and dysregulated FPR3 might contribute to the increased susceptibility to cardiovascular disease.
DNA methylation might partly contribute to the differential gene expression patterns of FPR3 and NRM in a sex-dependent manner. The sex dependency is especially interesting given that hypertension is more pronounced in fetal growth restricted male offspring [6, 8, 43]. However, while the methylation differences are significant for NRM, they are relatively small suggesting that the regulating role of DNA methylation in NRM expression is not strong. In addition, FPR3 is expressed, while the CpGs show hypermethylation; since the closest CpG position is almost 400 bp upstream of the TSS (although not by exclusion), its methylation possibly has little regulatory effects.
Cardiovascular and renal gene sets
We focused our gene set analysis on cardiovascular and renal development and function, since FGR has been associated with increased susceptibility to develop cardiovascular and renal disease. The four different cardiovascular gene sets, including lipid metabolism, might be in line with the cardiovascular risk profile described with dysregulated expression of LGALS1 and RP5-8551F14.1. While the gene sets related to cardiovascular development were similar in both groups, several gene sets related to kidney development were relatively upregulated in FGR. Nephrogenesis starts around 22 days of gestation and is complete at 34–36 weeks of gestation, making pregnancy the most vulnerable period to impact nephron endowment [44]. FGR has been linked to reduced nephron count and morphological differences in glomeruli, which could lead to glomerular hypertension and compensatory hyperfiltration in the remaining nephrons, causing subsequent nephron loss (Brenner hypothesis) [45]. A recent study using three different rat models for FGR also reported that molecular pathways differed in kidneys from FGR and control male offspring at birth and at postnatal day seven (end of nephrogenesis in rats) [46]. The pathways involved depended on the stage of development, and most upregulation was observed in the placental insufficiency-induced model (best matching our study population). The upregulation of the gene sets related to kidney development in our study, although not evident at individual gene level, suggests that developmental programming difference as a consequence of FGR is a subtle process. In an animal study, upregulation of renal genes in combination with wider nephrogenic zones suggested delayed nephrogenesis in FGR [47]; however, due to ethical reasons, we cannot confirm this histologically. Therefore, whether the upregulation in HUVECs represents accelerated or delayed kidney development and whether this relates to long-term renal function or disease remain to be elucidated.
Strengths and limitations
This is the first study using HUVECs to investigate developmental programming differences between placental insufficiency-induced FGR and controls by a full-transcriptome RNA-sequencing approach followed by differential gene and gene set expression analysis and follow-up DNA methylation assaying. The gene set analysis focused on cardiovascular and renal development, to specifically test the hypothesis that this correlate with increased risk for diseases of these systems can already be found during pregnancy. The transcriptomic profiling by RNA-sequencing enabled us to find FGR associated gene expression differences in an unsupervised manner, and to select genes for the analysis of DNA methylation. A major strength is that we used prenatal ultrasound measurements to clearly define the placental insufficiency-induced FGR phenotype in our study population; most studies use birth weight as surrogate marker, but this umbrella term also includes other underlying mechanisms such as congenital disorders or constitutionally small children, which have not been exposed to a hostile in utero environment. The strength of investigating HUVECs is that they allow us to investigate fetal expression differences without the interference of maternal cells. Additional strengths are that we did not culture our collected HUVECs and that we isolated the HUVECs within 24 h after delivery which limits external influences on epigenetic results.
While our strictly defined study population created a clear placental insufficiency-induced FGR phenotype, it also limited the number of included samples. However, (post hoc) power calculations for RNA-seq data are not well developed and as such not custom to use for this type of analysis. Instead, we relied on multiple testing corrects, and variation estimates build into the edgeR pipeline to properly analyze our data. Although beyond the scope of our study, we acknowledge that we cannot correlate gene expression findings to long-term outcomes. Gestational age at birth differed between groups, but we accounted for this factor in modeling gene expression and plots of gene expression per sample versus gestational age at birth showed that this was not of influence. The downside of not culturing our HUVECs was that the yielded RNA concentrations were relatively low. However, careful consideration of the number of reads and nonzero genes in all samples allowed detection and exclusion of low-quality samples. Despite extensive washing, HUVEC samples might have been contaminated with a few other fetal blood cells. Other (epi)genetic mechanisms besides DNA methylation possibly involved in differentially regulated expression of genes were not tested. Confirmation of our programming hypothesis includes verification in other tissues.
Summary and future perspectives
In conclusion, this study showed downregulated expression of LGALS1, FPR3 and NRM and upregulation of RP5-855F14.1 in HUVECs collected from placental insufficiency-induced FGR compared to control. Additionally, several gene sets related to kidney development were upregulated and a few gene sets related to cardiovascular risk were downregulated in FGR. How these findings correlate with long-term cardiovascular and renal function requires further investigation and follow-up studies. The differentially expressed genes (or their encoded protein) might be used as a biomarker, which could contribute to personalized care by predicting the risk of developing cardiorenal disease and selective follow-up of only the patients at risk. Further studies are also required to elucidate how and whether the downregulation of LGALS1 and FPR3 are causal regulators resulting in placental insufficiency-induced early-onset FGR as they might hold promise as potential novel targets for preventive treatment. While the findings of this study are the first to support the concept of developmental epigenetic programming of cardiorenal disease following placental insufficiency-induced FGR in humans, they are also merely the first of many steps toward clinical applicability.
Supplementary information
Additional file 1. Table S1: Overview of the gene sets related to renal and cardiovascular development, function and health.
Additional file 2. Table S2: primers targeting promotor regions.
Additional file 3. Figure S1: multidimensional scaling (MDS) plots.
Additional file 4. Figure S2: principal component analysis (PCA) plots of fetal growth restriction (FGR) vs. control (CTRL) .
Additional file 5. Table S3: per principal component best correlated modulator.
Additional file 6. Table S4: differential expression of FGR versus control (FGR–control).
Additional file 7. Table S5: All MsigDB gene modules, as determined by CAMERA, in gene list ranked based on a comparison of: differential expression of FGR versus control (FGR–control). Modules sorted by significance.
Additional file 8. Figure S3: heatmaps of significantly differential expressed gene sets involved in cardiovascular or renal development and disease.
Additional file 9. Figure S4: DNA methylation at individual CpG positions for FPR3.
Acknowledgements
The authors acknowledge Daniek M.C. Kapteijn, Noortje A.M. van Dungen and Rikst Nynke Verkaik-Schakel for their technical support with RNA isolation, RNA-sequencing and DNA-methylation, respectively.
Abbreviations
- CON
Control
- CPM
Count per million reads
- CTRL
Control
- DOHaD
Developmental Origins of Health and Disease
- FGR
Fetal growth restriction
- FPR3
Formyl peptide receptor 3
- GSEA
Gene set enrichment analysis
- HUVECs
Human umbilical vein endothelial cells
- LGALS1
Lectin galactoside-binding soluble 1
- NRM
Nuclear envelope membrane protein
- SD
Standard deviation
- VEGFR
Vascular endothelial growth factor receptor
Authors’ contributions
FT designed the study, recruited the participants, collected the HUVECs and clinical data, analyzed and interpreted the data, and wrote the first draft and revised the manuscript. JJAC performed bioinformatical statistics and bioinformatical analysis and edited the manuscript. TP performed DNA methylation, interpreted the data and edited the manuscript. NDP contributed to the conception of the study and collection of HUVECs and revised the manuscript. JAJ contributed to the conception of the study and interpretation of data and edited the manuscript. BBvR contributed to the conception of the study and interpretation of data and edited the manuscript. MM made bioinformatical analysis, interpreted the data and edited the manuscript. ATL contributed to the conception of the study, acquired the funding, supervised the collection and interpretation of data and edited the manuscript. All authors read and approved the final version.
Funding
This study was supported by the Dutch Kidney Foundation (15O141 [ATL]). The Dutch Kidney foundation was not involved in the design of the study, collection, analysis, interpretation of data, nor in writing of the manuscript.
Availability of data and materials
The datasets generated and/or analyzed during the current study are not publicly available due to the Dutch privacy law to protect participants, but are partly and always coded available from the corresponding author on request. All data generated or analyzed during this study are included in this published article and its supplementary information files.
Ethics approval and consent to participate
The Medical Ethical Committee of University Medical Centre (METC) of University Medical Center Utrecht approved the study on July 19, 2016; protocol number 16–302. Written informed consent was obtained from parents during pregnancy.
Consent for publication
Not applicable.
Competing interests
The authors declare that they have no competing interests.
Footnotes
Publisher's Note
Springer Nature remains neutral with regard to jurisdictional claims in published maps and institutional affiliations.
Supplementary information
Supplementary information accompanies this paper at 10.1186/s13148-020-00980-9.
References
- 1.Barker DJ. Adult consequences of fetal growth restriction. Clin Obstet Gynecol. 2006;49:270–283. doi: 10.1097/00003081-200606000-00009. [DOI] [PubMed] [Google Scholar]
- 2.Malhotra A, Allison BJ, Castillo-Melendez M, Jenkin G, Polglase GR, Miller SL. Neonatal morbidities of fetal growth restriction: pathophysiology and impact. Front Endocrinol (Lausanne). 2019;10:55. doi: 10.3389/fendo.2019.00055. [DOI] [PMC free article] [PubMed] [Google Scholar]
- 3.White SL, Perkovic V, Cass A, Chang CL, Poulter NR, Spector T, et al. Is low birth weight an antecedent of CKD in later life? A systematic review of observational studies. Am J Kidney Dis. 2009;54:248–261. doi: 10.1053/j.ajkd.2008.12.042. [DOI] [PubMed] [Google Scholar]
- 4.Demicheva E, Crispi F. Long-term follow-up of intrauterine growth restriction: cardiovascular disorders. Fetal Diagn Ther. 2014;36:143–153. doi: 10.1159/000353633. [DOI] [PubMed] [Google Scholar]
- 5.Henriksen T, Clausen T. The fetal origins hypothesis: placental insufficiency and inheritance versus maternal malnutrition in well-nourished populations. Acta Obstet Gynecol Scand. 2002;81:112–114. doi: 10.1034/j.1600-0412.2002.810204.x. [DOI] [PubMed] [Google Scholar]
- 6.Chen M, Zhang L. Epigenetic mechanisms in developmental programming of adult disease. Drugs Discov Tocay. 2012;16:1007–1018. doi: 10.1016/j.drudis.2011.09.008. [DOI] [PMC free article] [PubMed] [Google Scholar]
- 7.Sundrani D, Roy S, Jadhav A, Joshi S. Sex-specific differences and developmental programming for diseases in later life. Reprod Fertil Dev. 2017;29:2085–2099. doi: 10.1071/RD16265. [DOI] [PubMed] [Google Scholar]
- 8.Intapad S, Ojeda NB, Dasinger JH, Alexander BT. Sex differences in the developmental origins of cardiovascular disease. Physiology. 2014;29:122–132. doi: 10.1152/physiol.00045.2013. [DOI] [PMC free article] [PubMed] [Google Scholar]
- 9.Sehgal A, Alexander BT, Morrison JL, South AM. Fetal growth restriction and hypertension in the offspring: mechanistic links and therapeutic directions. J Pediatr. 2020;224:115–123. doi: 10.1016/j.jpeds.2020.05.028. [DOI] [PMC free article] [PubMed] [Google Scholar]
- 10.Dotsch J, Alejandre-Alcazar M, Janoschek R, Nusken E, Weber LT, Nusken KD. Perinatal programming of renal function. Curr Opin Pediatr. 2016;28:188–194. doi: 10.1097/MOP.0000000000000312. [DOI] [PubMed] [Google Scholar]
- 11.Küpers LK, Monnereau C, Sharp GC, Yousefi P, Salas LA, Ghantous A, et al. Meta-analysis of epigenome-wide association studies in neonates reveals widespread differential DNA methylation associated with birthweight. Nat Commun. 2019;10:1893. doi: 10.1038/s41467-019-09671-3. [DOI] [PMC free article] [PubMed] [Google Scholar]
- 12.Rutkowska K, Lukaszewicz M. Alterations to DNA structure as a cause of expression modifications of selected genes of known intrauterine-growth-restriction-association shared by chosen species—a review. Anim Genet. 2019;50:613–620. doi: 10.1111/age.12861. [DOI] [PubMed] [Google Scholar]
- 13.Krause BJ, Carrasco-Wong I, Caniuguir A, Carvajal J, Farias M, Casanello P. Endothelial eNOS/arginase imbalance contributes to vascular dysfunction in IUGR umbilical and placental vessels. Placenta. 2013;34:20–28. doi: 10.1016/j.placenta.2012.09.015. [DOI] [PubMed] [Google Scholar]
- 14.Caniuguir A, Krause B, Hernandez C, Uauy R, Casanello P. Markers of early endothelial dysfunction in intrauterine growth restriction-derived human umbilical vein endothelial cells revealed by 2D-DIGE and mass spectrometry analyses. Placenta. 2016;41:14–26. doi: 10.1016/j.placenta.2016.02.016. [DOI] [PubMed] [Google Scholar]
- 15.Krause BJ, Costello PM, Muñoz-Urrutia E, Lillycrop KA, Hanson MA, Casanello P. Role of DNA methyltransferase 1 on the altered eNOS expression in human umbilical endothelium from intrauterine growth restricted fetuses. Epigenetics. 2013;8:944–952. doi: 10.4161/epi.25579. [DOI] [PMC free article] [PubMed] [Google Scholar]
- 16.Terstappen F, Paauw ND, Alderliesten T, Joles JA, Vijlbrief C, Lely AT, et al. Elevated renal tissue oxygenation in premature fetal growth restricted neonates: an observational study. PLoS ONE. 2018;13:1–14. doi: 10.1371/journal.pone.0204268. [DOI] [PMC free article] [PubMed] [Google Scholar]
- 17.Anderson NH, Sadler LC, McKinlay CJD, McCowan LME. INTERGROWTH-21st vs customized birthweight standards for identification of perinatal mortality and morbidity. Am J Obstet Gynecol. 2016;214:509.e1–509.e7. doi: 10.1016/j.ajog.2015.10.931. [DOI] [PubMed] [Google Scholar]
- 18.Hartman RJG, Kapteijn DMC, Haitjema S, Bekker MN, Mokry M, Pasterkamp G, et al. Intrinsic transcriptomic sex differences in human endothelial cells at birth and in adults are associated with coronary artery disease targets. Sci Rep. 2020;10(1):12367. doi: 10.1038/s41598-020-69451-8. [DOI] [PMC free article] [PubMed] [Google Scholar]
- 19.Paauw ND, Lely AT, Joles JA, Franx A, Nikkels PG, Mokry M, et al. H3K27 acetylation and gene expression analysis reveals differences in placental chromatin activity in fetal growth restriction. Clin Epigenetics. 2018;10:85. doi: 10.1186/s13148-018-0508-x. [DOI] [PMC free article] [PubMed] [Google Scholar]
- 20.Wu D, Smyth GK. Camera: a competitive gene set test accounting for inter-gene correlation. Nucleic Acids Res. 2012;40:e133. doi: 10.1093/nar/gks461. [DOI] [PMC free article] [PubMed] [Google Scholar]
- 21.Liberzon A, Birger C, Ghandi M, Jill P, Tamayo P, Jolla L, et al. MSigDB H collection. Cell Syst. 2016;1:417–25. doi: 10.1016/j.cels.2015.12.004. [DOI] [PMC free article] [PubMed] [Google Scholar]
- 22.Robinson MD, McCarthy DJ, Smyth GK. edgeR: a Bioconductor package for differential expression analysis of digital gene expression data. Bioinformatics. 2010;26:139–140. doi: 10.1093/bioinformatics/btp616. [DOI] [PMC free article] [PubMed] [Google Scholar]
- 23.Benjamini Y, Hochberg Y. Controlling the false discovery rate: a practical and powerful approach to multiple testing. J R Stat Soc Ser B. 1995;57:289–300. [Google Scholar]
- 24.Haemmig S, Simion V, Yang D, Deng Y, Feinberg MW. Long noncoding RNAs in cardiovascular disease, diagnosis, and therapy. Curr Opin Cardiol. 2017;32:776–783. doi: 10.1097/HCO.0000000000000454. [DOI] [PMC free article] [PubMed] [Google Scholar]
- 25.Gong S, Johnson MD, Dopierala J, Gaccioli F, Sovio U, Constância M, et al. Genome-wide oxidative bisulfite sequencing identifies sex-specific methylation differences in the human placenta. Epigenetics. 2018;13:228–239. doi: 10.1080/15592294.2018.1429857. [DOI] [PMC free article] [PubMed] [Google Scholar]
- 26.National Institute for Health and Care Excellence. Hypertension in pregnancy: diagnosis and management [NICE Guideline No. 133]. 2019. [PubMed]
- 27.Barrientos G, Freitag N, Tirado-González I, Unverdorben L, Jeschke U, Thijssen VLJL, et al. Involvement of galectin-1 in reproduction: past, present and future. Hum Reprod Update. 2014;20:175–193. doi: 10.1093/humupd/dmt040. [DOI] [PubMed] [Google Scholar]
- 28.Seropian IM, González GE, Maller SM, Berrocal DH, Abbate A, Rabinovich GA. Galectin-1 as an emerging mediator of cardiovascular inflammation: mechanisms and therapeutic opportunities. Mediat Inflamm. 2018;2018:1–11. doi: 10.1155/2018/8696543. [DOI] [PMC free article] [PubMed] [Google Scholar]
- 29.Blois SM, Conrad ML, Freitag N, Barrientos G. Galectins in angiogenesis: Consequences for gestation. J Reprod Immunol. 2015;108:33–41. doi: 10.1016/j.jri.2014.12.001. [DOI] [PubMed] [Google Scholar]
- 30.Freitag N, Tirado-Gonzaĺez I, Barrientos G, Herse F, Thijssen VLJL, Weedon-Fekjær SM, et al. Interfering with Gal-1-mediated angiogenesis contributes to the pathogenesis of preeclampsia. Proc Natl Acad Sci USA. 2013;110:11451–11456. doi: 10.1073/pnas.1303707110. [DOI] [PMC free article] [PubMed] [Google Scholar]
- 31.Hsieh SH, Ying NW, Wu MH, Chiang WF, Hsu CL, Wong TY, et al. Galectin-1, a novel ligand of neuropilin-1, activates VEGFR-2 signaling and modulates the migration of vascular endothelial cells. Oncogene. 2008;27:3746–3753. doi: 10.1038/sj.onc.1211029. [DOI] [PubMed] [Google Scholar]
- 32.Hutter S, Knabl J, Andergassen U, Hofmann S, Kuhn C, Mahner S, et al. Placental expression patterns of galectin-1, galectin-2, galectin-3 and galectin-13 in cases of intrauterine growth restriction (IUGR) Int J Mol Sci. 2016;17:1–17. doi: 10.3390/ijms17040523. [DOI] [PMC free article] [PubMed] [Google Scholar]
- 33.Jeschke U, Mayr D, Schiessl B, Mylonas I, Schulze S, Kuhn C, et al. Expression of galectin-1, -3 (gal-1, gal-3) and the Thomsen-Friedenreich (TF) antigen in normal, IUGR, preeclamptic and HELLP placentas. Placenta. 2007;28:1165–1173. doi: 10.1016/j.placenta.2007.06.006. [DOI] [PubMed] [Google Scholar]
- 34.Tajadura V, Hansen MH, Smith J, Charles H, Rickman M, Farrell-dillon K, et al. β-catenin promotes endothelial survival by regulating eNOS activity and fl ow-dependent anti-apoptotic gene expression. Cell Death Dis. 2020;11:1–16. doi: 10.1038/s41419-020-2687-6. [DOI] [PMC free article] [PubMed] [Google Scholar]
- 35.Zhang W, Bai T, Zhang S, Xu S, Chen H, Li C. Isoforms of the nuclear envelope protein Nurim are differentially expressed during heart development in mice. Gene. 2017;627:123–128. doi: 10.1016/j.gene.2017.06.009. [DOI] [PubMed] [Google Scholar]
- 36.Goyal D, Limesand SW, Goyal R. Epigenetic responses and the developmental origins of health and disease. J Endocrinol. 2019;242:T105–T119. doi: 10.1530/JOE-19-0009. [DOI] [PubMed] [Google Scholar]
- 37.Tarca AL, Romero R, Erez O, Gudicha DW, Than NG, Benshalom-Tirosh N, et al. Maternal whole blood mRNA signatures identify women at risk of early preeclampsia: a longitudinal study. J Matern Neonatal Med. 2020 doi: 10.1080/14767058.2019.1685964. [DOI] [PMC free article] [PubMed] [Google Scholar]
- 38.Rabiet MJ, Macari L, Dahlgren C, Boulay F. N-formyl peptide receptor 3 (FPR3) departs from the homologous FPR2/ALX receptor with regard to the major processes governing chemoattractant receptor regulation, expression at the cell surface, and phosphorylation. J Biol Chem. 2011;286:26718–26731. doi: 10.1074/jbc.M111.244590. [DOI] [PMC free article] [PubMed] [Google Scholar]
- 39.Lappas M, McCracken S, McKelvey K, Lim R, James J, Roberts CT, et al. Formyl peptide receptor-2 is decreased in foetal growth restriction and contributes to placental dysfunction. Mol Hum Reprod Engl. 2018;24:94–109. doi: 10.1093/molehr/gax067. [DOI] [PubMed] [Google Scholar]
- 40.Murthi P, Rajaraman G, Erwich JJHM, Dimitriadis E. Decreased placental FPR2 in early pregnancies that later developed small-for-gestation age: a potential role of FPR2 in the Regulation of epithelial-mesenchymal transition. Cells. 2020;9:1–19. doi: 10.3390/cells9040921. [DOI] [PMC free article] [PubMed] [Google Scholar]
- 41.Heo SC, Kwon YW, Jang IH, Jeong GO, Lee TW, Yoon JW, et al. Formyl peptide receptor 2 is involved in cardiac repair after myocardial infarction through mobilization of circulating angiogenic cells. Stem Cells. 2017;35:654–665. doi: 10.1002/stem.2535. [DOI] [PubMed] [Google Scholar]
- 42.Vital SA, Becker F, Holloway PM, Russell J, Perretti M, Granger DN, et al. Formyl-peptide receptor 2/3/Lipoxin A4 receptor regulates neutrophil-platelet aggregation and attenuates cerebral inflammation: impact for therapy in cardiovascular disease. Circulation. 2016;133:2169–2179. doi: 10.1161/CIRCULATIONAHA.115.020633. [DOI] [PMC free article] [PubMed] [Google Scholar]
- 43.Kooiman J, Terstappen F, van Wagensveld L, Franx A, Wever KE, Roseboom TJ, et al. Conflicting effects of fetal growth restriction on blood pressure between human and rat offspring. Hypertension. 2020;75:806–818. doi: 10.1161/HYPERTENSIONAHA.119.14111. [DOI] [PubMed] [Google Scholar]
- 44.Nüsken E, Dötsch J, Weber LT, Nüsken KD. Developmental programming of renal function and re-programming approaches. Front Pediatr. 2018;6:1–9. doi: 10.3389/fped.2018.00036. [DOI] [PMC free article] [PubMed] [Google Scholar]
- 45.Brenner BM, Lawler EV, Mackenzie HS. The hyperfiltration theory: a paradigm shift in nephrology. Kidney Int. 1996;49:1774–1777. doi: 10.1038/ki.1996.265. [DOI] [PubMed] [Google Scholar]
- 46.Nüsken E, Fink G, Lechner F, Voggel J, Wohlfarth M, Sprenger L, et al. Altered molecular signatures during kidney development after intrauterine growth restriction of different origins. J Mol Med. 2020;98:395–407. doi: 10.1007/s00109-020-01875-1. [DOI] [PMC free article] [PubMed] [Google Scholar]
- 47.Cuffe J, Riffia J, Rosser S, Siebel A, Romano T, Hryciw D, et al. Gene expression and delayed nephrogenesis in the growth-restricted rat foetus and neonate. Acta Physiol. 2017;222:1–2. doi: 10.1111/apha.13000. [DOI] [PubMed] [Google Scholar]
Associated Data
This section collects any data citations, data availability statements, or supplementary materials included in this article.
Supplementary Materials
Additional file 1. Table S1: Overview of the gene sets related to renal and cardiovascular development, function and health.
Additional file 2. Table S2: primers targeting promotor regions.
Additional file 3. Figure S1: multidimensional scaling (MDS) plots.
Additional file 4. Figure S2: principal component analysis (PCA) plots of fetal growth restriction (FGR) vs. control (CTRL) .
Additional file 5. Table S3: per principal component best correlated modulator.
Additional file 6. Table S4: differential expression of FGR versus control (FGR–control).
Additional file 7. Table S5: All MsigDB gene modules, as determined by CAMERA, in gene list ranked based on a comparison of: differential expression of FGR versus control (FGR–control). Modules sorted by significance.
Additional file 8. Figure S3: heatmaps of significantly differential expressed gene sets involved in cardiovascular or renal development and disease.
Additional file 9. Figure S4: DNA methylation at individual CpG positions for FPR3.
Data Availability Statement
The datasets generated and/or analyzed during the current study are not publicly available due to the Dutch privacy law to protect participants, but are partly and always coded available from the corresponding author on request. All data generated or analyzed during this study are included in this published article and its supplementary information files.