

Abstract
Application of degradable plastics is the most critical solution to plastic pollution. As the precursor of biodegradable plastic PLA (polylactic acid), efficient production of l‐lactic acid is vital for the commercial replacement of traditional plastics. Bacillus coagulans H‐2, a robust strain, was investigated for effective production of l‐lactic acid using long‐term repeated fed‐batch (LtRFb) fermentation. Kinetic characteristics of l‐lactic acid fermentation were analyzed by two models, showing that cell‐growth coupled production gradually replaces cell‐maintenance coupled production during fermentation. With the LtRFb strategy, l‐lactic acid was produced at a high final concentration of 192.7 g/L, on average, and a yield of up to 93.0% during 20 batches of repeated fermentation within 487.5 h. Thus, strain H‐2 can be used in the industrial production of l‐lactic acid with optimization based on kinetic modeling.
Keywords: Bacillus coagulans, Kinetics, l‐Lactic acid, Long‐term repeated fed‐batch
Abbreviations
- LtRFb
long‐term repeated fed‐batch
- PLA
polylactic acid
1. INTRODUCTION
In recent years, the urgent need to reduce environmental pollution caused by plastics has driven the development of biodegradable green plastics. Polylactic acid (PLA), a type of environmentally friendly plastic, has attracted unprecedented global attention owing to its biodegradable and biocompatible properties; it has the potential to replace traditional plastics produced by petroleum fuels [1, 2, 3]. Some properties of PLA, including its crystallinity, thermal stability and hydrolysis resistance, are affected by the relative fractions of l‐ and d‐isomers in polymer chains [4, 5, 6]. Production of optically pure l‐lactic acid, a key monomer of PLA, is particularly important.
As an alternative to chemical methods, l‐lactic acid can be produced by microbial fermentation, which has various advantages, including the absence of racemates and environmental friendliness [7]. The selection of l‐lactic acid producers is a basic and vital step for laboratory and industrial production. Microorganisms that have been used for l‐lactic acid production include Lactobacillus delbrueckii [8], Enterococcus faecalis [9], Enterobacter aerogenes [10], Pediococcus acidilactici [11, 12], and Bacillus coagulans [13] (Table S1). B. coagulans can be used for high‐temperature fermentation owing to its ability to grow at 50–55°C and has the potential to produce l‐lactic acid with high yield [14]. Compared with medium‐temperature fermentation, the high‐temperature fermentation of l‐lactic acid has some unique advantages, such as significant reductions in cooling costs and the risk of contamination, as well as the potential for effective simultaneous saccharification and fermentation [1].
In industrial production, high product concentrations and yields are a constant goal. Compared with traditional batch fermentation, improved strategies based on fed‐batch fermentation not only relieve substrate inhibition, but also significantly promote the production of various products such as 1,3‐propanediol [15], valinomycin [16], and formic acid [17]. A repeated‐batch fermentation strategy is also an effective production mode that possesses multiple advantages, including a short seed preparation time, better substrate consumption in bioreactors, and the potential for increased cell productivity [18]. Further improvements in production are expected as a new long‐term repeated fed‐batch (LtRFb) strategy is established via a combination of the two fermentation modes mentioned above.
In this study, B. coagulans strain H‐2, which shows robustness and resistance to infertility, was used for l‐lactic acid fermentation by an LtRFb strategy. An excellent l‐lactic acid titer, yield, and productivity were observed using the strain with low nitrogen source consumption. The strain possesses huge potential to improve l‐lactic acid fermentation for economical industrial production. Furthermore, two models were used for a kinetic analysis of cell growth and l‐lactic acid production during fermentation.
2. MATERIALS AND METHODS
2.1. Microorganism and media
B. coagulans H‐2 was used for l‐lactic acid production. The strain was obtained by screening derivatives of a laboratory strain B. coagulans H‐1 [13]. The seed medium had the following compositions (in g/L): glucose, 100; yeast extract, 1; tryptone, 5; CaCO3, 50. The fermentation medium had the following compositions (in g/L): glucose, 140; yeast extract, 1; ZnSO4·7H2O, 0.37; KH2PO4, 0.57; K2HPO4, 0.57; (NH4)2SO4, 8.33; (NH4)2HPO4, 3. All media were sterilized at 115°C for 20 min.
PRACTICAL APPLICATION
The newly developed long‐term repeated fed‐batch (LtRFb) strategy for lactic acid production has the following potential applications:
Efficient and stable production of l‐lactic acid by the LtRFb strategy can reduce the cost of industrial PLA (polylactic acid) production.
The LtRFb strategy may be a cost‐effective approach for the production of other industrially important products.
Kinetic characteristics of l‐lactic acid production by LtRFb fermentation may provide guidance to regulate and improve similar production technologies for other valuable products.
2.2. Fermentation conditions and optimization
Temperature, pH, initial glucose concentration, and inoculation volume were optimized. Before the fermentation conditions were optimized, the default temperature, initial glucose concentration, and inoculum were 52°C, 140 g/L, and 20%, respectively. All seed cultures were inoculated into the fermentation medium and fermented at 80 rpm in fermenters. The pH was regulated by 25% w/v Ca(OH)2 continuously in all fermentation processes. During pH optimization, pH values of the culture in fermenters were adjusted to 6.2, 6.5, 7.0, and 7.5. During temperature optimization, the temperature was set to 50, 52, 55, and 57°C, setting the pH to the optimal value. During the optimization of the initial glucose concentration, values of 140, 160, 180, 200, and 220 g/L were evaluated, setting the pH and temperature to the optimal values. During the optimization of the inoculation volume, fermenters containing 2.7, 2.4, and 2.1 L of fresh improved fermentation medium with the optimal initial glucose concentration were seeded with 300, 600, and 900 mL of fresh seed, respectively [19]. Similarly, the pH and temperature were both adjusted to the optimal values. An appropriate amount of glucose was added to the culture during fermentation to prevent a reduction in l‐lactic acid production due to the depletion of glucose. During glucose supplementation, the glucose concentration in fermenters was controlled below 120 g/L. In addition, seed solutions used in the optimization of individual parameters were all prepared from single colonies in the same round. For all fermentation experiments, volume of the fermenters was 5 L, and the initial working volume was 3 L. The LtRFb fermentation was performed under optimal conditions determined as described above. A total of 20 batches were conducted, and an appropriate amount of glucose was added to the culture at the right time to avoid the depletion of glucose. For every batch, 2.4 L of fresh medium was added to form a new batch with a working volume of 3 L.
2.3. Enzyme activity determination and viable cell counts
To obtain crude enzymes, cells from the fermentation broth were broken and centrifuged at 11,750 g for 40 min using phosphate‐buffered saline (PBS; pH 7.0). Crude enzymes were reacted with pyruvate and NADH at the corresponding fermentation temperature. The reaction mixture contained 50 μL of pyruvate (10 mM), 20 μL of NADH (10 mM) and 730 μL of crude enzyme with PBS as the solvent. The oxidation of NADH (ϵ340 = 6220/M/cm) was monitored by the decrease in the absorbance at 340 nm. One unit of protein activity was defined as the amount of enzyme that catalyzed the consumption of 1 μmol NADH per minute. Methylene blue staining was used for live bacterial cell counting.
2.4. Analytical methods
Samples were diluted with an equal volume of 6 M HCl to dissolve impurities and then with deionized water to the desired extent. The optical density was measured at 600 nm using a V‐1200 spectrophotometer (MAPADA, Shanghai, P.R. China). The glucose concentration was measured using an SBA‐40D biosensor analyzer (Institute of Biology, Shandong Academy of Sciences, P.R. China). The l‐lactic acid concentration and chirality were determined using a high‐performance liquid chromatograph (HPLC) system (Agilent 1200 series; Hewlett‐Packard, Palo Alto, CA, USA). Columns used for the determination of the l‐lactic acid concentration and chirality were Aminex HPX‐87H and OA‐5000, respectively. Yields of l‐lactic acid produced from glucose were calculated as follows: yield (%) = l‐lactic acid produced (g)/glucose consumed (g) × 100.
2.5. Kinetic models
The LtRFb fermentation process was studied to reveal the dynamic characteristics of l‐lactic acid production by B. coagulans H‐2. Cell growth (OD600 that may be related to the number of viable bacteria) (Figure S1) and l‐lactic acid production were evaluated by logistic and Luedeking‐Piret models, respectively. GraphPad Prism 5 (GraphPad Software Inc., La Jolla, CA, USA, https://www.graphpad.com) was used for simulations and data analyses.
Cell growth (OD600) was described by the logistic function [20]
| (1) |
in which X is the OD600 value, which describes the biomass concentration, μm is the maximum specific growth rate (h−1), and Xm is the maximum OD600.
l‐Lactic acid production was described by the Luedeking‐Piret function [20]
| (2) |
in which P is the l‐lactic acid concentration (g/L), α is a growth‐associated constant, and β is a non‐growth‐associated constant.
3. RESULTS AND DISCUSSION
3.1. Optimization of pH in fermentation
B. coagulans H‐2 was used to optimize fermentation conditions with respect to the concentration of l‐lactic acid produced in a single batch. The concentrations of residual glucose and l‐lactic acid as well as OD600 values during LtRFb fermentation for different pH values are shown in Figure 1. The glucose consumption rate and maximum cell density were highest at pH 7.0 (Figure 1A, B). The l‐lactic acid production rate was also highest at pH 7.0. Final concentrations of l‐lactic acid up to 193.5 g/L and 191.4 g/L could be observed at pH 7.0 and pH 6.5, respectively (Figure 1C). At 42 h and 46 h of fermentation, total glucose consumption occurred at pH 7.0 and pH 6.5, respectively. The initial glucose was not depleted until the end of the fermentation period at pH 7.5 (Figure 1A). The maximum OD600 values in descending order were 14.3, 12.8, 9.8, and 3.8 at pH 7.0, 6.5, 6.2, and 7.5, respectively. A decrease in biomass due to the depletion of glucose was also observed at pH 7.0 (Figure 1B). Yields of l‐lactic acid produced by strain H‐2 cultured at pH 6.2, 6.5, and 7.0 were 90.4%, 90.2% and 90.7% without significant differences. A low yield of 76.9% may be caused by the inability of the strain to adapt to inappropriate growth conditions at pH 7.5 (Figure 1D).
FIGURE 1.

Time curves of residual glucose (A), OD600 (B), and l‐lactic acid (C), and the histogram of yields (D) during fermentation for optimization of pH. Symbols for different fermentation conditions in (A), (B), and (C): ●, pH 6.2; ■, pH 6.5; ▲, pH 7.0; ▼, pH 7.5
As described above, strain H‐2 exhibited the best characteristics, including the maximum glucose consumption rate, highest cell density and highest l‐lactic acid production rate at pH 7.0. In related studies, typical pH values for l‐lactic acid production by B. coagulans are 6.0–6.2 [13, 21,22], compared to the optimal pH for l‐lactic acid production by the strain B. coagulans H‐2 of 7.0. This unique feature may result from the mutations generated in the evolution process of H‐2.
3.2. Optimization of temperature in fermentation
In addition to pH, culture temperature has a profound effect on cell growth and product production. Therefore, the effect of temperature on l‐lactic acid production by B. coagulans H‐2 was investigated. Time curves of glucose consumption, l‐lactic acid production, and OD600 values for the strain cultured at various temperatures are shown in Figure 2. Glucose added to fermenters was consumed completely within 45.5 h and 42 h when the strain was cultured at 50 and 52°C, respectively, leading to the production of 186.9 and 193.5 g/L l‐lactic acid and maximum OD600 values of 14.9 and 14.2, respectively. The rate of glucose consumption, l‐lactic acid production, and cell growth declined significantly during fermentation at 55 and 57°C (Figure 2A–C). High yields above 90% were observed during fermentation at all temperatures except 57°C (Figure 2D). At 57°C, cells were unable to maintain normal physiological activity, and strain H‐2 showed poor performance (Figure S2).
FIGURE 2.

Time curves of residual glucose (A), OD600 (B), and l‐lactic acid (C), and the histogram of yields (D) during fermentation for optimization of temperature. Symbols for different fermentation conditions in (A), (B), and (C): ●, 50°C; ■, 52°C; ▲, 55°C; ▼, 57°C
In previous reports, temperatures suitable for the growth and fermentation of B. coagulans were generally in the range of 50°C–52°C [13, 21,23, 24]. Consistent with these reports, 52°C was identified as the optimal fermentation temperature in this study in view of the excellent performance of the strain in l‐lactic acid production. Under this temperature condition, l‐lactic acid fermentation can be performed without sterilization, providing a cost‐effective method for l‐lactic acid fermentation from renewable substrates [25].
3.3. Optimization of initial glucose concentration for fermentation
Initial glucose concentration is another parameter with an important role in fermentation. Glucose‐induced osmotic pressure is introduced by excessive carbon sources during l‐lactic acid fermentation, causing delayed cell growth and low production efficiency [26]. Kinetic models of relationships between substrate and product inhibition in lactic acid fermentation have been established to study the effect of substrate concentration on production [27]. To explore the effect of the substrate concentration on production by B. coagulans H‐2, the initial glucose concentration was altered.
As illustrated in Figure 3, glucose was used up at all initial glucose concentrations, resulting in high l‐lactic acid production above 190 g/L in all batches. The shortest fermentation period was 35.5 h at 160 g/L initial glucose and the longest was at 220 g/L (Figure 3A, C). At the same time, the growth of cells cultured at 220 g/L was worse than that in other conditions (Figure 3B). The yield fluctuated slightly from 89.0% at 220 g/L initial glucose to 93.5% at 200 g/L (Figure 3D).
FIGURE 3.

Time curves of residual glucose (A), OD600 (B), and l‐lactic acid (C), and the histogram of yields (D) during fermentation for optimization of initial glucose concentration. Symbols for different fermentation conditions in (A), (B), and (C): ●, 140 g/L initial glucose; ■, 160 g/L initial glucose; ▲, 180 g/L initial glucose; ▼, 200 g/L initial glucose; ◆, 220 g/L initial glucose
Effects of the initial glucose concentration on the production and yield of l‐lactic acid were weaker when compared to the effects of pH and temperature. Considering the l‐lactic acid production rate, 160 g/L was identified as the optimal initial glucose concentration. It is necessary to increase the initial glucose concentration to the greatest extent possible, with little subsequent supplementation to the fermentation system, for easier operation.
3.4. Optimization of inoculation volume for fermentation
A reasonable inoculation volume is important for cost control and process improvement in industrial production. Therefore, the inoculation volume was also optimized. Glucose consumption, cell growth, l‐lactic acid production rate and yield trended similarly at inoculation volumes of 20% v/v and 30% v/v in optimization experiments, whereas the four fermentation indicators were all significantly worse at a 10% v/v inoculation volume (Figure 4A–D).
FIGURE 4.

Time curves of residual glucose (A), OD600 (B), and l‐lactic acid (C), and the histogram of yields (D) during fermentation for optimization of inoculation volume. Symbols for different fermentation conditions in (A), (B), and (C): ●, 10% (v/v) inoculation volume; ■, 20% (v/v) inoculation volume; ▲, 30% (v/v) inoculation volume
Based on the production efficiency and cost, 20% v/v was considered an appropriate inoculation volume. Excessive inoculation is wasteful in industrial production, owing to the presence of rich nutrients in the seed culture medium, and results in high costs. Thus, limiting the inoculation volume and maintaining seed activity are important for cost control.
3.5. l‐Lactic acid production by LtRFb fermentation
To further study the l‐lactic acid fermentation performance of the strain, 20 repeated batches of fed‐batch fermentation were performed under the optimized conditions described above. Due to the stability of seed activity and precise control of fermentation conditions, only minor fluctuations in maximum OD600 values were observed (from 14.9 in batch 9 to 18.4 in batch 20). Simultaneously, a general decrease in cell density was detected in each batch after glucose was depleted (Figure 5A, S3). Compared to the cell density, the final concentration of l‐lactic acid fluctuated within a relatively small range from 185.0 g/L in batch 3 to 203.3 g/L in batch 15, reflecting the high level of final l‐lactic acid concentration produced by stain H‐2 during LtRFb fermentation. At the same time, the chirality of l‐lactic acid was over 99.6% throughout LtRFb fermentation. The fermentation cycles of all batches were maintained between 31.5 h and 42 h, except for batch 17 during which fermentation ended at 48 h as a result of a failure to guarantee the accuracy of pH electrode. However, the high fermentation efficiency of the strain was recovered in subsequent batches, revealing the stability of l‐lactic acid production efficiency in the strain (Figure 5B). Furthermore, yields of different batches also fluctuated within a relatively stable range. Among 20 batches, more than half had a yield of greater than 90%, and the highest was 93.0%, which is close to the theoretical maximum yield (Figure 5C). Due to the limited fermenter volume, variation due to sampling and calculation error led to low yields of some batches; however, this defect can be avoided in large‐scale fermentation.
FIGURE 5.
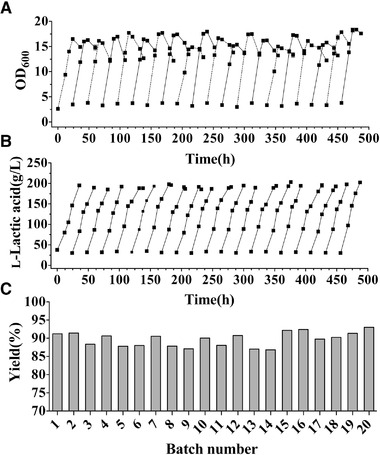
Time curves of OD600 (A) and l‐lactic acid (B), and the histogram of yields (C) during LtRFb fermentation. In (A), the OD600 curves for the odd and even fermentation batches are indicated by dashed and solid lines, respectively
The strain could produce an average of 192.7 g/L l‐lactic acid in an average of 36.9 h in 20 batches, reflecting its excellent and stable l‐lactic acid production performance. In previous reports, the highest titer of l‐lactic acid produced by B. coagulans was 206.8 g/L, and its productivity was 5.29 g/L/h with 30 g/L yeast extract added to the fermenter [23]. Using strain H‐2, the maximum titer of l‐lactic acid reached 203.3 g/L, consistent with highest level reported. The highest productivity of 6.43 g/L/h in batch 20 reveals the effectiveness of the strain for rapid l‐lactic acid production. Based on LtRFb, industrial fermentation may be scaled up with the continuous supply of the seed cultures, resulting in efficient production. At the same time, the optical purity of l‐lactic acid was consistently maintained above 99.6% during LtRFb fermentation, which may ensure high product quality for industrial production. In addition, high yields may simplify downstream separation engineering and cost. To further develop a cost‐effective competitive fermentation process, glucose can be replaced with less expensive renewable substrates such as corn stover [28], cellulose [29], and sugarcane bagasse [22].
3.6. Kinetics of l‐lactic acid production using LtRFb fermentation
Research on fermentation kinetics is helpful for revealing the characteristics of the fermentation process and for exploring the fermentation mechanism, providing credible theoretical support for low‐cost industrial production and process improvement. Data for cell growth and l‐lactic acid production in 20 batches of LtRFb fermentation were used for a kinetic analysis of l‐lactic acid fermentation characteristics. The logistic and Luedeking‐Piret models provided accurate simulations of cell density and l‐lactic acid concentration via non‐linear fitting. For instance, the models were fitted to experimental data for batch 20 (Figure 6A, B), with high R2 values of 0.9772 and 0.9943 for biomass and product, respectively (Table 1). As expected, simulations of other batches were also very accurate (Table S2).
FIGURE 6.

Fitting curves of OD600 (A) and l‐lactic acid concentration (B) in batch 20, and kinetic parameters (C) of 20 batches in LtRFb fermentation based on kinetic models. Symbols for different parameters in (C): ○, product of α and μm in product simulation; ■, β in product simulation
TABLE 1.
Kinetic parameters and coefficients of batches in LtRFb fermentation
| Batch number | μ m (h−1) | Α | μ m × α | Β | R2 | |
|---|---|---|---|---|---|---|
| Biomass | Product | |||||
| 1–4 | 0.1842 ± 0.0221 | 0.8066 ± 0.1063 | 0.1486 | 0.2238 ± 0.0201 | 0.9709 | 0.9852 |
| 5–20 | 0.2121 ± 0.0137 | 1.2030 ± 0.0666 | 0.2552 | 0.1614 ± 0.0083 | 0.9574 | 0.9720 |
| 1–20 | 0.2060 ± 0.0121 | 1.1440 ± 0.0592 | 0.2357 | 0.1673 ± 0.0079 | 0.9558 | 0.9718 |
According to Equation (2), a comparison between the product of α and μm and the parameter β reveals the relationship between cell growth coupling and product fermentation. As LtRFb fermentation continued, β remained within a small range whereas the product of α and μm showed an increasing trend overall. In the first 4 batches, β was higher than the product of α and μm, while from the fifth batch on, the product of α and μm began to surpass β or was similar (Figure 6C). Accordingly, we hypothesized that the gradual replacement of cell maintenance with cell growth, plays a major role in maintaining l‐lactic acid production efficiency during LtRFb fermentation. A total of 20 batches were fitted as a whole and the product of μm and α was 0.2357, which was higher than the estimated β of 0.1673, showing that the overall fermentation was cell growth‐dependent. Moreover, models were also fitted to data for 1–4 batches and 5–20 batches with higher R2 values than those for 20 batches, indicating that splitting the batches into two parts can provide a more accurate description of the overall fermentation process. In the first 4 batches, B. coagulans H‐2 had μm, α, and β values of 0.1842, 0.8066 and 0.2238, respectively. The product of μm and α was 0.1486, which is lower than β, indicating that l‐lactic acid production was more dependent on the maintenance of cells than growth during the initial stage of repeated fermentation. Furthermore, μm, α, and β values of 0.2121, 1.203 and 0.1614 were obtained, showing the opposite pattern in which cell growth was the main determinant of fermentation during batches 5–20 (Table 1). The assumption that fermentation switched from cell‐maintenance dependent to cell‐growth dependent provides a basis for improvements in the industrial production process for l‐lactic acid. Kinetic characteristics obtained in this study can also be used as references for fermentation using renewable resources, which is an effective measure to further improve the industrial production of l‐lactic acid.
4. CONCLUDING REMARKS
The performance of B. coagulans H‐2 for l‐lactic acid production was investigated. A high titer, yield, and productivity in l‐lactic acid fermentation can be consistently maintained by an LtRFb strategy without a rich nutrient supply. Therefore, B. coagulans H‐2 has the potential to serve as a robust, effective, and cost‐efficient strain for l‐lactic acid production. A kinetic analysis of LtRFb fermentation revealed a transformation from cell‐maintenance coupling to cell‐growth coupling, which may guide industrial production. B. coagulans H‐2 may increase efficiency and reduce manufacturing costs in large‐scale l‐lactic acid production.
CONFLICT OF INTEREST
The authors have declared no conflict of interest.
Supporting information
Supplementary information
ACKNOWLEDGMENTS
This work was supported by the grant of National Key R&D Program of China (2019YFA0904800) and by the grant from National Natural Science Foundation of China (31870088).
Zhang F, Liu J, Han X, et al. Kinetic characteristics of long‐term repeated fed‐batch (LtRFb) l‐lactic acid fermentation by a Bacillus coagulans strain. Eng Life Sci. 2020;20:562–570. 10.1002/elsc.202000043
REFERENCES
- 1. Abdel‐Rahman, M. A. , Tashiro, Y. , Sonomoto, K. , Recent advances in lactic acid production by microbial fermentation processes. Biotechnol. Adv. 2013, 31, 877–902. [DOI] [PubMed] [Google Scholar]
- 2. Giammona, G. , Craparo, E. F. , Biomedical applications of polylactide (PLA) and its copolymers. Molecules. 2018, 23, 980. [DOI] [PMC free article] [PubMed] [Google Scholar]
- 3. Riaz, S. , Fatima, N. , Rasheed, A. , Riaz, M. et al., Metabolic engineered biocatalyst: a solution for PLA based problems. Int. J. Biomater. 2018, 2018, 1963024. [DOI] [PMC free article] [PubMed] [Google Scholar]
- 4. Fukushima, K. , Chang, Y. H. , Kimura, Y. , Enhanced stereocomplex formation of poly(l‐lactic acid) and poly(d‐lactic acid) in the presence of stereoblock poly(lactic acid). Macromol. Biosci. 2007, 7, 829–835. [DOI] [PubMed] [Google Scholar]
- 5. Han, X. , Huang, K. , Tang, H. , Ni, J. et al., Steps toward high‐performance PLA: economical production of d‐lactate enabled by a newly isolated Sporolactobacillus terrae strain . Biotechnol. J. 2019, 14, e1800656. [DOI] [PubMed] [Google Scholar]
- 6. Tsuji, H. , Fukui, I. , Enhanced thermal stability of poly(lactide)s in the melt by enantiomeric polymer blending. Polymer. 2003, 44, 2891–2896. [Google Scholar]
- 7. Wischral, D. , Arias, J. M. , Modesto, L. F. , Passos, D. D. et al., Lactic acid production from sugarcane bagasse hydrolysates by Lactobacillus pentosus: integrating xylose and glucose fermentation. Biotechnol. Prog. 2019, 35, e2718. [DOI] [PubMed] [Google Scholar]
- 8. Singhvi, M. , Zendo, T. , Gokhale, D. , Sonomoto, K. , Greener l‐lactic acid production through in situ extractive fermentation by an acid‐tolerant Lactobacillus strain. Appl. Microbiol. Biotechnol. 2018, 102, 6425–6435. [DOI] [PubMed] [Google Scholar]
- 9. Reddy, L. V. , Kim, Y. M. , Yun, J. S. , Ryu, H. W. et al., l‐Lactic acid production by combined utilization of agricultural bioresources as renewable and economical substrates through batch and repeated‐batch fermentation of Enterococcus faecalis RKY1. Bioresour. Technol. 2016, 209, 187–194. [DOI] [PubMed] [Google Scholar]
- 10. Thapa, L. P. , Lee, S. J. , Park, C. , Kim, S. W. , Production of l‐lactic acid from metabolically engineered strain of Enterobacter aerogenes ATCC 29007. Enzyme. Microb. Technol. 2017, 102, 1–8. [DOI] [PubMed] [Google Scholar]
- 11. Han, X. , Li, L. , Wei, C. , Zhang, J. et al., Facilitation of l‐lactic acid fermentation by lignocellulose biomass rich in vitamin B compounds. J. Agric. Food Chem. 2019, 67, 7082–7086. [DOI] [PubMed] [Google Scholar]
- 12. Qiu, Z. , Gao, Q. , Bao, J. , Engineering Pediococcus acidilactici with xylose assimilation pathway for high titer cellulosic l‐lactic acid fermentation. Bioresour. Technol. 2018, 249, 9–15. [DOI] [PubMed] [Google Scholar]
- 13. Xu, K. , Xu, P. , Betaine and beet molasses enhance l‐lactic acid production by Bacillus coagulans . PLoS One. 2014, 9, e100731. [DOI] [PMC free article] [PubMed] [Google Scholar]
- 14. Glaser, R. , Venus, J. , Model‐based characterisation of growth performance and l‐lactic acid production with high optical purity by thermophilic Bacillus coagulans in a lignin‐supplemented mixed substrate medium. New Biotechnol. 2017, 37, 180–193. [DOI] [PubMed] [Google Scholar]
- 15. Guo, Y. , Dai, L. , Xin, B. , Tao, F. , 1,3‐Propanediol production by a newly isolated strain, Clostridium perfringens GYL. Bioresour. Technol. 2017, 233, 406–412. [DOI] [PubMed] [Google Scholar]
- 16. Li, J. , Jaitzig, J. , Lu, P. , Süssmuth, R. D. et al., Scale‐up bioprocess development for production of the antibiotic valinomycin in Escherichia coli based on consistent fed‐batch cultivations. Microb. Cell Fact. 2015, 14, 83. [DOI] [PMC free article] [PubMed] [Google Scholar]
- 17. Grunwald, S. , Mottet, A. , Grousseau, E. , Plassmeier, J. K. et al., Kinetic and stoichiometric characterization of organoautotrophic growth of Ralstonia eutropha on formic acid in fed‐batch and continuous cultures. Microb. Biotechnol. 2015, 8, 155–163. [DOI] [PMC free article] [PubMed] [Google Scholar]
- 18. Dashti, M. G. , Abdeshahian, P. , Batch culture and repeated‐batch culture of Cunninghamella bainieri 2A1 for lipid production as a comparative study. Saudi. J. Biol. Sci. 2016, 23, 172–180. [DOI] [PMC free article] [PubMed] [Google Scholar]
- 19. Oh, B. R. , Lee, S. M. , Heo, S. Y. , Seo, J. W. et al., Efficient production of 1,3‐propanediol from crude glycerol by repeated fed‐batch fermentation strategy of a lactate and 2,3‐butanediol deficient mutant of Klebsiella pneumoniae . Microb. Cell Fact. 2018, 17, 92. [DOI] [PMC free article] [PubMed] [Google Scholar]
- 20. Zhao, B. , Wang, L. M. , Li, F. S. , Hua, D. L. et al., Kinetics of d‐lactic acid production by Sporolactobacillus sp. strain CASD using repeated batch fermentation. Bioresour. Technol. 2010, 101, 6499–6505. [DOI] [PubMed] [Google Scholar]
- 21. Ou, M. S. , Ingram, L. O. , Shanmugam, K. T. , l(+)‐Lactic acid production from non‐food carbohydrates by thermotolerant Bacillus coagulans . J. Ind. Microbiol. Biotechnol. 2011, 38, 599–605. [DOI] [PubMed] [Google Scholar]
- 22. Der Pol, E. V. , Eggink, G. , Weusthuis, R. A. , Production of l(+)‐lactic acid from acid pretreated sugarcane bagasse using Bacillus coagulans DSM2314 in a simultaneous saccharification and fermentation strategy. Biotechnol. Biofuels. 2016, 9, 248. [DOI] [PMC free article] [PubMed] [Google Scholar]
- 23. Coelho, L. F. , Beitel, S. M. , Sass, D. C. , Neto, P. M. A. et al., High‐titer and productivity of l‐(+)‐lactic acid using exponential fed‐batch fermentation with Bacillus coagulans arr4, a new thermotolerant bacterial strain. 3 Biotech. 2018, 8, 213. [DOI] [PMC free article] [PubMed] [Google Scholar]
- 24. Der Pol, E. V. , Springer, J. , Vriesendorp, B. , Weusthuis, R. et al., Precultivation of Bacillus coagulans DSM2314 in the presence of furfural decreases inhibitory effects of lignocellulosic by‐products during l(+)‐lactic acid fermentation. Appl. Microbiol. Biotechnol. 2016, 100, 10307–10319. [DOI] [PMC free article] [PubMed] [Google Scholar]
- 25. Juturu, V. , Wu, J. C. , Production of high concentration of l‐lactic acid from oil palm empty fruit bunch by thermophilic Bacillus coagulans JI12. Biotechnol. Appl. Biochem. 2018, 65, 145–149. [DOI] [PubMed] [Google Scholar]
- 26. Åkerberg, C. , Hofvendahl, K. , Zacchi, G. , Hahn‐Hägerdal, B. , Modelling the influence of pH, temperature, glucose and lactic acid concentrations on the kinetics of lactic acid production by Lactococcus lactis ssp. lactis ATCC 19435 in whole‐wheat flour. Appl. Microbiol. Biotechnol. 1998, 49, 682–690. [Google Scholar]
- 27. Gonçalves, L. M. D. , Xavier, A. M. R. B. , Almieda, J. S. , Carrondo, M. J. T. , Concomitant substrate and product inhibition kinetics in lactic acid production. Enzyme Microb. Technol. 1991, 13, 314–319. [Google Scholar]
- 28. Xue, Z. , Wang, L. , Ju, J. , Yu, B. et al., Efficient production of polymer‐grade l‐lactic acid from corn stover hydrolyzate by thermophilic Bacillus sp. strain XZL4. Springerplus. 2012, 1, 43. [DOI] [PMC free article] [PubMed] [Google Scholar]
- 29. Ong, S. A. , Ng, Z. J. , Wu, J. C. , Production of high concentration of l‐lactic acid from cellobiose by thermophilic Bacillus coagulans WCP10‐4. Appl. Microbiol. Biotechnol. 2016, 100, 6501–6508. [DOI] [PubMed] [Google Scholar]
Associated Data
This section collects any data citations, data availability statements, or supplementary materials included in this article.
Supplementary Materials
Supplementary information