

Abstract
N4-acetylcytidine (ac4C) is a post-transcriptional modification in mRNA which plays a major role in the stability and regulation of mRNA translation. The working mechanism of ac4C modification in mRNA is still unclear and traditional laboratory experiments are time-consuming and expensive. Therefore, we propose an XG-ac4C machine learning model based on the eXtreme Gradient Boost classifier for the identification of ac4C sites. The XG-ac4C model uses a combination of electron-ion interaction pseudopotentials and electron-ion interaction pseudopotentials of trinucleotide of the nucleotides in ac4C sites. Moreover, Shapley additive explanations and local interpretable model-agnostic explanations are applied to understand the importance of features and their contribution to the final prediction outcome. The obtained results demonstrate that XG-ac4C outperforms existing state-of-the-art methods. In more detail, the proposed model improves the area under the precision-recall curve by 9.4% and 9.6% in cross-validation and independent tests, respectively. Finally, a user-friendly web server based on the proposed model for ac4C site identification is made freely available at http://nsclbio.jbnu.ac.kr/tools/xgac4c/.
Subject terms: Computational biology and bioinformatics, Genetics, Engineering
Introduction
More than 160 different RNA modifications have been identified1. Among them, N4-acetylcytidine (ac4C) has regulatory potential. It occurs on cytidine and it is the only acetylation modification in eukaryotic mRNA2. The role of ac4C in the regulation of mRNA translation and promotion of translation efficiency was established by Arango et al.3 An analysis of the half-life of mRNA showed that the acetylation level and stability of target mRNA are positively correlated. Also, ac4C enhances translation when presented within the wobble sites of cytidine3. Furthermore, ac4C is co-related with the progression, prognosis, and development of several human diseases4.
Recently, Arango et al.3 reported that NAT10 acetyltransferase is involved in the catalyzation of N4-acetyl-cytidine (ac4C) as an mRNA modification5. Whole transcriptome mapping of ac4C reveals abundantly acetylated regions within the coding sequence. NAT10 mutation decreases detection of ac4C at the mapped mRNA site and is associated with down-regulation of target mRNA. So, the acetylated residues expand the repertoire of mRNA modifications to establish the role of ac4C in the regulation of mRNA translation.
More recently, the PACES predictor was proposed for classification of the ac4C modification sites in human mRNA6. PACES combines two random forest classifiers, position-specific di-nucleotide sequence profiles and K-nucleotide frequencies. The results of PACES can be further improved upon. Therefore, in this study, we propose a computational model based on the eXtreme Gradient Boosting (XGboost) method to identify ac4C modification sites in mRNA. The nucleotide chemical property (NCP), nucleotide density (DN), Kmer, one-hot encoding, electron-ion interaction pseudopotentials (EIIP), and electron-ion interaction pseudopotentials of trinucleotide (PseEIIP) were utilized to represent mRNA sequences in the benchmark datasets. We employed various evaluation metrics to assess XG-ac4C, all of which are commonly used in the field of bioinformatics7–11, namely, accuracy, sensitivity, specificity, and Matthews correlation coefficient. Furthermore, we applied 5-fold cross-validation with evaluation metrics to evaluate XG-ac4C. We also focus on the receiver operating characteristic curve (ROC) and the precision-recall curve (PRC) because the datasets are imbalanced12. Therefore, the optimal features representation vector and the optimal machine learning classifier are selected based on the ROC and PRC performance. The proposed model XG-ac4C is illustrated in Fig. 1. Moreover, we built a user-friendly web server for the proposed model, which is freely accessible at http://nsclbio.jbnu.ac.kr/tools/xgac4c/.
Figure 1.

Illustration of the proposed model XG-ac4C.
Results and discussion
In this section, we discuss the results and the comparison with other machine learning classifiers and state-of-the-art methods. Finally, we discuss the importance of features for the XGboost classifier.
Comparison with other machine learning classifiers
We tested XGboost with different feature representations, namely, one-hot, a combination of NCP and ND, k-mer, and a combination of EIIP and PseEIIP. The cross-validation test results show that the XGboost classifier with the combination of EIIP and PseEIIP outperforms instead of the other classifiers and feature representation techniques, as shown in Table 1. Therefore, we adopt the combination of EIIP and PseEIIP to encode mRNA sequences for ac4C site identification. Furthermore, we tested different machine learning algorithms, such as eXtreme Gradient Boosting (XGboost), random forest13, AdaBoost14, GaussianNB15, and logistic regression16. XGboost outperforms the aforementioned machine learning algorithms. Figure 2 shows the ROC and PRC of XGboost and the other machine learning algorithms using the combination of EIIP and PseEIIP. Moreover, the ROC and PRC of 5-fold cross-validation for all feature representation are shown in Supplementary Figure 1. It is also evident that the XGboost classifier significantly outperforms the other machine learning algorithms in terms of ROC and PRC.
Table 1.
A comparison of the cross-validation performance between XGboost and other machine learning algorithms using different feature representations.
| Classifiers | Feature | ACC | SP | SN | MCC | ROC | PRC |
|---|---|---|---|---|---|---|---|
| Logistic regression | one-hot | 0.887 | 0.939 | 0.393 | 0.340 | 0.801 | 0.395 |
| NCP-ND | 0.885 | 0.939 | 0.387 | 0.332 | 0.796 | 0.376 | |
| K-mer | 0.903 | 0.991 | 0.081 | 0.172 | 0.849 | 0.415 | |
| EIIP-PseEIIP | 0.903 | 0.998 | 0.007 | 0.046 | 0.740 | 0.275 | |
| GaussianNB | one-hot | 0.792 | 0.806 | 0.668 | 0.328 | 0.810 | 0.352 |
| NCP-ND | 0.737 | 0.759 | 0.526 | 0.191 | 0.732 | 0.327 | |
| K-mer | 0.748 | 0.749 | 0.741 | 0.317 | 0.807 | 0.368 | |
| EIIP-PseEIIP | 0.823 | 0.853 | 0.537 | 0.298 | 0.775 | 0.299 | |
| AdaBoost | one-hot | 0.900 | 0.975 | 0.205 | 0.266 | 0.784 | 0.369 |
| NCP-ND | 0.903 | 0.974 | 0.238 | 0.299 | 0.822 | 0.380 | |
| K-mer | 0.907 | 0.974 | 0.279 | 0.342 | 0.848 | 0.421 | |
| EIIP-PseEIIP | 0.918 | 0.976 | 0.369 | 0.441 | 0.867 | 0.527 | |
| Random forest | one-hot | 0.902 | 0.998 | 0.007 | 0.034 | 0.772 | 0.370 |
| NCP-ND | 0.904 | 0.997 | 0.033 | 0.121 | 0.798 | 0.349 | |
| K-mer | 0.917 | 0.987 | 0.261 | 0.394 | 0.871 | 0.506 | |
| EIIP-PseEIIP | 0.907 | 0.997 | 0.069 | 0.205 | 0.864 | 0.501 | |
| XGboost | one-hot | 0.921 | 0.981 | 0.361 | 0.458 | 0.871 | 0.572 |
| NCP-ND | 0.924 | 0.973 | 0.467 | 0.511 | 0.884 | 0.595 | |
| K-mer | 0.887 | 0.918 | 0.601 | 0.453 | 0.877 | 0.522 | |
| EIIP-PseEIIP | 0.921 | 0.956 | 0.597 | 0.552 | 0.910 | 0.653 |
Figure 2.

The ROC and PRC of the proposed model on the cross-validation and independent test datasets.
Comparison with the existing method
To further demonstrate the superiority of the XG-ac4C model, we compared it with a previously developed method, PACES6. In this study, to enable a fair comparison, we utilized the same imbalanced datasets with positive and negative samples in a ratio of 1:9. The 5-fold cross-validation and independent test set results of XG-ac4C and PACES are shown in Table 2 and Fig. 3. Since the training and independent datasets are imbalanced, the PRC is the most important parameter to compare the performance of the two methods12. XG-ac4C improves PRC by 9.4% and 9.6% on the cross-validation and independent test, respectively.
Table 2.
A comparison of the performance of the proposed model, XG-ac4C, with the existing computational model PACES.
| Dataset | Method | ROC | PRC |
|---|---|---|---|
| Cross-validation | PACES | 0.885 | 0.559 |
| XG-ac4C | 0.91 | 0.653 | |
| Indenpendent-test | PACES | 0.874 | 0.485 |
| XG-ac4C | 0.889 | 0.581 |
Figure 3.
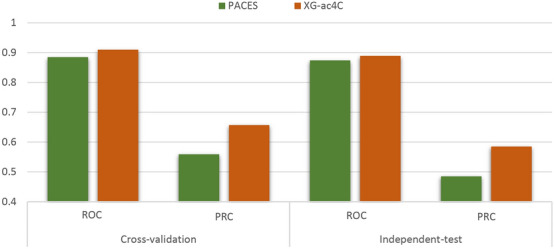
A comparison between the proposed model, XG-ac4C, and the existing model, PACES, based on ROC and PRC.
Feature importance and their contribution
In this section, we discuss the contribution of each feature to the model’s outcome. We adopted two techniques, Shapley Additive Explanations (SHAP) and Local Interpretable Model-agnostic Explanations (LIME), to understand the importance and contribution of each feature17–19. SHAP utilizes local explanations and game theory, and is suitable for the interpretation of machine learning models. The XGboost classifier measures feature importance based on information gain, cover, or weight, whereas the SHAP value is a locally accurate additive method that indicates the importance of most global features for classification. The top 20 most important features of the trained models with both local and global EIIP and PseEIIP are shown in Fig. 4. The lower feature values are shown in blue, while the higher feature values are in red. The predicted ac4C sites are strongly related to higher frequencies of PseEIIP values of GGG, CGG, GGC, and CCC are rich nucleotides. On the other hand, the lower frequencies of EIIP at the non-enriched nucleotide positions N198 and N216 are associated with a lower predicted probability of the sequences being ac4C sites. To further understand the effects of these features on the prediction, we plot the LIME output for a positive sequence Fig. 5a and a negative sequence Fig. 5b. LIME provides more details than SHAP as it specifies a range of feature values that allow a given feature to exert its influence. In Figure 5, the green bars show the weighted features that support the classification of ac4C sites, while the red bars show the weighted features that support the classification of non-ac4C sites. These results agree with the SHAP results.
Figure 4.

A summary of SHAP values, representing the top 20 most important features for training of the proposed model for ac4C site classification.
Figure 5.

Local Interpretable Model-agnostic Explanations (LIME). The green bar shows the weighted features that support classification as ac4C; the red bars are the weighted features that oppose classification as ac4C. The LIME output of a positive sequence is shown in (a), while the LIME output of a negative sequence is shown in (b).
Materials and methods
Benchmark datasets
To develop a useful computational model, we obtained the benchmark datasets from PACES (http://www.rnanut.net/paces/)6. These datasets were originally extracted from 2134 genes prepared by Danial Arango et al.5 The positive and negative sequences have been experimentally validated as ac4C sites and non-ac4C sites, respectively. Each sequence in the positive and negative datasets has five consecutive CXX motifs in the center where . The length of the sequences in the benchmark datasets is 415 nt. The benchmark training dataset contains 1160 positive samples and 10855 negative samples. The independent testing dataset contains 469 positive samples and 4343 negative samples. Furthermore, we utilized fivefold cross-validation during the training process for quality control purposes. Thus, the training dataset was split into five folds, with each folds containing 232 positive samples and 2171 negative samples. Four folds were utilized for training and the remaining fold was utilized for testing. The training of the proposed model takes five sequential cycles; the final performance is the average of the results obtained from all five folds.
Feature extraction
Feature extraction plays a key role in construction of reliable computational methods. In this study, we used the following five mRNA sequence extraction techniques to extract feature from mRNA sequences.
One-hot encoding
The input RNA sequence was encoded using the one-hot technique, in which A is encoded by (1,0,0,0), T is encoded by (0,1,0,0), G is encoded by (0,0,1,0) and C is encoded by (0,0,0,1). Thus, each input sequence in the benchmark dataset was encoded by a vector with a length of .
Nucleotide chemical property (NCP)
The nucleotides of an mRNA sequence can be classified into three groups based on ring structure, functional groups, and hydrogen bonds. Several recent studies utilized chemical nucleotide properties for different problems20–22. Briefly, C and T have a single-ring structure, whereas A and G have two-ring structures; A and C belong to the amino group, while G and T belong to the keto group; and A and T form strong hydrogen bonds, whereas C and G form weak hydrogen bonds. According to the enumeration of these chemical properties, each mRNA sequence was encoded by a 3-dimensional vector (x, y, z), where x, y, and z are derived as follows:
| 1 |
where , , and represent the NCP values of the nucleotide n at position i. Thus, each input sequence from the benchmark dataset was encoded by a vector with a length of =1245.
Nucleotide density (ND)
Nucleotide density provides information about nucleotide frequency as well as nucleotide location information in an mRNA sequence. The ND has been utilized in various studies20. The ND of nucleotide as position j is expressed as:
| 2 |
where is the length of the i-th prefix subsequence from the first position to the ith position, l is the sequence length. Thus, each input sequence from the benchmark datasets was encoded by a vector with a length of 415. In general, we concatenate NCP with ND. Thus, the dimension of the resultant vector is 1245 + 415 = 1660.
K-mer
In this study, we also applied a widely used approach, K-mer, to represent the mRNA sequence. K-mer refers to the calculation of the frequencies of all possible sub-sequences of length k. It has been utilized for various problems23,24. In this paper, we used k = 1, 2, and 3 where 1-mer represents single-nucleotide (SN), 2-mer represents di-nucleotide (DN), and 3-mer represents tri-nucleotide (TN). Thus, each input sequence from the benchmark datasets was encoded by a vector with a length of 4 + 16 + 64 = 84.
EIIP+PseEIIP
The EIIP values of the nucleotides were proposed by Nair and Sreenadhan25, and have been utilized to address various problems in the field of bioinformatics26,27. In EIIP, each nucleotide of an mRNA sequence is encoded by a numerical value corresponding to the distribution of free electron energies. A is encoded by 0.1260, C is encoded by 0.1340, G is encoded by 0.0806, and T is encoded by 0.1335. Furthermore, pseudo-EIIP (PseEIIP) is applied to tri-nucleotides of the mRNA sequence by taking the mean EIIP value of each nucleotide. The mRNA sequence is encoded using PseEIIP by a vector of length 64 as:
| 3 |
where is the normalized frequency of trinucleotide, = EIIPx+EIIPy+EIIPz, and x, y, z . The resulting dimension of the PseEIIP feature vector is 64. Hence, each input sequence from the benchmark dataset was encoded by a vector with a length of 415 + 64 = 479. The 415-dimension vector represents the EIIP values of the input sequence and the 64-dimension vector represents the PseEIIP values of the input sequence.
XGBoost classifier
eXtreme Gradient boost (XGboost) is one of the most reliable machine learning classifiers, and has been widely applied to bioinformatics problems28,29. It is based on a tree model that utilizes a boosting algorithm for classification. To reduce the complexity of the model and control overfitting, regularization items are added to the cost function. Furthermore, the parallel computing function is supported by the XGboost algorithm, which improves computational speed. On the other hand, it is a highly flexible system in which the optimization goals and evaluation criteria can be customized by the user. Moreover, XGboost handles imbalanced datasets easily. Therefore, we proposed using the XGboost algorithm to solve the classification problem related to imbalanced datasets. We applied the grid search method to identify the optimal hyperparameters in XGboost. The optimal hyperparameter values are shown in Table 3.
Table 3.
The optimal hyper-parameter values of the proposed model, XG-ac4C.
| The hyper-parameter | The optimal value |
|---|---|
| N-estimators | 1200 |
| Learning-rate | 0.01 |
| Min-child-wieght | 5 |
| Max-depth | 5 |
| Colsample-bytree | 0.8 |
| Gamma | 5 |
| Subsample | 0.8 |
| Scale-pos-weight | 6 |
Evaluation metrics
In this work, we evaluate the proposed model using the area under the receiver operating characteristic curve (ROC) and the area under the precision-recall curve (PRC). Because the benchmark datasets are imbalanced, PRC is the best choice for studying the performance of the proposed model12. Moreover, the accuracy (ACC), specificity (Sp), sensitivity (Sn), and Matthews correlation coefficient (MCC) were utilized in various recent published studies to evaluate classifier quality in the field of bioinformatics30–37. Thus, we also use them to evaluate the performance of the proposed model. These evaluation metrics are defined as:
| 4 |
| 5 |
| 6 |
| 7 |
where represents the acetylcytidine sties, non-acetylcytidine sites are represented by . represents the acetylcytidine sites incorrectly identified as non-acetylcytidine, and represents the number of non-acetylcytidine sites that are incorrectly classified as acetylcytidine sties.
Web-server
We established a user-friendly and freely accessible web server for the proposed method to facilitate future research. The established web server supports classification of ac4C sites using either direct sequences in Fasta format, as shown in Fig. 6, or direct upload of a Fasta file, as shown in Fig. 7. The web server was developed using the Python programming language with the Flask library. It is available at http://nsclbio.jbnu.ac.kr/tools/xgac4c/.
Figure 6.

The web server window in which a user can paste an mRNA sequence in Fasta format for the prediction of ac4C sites.
Figure 7.
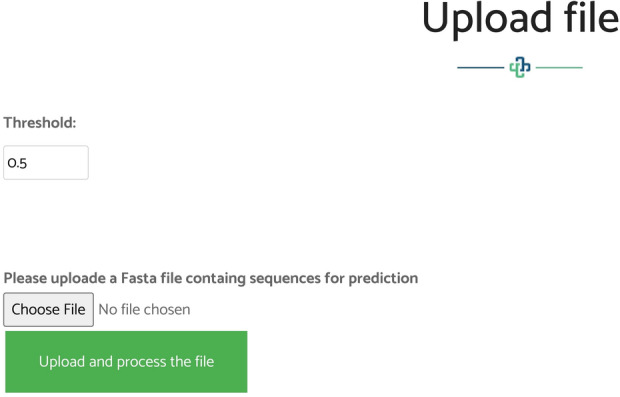
The web server window in which a user can upload an mRNA sequence in a Fasta file.
Conclusion
Accurate identification of mRNA post-transcriptional modifications, such as acetylcytidine (ac4C), is crucial to furthering our understanding of various biological mechanisms. In this work, we developed an efficient and robust machine learning model that identifies acetylated mRNA sites. Moreover, the proposed model utilizes EIIP features to accurately predict ac4C sites. The proposed model, XG-ac4C, outperforms state-of-the-art methods on both cross-validation and independent tests. In addition, we visualized feature importance in XG-ac4C using the SHAP and LIME explainer techniques. Finally, the XG-ac4C model can be used to facilitate many areas of biological research; thus, we developed a freely accessible web server which can be found at http://nsclbio.jbnu.ac.kr/tools/xgac4c/.
Supplementary information
Acknowledgements
This work was supported by “Human Resources Program in Energy Technology” of the Korea Institute of Energy Technology Evaluation and Planning (KETEP), granted financial resource from the Ministry of Trade, Industry and Energy, Republic of Korea. (No. 20204010600470) and the Brain Research Program of the National Research Foundation (NRF) funded by the Korean government (MSIT) (No. NRF-2017M3C7A1044816).
Author contributions
W.A. and H.T. prepared the dataset, conceived of the algorithm, carried out the experiments and analysis, prepared the webserver and wrote the manuscript with support from K.C. All authors discussed the results and contributed to the final manuscript.
Competing interests
The authors declare no competing interests.
Footnotes
Publisher's note
Springer Nature remains neutral with regard to jurisdictional claims in published maps and institutional affiliations.
Contributor Information
Hilal Tayara, Email: hilaltayara@jbnu.ac.kr.
Kil To Chong, Email: kitchong@jbnu.ac.kr.
Supplementary information
is available for this paper at 10.1038/s41598-020-77824-2.
References
- 1.Boccaletto P, et al. Modomics: a database of RNA modification pathways. 2017 update. Nucleic Acids Res. 2018;46:D303–D307. doi: 10.1093/nar/gkx1030. [DOI] [PMC free article] [PubMed] [Google Scholar]
- 2.Sharma S, et al. Yeast kre33 and human nat10 are conserved 18s rrna cytosine acetyltransferases that modify trnas assisted by the adaptor tan1/thumpd1. Nucleic Acids Res. 2015;43:2242–2258. doi: 10.1093/nar/gkv075. [DOI] [PMC free article] [PubMed] [Google Scholar]
- 3.Deng X, Su R, Feng X, Wei M, Chen J. Role of n6-methyladenosine modification in cancer. Curr. Opin. Genetics Dev. 2018;48:1–7. doi: 10.1016/j.gde.2017.10.005. [DOI] [PMC free article] [PubMed] [Google Scholar]
- 4.Jin, G., Xu, M., Zou, M. & Duan, S. The processing, gene regulation, biological functions and clinical relevance of n4-acetylcytidine on RNA: a systematic review. Mol. Ther. Nucleic Acids (2020). [DOI] [PMC free article] [PubMed]
- 5.Arango D, et al. Acetylation of cytidine in mrna promotes translation efficiency. Cell. 2018;175:1872–1886. doi: 10.1016/j.cell.2018.10.030. [DOI] [PMC free article] [PubMed] [Google Scholar]
- 6.Zhao W, Zhou Y, Cui Q, Zhou Y. Paces: prediction of n4-acetylcytidine (ac4c) modification sites in MRNA. Sci. Rep. 2019;9:1–7. doi: 10.1038/s41598-018-37186-2. [DOI] [PMC free article] [PubMed] [Google Scholar]
- 7.Tahir M, Hayat M. inuc-stnc: a sequence-based predictor for identification of nucleosome positioning in genomes by extending the concept of saac and chou’s pseaac. Mol. BioSyst. 2016;12:2587–2593. doi: 10.1039/C6MB00221H. [DOI] [PubMed] [Google Scholar]
- 8.Hayat M, Tahir M. Psofuzzysvm-tmh: identification of transmembrane helix segments using ensemble feature space by incorporated fuzzy support vector machine. Mol. BioSyst. 2015;11:2255–2262. doi: 10.1039/C5MB00196J. [DOI] [PubMed] [Google Scholar]
- 9.Tahir, M., Hayat, M. & Chong, K. T. Prediction of n6-methyladenosine sites using convolution neural network model based on distributed feature representations. Neural Netw. (2020). [DOI] [PubMed]
- 10.Tayara H, Oubounyt M, Chong KT. Identification of promoters and their strength using deep learning. IBRO Rep. 2019;6:S552–S553. doi: 10.1016/j.ibror.2019.07.1738. [DOI] [Google Scholar]
- 11.Tahir, M., Hayat, M., Ullah, I. & Chong, K. T. A deep learning-based computational approach for discrimination of dna n6-methyladenosine sites by fusing heterogeneous features. Chemomet. Intell. Lab. Syst.104151, (2020).
- 12.Chicco D. Ten. quick tips for machine learning in computational biology. BioData Mining. 2017;10:35. doi: 10.1186/s13040-017-0155-3. [DOI] [PMC free article] [PubMed] [Google Scholar]
- 13.Breiman L. Random forests. Mach. Learn. 2001;45:5–32. doi: 10.1023/A:1010933404324. [DOI] [Google Scholar]
- 14.Schapire RE, Singer Y. Improved boosting algorithms using confidence-rated predictions. Mach. Learn. 1999;37:297–336. doi: 10.1023/A:1007614523901. [DOI] [Google Scholar]
- 15.Zhang H, Cao Z-X, Li M, Li Y-Z, Peng C. Novel naive bayes classification models for predicting the carcinogenicity of chemicals. Food Chem. Toxicol. 2016;97:141–149. doi: 10.1016/j.fct.2016.09.005. [DOI] [PubMed] [Google Scholar]
- 16.Cox DR. The regression analysis of binary sequences. J. Roy. Stat. Soc.: Ser. B (Methodol.) 1958;20:215–232. [Google Scholar]
- 17.Zhang, Z. et al. Opening the black box of neural networks: methods for interpreting neural network models in clinical applications. Ann. Trans. Med.6, (2018). [DOI] [PMC free article] [PubMed]
- 18.Kemp RA, MacAulay C, Palcic B. Opening the black box: the relationship between neural networks and linear discriminant functions. Anal. Cell. Pathol. 1997;14:19–30. doi: 10.1155/1997/646081. [DOI] [PMC free article] [PubMed] [Google Scholar]
- 19.Lee, D. D., Pham, P., Largman, Y. & Ng, A. Advances in neural information processing systems 22. Tech. Rep., Tech. Rep (2009).
- 20.Wei L, Chen H, Su R. M6apred-el: a sequence-based predictor for identifying n6-methyladenosine sites using ensemble learning. Mol. Ther. Nucleic Acids. 2018;12:635–644. doi: 10.1016/j.omtn.2018.07.004. [DOI] [PMC free article] [PubMed] [Google Scholar]
- 21.Chen W, Lv H, Nie F, Lin H. i6ma-pred: Identifying dna n6-methyladenine sites in the rice genome. Bioinformatics. 2019;35:2796–2800. doi: 10.1093/bioinformatics/btz015. [DOI] [PubMed] [Google Scholar]
- 22.Feng P, et al. idna6ma-pseknc: Identifying dna n6-methyladenosine sites by incorporating nucleotide physicochemical properties into pseknc. Genomics. 2019;111:96–102. doi: 10.1016/j.ygeno.2018.01.005. [DOI] [PubMed] [Google Scholar]
- 23.Wen J, et al. A classification model for lncrna and mrna based on k-mers and a convolutional neural network. BMC Bioinformat. 2019;20:469. doi: 10.1186/s12859-019-3039-3. [DOI] [PMC free article] [PubMed] [Google Scholar]
- 24.Liu B, Li K, Huang D-S, Chou K-C. ienhancer-el: identifying enhancers and their strength with ensemble learning approach. Bioinformatics. 2018;34:3835–3842. doi: 10.1093/bioinformatics/bty458. [DOI] [PubMed] [Google Scholar]
- 25.Nair AS, Sreenadhan SP. A coding measure scheme employing electron-ion interaction pseudopotential (eiip) Bioinformation. 2006;1:197. [PMC free article] [PubMed] [Google Scholar]
- 26.Han S, et al. Lncfinder: an integrated platform for long non-coding rna identification utilizing sequence intrinsic composition, structural information and physicochemical property. Brief. Bioinformat. 2019;20:2009–2027. doi: 10.1093/bib/bby065. [DOI] [PMC free article] [PubMed] [Google Scholar]
- 27.Bonidia, R. P., Sampaio, L. D. H., Lopes, F. M. & Sanches, D. S. Feature extraction of long non-coding rnas: A fourier and numerical mapping approach. In Iberoamerican Congress on Pattern Recognition, 469–479 (Springer, 2019).
- 28.Qiang X, Chen H, Ye X, Su R, Wei L. M6amrfs: robust prediction of n6-methyladenosine sites with sequence-based features in multiple species. Front. Genetics. 2018;9:495. doi: 10.3389/fgene.2018.00495. [DOI] [PMC free article] [PubMed] [Google Scholar]
- 29.Liu, K. & Chen, W. IMRM: a platform for simultaneously identifying multiple kinds of RNA modifications. Bioinformatics (2020). [DOI] [PubMed]
- 30.Tayara, H. & Chong, K. Improved predicting of the sequence specificities of RNA binding proteins by deep learning. IEEE/ACM Trans. Comput. Biol. Bioinf.1, (2020). [DOI] [PubMed]
- 31.Khanal J, Tayara H, Chong KT. Identifying enhancers and their strength by the integration of word embedding and convolution neural network. IEEE Access. 2020;8:58369–58376. doi: 10.1109/ACCESS.2020.2982666. [DOI] [Google Scholar]
- 32.Tahir M, Tayara H, Chong KT. Convolutional neural networks for discrimination of RNA pseudouridine sites. IBRO Rep. 2019;6:S552. doi: 10.1016/j.ibror.2019.07.1737. [DOI] [PMC free article] [PubMed] [Google Scholar]
- 33.Wahab A, Ali SD, Tayara H, To Chong K. iim-cnn: intelligent identifier of 6ma sites on different species by using convolution neural network. IEEE Access. 2019;7:178577–178583. doi: 10.1109/ACCESS.2019.2958618. [DOI] [Google Scholar]
- 34.Tayara H, Chong KT. Improving the quantification of DNA sequences using evolutionary information based on deep learning. Cells. 2019;8:1635. doi: 10.3390/cells8121635. [DOI] [PMC free article] [PubMed] [Google Scholar]
- 35.Tahir M, Tayara H, Chong KT. IPSEU-CNN: identifying RNA pseudouridine sites using convolutional neural networks. Mol. Ther. Nucleic Acids. 2019;16:463–470. doi: 10.1016/j.omtn.2019.03.010. [DOI] [PMC free article] [PubMed] [Google Scholar]
- 36.Tayara H, Tahir M, Chong KT. ISS-CNN: identifying splicing sites using convolution neural network. Chemometr. Intell. Lab. Syst. 2019;188:63–69. doi: 10.1016/j.chemolab.2019.03.002. [DOI] [Google Scholar]
- 37.Alam, W., Ali, S. D., Tayara, H. & Chong, K. T. A CNN-based RNA n6-methyladenosine site predictor for multiple species using heterogeneous features representation. IEEE Access (2020).
Associated Data
This section collects any data citations, data availability statements, or supplementary materials included in this article.