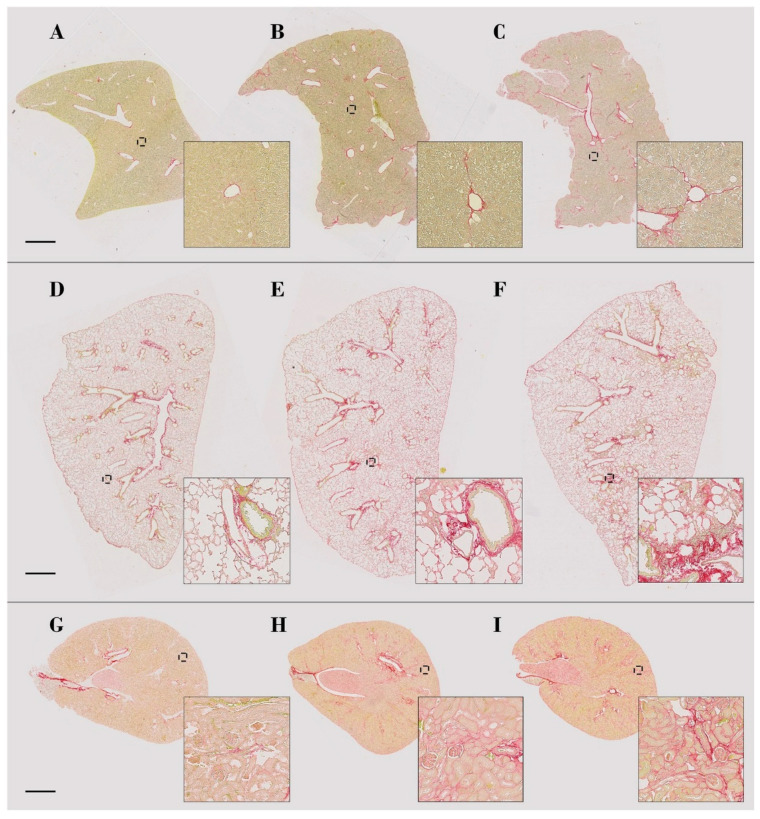
Figure 1.
Illustration of fibrosis development in the murine models of liver (A–C), lung (D–F) and kidney (G–I) fibrosis. Representative samples of control (A), 2w CCl4 (B), and 7w CCl4 (C) livers; control (D), BLM-acute (E), and BLM-chronic (F) lungs; control (G), 3w CIS (H), and 4w CIS (I) kidneys. Global view of entire histological sections (scale bar = 1 mm) and higher magnification of specific regions (inserts).

