

Abstract
Developing an imaging agent targeting the hepatocyte growth factor receptor protein (Met) status of cancerous lesions would aid in the diagnosis and monitoring of Met-targeted tyrosine kinase inhibitors (TKIs). A peptide targeting Met labeled with [99mTc] had high affinity in vitro (Kd = 3.3 nM) and detected relative changes in Met in human cancer cell lines. In vivo [99mTc]-Met peptide (AH-113018) was retained in Met-expressing tumors, and high-expressing Met tumors (MKN-45) were easily visualized and quantitated using single-photon emission computed tomography or optical imaging. In further studies, MKN-45 mouse xenografts treated with PHA 665752 (Met TKI) or vehicle were monitored weekly for tumor responses by [99mTc]-Met peptide imaging and measurement of tumor volumes. Tumor uptake of [99mTc]-Met peptide was significantly decreased as early as 1 week after PHA 665752 treatment, corresponding to decreases in tumor volumes. These results were comparable to Cy5⋆⋆-Met peptide (AH-112543) fluorescence imaging using the same treatment model. [99mTc] or Cy5⋆⋆-Met peptide tumor uptake was further validated by histologic (necrosis, apoptosis) and immunoassay (total Met, p Met, and plasma shed Met) assessments in imaged and nonimaged cohorts. These data suggest that [99mTc] or Cy5⋆⋆-Met peptide imaging may have clinical diagnostic, prognostic, and therapeutic monitoring applications.
HEPATOCYTE GROWTH FACTOR tyrosine kinase receptor (Met) is overexpressed in a variety of cancers, including gastric, colon, bladder, breast, liver, lung, head and neck, pancreatic, esophageal, cervical, and, prostate cancer; astrocytoma; and adult T-cell leukemia.1,2 The endogenous ligand for Met, hepatocyte growth factor (HGF) or scatter factor (SF), binds to Met and heparin sulfate proteoglycans on the cell surface, resulting in receptor dimerization, phosphorylation, and activation of the Met signaling pathway.1,3,4 Met signaling is required for normal early development (embryogenesis) and homeostasis in adulthood and promotes tissue repair and regeneration.4–7 The over-expression or amplification of Met or mutations in HGF in cancer causes Met signaling to become dysregulated, resulting in increased proliferation and angiogenesis, inhibition of apoptosis, and progression to metastatic disease.1,8,9 Patients whose tumors overexpress Met or HGF have a poorer prognosis and are more likely to exhibit drug resistance.10,11 For instance, in non-small cell lung cancer resistant to erlotinib and gefitinib, amplification of Met was observed, suggesting a role for Met in the development of drug resistance. Since activation of Met and its signaling pathways appears to be a survival pathway implemented by tumor cells in response to treatment, the ability to determine Met expression without resorting to tissue biopsy could be useful in determining when the addition of a Met-targeted therapeutic might be beneficial for the patient.
As a consequence of its important role in cancer growth, numerous Met-directed therapeutics have been developed. Some of these inhibit activation of the Met signaling pathway by antagonizing HGF binding to the Met extracellular domain or adenosine triphosphate (ATP) binding to the Met intracellular kinase domain.9,12–17 As these Met-directed therapeutics move forward to the clinic, the development of imaging agents specifically targeting Met would be useful for diagnosis, drug selection, and monitoring patient responses to specific molecularly targeted therapies. Furthermore, in vivo imaging of Met in human studies could assist drug development by monitoring real-time changes in Met status with Met-targeted therapeutics.
Although several potential Met imaging agents using monoclonal antibody (mAb), mAb fragments, or peptides radiolabeled with positron emission tomography (PET) or single-photon emission computed tomography (SPECT) radionuclides have been evaluated in preclinical mouse models, clinical translation of these agents has yet to be reported.18–22 In this work, we describe the preclinical evaluation of imaging agents targeting Met with the end goal toward development of Met imaging in a clinical setting. To be appropriate for clinical translation, such an agent will require not only a suitable ligand with high affinity for Met but also reliable synthetic methods that could easily be adapted for widespread clinical use. A small-molecular-weight cyclic peptide (AH-111972, GE Healthcare Life Sciences, Oslo, Norway; DX-1662, Dyax Corp., Cambridge, MA; 26 amino acids) has been identified through vector searching that binds to the extracellular domain of human Met with low nanomolar affinity determined by surface plasmon resonance technology (Biacore; GE Healthcare Life Sciences, Oslo, Norway) and fluorescence polarization techniques.23 This peptide has been labeled with 99mTc ([99mTc]-Met peptide [AH-113018]) or a fluorescent polymethine cyanine dye (Cy5⋆⋆-Met peptide [AH-112543]; similar fluorescence to Cy5, 653/675 nm) at the C-terminal end (lysine) for SPECT imaging or fluorescent surgical and endoscopic imaging, respectively (Figure 1).24 Using fluorescence polarization techniques (developed by GE Healthcare Life Sciences), the [99mTc]-Met peptide or the Cy5⋆⋆-Met peptide demonstrated half-maximal inhibitory concentrations (IC50) of ~ 200 nM, which was comparable to the unlabeled Met peptide (90 nM).23,25 Both of these labeled peptides have been formulated into a kit, which can easily be prepared for clinical application.
Figure 1.

Structures of the Met peptide (AH-111972, DX-1662) and modifications at the C-terminal lysine with incorporation of the cPn216 chelate (for radiosynthesis of the [99mTc]-Met peptide) or Cy5⋆⋆ (tetra SO3) for fluorescent imaging (653/675 nm).
In this article, we further assess the ability of [99mTc]-Met peptide and Cy5⋆⋆-Met peptide to image Met status noninvasively and demonstrate that Met expression can be modulated by Met-targeted therapeutics in preclinical mouse xenograft models.26,27 Preliminary in vitro binding studies with the [99mTc]-Met peptide were performed to determine the biological activity (% immunoreactivity), Kd, and Met concentrations (Bmax) in MKN-45 (human gastric carcinoma, high Met expressor), SNU-16 (human gastric carcinoma, moderate Met expressor), and U87-MG (human glioblastoma, low Met expressor) cells.28,29 These same cell lines were used in mouse xenograft models to determine the biodistribution and imaging characteristics of these agents. For the Cy5⋆⋆-Met peptide, preliminary studies included only imaging in MKN-45 xenograft mice to determine the optimal dose and time to image after dosing. For the treatment studies, MKN-45 xenograft mice were treated with PHA 665752, a known Met tyrosine kinase inhibitor (TKI), and imaged with either Cy5⋆⋆ or [99mTc]-Met peptide.30–32 The PHA 665752 treatment paradigm was further validated by examining changes in tumor volume, necrosis, and apoptosis between treated and untreated mice, and this was correlated to imaging results. Additionally, plasma and tumor samples were collected to evaluate shed Met and tumor Met abundance, respectively.28,33 As shed Met may interfere with the binding of the labeled Met peptide, we investigated the relationship between shed Met, tumor Met abundance, and tumor mass. These studies demonstrate the potential utility of Cy5⋆⋆-and [99mTc]-Met peptide to image Met and determine the efficacy of a targeted Met TKI therapeutic.
Materials and Methods
Cell Lines and Reagents
MKN-45, a human gastric carcinoma cell line (high Met expressor), was grown in RPMI-1640 (with 2 mM l-glutamine). SNU-16, a human gastric carcinoma cell line (moderate Met expressor), was grown in RPMI-1640 with 2 mM l-glutamine, 10 mM HEPES, 1 mM sodium pyruvate, 4,500 mg/L glucose, and 1,500 mg/L sodium bicarbonate. U87-MG, a human glioblastoma cell line (low Met receptor expressor), was grown in Dulbecco’s Modified Eagle’s Medium with 2 mM l-glutamine, 0.1 mM nonessential amino acids (Thermo Fisher Scientific, Grand Island, NY), and 1 mM sodium pyruvate. All media were supplemented with 10% fetal bovine serum and penicillin/streptomycin/amphotericin B. All cell lines were grown at 37°C in a 5% CO2 humidified atmosphere.
Both the unlabeled Met peptide (AH-111972 trifluoracetate salt [DX-1662], 26 amino acids, Cys4–16, 6–14; Ac-Ala-Gly-Ser-Cys-Tyr-Cys-Ser-Gly-Pro-Pro-Arg-Phe-Glu-Cys-Trp-Cys-Tyr-Glu-Thr-Glu-Gly-Thr-Gly-Gly-Gly-Lys) and Cy5⋆⋆-Met peptide (AH-112543; a kit formulation containing the lyophilized Met-peptide [AH-111972] conjugated to Cy5⋆⋆ [tetra-alkyl-sulfonated active ester cyanine dye, peak excitation/emission: 653/675 nm) were provided by GE Healthcare Life Sciences.
PHA 665752, ((2R)-1-[[5-[(Z)-[5-[[(2,6-dichlorophenyl) methyl]sulfonyl]-1,2-dihydro-2-oxo-3H-indol-3-ylidene] methyl]-2,4-dimethyl-1H-pyrrol-3-yl]–carbonyl]-2-(1-pyrrolidinylmethyl) pyrrolidine was purchased from Tocris Bioscience, Minneapolis, MN.
Radiosynthesis of [99mTc]-Met Peptide (AH-113018)
[99mTc]-Met peptide was synthesized using [99mTc]O4− (Cardinal Health, Dublin, OH) and a chelate kit labeling method. The chelate kit, provided by GE Healthcare Life Sciences, included one vial containing the lyophilized Met peptide (AH-113018, Met peptide with cPn216 chelate incorporated at the terminal lysine, 150 μg) and another vial containing the reducing agent (SnCl2), p-aminobenzoic acid, methylene diphosphonic acid in sodium carbonate buffer. The AH-113018 (following reconstitution with 0.1 mL of a 50:50 water:ethanol solution) and [99mTc]O4− (20 mCi) were added to the chelating kit vial, mixed, and allowed to set for 30 minutes at room temperature. The radiochemical purity was 93 ± 3% (n = 10) as determined by instant thin-layer chromatography (ITLC) (mobile phase = saline) in which [99mTc]-AH113018 stays at the origin and free [99mTc] (including [99mTc]O4−, [99mTc]O3−, [99mTc]O2) moves to the solvent front. With a purity level > 90%, this preparation was diluted in saline and suitable for biological studies requiring no further purification. The specific activity was ~ 430 Ci/mmol (n = 10).
In Vitro Studies with [99mTc]-Met Peptide (AH-113018)
Determination of Kd and Bmax
MKN-45 cells were placed in 24-well plates at 0.2 × 10⁶cells/well 1 day prior to the assay, whereas SNU-16 (0.2 to 0.8 × 10⁶ cells/tube) and U87-MG (0.2 to 1.0 × 10⁶cells/well) were placed in tubes on the day of the assay. Saturation studies were performed by adding increasing concentrations of [99mTc]-Met peptide (0.2–10 nM) to duplicate wells; nonspecific binding was determined by adding unlabeled Met peptide (10−6.3 M) to another set of duplicates at each [99mTc]-Met peptide concentration. Following incubation for 2 hours at 4°C, the cell-bound [99mTc]-Met peptide was separated from the free radioligand using the following methods: (1) MKN-45 cells in 24-well plates were washed with phosphate-buffered saline (PBS), treated with trypsin, and collected in vials to determine radioactive content; (2) SNU-16 or U87-MG cells in micro-centrifuge tubes were centrifuged and washed twice (PBS), and following aspiration, the radioactive content of the cell pellets was determined. The Kd and Bmax were determined from at least six to eight concentrations of [99Tc]-Met peptide and analyzed using nonlinear regression curve fits, including a one-site binding hyperbola for saturation studies (Graphpad Prism version 3.02 for Windows, GraphPad Software, San Diego, CA).
Immunoreactivity
A modification of the specific activity determination by self-displacement technique described by Morris was used to determine the immunoreactive fractions or biological specific activity of the [99mTc]-Met peptide.34,35 In this method, a self-displacement (or saturation curve) and a cold displacement curve were determined. Briefly, increasing concentrations of the [99mTc]-Met peptide (10−11 M to 10−8 M) were incubated with a constant concentration of MKN-45 cells (0.2 × 10⁶ cells /well), and the bound to free ratios (B/F) at each concentration were determined. The cold displacement curve was determined by adding increasing concentrations of unlabeled Met peptide to a constant concentration of cells (0.2 × 10⁶/well) and a constant concentration of [99mTc]-Met peptide; the B/F at each concentration of cold antibody was determined. Using the same B/F (y) from the self-displacement (saturation) and the cold displacement curve, the associated radioactivity (x, cpm) and the amount of unlabeled Met peptide required to displace the radiolabel (x, ng), respectively, were determined. The corresponding values (cpm versus ng) were then plotted and fitted with the line of best fit, in which the reciprocal of the slope represents the actual “biological” (immunoreactive) specific activity. The ratio of the immunoreactive specific activity to the theoretical specific activity (assumes total mass of antibody added during radiolabeling was recovered) represents the immunoreactive fraction.
Mouse Tumor Models and Drug Treatment
Athymic female nude mice (Ncr-nu/nu, National Cancer Institute, Frederick, MD) were injected subcutaneously on the right flank or shoulder with MKN-45, SNU-16, or U87-MG cells (5–8 × 10⁶ cells) in PBS with 30% Matrigel. MKN-45 mouse xenografts were used for all the longitudinal treatment imaging studies, monitored for tumor growth, and sorted into vehicle control and PHA 665752–treated groups once the tumors reached the appropriate size. The mice were injected intraperitoneally with vehicle (5% dimethyl sulfoxide [DMSO]:saline) or PHA 665752 (15 mg/kg in 5% DMSO:saline) either 5 days on/2 days off (Cy 5⋆⋆ Met peptide treatment group, tumor size at baseline = 40–230 mm3) or daily for 3 to 4 weeks ([99mTc]-Met peptide treatment group, tumor size at baseline = 30–50 mm3) following a baseline imaging scan.
Additional “naïve” imaging cohorts (not injected with the labeled Met peptide or imaged) from vehicle (n = 3) or treated (n = 3) groups were euthanized after 1, 2, 3, or 4 weeks of treatment from which blood and tumors were removed. The blood samples were collected in ethylenediaminetetraacetic acid (EDTA)-coated tubes, and after centrifugation, the separated plasma samples were fast frozen and stored at −70°C until assayed for shed Met. Tumors were weighed and then apportioned into separate samples as follows: (1) fixed in 10% neutral-buffered formalin and paraffin embedded for histologic evaluation and (2) fast frozen and stored at −70°C for determination of phosphorylated/total Met content. For the histologic evaluation, the tumor sections were stained with either hematoxylin and eosin (H&E) or ApopTag for apoptosis (Pathology/Histotechnology Laboratory, Laboratory Animal Sciences Program SAIC (Leidos)-Frederick Inc., Frederick, MD).
For all studies, the tumors were either measured in vivo and/or weighed ex vivo. For the longitudinal imaging studies, the tumors were measured weekly using calipers or ultrasound imaging (Vevo 2100, VisualSonics, Toronto, ON) and the volume was calculated using the formula for an ellipsoid [volume = 4/3π (1/2 (length × width × height)]. Statistical analysis of the differences between the PHA 665752- and vehicle-treated groups was done using the Welch t-test, with p < .05 as significant (GraphPad InStat version 3.00 for Windows, GraphPad Software)
All animal studies were performed in accordance with the National Institutes of Health’s Guidelines for the Care and Use of Laboratory Animals using Institutional Animal Care and Use Committee–approved protocols.
[99mTc]-Met Peptide Mouse Biodistribution Studies
Mice were injected intravenously (tail vein) with [99mTc]-Met peptide (10 to 20 μCi per mouse, 0.02–0.04 nmol) and euthanized (CO2 inhalation) at the appropriate time. The blood and various tissues were excised from each animal, weighed, and assayed for radioactive content by gamma counting (Wizard 1480, PerkinElmer, Shelton, CT). The total activity in the blood and each tissue was expressed as the % injected dose per gram normalized to a 20 g mouse [%ID/g = (cpmtissue × body weight)/(cpmtotal injected) × 20) 100]. An additional blood sample was also taken for determination of shed Met, which was processed as described above and assayed after the radioactivity had decayed. Immediately following counting, whole tumors and/or tumor samples were either fast frozen or fixed and assayed as described above.
For the blocking studies with unlabeled Met peptide, MKN-45 tumor-bearing mice were divided into two groups, with one group receiving [99mTc]-Met peptide (~ 10 μCi per mouse, 0.02 nmol associated mass) only and the other group receiving a coinjection of the same amount of [99Tc]-Met peptide + 24 nmol of unlabeled Met peptide. The mice were euthanized after 2 hours, and the processing of the blood and tissues was performed as described above. Statistical analysis of the differences between the two groups was done using the Welch t–test, with p < .05 as significant (GraphPad InStat version 3.00 for Windows).
MicroSPECT Imaging Studies
Tumor-bearing mice were anesthetized using isoflurane/O2 (1.5–3% v/v) and imaged at various times after intravenous injection (tail vein) of [99mTc]-Met peptide (50–150 μCi, 0.1–0.3 nmol, per mouse), for a total imaging time of 15 to 20 minutes per mouse using the NanoSPECT/CT (Bioscan Inc., Washington, DC). For the treatment studies, both groups of mice were imaged after 90 minutes of [99mTc]-Met peptide uptake at baseline and then once a week for 4 weeks. Following each SPECT/CT imaging session, three-dimensional (3D) ultrasonography (Vevo 2100) was performed with the MS-550S transducer at 40 MHz with a 0.076 mm step size (image thickness), from which the tumor volumes were determined (parallel region of interest [ROI] algorithm, Vevo 2100 version 1.4.0). After the final imaging session, the mice were euthanized, whereupon blood and tumors were collected and analyzed as described above after the radioactivity had decayed.
Using the InVivoScope software (Bioscan, Poway, CA), the images were reconstructed by an ordered subset expectation maximization iterative multiplexing multipinhole reconstruction algorithm from which ROI were drawn and standardized uptake values (SUVs) were determined. The SUVs (μCi/cc) normalized to a 20 g mouse were calculated as follows: (SUV × body weight)/(injected dose × 20) 100. Statistical analysis of the differences between the two groups was done using the Welch t–test, with p < .05 as significant (GraphPad InStat version 3.00 for Windows).
Cy5⋆⋆-Met Peptide (AH-112543) Spectral Fluorescence Imaging Studies
In preliminary imaging studies, MKN-45 xenograft mice were injected intravenously with 0.5, 1.0, or 2 nmol of Cy5⋆⋆-Met peptide and imaged at various times. For the treatment studies, MKN-45 tumor-bearing mice were injected with 1 nmol of Cy5⋆⋆-Met peptide and imaged after 60 minutes once a week for 4 to 5 weeks following a baseline study. Images were acquired using the Maestro In Vivo Imaging System (PerkinElmer, Waltham, MA) using a red light filter for excitation (615–665 nm) and a true yellow filter (630–680 nm) for emission, and then the signal was “unmixed” with a Cy5⋆⋆ spectral library using the Maestro software and corrected for autofluorescence. After the final imaging session, the mice were euthanized and blood and the tumors were collected and analyzed as described above.
ROI were drawn over the tumor and a nontarget tissue (lower left hind side away from the tumor) from which total signal intensities (scaled counts/s) were determined. The tumor total signal intensity was corrected for background by subtracting the nontarget contribution. Statistical analysis of the differences between the two groups was determined with the Student t-test (p < .05).
Determination of Plasma Shed Met and Total Tumor Met
Met protein content and plasma soluble Met ectodomain (shed Met) levels were measured using a two-site electrochemiluminescent immunoassay developed for use with a SectorImager 2400 plate reader.5 (Meso Scale Discovery [MSD], Rockville, MD). Detection antibodies were tagged with a ruthenium chelate (MSD Sulfo-Tag), which, in the presence of appropriate redox reagents, emits light when current is applied to the multiwell plate; this light is measured by the SectorImager’s charge-coupled device (CCD) camera. Purified recombinant Met ectodomain–IgG-fc fusion protein was used as a reference standard for quantitation of Met mass per mass total extracted cell protein. Tumor tissue extracts were prepared by physically disrupting tissue samples before clearing by centrifugation and analysis of Met content as described above.
Correlations of shed Met, total tumor Met, tumor [99mTc], or Cy5⋆⋆ Met peptide content to tumor mass or total tumor mass were performed using the Spearman rank correlation coefficient using Graphpad InStat version 3.0 for Windows or Graphpad Prism version 3.02 for Windows).
Results
In Vitro Cell Binding Studies with 99mTc-Met Peptide
From in vitro saturation studies, [99mTc]-Met peptide exhibited high specific binding for Met ranging from 79 to 99% and high affinity with a Kd of 3.31 nM ± 0.58 (n = 5). The percent immunoreactivity (immunoreactive fraction) from these batches was 84.9% ± 4.0 (n = 5), indicating that most of the biological activity was preserved after radiosynthesis. The Met receptor concentrations for MKN-45 cells (Bmax) were high, with 7.72 × 10⁵ ± 1.59 × 10⁵ (n = 5) receptors per cell. In similar saturation studies with the low Met-expressing cell line, U87-MG cells, specific binding was substantially lower (< 40%), with a Bmax of 0. 085 × 105 ± 0.014 × 10⁵ (n = 4), which was ~ 90-fold lower than the Met concentrations found for MKN-45 cells.28,29 These data compare favorably with the expected levels of Met expression for these human cancer cell lines, indicating that this tracer would be appropriate for imaging tumors with high Met expression (> 600,000 receptors per cell), but at low Met expression levels (< 9,000 receptors per cell), nonspecific interactions would hamper the detection of specific Met binding.
In Vivo Biodistribution Studies with [99mTc]-Met Peptide
The biodistribution of [99mTc]-Met peptide was determined in MKN-45 xenografts after 30, 60, 120, and 180 minutes (Figure 2 and Table 1). Uptake (%ID/g) of the [99mTc]-Met peptide was rapid with the highest uptake observed in the tumor and kidney for all time points. The most rapid clearance (> 70%) of the [99mTc]-Met peptide was from the blood, heart, lungs, spleen, and muscle from 30 to 180 minutes, whereas slower clearances were observed in the liver, kidney, and tumor, with decreases of 49%, 63%, and 52%, respectively, over the same time course. These pharmacokinetics and the high radioactive content in the kidney would suggest renal clearance as the primary route of excretion for [99mTc]-Met peptide. The tumor uptake of 10.13 ± 1.56 %ID/g and 9.36 ± 1.92 %ID/g remained relatively constant from 30 to 60 minutes, respectively, whereas at 120 and 180 minutes, the tumor uptake decreased by 46% (5.03 ± 0.67 %ID/g) and 63% (4.19 ± 0.98 %ID/g), respectively. This relatively slow tumor clearance of [99mTc]-Met peptide would suggest high-affinity binding to Met. Similar biodistribution studies were performed with mice implanted with SNU-16 (moderate Met expression) or U87-MG cells (low Met expression). SNU-16 tumor uptake was ~ 2- to 3-fold lower at 30 minutes (4.59 ± 0.50 %ID/g; n = 4), 60 minutes (2.61 ± 0.82 %ID/g; n = 4) and 120 minutes (1.30 ± 0.34 %ID/g; n = 4), whereas U87-MG tumor uptake was 7- to 8-fold lower at 60 minutes (1.19 ± 0.11 %ID/g; n = 3), 120 minutes (0.71 ± 0.15 %ID/g; n = 3), and 180 minutes (0.58 ± 0.09 %ID/g; n = 6) compared to MKN-45 tumors, which was commensurate with the lower expression levels of these two tumor cell lines (data not shown). Uptakes in nontarget tissues for both the SNU-16 and U87-MG xenografts were comparable to the MKN-45 xenografts (see Figure 2), with the highest uptake always observed in the kidney.
Figure 2.

Biodistribution of [99mTc]-Met peptide in MKN-45 xenografts after 30, 60, 120, and 180 minutes. Each bar represents (% injected dose per gram [%ID/g]) ± SD of [99mTc]-Met peptide (n = 4 [60-minute group] or 5 [all other time points]).
Table 1.
Biodistribution of [99mTc]-Met Peptide in MKN-45 Xenografts after 30, 60, 120, and 180 Minutes
| %ID/g (normalized to a 20 g mouse) | ||||
|---|---|---|---|---|
| 30 min | 60 min | 120 min | 180 min | |
| Blood | 3.19 ± 0.18 | 1.81 ± 0.54 | 1.00 ± 0.14 | 0.54 ± 0.01 |
| Heart | 1.63 ± 0.18 | 0.64 ± 0.15 | 0.24 ± 0.03 | 0.14 ± 0.01 |
| Lungs | 5.18 ± 0.61 | 1.50 ± 0.27 | 0.55 ± 0.05 | 0.32 ± 0.01 |
| Liver | 3.49 ± 0.29 | 1.69 ± 0.17 | 1.78 ± 0.08 | 1.18 ± 0.10 |
| Kidneys | 26.67 ± 3.40 | 11.84 ± 1.11 | 9.64 ± 1.33 | 6.80 ± 0.80 |
| Spleen | 1.61 ± 0.24 | 0.61 ± 0.07 | 0.43 ± 0.06 | 0.30 ± 0.01 |
| MKN-45 tumor | 10.13 ± 1.56 | 9.36 ± 1.92 | 5.03 ± 0.67 | 4.19 ± 0.98 |
| Muscle | 0.92 ± 0.27 | 0.27 ± 0.07 | 0.10 ± 0.01 | 0.08 ± 0.01 |
Each value represents (% injected dose per gram [%ID/g]) ± SD of [99mTc]-Met peptide (n = 4 [60-minute group] or 5 [all other time points]).
By examining the ratios of the tissue uptakes (%ID/g) to muscle uptakes, a further estimation of imaging feasibility can be assessed. High tumor to muscle ratios of 9.8 ± 2.1, 30.1 ± 3.3, 49.6 ± 11.3, and 55.2 ± 13.4 were observed at 30, 60, 120, and 180 minutes, respectively, in the MKN-45 xenografts, whereas in comparison, the tumor to muscle ratios of SNU-16 and U87-MG xenografts were reduced by 2- to 4-fold and 10- to 16-fold, respectively, indicative of reduced Met densities, as expected for these cell lines (Figure 3). The continual increase in the tumor to muscle ratios over time is reflective of the increased rate of [99mTc]-Met peptide clearance from the muscle compared to the tumors rather than an increase in tumor uptake. The highest tissue to muscle ratios were observed in the kidneys, where ratios were 30 ± 4.5, 54 ± 12.8, 101 ± 13.8, and 89 ± 8.1 at 30, 60, 120, and 180 minutes, respectively, which exceeded the tumor to muscle ratios over the same time course by 1.6- to 3-fold. These high ratios in the kidneys suggest that it will be difficult to image tumors in the kidneys and urinary tract.
Figure 3.

Comparison of tumor (% injected dose per gram [%ID/g]) to muscle (%ID/g) ratios (T:M) of [99mTc]-Met peptide in MKN-45, SNU-16, and U87-MG xenografts after 30, 60, 120, and 240 minutes. Each bar represents the mean T:M ± SD (MKN-45 tumors: n = 4 [60-minute group] or 5 [all other time points]; U87-MG tumors: n = 3 [60- and 120-minute groups] or 6 [180-minute group]); SNU-16 tumors: n = 4 [all groups]) and T:M from blocking study in which MKN-45 xenografts were injected with [99mTc]-Met peptide only or [99mTc]-Met peptide + unlabeled Met peptide. Each bar represents the mean T:M ± SD, n = 3; ⋆p = .0028.
Blocking studies were performed in mice with MKN-45 xenografts in which one group was injected with [99mTc]-Met peptide only and another group was coinjected with the same amount of [99mTc]-Met peptide and 24 nmol of unlabeled Met peptide (~ 1,200 times the mass associated with the radiolabel). After 120 minutes, the uptake (%ID/g) was determined in the blood and other tissues and found comparable for both groups in all nontarget tissues except the spleen, which was significantly increased ~ 170% (p < .02), and the tumor, which was significantly decreased 62% (p = .0067) in the blocked group compared to the [99mTc]-Met peptide–only group. The significant decrease in tumor uptake of the blocked group strongly suggests that the [99mTc]-Met peptide is competing for the same site as the unlabeled peptide. Similar results were obtained for tumor to muscle ratios in which the blocked group showed lower tumor to muscle ratios (53%, p = .0028) compared to the unblocked group, again providing further proof of specific Met binding in vivo (see Figure 3). It should be noted that the tumor to muscle ratios in these studies were ~ 1.8-fold lower than the tumor to muscle ratio obtained from the first biodistribution study because there was a considerable disparity in the size of the tumors between the studies as the tumors from the blocking studies were much larger (0.1 to 1.0 g versus < 0.3 g) compared to the first study.
MicroSPECT Imaging Studies
Initial microSPECT imaging studies were performed in MKN-45 xenografts to determine the optimal dose and timing for imaging postinjection of the [99mTc]-Met peptide. MKN-45 tumors were clearly visualized at 60 minutes (Figure 4A), with tumor uptake (%ID/g) fairly constant to ~ 112 minutes and then decreasing ~ 35% at 144 minutes. At the same time, although renal uptake continued to decline, this activity always exceeded the activity in the tumor. From these studies, an imaging time of 90 minutes postinjection of [99mTc]-Met peptide (150–250 μCi) was established as optimal, and subsequent longitudinal studies were performed at this time (Figure 4B).
Figure 4.

(A) Representative coronal image from a mouse with a MKN-45 tumor (on the right shoulder) obtained 60 minutes following injection of [99mTc]-Met peptide. (B) Representative coronal images from a mouse with a MKN-45 tumor (on the right shoulder) at baseline and then after 8, 14, and 21 days of treatment with PHA 665752 or vehicle; images were obtained 90 minutes following injection of [99mTc]-Met peptide. (C) MKN-45 tumor uptakes (% injected dose per gram [%ID/g]) in PHA 665752- or vehicle-treated xenografts. Each point represents the mean ± SE, n = 9 per group, ⋆p < .05. (D) Percent increase in MKN-45 tumor volumes (cm3) in PHA 665752- or vehicle-treated xenografts compared to baseline. Each point represents the mean ± SE, n = 9 per group, ⋆p < .05. (E) Histologic grading of necrosis (hematoxylin-eosin [H&E] staining) and apoptosis (IHC, ApopTag) in MKN-45 tumor sections obtained from imaged vehicle- and PHA 665752-treated xenografts after the last imaging session at 3 weeks. (F) Correlations of [99mTc]-Met peptide tumor uptakes of larger tumors (> 0.5 g) of the vehicle imaged group (y = 1.27x, R2 = 0.9229, n = 9) compared to smaller tumors (< 0.2 g) from biodistribution studies (y = 4.16x; R2 = 0.9738, n = 7).
Longitudinal imaging studies were performed to assess the ability of [99mTc]-Met peptide to monitor changes in Met expression in MKN-45 tumors of xenografts following treatment with the Met TKI PHA 665752. In these studies, xenografts were imaged prior to treatment (baseline) and then once a week for 3 weeks after beginning treatment; one group was treated intraperitoneally daily with vehicle (saline, 5% DMSO) and another group was treated with PHA 665752 (15 mg/kg, saline, 5% DMSO). Representative coronal images of a single PHA 665752–treated and vehicle xenograft mouse pair obtained at baseline and each subsequent week are shown in Figure 4B, from which ROI were drawn for quantitation of the tumor uptake. The tumor uptake (%ID/g) of [99mTc]-Met peptide in the treated group compared to the vehicle group was decreased 43% (p = .005), 42% (p = .026), and 25% at days 8, 14, and 21, respectively, with days 8 and 14 achieving statistical significance (Figure 4C). The tumor volumes determined by 3D ultrasonography were found to be decreased in the treated group by 25%, 36% (p = .036), and 55% (p = .016) at days 8, 14, and 21, respectively, compared to the vehicle group (Figure 4D). Although these tumor volumes decreased over the entire time course, significant reductions were only observed later at days 14 and 21, whereas [99mTc]-Met peptide tumor uptake was significantly reduced by day 8.
After the last imaging session, tumors were excised and sectioned for determinations of necrosis and apoptosis by H&E staining and immunohistochemistry (IHC; ApopTag), respectively, in the vehicle- and PHA 665752-treated groups (Figure 4E). The tumors from the vehicle group were larger tumors (typically > 0.5 g), and 78% were severely necrotic (+4). Similarly, the fraction of severely necrotic tumors from the PHA 665752–treated group was also 78%; however, only 44% of the tumors were > 0.5 g. Differences in the severity of apoptosis were less pronounced between the vehicle and treated groups, with only 22% of tumors from the treated group exhibiting moderately severe apoptosis compared to the vehicle tumors. Furthermore, although the total [99mTc]-Met peptide uptakes per tumor (%ID/tumor) highly correlated to tumor weight, a 2- to 3-fold reduction was observed in the slopes (%ID/g) of these larger (> 0.5 g) control tumors (slope = 1.3) compared to smaller (< 0.2 g) tumors (slope = 4.2), as determined from linear regression analysis (Figure 4F). The decreased uptake in these large tumors is consistent with highly necrotic tumors with limited central blood flow, hindering delivery of the [99mTc]-Met peptide to the tumor tissue, which was visually observed in some of the SPECT images of larger tumors (> 0.5 g). In particular, this heterogeneous distribution was seen in the SPECT image of the vehicle xenograft at 3 weeks (see Figure 4B), in which only the outer surface of this large necrotic tumor (0.74 g, histologic grade = +4, severe) was visualized with intense [99mTc]-Met peptide uptake, whereas the interior of the tumor was barely discernible, indicating a high degree of necrosis.
Correlation of [99mTc]-Met Peptide Tumor Uptakes with Shed Met, Tumor Volumes, and Met Content in Vehicle-Treated and PHA 665752–Treated MKN-45 Xenografts
Plasma and tumor samples obtained from naïve and imaged MKN-45 xenografts treated with vehicle or PHA were analyzed for shed Met ectodomain, total tumor Met, and total tumor phosphorylated Met (pMet) content, respectively, and then correlated to tumor mass and/or the total tumor radioactive content (% injected dose [%ID] per tumor) (Figure 5). In the naïve (nonimaged) vehicle xenografts, the correlation of the tumor masses with shed Met (see Figure 5A), total tumor Met content (see Figure 5B), and total tumor pMet (see Figure 5C) was extremely significant (p < .0001), but in the case of the PHA-treated xenografts (21 and 27 days), only the correlation of the tumor masses with total tumor Met and total tumor pMet was extremely significant (p < .0003), with the shed Met to tumor mass exhibiting a lower but still significant correlation of p < .0265 (see Figure 5A). The tumor uptake (%ID) of [99mTc]-Met peptide of the imaged MKN-45 xenografts that had been treated for 21 days with either vehicle or PHA highly correlated with the tumor mass, total tumor Met, and total tumor pMet content (see Figure 5, D–F), indicating that [99mTc]-Met peptide tumor uptakes reflect Met density. Furthermore, the slopes derived from these correlations in the imaged treated and vehicle-treated groups were similar, whereas the slopes of the nonimaged vehicle-treated cohorts were increased compared to the treated cohort (see Figure 5, B and C). Most likely, this lack of difference in the slopes in the imaged groups is due to lower slopes in the vehicle-treated group as a consequence of the considerable number of larger tumors. Shed Met in plasma samples correlated to tumor mass in vehicle-treated (not shown, r = .7857; p = .048, n = 7) and PHA-treated (r = .8571; p = .0238, n = 7) xenografts that had undergone imaging with slopes of 43.7 and 77.7 plasma shed Met (ng/mL)/tumor mass (g), respectively. These slopes were comparable to those obtained with nonimaged vehicle- and PHA-treated xenografts of 43.8 and 77.5 plasma shed Met (ng/mL)/tumor mass (g), respectively (see Figure 5A), indicating that the presence of [99mTc]-Met peptide does not appear to alter shed Met plasma concentrations.
Figure 5.

Correlations of plasma shed Met, total Met tumor content, and total pMet tumor content with tumor mass (all correlations determined using Spearman nonparametric analysis, r = Spearman r). (A) to (C); Correlations of plasma and tumor samples from naïve (nonimaged) MKN-45 xenografts: (A) tumor mass with plasma shed Met: vehicle: r = .7899, p < .0001, n = 39; PHA treated (21 and 27 days): r = .8308, p < .0001, n = 16; (B) tumor mass with total Met: vehicle: r = .6906, p < .0001, n = 37; PHA treated (21 and 27 days): r = .7667, p < .0005, n = 16; (C) tumor mass with pMet: vehicle: r = .6033, p < .0001, n = 37; PHA treated (21 and 27 days): r = .5210, p < .0385, n = 16. (D) to (F); Correlation of tumor mass, total Met, and total pMet with [99mTc]- Met peptide tumor uptakes (% injected dose per gram [%ID/g]) from imaged MKN-45 xenografts that were treated with vehicle or PHA 665752 for 21 days: (D) tumor mass with %ID/g per tumor: vehicle: r = .950, p = .0004, n = 9; PHA treated: r = .9000, p = .0002, n = 9; (E) %ID/g with total Met per tumor: vehicle: r = .8833, p = .0031, n = 9; PHA treated: r = .8833, p = .0031, n = 9; (F) tumor mass with total pMet: vehicle: r = .8833; p = .0031, n = 9; PHA treated: r = .8333, P = .0083, n = 9.
Comparisons of PHA 665752 Treatment Effects in Imaged and Nonimaged Mice
To further validate the effects of PHA 665752 treatment observed in the longitudinal imaging studies conducted with [99mTc]-Met peptide in MKN-45 xenografts (see Figure 4), naïve (nonimaged) cohorts were euthanized at 1, 2, 3, or 4 weeks posttreatment to coincide with the imaging time points. In these euthanized groups, tumor growth was measured weekly by caliper, and then after euthanasia, tumors were excised, weighed, and sampled for assessment of necrosis (H&E staining), apoptosis (ApopTag), total Met content, and pMet; in addition, blood samples were taken for plasma shed Met determinations. PHA 665752 treatment significantly decreased tumor volumes and weights by 65 to 88% in treated groups at 7, 14, 21, and 28 days posttreatment compared to vehicle groups (Figure 6A). These results compared favorably to the tumor volume decreases observed with the groups receiving [99mTc]-Met peptide (see Figure 4D) except at the 7-day time point, which, although decreased (27%) with treatment, was not significant compared to the imaged vehicle group. This result might be expected considering that the majority of the tumors of the imaging vehicle group were larger necrotic tumors.
Figure 6.

(A) Increase (%) in MKN-45 tumor volumes (cm3) or tumor weight in PHA 665752- or vehicle-treated xenografts compared to baseline over time. Each point represents the mean ± SE, n for each group at 7, 14, 21, and 28 days, respectively: vehicle volume = 32, 20, 12, 3; PHA volume = 41, 26, 16, 5; vehicle weight = 12, 10, 8, 4; PHA weight = 9, 10, 9, 5; ⋆,⋆⋆Significant difference at the same time point between vehicle and treated tumor volumes (⋆p < .05 or ⋆⋆p < .01) or weights (⋆p < .05 or ⋆⋆p < .01. (B) Histologic grading of necrosis (H&E staining) and apoptosis (IHC, ApopTag) of MKN-45 tumor sections from the same vehicle- (n = 34) and PHA 665752–treated tumors (following 1, 2, 3, or 4 weeks, n = 33), as shown in (A). (C) Levels of plasma shed Met (ng/mL) per gram of tumor between vehicle and PHA665752 treatment euthanized cohorts compared to imaged groups at 1, 2, or 3 to 4 weeks posttreatment. Each bar represents the plasma shed Met (mean) ± SE (euthanized groups n: vehicle = 34, post 1, 2, 3 to 4 = 9, 10, 14; imaged vehicle or treated [3–4 weeks] = 9); ⋆,⋆⋆Significant increases in euthanized or imaged treatment groups versus respective vehicles, ⋆p < .05 or ⋆⋆p < .01. (D) Levels of tumor Met (ng/g of tumor) of MKN-45 tumors from either euthanized or imaged vehicle and PHA665752 treatment groups compared by weeks of treatment and different tumor weight ranges. Each bar represents tumor Met (mean) ± SE (n: < 3 g [vehicle = 34, PHA (weeks): 1–4 = 33, 1 = 13, 2 = 11, 3–4 = 16]; < 1 g [vehicle = 28, PHA (weeks): 1–4 = 27, 1 = 10, 2 = 6, 3–4 = 13]; < 0.6 g [vehicle = 17, PHA (weeks): 1–4 = 18, 1 = 7, 2 = 5, 3–4 = 8]; imaged vehicle or treated (3–4 weeks) = 9]). ⋆,⋆⋆Significant decreases in tumor Met in tumors between treated groups and vehicles of the same corresponding weight ranges, ⋆p < .05 or ⋆⋆p < .01. (E) Levels of pMet (SI/g of tumor) in MKN-45 tumors from either euthanized or imaged vehicle and PHA 665752 treatment groups compared by weeks of treatment and different tumor weight ranges. Each bar represents pMet (mean) ± SE (n: < 3 g [vehicle = 34, PHA (week): 1–4 = 33, 1 = 9, 2 = 9, 3–4 = 16]; < 1 g [vehicle = 28, PHA: 1–4 = 27, 1 = 7, 2 = 6, 3–4 = 13]; < 0.6 g [vehicle = 17, PHA: 1–4 = 18, 1 = 5, 2 = 4, 3–4 = 8]; imaged vehicle or treated [3–4 weeks] = 9). ⋆,⋆⋆Significant decreases in tumor pMet between treated groups and vehicles of the same corresponding weight ranges, ⋆p < .05 or ⋆⋆p < .01.
Histologic analysis of necrosis in PHA-treated and vehicle-treated tumors appeared similar, with the majority of vehicle (74%) and treated (82%) tumors exhibiting moderate to severe (3+, 4+) necrosis over a wide range of tumor weights (0.1–3.0 g) (Figure 6B). Although the degree of necrosis was quite variable in tumors < 1 g, tumors > 1 g most often exhibited necrosis, suggesting that tumor size may influence total tumor Met and total tumor pMet content, whereby levels may be decreased in larger tumors due to necrosis rather than a specific treatment effect. Similarly, the level of apoptosis in the treated tumors appeared comparable to that in the vehicle tumors, although the majority of the vehicle (74%) and treated (85%) tumors were minimally apoptotic (1+, 2+).
Levels of plasma shed Met (ng/mL per g [tumor]) were significantly increased ~ 2-fold at 1, 2, and 3 to 4 weeks after treatment compared to the vehicle controls (Figure 6C). This ~ 2-fold increase in shed Met plasma concentrations in the treated groups was in accordance with the respective increased Met concentrations per tumor mass of 77.5 and 43.8 plasma shed Met (ng/mL) for treated and vehicle groups, respectively, derived from the slopes in Figure 4A.
Tumor Met (ng/g [tumor]) and tumor pMet (SI/g [tumor]) levels were always decreased in treated groups compared to vehicle groups, although there was some tumor-size dependence (Figure 6, D and E). In particular, only in the smaller tumors (< 0.6 g) were tumor Met levels significantly reduced, 47 to 48% (1–4 weeks, p = .00201, n = 18; 3–4 weeks, p = .022, n = 8), compared to vehicles; these reduced Met levels in the treated groups remained relatively constant regardless of the time on treatment (see Figure 6D). Similarly, tumor pMet levels were reduced in all the treated groups compared to the corresponding vehicle groups, with significant decreases observed in the smaller tumors (< 0.6 g) at all weeks posttreatment and tumors < 1g after 3 to 4 weeks of treatment (see Figure 6E). The pMet levels of the smaller tumors (< 0.6 g) from all treatment groups had the greatest reductions, ranging from 52 to 58%, compared to the corresponding vehicle group (< 0.6 g; p = .025 [1 week], p = 0.043 [2 weeks], p = 0.0026 [3 to 4 weeks]); these pMet levels for the treated smaller tumors (< 0.6 g) did not vary substantially over the treatment time course, indicating that increased time on treatment did not cause further increases in pMet inhibition. Most likely, the significant differences between treated and vehicle groups with smaller tumors may be attributed in part to less necrosis, increased tumor homogeneity, and a concomitant increase in the accuracy of tumor sampling. Therefore, tumor samples derived from smaller tumors may more accurately assess Met/pMet levels per gram of tumor compared to larger tumors with a greater degree of necrosis-induced heterogeneity. Although, for the most part, the results of the nonimaged groups treated for 3 to 4 weeks agreed with the results of the imaged groups, it is important to note that the tumors of the imaged vehicle group are larger necrotic tumors and, as such, most comparable to the nonimaged vehicle groups with the larger tumors, < 3 g and < 1 g (see Figure 6, D and E, and Figure 4E).
Cy5⋆⋆-Met Peptide (AH-112543) Spectral Fluorescence Imaging Studies
Preliminary Cy5⋆⋆-Met peptide (Cy5⋆⋆-Met) imaging studies were performed in MKN-45 xenograft mice to determine the optimal imaging parameters and the relationship between tumor size and signal intensity. MKN-45 xenograft mice were injected intravenously with 0.5, 1, or 2 nmol of Cy5⋆⋆-Met and imaged at 30, 60, 90, and 120 minutes postinjection; the best results were obtained with the dose of 1 nmol after 60 minutes of uptake in which tumor fluorescent signal intensities were 2- to 5-fold greater than background (Figure 7A). The kidneys were the only other organs visualized in the images, indicating that renal clearance was the primary route of excretion. MKN-45 xenograft mice were imaged once a week for 4 weeks, and Cy5⋆⋆-Met fluorescence (signal intensity, scaled counts/s) was quantitated. The Cy5⋆⋆-Met tumor uptake increased linearly and highly correlated with tumor volumes < 350 mm3 (r = .965) and < 100 mm3 (r = .985), whereas tumor volumes that exceeded 600 mm3 had decreased uptakes in relation to their volumes, causing a 4- to 5-fold decrease in slope and a poorer linear correlation (r = .859; Figure 7B). These results confirm that tumors > 600 mm3 have significant necrosis limiting Cy5⋆⋆-Met uptake. Additionally, larger lesions have reduced uptake due to limitations in detecting the fluorescent signal because of tissue depth, absorption, and light scattering.36 It is important to note that these limitations have resulted in complicating accurate image reconstruction, so the fluorescence signal (signal intensity, scaled counts/s) represents a relative measure of Cy5⋆⋆ Met concentrations in the tumors, whereas the Met concentrations determined from the SPECT imaging with the [99mTc] Met peptide uptake represent an absolute measure. The 1 nmol dose required for the fluorescent imaging was 3 to 10 times higher than the dose required for SPECT imaging, which may also be attributable to this variable tissue attenuation of the fluorescent signal.24,37
Figure 7.
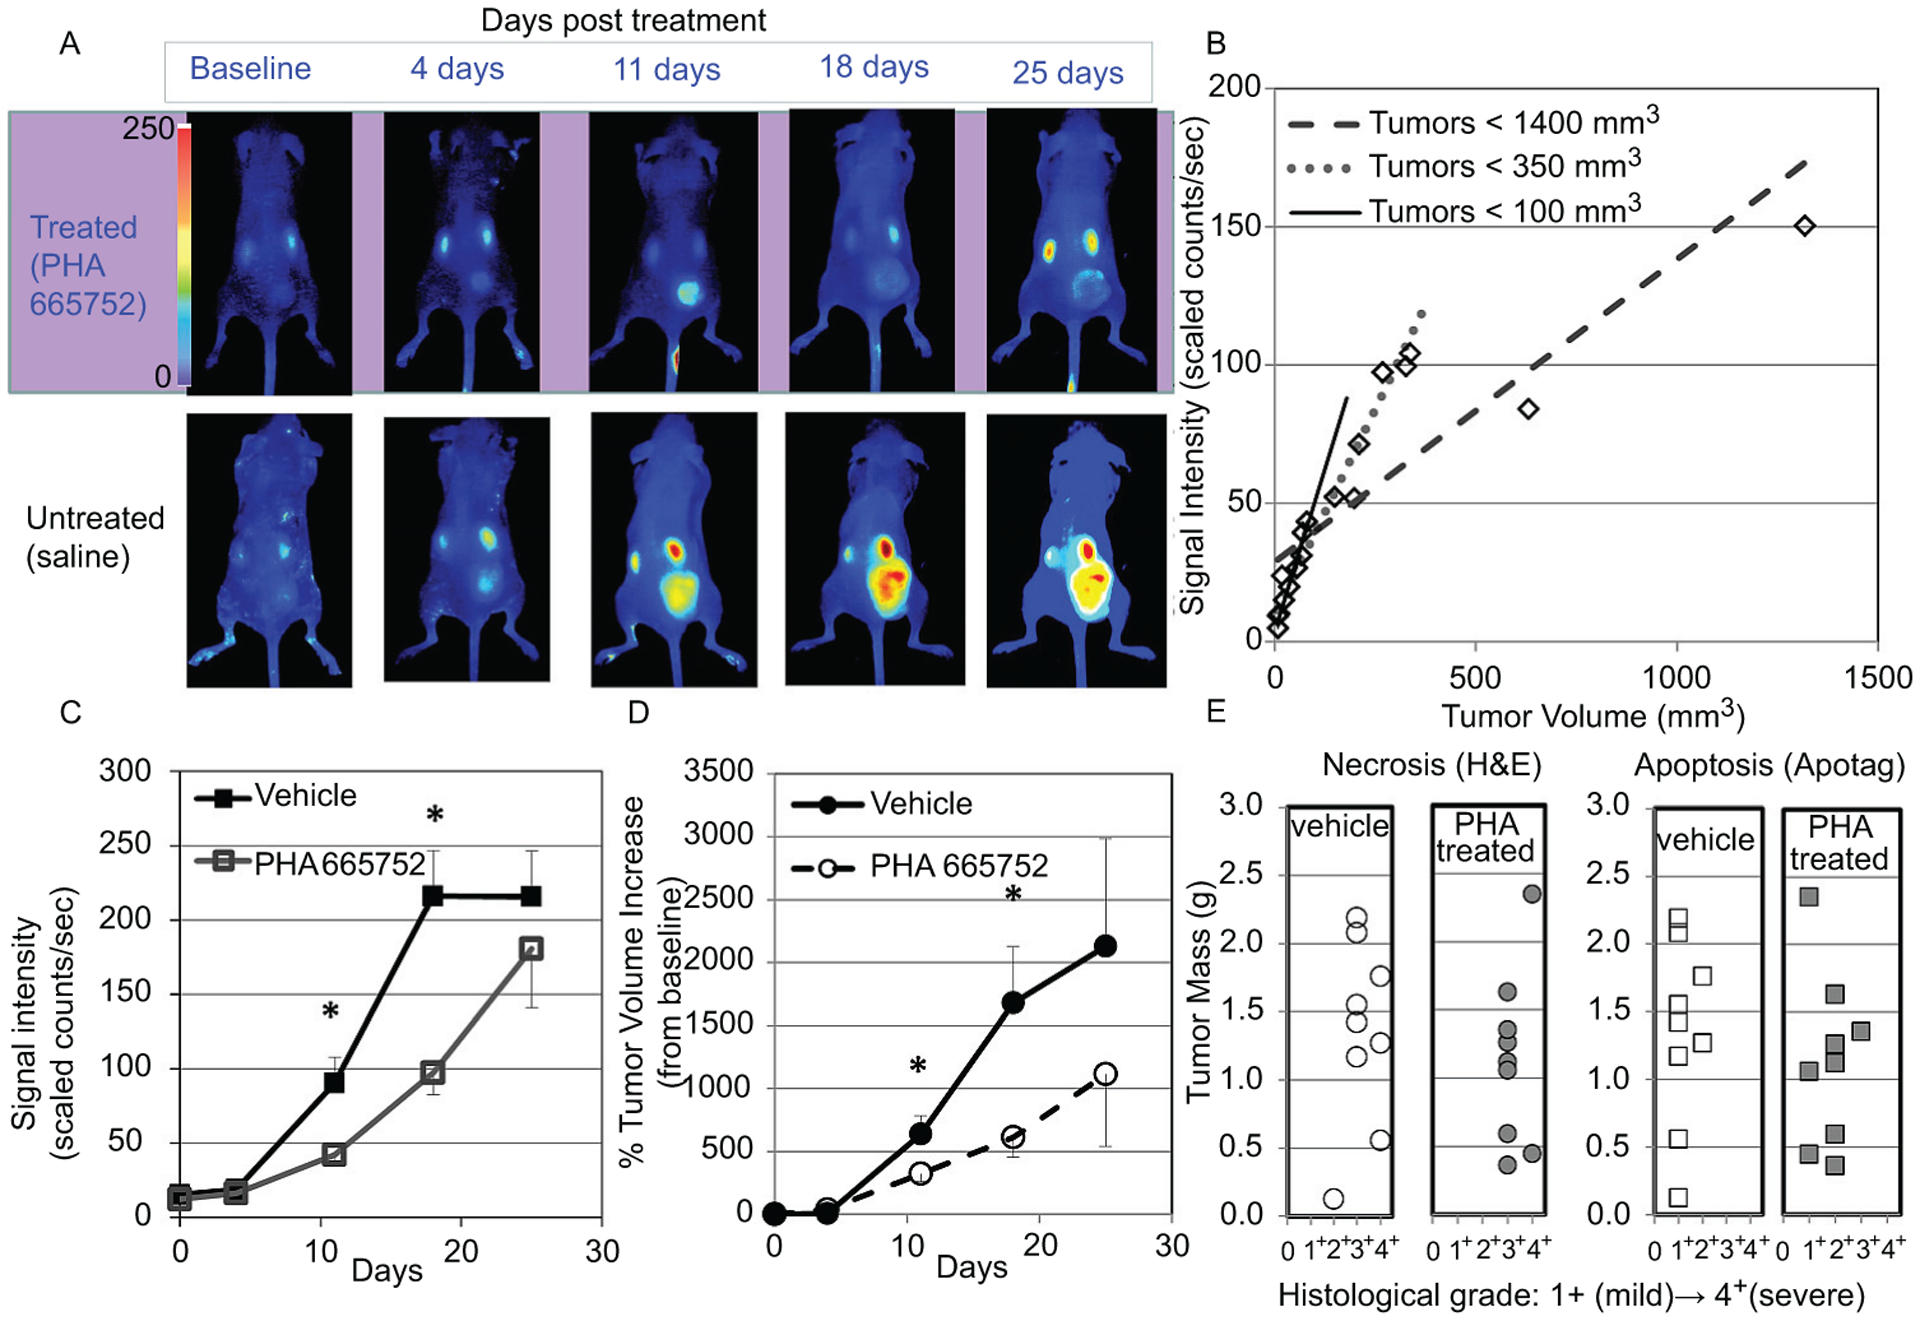
(A) Representative coronal images from a mouse with a MKN-45 tumor (on the right thigh) at baseline and after 4, 11, 18, and 25 days of treatment with PHA 665752 or vehicle; images were obtained 1 hour following injection of Cy5⋆⋆-Met peptide. (B) Correlation of Cy5⋆⋆-Met peptide tumor uptakes to tumor volumes in MKN-45 xenografts (n = 15): tumors < 1,400 mm3 (r = .859); tumors < 350 mm3 (r = .965); tumors < 100 mm3 (r = .985). (C) Cy5⋆⋆-Met peptide fluorescent signal intensity in tumors of MKN-45 xenografts after 4, 11, 18, and 25 days of treatment with PHA 665752 or vehicle. Each point represents the mean tumor signal intensity ± SE (n = 9 per group except at 25 days, n = (vehicle) 5, (treated) 6; ⋆p < .05). (D) Percent increase in tumor volumes (determined by caliper measurement) from baseline (day 0) in MKN-45 xenografts after 4, 11, 18, and 25 days of treatment with PHA 665752 or vehicle. Each point represents the mean % tumor volume increase ± SE (n = 9 per group, except at 25 days, n = (vehicle) 5, (treated) 6; ⋆p < .05). (E) Histologic grading of necrosis (H&E staining) and apoptosis (IHC, ApopTag) of MKN-45 tumor sections from the imaged vehicle- (n = 9) and PHA 665752–treated tumors (post 18 or 25 days PHA treatment, n = 9).
The potential of the Cy5⋆⋆-Met peptide to assess changes in Met status during treatment with the targeted Met TKI PHA 665752 was evaluated in MKN-45 xenograft mice. The xenograft mice were injected with Cy5⋆⋆-Met (1 nmol) and imaged after 1 hour of uptake to obtain baseline images before treatment. Mice were then treated with either vehicle or PHA 665752 (5 days on/2 days off) for the next 3 weeks and imaged weekly; after each imaging session, tumor volumes were determined from caliper measurements. In Figure 7B, representative longitudinal images from a single PHA 665752- or vehicle-treated mouse show a decrease in signal intensity in the treated tumor compared to the vehicle control. Fluorescent signal intensity in the treated tumors was significantly decreased 54% and 55% (p < .05) at 11 and 18 days, respectively, compared to the vehicle controls (Figure 7C). Similarly, tumor volumes (% increase from baseline) at 11 and 18 days significantly decreased 49% and 64% (p < .05), respectively, in treated versus vehicle controls (Figure 7D). At 25 days, although both the fluorescent signal intensity and tumor volumes were decreased in the treated xenografts, these decreases were not significant, which may be explained by an increase in variability attributable to necrosis in the larger tumors as well as a decrease in the number of samples.
After the last imaging session (18 or 25 days), plasma and tumors were removed from treated and vehicle xenograft mice for analysis of plasma for shed Met and tumors for necrosis, apoptosis, total Met, and pMet. The tumors from these vehicle and treated xenografts were large, with 89% and 78% > 0.5 g, respectively. Again, moderate to severe necrosis was found in 89% of the tumors from both groups, whereas apoptosis was mostly minimal to mild, with a trend of less severity in the vehicle controls (78%, 1+) compared to the treated xenografts (33%, 1+) (Figure 7E).
Discussion
A small peptide targeting Met labeled with [99mTc] or Cy5⋆⋆ exhibited high-affinity target binding and sufficient in vivo stability for imaging tumors with high Met expression. The binding of the [99mTc] Met peptide was shown to be specific and quantitatively sensitive to changes in Met concentrations using high (MKN-45), medium (SNU-16), and low (U87-MG) Met-expressing cells and tumors. In mice receiving the Met TKI PHA 665752, both [99mTc] and Cy5⋆⋆-Met peptide imaging demonstrated early reductions in MKN-45 tumor uptakes compared to controls. These imaging measures of a tumor response to a Met TKI were further validated by comparison with other readouts, including tumor volumes, shed ectodomain, total tumor Met, and pMet levels. The total tumor Met and pMet levels highly correlated with [99mTc] or Cy5⋆⋆-Met peptide tumor uptake and similarly exhibited decreased levels resulting from PHA 665752 treatment. In addition, tumor proliferation and growth were slowed due to treatment, which corresponded to decreased levels of tumor Met and pMet. Together these studies would suggest that Met imaging may be useful in detecting tumors with Met expression and may also provide a pharmacodynamic readout of tumor responses to a Met-targeted TKI.
The significant inhibition in MKN-45 tumor growth observed with PHA 665752 treatment in these studies was consistent with published reports in which PHA 665752 inhibition of Met tyrosine kinase activity resulted in a reduction of tumorigenicity accompanied with increases in apoptosis and necrosis.30,31 In our studies, similar treatment responses were observed in which MKN-45-treated tumors decreased in volume and exhibited substantial necrosis and mild-moderate apoptosis. Additionally, substantial necrosis was observed in larger tumors due to the combined effects of treatment and inadequate blood supply. Necrosis leads to decreased [99mTc] or Cy5⋆⋆-Met peptide tumor uptakes and decreased total tumor Met and pMet levels. Increased necrosis likely explains the lack of significant difference in uptake between treated and control groups in larger tumors. These necrotic areas would contribute to the overall mass of the tumor but would lack cellular Met expression, thus lowering Met levels per gram of tumor tissue. Likewise in larger control tumors, Met and pMet levels were decreased but exhibited a greater degree of variability dependent on the extent of the necrosis. Greater variability might be expected with these large mass tumors because these determinations are made from a small sample of the tumor, which may not be entirely representative of the Met, pMet, or necrotic status of the entire tumor. In contrast, quantitation of the entire tumor volume is possible with imaging and would seem to be especially beneficial in quantifying these large tumors with heterogeneously distributed necrotic areas. Collectively, these results would suggest that the reduced [99mTc] or Cy5⋆⋆-Met peptide tumor uptake after PHA 665752 treatment represents an increase in tumor cell killing rather than downregulation of Met. The MKN-45 cell line used in this xenograft model has been characterized as “ Met amplified,” requiring Met signaling for continued cell survival, and hence is quite sensitive to PHA 665752 treatment, responding with cell death.32 Furthermore, in other published reports, gastric carcinoma cells (including MKN-45 cells) treated with PHA 665752 exhibited pronounced inhibition of Met phosphorylation, whereas extracellular Met expression appeared unchanged and with prolonged PHA 665752 exposure cells acquired drug resistance associated with increased levels of Met.38 [99mTc] or Cy5⋆⋆-Met peptide binds to the ectodomain of Met and thus may be independent of the effects of inhibition on the receptor tyrosine kinase by drug treatment. In other in vitro studies with human lung carcinoma cells, total surface Met expression increased in response to PHA 665752 inhibition by preventing receptor degradation and downregulation.39 It is important to note that in these published studies, the Met levels were measured by Western blot, which is not as quantitative as imaging. This would confirm that tumor cell death is the most likely explanation for the decreased [99mTc] or Cy5⋆⋆-Met peptide tumor uptake observed with treatment. It is apparent, however, that the relationship of extracellular Met expression to blockade of intracellular tyrosine kinase activity with TKIs is complex, requiring further investigation, for which [99mTc]-Met peptide may serve as a useful tool.
Shed Met concentrations highly correlated with tumor mass in agreement with previous reports using different tumor types.28,40,41 In response to treatment, plasma shed Met levels were increased, whereas tumor [99mTc] or Cy5⋆⋆-Met peptide uptake, total Met levels, and pMet levels decreased. This increase might suggest increased shedding as a result of Met downregulation, as was shown to result from treatment with DN30, a mAb targeting the extracellular domain.42 Conversely, in other studies, shed Met concentrations were decreased after treatment with BAY-853474, a small molecule TKI, and these decreases were attributed to reductions in tumor masses.40 Although the BAY-853474 treatment studies and ours both used Met-amplified human gastric cell lines for mouse xenograft models, the specific downregulation and degradation defects in these cell lines driving Met amplification may be different and therefore exhibit different responses to Met TKIs. This in part may account for the observed increases in shed Met in response to PHA 665752 treatment. Alternatively, the increase in shed Met may be a consequence of slower overall metabolism and blood clearance exhibited by PHA 665752-treated xenograft mice. Although both BAY-853474 and PHA 665752 may be targeting the Met intracellular kinase, differences would be expected in metabolic, pharmacokinetic and toxicity profiles.17 These preclinical mouse xenograft studies would suggest that plasma shed Met may have clinical potential as a Met biomarker for assessment of tumor burden and responses to Met-targeted therapeutics. However, thus far in clinical studies with cancer patients, plasma shed Met levels have proven to be unreliable predictors of tumor burden and therapeutic responses.40,43–45
Since Met has emerged as an important cancer therapeutic target developing suitable clinical biomarkers capable of determining Met status, therapeutic responses and acquired drug resistance in real time are needed. In addition, findings from preclinical and clinical trials with Met-targeted TKIs as well as multitargeted TKIs have indicated that Met-related biomarkers may be predictive of drug sensitivity and efficacy, therefore aiding in drug development.23 Currently, in clinical trials, monitoring of tumor responses is done by measuring tumor volumes with repeated computed tomography (CT) or MRI in which tumor volumes at baseline are compared to volumes at various times after treatment.46 This approach, however, is limited as it only assesses tumor shrinkage and lacks the sensitivity to determine increased necrosis at earlier times. In other preclinical PET imaging studies, detection of tumor responses to therapeutic Met mAbs and TKIs by assessing changes in glucose metabolism ([18F]fluorodeoxyglucose, [18F]FDG) or cell proliferation ([18F]fluorothymidine, ([18F]FLT) has resulted in differential findings, which seem dependent on the mode of action of the Met therapeutic (extracellular or intracellular) and the cancer cell line.19,26,47,48 For instance, [18F]FDG detected early tumor responses after treatment with a mAb targeting the Met extracellular domain (CE-355621) but failed to detect tumor responses to treatment inhibiting the Met intracellular kinase (crizotinib). On the other hand, [18F]FLT detected a robust tumor response to crizotinib as well as a specific Met-targeted TKI, BAY 853474. Although these studies would suggest that monitoring these downstream biological responses to Met-targeted therapeutics might give a clinically relevant early readout of efficacy, determining the effect on Met status cannot be assessed. Compared to these PET imaging agents, the [99mTc]- or Cy5⋆⋆-labeled Met peptide described herein has this distinct advantage and is capable of quantitating Met status in vivo. In these preclinical studies, [99mTc] or Cy5⋆⋆ Met peptide exhibited specific and high-affinity binding to Met with sufficient target to nontarget ratios for imaging Met status in real time, representing a step forward toward clinical imaging of Met. Previously reported Met imaging agents have included therapeutic mAbs and fragments, which, due to their large molecular weights and slow pharmacokinetics, were labeled with the long-lived PET isotope 89Zr (t1/2 = 78.4 hours) to accommodate the long physical half-life of the mAb and fragments.18,19,49 Met-expressing tumors in mouse xenografts were successfully imaged but at days after administering the imaging agent therefore not as preferable for clinical translation as it places a greater time burden on the patient requiring him or her to return days later for the imaging scan. In other reports, a smaller Met binding peptide (12AA) labeled with 99mTc-specific Met binding was demonstrated in vitro but not in vivo, which most likely was due to the lower Met binding affinity of ~ 0.1 μM.20 By comparison, our [99mTc]-Met peptide is at least 100-fold higher in affinity (Kd = 3.3 nM), which should be suitable for detecting Met concentrations in a clinical setting. More importantly, these successful SPECT imaging studies with [99mTc]-Met peptide would provide proof of principle that this Met peptide should be considered for development as a PET imaging agent. Radiolabeling of this peptide with 18F could easily be accomplished using established literature methods, thus making possible PET imaging, which is intrinsically superior to SPECT imaging, resulting in increased spatial resolution and better quantitation.50,51
These results indicate that [99mTc] or Cy5⋆⋆-Met peptide would be an effective Met imaging agent for use in humans for either SPECT or endoscopic fluorescence imaging, respectively. However, this Met peptide does not recognize murine Met; thus, our preclinical studies do not address Met peptide uptake that might occur in human tissues that normally express Met. Initial imaging studies in humans with [99mTc] or Cy5⋆⋆-Met peptide designed to determine uptake in nontarget tissues will be important for determining imaging feasibility in human subjects. The sensitivity to changes in Met levels and high in vivo tumor uptakes demonstrated with [99mTc] and Cy5⋆⋆-Met peptide would indicate use as a potential diagnostic and prognostic imaging agent targeting Met. [99mTc] and Cy5⋆⋆-Met peptide exhibited potential for monitoring of tumor responses to Met TKIs, which could be applied to a clinical setting as well as serve as a biomarker aiding in drug development. With the known role that Met plays in driving tumor progression and drug resistance coupled with the advancements in Met-targeted therapeutics, a clinical logic-based real-time assessment of Met status is needed to identify those patients most likely to benefit from a Met-targeted therapeutic. These Met imaging agents could provide such an assessment not only in the case of primary disease but also, more importantly, could detect the emergence of Met-driven tumors in patients undergoing treatment, indicating “when” a Met-targeted therapy should be implemented.
Acknowledgments
We would like to thank Grethe Dalsgaard, Karen Linder, and others at GE Healthcare for providing the Met peptide, Cy5⋆⋆-Met peptide, and 99mTc-labeling kits and collaborative discussions that helped in advancing this project. We would like to acknowledge Dr. Miriam R. Anver, Donna Butcher, and Rebecca Oden of the Pathology/Histotechnology Laboratory, Frederick National Laboratory for Cancer Research, Frederick, MD, for providing the H&E and IHC ApopTag staining and histologic grading results.
Financial disclosure of authors: This project has been funded in whole or in part with federal funds from the National Cancer Institute, National Institutes of Health, under Contract No. HHSN261200800001E. The content of this publication does not necessarily reflect the views or policies of the Department of Health and Human Services, nor does mention of trade names, commercial products, or organizations imply endorsement by the U.S. Government.
Footnotes
Financial disclosure of reviewers: None reported.
References
- 1.Birchmeier C, Birchmeier W, Gherardi E, Vande Woude GF. Met, metastasis, motility and more. Nat Rev Mol Cell Biol 2003;4: 915–25, doi: 10.1038/nrm1261. [DOI] [PubMed] [Google Scholar]
- 2.Gastaldi S, Comoglio PM, Trusolino L. The Met oncogene and basal-like breast cancer: another culprit to watch out for? Breast Cancer Res 2010;12:208, doi: 10.1186/bcr2617. [DOI] [PMC free article] [PubMed] [Google Scholar]
- 3.Crosswell HE, Dasgupta A, Alvarado CS, et al. PHA665752, a small-molecule inhibitor of c-Met, inhibits hepatocyte growth factor-stimulated migration and proliferation of c-Met-positive neuroblastoma cells. BMC Cancer 2009;9:411, doi: 10.1186/1471-2407-9-411. [DOI] [PMC free article] [PubMed] [Google Scholar]
- 4.Trusolino L, Bertotti A, Comoglio PM. MET signalling: principles and functions in development, organ regeneration and cancer. Nat Rev Mol Cell Biol 2010;11:834–48, doi: 10.1038/nrm3012. [DOI] [PubMed] [Google Scholar]
- 5.Gurtner GC, Werner S, Barrandon Y, Longaker MT. Wound repair and regeneration. Nature 2008;453:314–21, doi: 10.1038/nature07039. [DOI] [PubMed] [Google Scholar]
- 6.Birchmeier C, Gherardi E. Developmental roles of HGF/SF and its receptor, the c-Met tyrosine kinase. Trends Cell Biol 1998;8: 404–10, doi: 10.1016/S0962-8924(98)01359-2. [DOI] [PubMed] [Google Scholar]
- 7.Borowiak M, Garratt AN, Wustefeld T, et al. Met provides essential signals for liver regeneration. Proc Natl Acad Sci U S A 2004;101: 10608–13, doi: 10.1073/pnas.0403412101. [DOI] [PMC free article] [PubMed] [Google Scholar]
- 8.Otsuka T, Takayama H, Sharp R, et al. c-Met autocrine activation induces development of malignant melanoma and acquisition of the metastatic phenotype. Cancer Res 1998;58:5157–67. [PubMed] [Google Scholar]
- 9.Peruzzi B, Bottaro DP. Targeting the c-Met signaling pathway in cancer. Clin Cancer Res 2006;12:3657–60, doi: 10.1158/1078-0432.CCR-06-0818. [DOI] [PubMed] [Google Scholar]
- 10.Cappuzzo F, Janne PA, Skokan M, et al. MET increased gene copy number and primary resistance to gefitinib therapy in non-small-cell lung cancer patients. Ann Oncol 2009;20:298–304, doi: 10.1093/annonc/mdn635. [DOI] [PMC free article] [PubMed] [Google Scholar]
- 11.Cappuzzo F, Marchetti A, Skokan M, et al. Increased MET gene copy number negatively affects survival of surgically resected non-small-cell lung cancer patients. J Clin Oncol 2009;27:1667–74, doi: 10.1200/JCO.2008.19.1635. [DOI] [PMC free article] [PubMed] [Google Scholar]
- 12.Albrecht BK, Harmange JC, Bauer D, et al. Discovery and optimization of triazolopyridazines as potent and selective inhibitors of the c-Met kinase. J Med Chem 2008;51:2879–82, doi: 10.1021/jm800043g. [DOI] [PubMed] [Google Scholar]
- 13.Atabey N, Gao Y, Yao ZJ, et al. Potent blockade of hepatocyte growth factor-stimulated cell motility, matrix invasion and branching morphogenesis by antagonists of Grb2 Src homology 2 domain interactions. J Biol Chem 2001;276:14308–14. [DOI] [PubMed] [Google Scholar]
- 14.Giubellino A, Linehan WM, Bottaro DP. Targeting the Met signaling pathway in renal cancer. Expert Rev Anticancer Ther 2009;9:785–93, doi: 10.1586/era.09.43. [DOI] [PMC free article] [PubMed] [Google Scholar]
- 15.Toschi L, Janne PA. Single-agent and combination therapeutic strategies to inhibit hepatocyte growth factor/MET signaling in cancer. Clin Cancer Res 2008;14:5941–6, doi: 10.1158/1078-0432.CCR-08-0071. [DOI] [PubMed] [Google Scholar]
- 16.Cui JJ. Inhibitors targeting hepatocyte growth factor and their potential therapeutic applications. Expert Opin Ther Patents 2007; 17:1035–45, doi: 10.1517/13543776.17.9.1035. [DOI] [Google Scholar]
- 17.Eder JP, Vande Woude GF, Boerner SA, LoRusso PM. Novel therapeutic inhibitors of the c-Met signaling pathway in cancer. Clin Cancer Res 2009;15:2207–14, doi: 10.1158/1078-0432.CCR-08-1306. [DOI] [PubMed] [Google Scholar]
- 18.Perk LR, Stigter-van Walsum M, Visser GW, et al. Quantitative PET imaging of Met-expressing human cancer xenografts with 89Zr-labelled monoclonal antibody DN30. Eur J Nucl Med Mol Imaging 2008;35:1857–67, doi: 10.1007/s00259-008-0774-5. [DOI] [PubMed] [Google Scholar]
- 19.Li K, Tavare R, Zettlitz KA, et al. Anti-MET immunoPET for non-small cell lung cancer using novel fully human antibody fragments. Mol Cancer Ther 2014;13:2607–17, doi: 10.1158/1535-7163.MCT-14-0363. [DOI] [PMC free article] [PubMed] [Google Scholar]
- 20.Kim EM, Joung MH, Lee CM, et al. Synthesis of Tc-99m labeled 1, 2,3-triazole-4-yl c-Met binding peptide as a potential c-Met receptor kinase positive tumor imaging agent. Bioorg Med Chem Lett 2010;20:4240–3, doi: 10.1016/j.bmcl.2010.05.036. [DOI] [PubMed] [Google Scholar]
- 21.Kim EM, Park EH, Cheong SJ, et al. Characterization, biodistribution and small-animal SPECT of I-125-labeled c-Met binding peptide in mice bearing c-Met receptor tyrosine kinase-positive tumor xenografts. Nucl Med Biol 2009;36:371–8, doi: 10.1016/j.nucmedbio.2009.01.005. [DOI] [PubMed] [Google Scholar]
- 22.Jagoda EM, Lang L, Bhadrasetty V, et al. Immuno-PET of the hepatocyte growth factor receptor Met using the 1-armed antibody onartuzumab. J Nucl Med 2012;53:1592–600, doi: 10.2967/jnumed.111.102293. [DOI] [PMC free article] [PubMed] [Google Scholar]
- 23.Shrivastava A, von Wronski MA, Sato AK, et al. A distinct strategy to generate high-affinity peptide binders to receptor tyrosine kinases. Protein Eng Des Sel 2005;18:417–24, doi: 10.1093/protein/gzi049. [DOI] [PubMed] [Google Scholar]
- 24.Garcia-Allende PB, Glatz J, Koch M, Ntziachristos V. Enriching the interventional vision of cancer with fluorescence and optoacoustic imaging. J Nucl Med 2013;54:664–7, doi: 10.2967/jnumed.111.099796. [DOI] [PubMed] [Google Scholar]
- 25.Bajaj A, LaPlante NE, Cotero VE, et al. Identification of the protein target of myelin-binding ligands by immunohistochemistry and biochemical analyses. J Histochem Cytochem 2013;61:19–30. [DOI] [PMC free article] [PubMed] [Google Scholar]
- 26.Jagoda E, Bhattacharyya S, Kalen J, et al. [99mTc] labeled peptide targets the Met receptor tyrosine kinase (Met) in human gastric carcinoma (MKN 45) mouse xenografts. J Nucl Med 2011;52:356P. [Google Scholar]
- 27.Jagoda E, Bhattacharyya S, Kalen J, et al. Evaluation of the efficacy of a Met tyrosine kinase inhibitor (TKI) in human gastric carcinoma (MKN-45) mouse xenografts using a [99mTc] labeled peptide ([99mTc]Met) targeting the Met receptor (Met). J Nucl Med 2012; 52:101–2P. [Google Scholar]
- 28.Athauda G, Giubellino A, Coleman JA, et al. c-Met ectodomain shedding rate correlates with malignant potential. Clin Cancer Res 2006;12:4154–62, doi: 10.1158/1078-0432.CCR-06-0250. [DOI] [PubMed] [Google Scholar]
- 29.Cui JJ, Tran-Dube M, Shen H, et al. Structure based drug design of crizotinib (PF-02341066), a potent and selective dual inhibitor of mesenchymal-epithelial transition factor (c-MET) kinase and anaplastic lymphoma kinase (ALK). J Med Chem 2011;54:6342–63, doi: 10.1021/jm2007613. [DOI] [PubMed] [Google Scholar]
- 30.Puri N, Khramtsov A, Ahmed S, et al. A selective small molecule inhibitor of c-Met, PHA665752, inhibits tumorigenicity and angiogenesis in mouse lung cancer xenografts. Cancer Res 2007; 67:3529–34, doi: 10.1158/0008-5472.CAN-06-4416. [DOI] [PubMed] [Google Scholar]
- 31.Christensen JG, Schreck R, Burrows J, et al. A selective small molecule inhibitor of c-Met kinase inhibits c-Met-dependent phenotypes in vitro and exhibits cytoreductive antitumor activity in vivo. Cancer Res 2003;63:7345–55. [PubMed] [Google Scholar]
- 32.Smolen GA, Sordella R, Muir B, et al. Amplification of MET may identify a subset of cancers with extreme sensitivity to the selective tyrosine kinase inhibitor PHA-665752. Proc Natl Acad Sci U S A 2006;103:2316–21, doi: 10.1073/pnas.0508776103. [DOI] [PMC free article] [PubMed] [Google Scholar]
- 33.Koon EC, Ma PC, Salgia R, et al. Effect of a c-Met-specific, ATP-competitive small-molecule inhibitor SU11274 on human ovarian carcinoma cell growth, motility, and invasion. Int J Gynecol Cancer 2008;18:976–84, doi: 10.1111/j.1525-1438.2007.01135.x. [DOI] [PubMed] [Google Scholar]
- 34.Morris BJ. Specific radioactivity of radioimmunoassay tracer determined by self-displacement: a re-evaluation. Clin Chim Acta 1976;73:213–6, doi: 10.1016/0009-8981(76)90328-4. [DOI] [PubMed] [Google Scholar]
- 35.Roulston JE. Validation of the self-displacement technique for estimation of specific radioactivity of radioimmunoassay tracers. Ann Clin Biochem 1979;16:26–9, doi: 10.1177/000456327901600104. [DOI] [PubMed] [Google Scholar]
- 36.Lewis JS, Achilefu S, Garbow JR, et al. Small animal imaging. Current technology and perspectives for oncological imaging. Eur J Cancer 2002;38:2173–88, doi: 10.1016/S0959-8049(02)00394-5. [DOI] [PubMed] [Google Scholar]
- 37.Hillman EM, Amoozegar CB, Wang T, et al. In vivo optical imaging and dynamic contrast methods for biomedical research. Philos Trans A Math Phys Eng Sci 2011;369:4620–43, doi: 10.1098/rsta.2011.0264. [DOI] [PMC free article] [PubMed] [Google Scholar]
- 38.Funakoshi Y, Mukohara T, Tomioka H, et al. Excessive MET signaling causes acquired resistance and addiction to MET inhibitors in the MKN45 gastric cancer cell line. Invest New Drugs 2013;31:1158–68, doi: 10.1007/s10637-013-9959-2. [DOI] [PubMed] [Google Scholar]
- 39.Leiser D, Pochon B, Blank-Liss W, et al. Targeting of the MET receptor tyrosine kinase by small molecule inhibitors leads to MET accumulation by impairing the receptor downregulation. FEBS Lett 2014;588:653–8, doi: 10.1016/j.febslet.2013.12.025. [DOI] [PubMed] [Google Scholar]
- 40.Klotz M, Schmid E, Steiner-Hahn K, et al. Preclinical evaluation of biomarkers for response monitoring to the MET inhibitor BAY-853474. Biomarkers 2012;17:325–35, doi: 10.3109/1354750X.2012.670865. [DOI] [PubMed] [Google Scholar]
- 41.Fu L, Guo W, Liu B, et al. Shedding of c-Met ectodomain correlates with c-Met expression in non-small cell lung cancer. Biomarkers 2013;18:126–35, doi: 10.3109/1354750X.2012.751455. [DOI] [PubMed] [Google Scholar]
- 42.Petrelli A, Circosta P, Granziero L, et al. Ab-induced ectodomain shedding mediates hepatocyte growth factor receptor downregulation and hampers biological activity. Proc Natl Acad Sci U S A 2006;103:5090–5, doi: 10.1073/pnas.0508156103. [DOI] [PMC free article] [PubMed] [Google Scholar]
- 43.Mai E, Zheng Z, Chen Y, et al. Nonclinical evaluation of the serum pharmacodynamic biomarkers HGF and shed MET following dosing with the anti-MET monovalent monoclonal antibody onartuzumab. Mol Cancer Ther 2014;13:540–52, doi: 10.1158/1535-7163.MCT-13-0494. [DOI] [PubMed] [Google Scholar]
- 44.Spigel DR, Ervin TJ, Ramlau RA, et al. Randomized phase II trial of onartuzumab in combination with erlotinib in patients with advanced non-small-cell lung cancer. J Clin Oncol 2013;31:4105–14, doi: 10.1200/JCO.2012.47.4189. [DOI] [PMC free article] [PubMed] [Google Scholar]
- 45.Surati M, Patel P, Peterson A, Salgia R. Role of MetMAb (OA-5D5) in c-MET active lung malignancies. Expert Opin Biol Ther;11: 1655–62, doi: 10.1517/14712598.2011.626762. [DOI] [PMC free article] [PubMed] [Google Scholar]
- 46.Torti D, Sassi F, Galimi F, et al. A preclinical algorithm of soluble surrogate biomarkers that correlate with therapeutic inhibition of the MET oncogene in gastric tumors. Int J Cancer 2012;130: 1357–66, doi: 10.1002/ijc.26137. [DOI] [PubMed] [Google Scholar]
- 47.Cullinane C, Dorow DS, Jackson S, et al. Differential (18)F-FDG and 3′-deoxy-3′-(18)F-fluorothymidine PET responses to pharmacologic inhibition of the c-MET receptor in preclinical tumor models. J Nucl Med 2011;52:1261–7, doi: 10.2967/jnumed.110.086967. [DOI] [PubMed] [Google Scholar]
- 48.Tseng JR, Kang KW, Dandekar M, et al. Preclinical efficacy of the c-Met inhibitor CE-355621 in a U87 MG mouse xenograft model evaluated by 18F-FDG small-animal PET. J Nucl Med 2008;49: 129–34, doi: 10.2967/jnumed.106.038836. [DOI] [PMC free article] [PubMed] [Google Scholar]
- 49.Jagoda EM, Vaquero JJ, Seidel J, et al. Experiment assessment of mass effects in the rat: implications for small animal PET imaging. Nucl Med Biol 2004;31:771–9, doi: 10.1016/j.nucmedbio.2004.04.003. [DOI] [PubMed] [Google Scholar]
- 50.Jagoda EM, Aloj L, Seidel J, et al. Comparison of an 18F labeled derivative of vasoactive intestinal peptide and 2-deoxy-2-[18F] fluoro-D-glucose in nude mice bearing breast cancer xenografts. Mol Imaging Biol 2002;4:369–79, doi: 10.1016/S1536-1632(02)00019-7. [DOI] [PubMed] [Google Scholar]
- 51.Sachin K, Jadhav VH, Kim EM, et al. F-18 labeling protocol of peptides based on chemically orthogonal strain-promoted cycloaddition under physiologically friendly reaction conditions. Bioconjug Chem 2012;23:1680–6, doi: 10.1021/bc3002425. [DOI] [PubMed] [Google Scholar]