

Abstract
Context
The increased emphasis on implementing evidence-based practice has reinforced the need to more accurately assess patient improvement. Psychometrically sound, patient-reported outcome measures are essential for evaluating patient care. A patient-reported outcome instrument that may be useful for clinicians is the Disablement in the Physically Active Scale (DPAS). Before adopting this scale, however, researchers must evaluate its psychometric properties, particularly across subpopulations.
Objective
To evaluate the psychometric properties of the DPAS in a large sample using confirmatory factor analysis procedures and assess structural invariance of the scale across sex, age, injury status, and athletic status groups.
Design
Observational study.
Setting
Twenty-two clinical sites.
Patients or Other Participants
Of 1445 physically active individuals recruited from multiple athletic training clinical sites, data from 1276 were included in the analysis. Respondents were either healthy or experiencing an acute, subacute, or persistent musculoskeletal injury.
Main Outcome Measure(s)
A confirmatory factor analysis was performed on the full sample, and multigroup invariance testing was conducted to assess differences across sex, age, injury status, and athletic status. Given the poor model fit, alternate model generation was used to identify a more parsimonious factor structure.
Results
The DPAS did not meet contemporary fit index recommendations or the criteria to demonstrate structural invariance. We identified an 8-item model that met the model fit recommendations using alternate model generation.
Conclusions
The 16-item DPAS did not meet the model fit recommendations and may not be the most parsimonious or reliable measure for assessing disablement and quality of life. Use of the 16-item DPAS across subpopulations of interest is not recommended. More examination involving a true cross-validation sample should be completed on the 8-item DPAS before this scale is adopted in research and practice.
Keywords: instrument development, confirmatory factor analysis, multigroup invariance testing, covariance modeling
Key Points
The 16-item Disablement in the Physically Active Scale (DPAS) did not meet the model fit recommendations and may not be the most parsimonious or reliable measure for assessing disablement and quality of life.
Given the model fit concerns and measurement noninvariance, clinicians should use the DPAS with caution.
Although the DPAS Short Form-8, a more parsimonious model, was also identified in this study, more research involving a true cross-validation sample should be completed before this scale is fully adopted in research and practice.
The health care professions have experienced an increased emphasis on implementing evidence-based practice, which has reinforced the need to more accurately assess patient improvement. Practitioners often rely on clinician-generated evidence, such as strength measures, because these criteria provide objective data thought to measure changes in health status.1 However, a critique of this process is that these measures do not consider the patient experience and may not indicate meaningful improvement from a patient's perspective,2 making psychometrically sound, patient-reported outcome (PRO) measures essential for evaluating the quality of patient care and clinical practice.3,4
The need to assess improvement from the patient's perspective has led to the development of PRO instruments for assessing specific regions of the body, different conditions, or other domain-specific measures (eg, functional limitations, quality of life). Researchers have attempted to balance sensitivity with applicability,5 with the primary objective of accurately measuring change relevant to patients given their clinical circumstances and goals.4 The data produced by this process should inform patients, clinicians, and third-party entities about the quality of care provided and whether patients perceive a return to their expected levels of health.2,4 Effective use of PROs may lead to improved decision making in clinical practice and improved communication among all stakeholders.6 Furthermore, the efficient use of PROs may increase understanding of a patient's clinical circumstances and goals and guide the development of a treatment plan, thereby improving the efficiency of health care provided while allowing for greater implementation of patient-centered care.2,6–11
A PRO instrument designed specifically for physically active populations is the Disablement in the Physically Active Scale (DPAS).12,13 The DPAS is modeled after the Short Form-36 (SF-36), which is often considered a criterion-standard generic PRO instrument.12,13 The need for the DPAS was partially driven by data indicating that the SF-36 may not be an appropriate instrument for athletes or the physically active population. When comparing SF-36 scores based on physical activity level (eg, athlete versus nonathlete), investigators14,15 have reported that age-matched control populations produced different responses on the scale. Variance in responses among these populations is a common problem with PRO instruments because athletes often have lower levels of baseline disability than nonathletic patients.16,17 As a result of this difference, athletic patients frequently have lower ceilings by which to demonstrate improvement with repeated administration of PRO instruments.16 Therefore, even commonly used, valid instruments might need to be reassessed before administration in these populations if the validation process did not include high-level physical functioning patients, such as athletes.17
The DPAS, in contrast, may be a viable alternative because it was designed for and tested in athletes, with a framework for assessing the disablement process12 while using items that measure components (eg, physical, mental) similar to those found in the SF-36.18 The potential concern with using the DPAS is that few studies have been conducted on the psychometric properties of the scale, and in most of these, the authors have sampled what is considered a small, homogeneous athletic population12,18 based on contemporary recommendations for scale development.19,20 Furthermore, psychometric assessment guidelines for instrument refinement and validation have indicated that invariance testing is an important component for determining instrument validity.19,20 When the scale is used to assess patient improvement or conduct research, factorial stability must exist across different populations. An instrument intended to be administered in a heterogeneous population must have established measurement properties that are equivalent in various subgroup populations (eg, sex, age, activity level, injury classification).20 Without establishing the invariance of an instrument, one cannot assume that the items measure the underlying constructs comparably across groups, as has been found with the SF-36.16,17 Using an instrument that meets the measurement recommendations for invariance testing is important for clinicians or researchers who want to track individual changes over time, compare differences across groups (eg, active versus physically active, pediatric versus geriatric) at a single time or with repeated measures, or assess treatment effectiveness based on patient outcomes measured using the instrument.19–21
Currently, this level of psychometric analysis has not been conducted on the DPAS. The measurement properties of the scale have never been evaluated to determine how sex, age, activity level, or stage of musculoskeletal injury (ie, acute, subacute, or chronic) of respondents completing the scale affect model fit. In addition, further psychometric assessment of overall model fit is needed because of the limited study22 to date of the scale involving a large, heterogeneous sample. Therefore, the purposes of our study were to evaluate the psychometric properties of the DPAS in a large sample using confirmatory factor analysis (CFA) procedures and assess invariance (ie, equal factor variances, equal factor covariance, and equal means) of the scale across sex, age, injury status (injured or healthy), and athletic status (competitive, recreational, or occupational athlete).
METHODS
Participants
A convenience sample of athletic trainers recruited participants from 20 athletic training clinics and 2 outpatient rehabilitation clinics in the United States for 1 year. The athletic trainers recruited competitive, recreational, and occupational athletes who were injured, as well as those who were uninjured, to volunteer for the study. Volunteers who were physically active were included in the study; those with chronic pain were excluded (Table 1).12,22,23 Individuals who were not in the specified age group (age range = 14–40 years) or were not in one of the specified athletic status classifications (competitive, recreational, or occupational) were also excluded from data collection. Participants were grouped by predefined physical activity categories (competitive athlete [eg, National Collegiate Athletic Association student-athlete], recreational athlete [eg, an individual who is active on a university-sponsored recreation team], occupational athlete, [eg, an individual who engages in weight lifting]) that established the athletic status classification (Table 2).
Table 1.
Inclusion and Exclusion Criteria for Participant Activity Level, Injury, and Pain Type
| Criterion |
Definition12,22 |
| Inclusion | |
| Physically active | An individual who engages in athletic, recreational, or occupational activities that require physical skills and who uses strength, power, endurance, speed, flexibility, range of motion, or agility at least 3 d/wk12 |
| Healthy | Free from musculoskeletal injury and fully able to participate in sport or activity12,22 |
| Acute injury | A musculoskeletal injury that precludes full participation in sport or activity for at least 2 consecutive d (0–72 h postinjury)12,22 |
| Subacute injury | A musculoskeletal injury that precludes full participation in sport or activity for at least 2 consecutive d (3 d to 1 mo postinjury)22 |
| Persistent injury | A musculoskeletal injury that has caused symptoms for at least 1 mo12,22 |
| Exclusion | |
| Chronic pain | Pain that consistently does not improve with routine treatment or nonnarcotic medication12 |
Table 2.
Definitions for Participant Athletic Status Stratificationa
| Status |
Definition12,22 |
| Competitive athlete | A participant who engages in a sport activity that requires at least 1 preparticipation examination; regular attendance at scheduled practices, conditioning sessions, or both; and a coach who leads practices, competitions, or both12 |
| Recreational athlete | A participant who meets the criteria for physical activity and is involved in sport but does not meet the criteria for competitive status12 |
| Occupational athlete | A participant who meets the criteria for physical activity for occupation or recreation but does not meet the criteria for a competitive or recreational athlete22 |
All participants provided written informed consent, and the study was approved by our institutional review board. When applicable, minors provided assent, and their legal guardians provided consent before data collection.
Instrumentation
The survey packet consisted of the DPAS and a demographic questionnaire that was completed at the initial visit with an athletic trainer. The DPAS is a PRO scale thought to measure 4 factors using 16 items. The first 3 constructs—impairments, functional limitations, and disability—are first-order factors of the higher-order construct, disablement. Items 1 through 4 are designed to tap into the impairment construct, items 5 through 9 into the functional limitations construct, and items 10 through 12 into the disability construct. Items 13 through 16 are designed to address the quality-of-life construct, which is hypothesized to covary with the higher-order disablement construct (Figure 1). Respondents rate each item on a Likert scale that ranges from 1 (no problem) to 5 (severely affected). The scores for each item are summed, and 16 points are subtracted from the summed total to produce a final score. A person's total score ranges from 0 (ie, floor) to 64 points.12
Figure 1.

Hypothesized model of the Disablement in the Physically Active Scale (DPAS). Abbreviations: d, disturbance variable; v, unique variance.
The athletic trainer working with the participant collected deidentified participant characteristics that consisted of injury category (ie, healthy, acute, subacute, or persistent), athletic status (eg, competitive, recreational, or occupational athlete), age, sex, sport, general injury location (ie, lower extremity, spine, upper extremity), specific injury location (eg, head or neck, shoulder or arm, ankle or foot), and type of injury (eg, arthritis, neuroma, strain, sprain, postsurgery). The athletic trainer was permitted to explain terms or phrases used on the DPAS (eg, cardiovascular endurance) or characteristic items and to answer questions if confusion arose while participants completed the paperwork; this type of clinician-patient communication is expected when providing effective patient-centered care. The collected DPAS data and characteristic data were entered into Qualtrics software (Qualtrics, LLC, Provo, UT) by the collecting athletic trainer.
Data Analysis
Data Cleaning
Data were downloaded from Qualtrics for analysis using SPSS (version 25.0; IBM Corp, Armonk, NY) and Analysis of Moment Structure (AMOS; version 25.0; IBM Corp). Missing data were treated conservatively, and data from respondents who did not answer at least 90% (15/16) of the DPAS items were removed from the dataset. Any remaining missing data were replaced with the rounded mean score of the respective item for analysis.19 However, missing demographic data were left as missing values. Data cleaning involved assessment of the univariate distributions of all variables to verify normal distribution with low levels of skewness and kurtosis. Multivariate outliers were identified using the Mahalanobis distance at P < .001.19,24,25
Confirmatory Factor Analysis
A CFA on the second-order DPAS was conducted in AMOS software. In the second-order model, the 3 latent variables—impairments, functional limitations, and disability—created a second-order latent variable, disablement, which then was covaried with the first-order variable, quality of life. An additional CFA was conducted on the first-order model that removed the second-order latent variable, disablement, and instead, covaried all 4 first-order latent variables (ie, impairments, functional limitations, disability, and quality of life). Conducting a first-order CFA model allowed assessment of correlations among the latent constructs of the DPAS, which was not possible in a second-order model. For both CFA models, goodness-of-fit indices were evaluated using contemporary a priori values. The more contemporary model fit indices evaluated were the Comparative Fit Index (CFI; ≥0.95), Tucker-Lewis Index (TLI; ≥0.95), root mean square error of approximation (RMSEA; ≤0.06), and Bollen Incremental Fit Index (IFI; ≥0.95).19,26,27 Additionally, modification indices were examined to identify local fit concerns (eg, cross-loadings) and potential model misspecification. The likelihood ratio statistic (χ2 statistic) was also calculated, but because it is heavily influenced by sample size, it was not used as the primary assessment of model fit.19,20
Invariance Testing
The multigroup invariance analysis was conducted using AMOS. Confirmatory factor analysis invariance testing (ie, configural, metric, and scalar) was applied to assess model fit across groups.19,20 Model fit was compared using the CFI difference test (CFIDIFF), with a cutoff of 0.01, and the χ2 difference test (χ2DIFF), with a cutoff of P = .01.19,28 Given the sensitivity of the χ2DIFF to sample size,28 the CFIDIFF held greater weight in our decisions regarding model fit. If a model exceeded the χ2DIFF but met the CFIDIFF, invariance testing continued. Structural invariance for the DPAS was assessed across groups by sex, age according to development stages (adolescents, aged 14–18 years; emerging adulthood, aged 19–25 years; and early adulthood, aged 25–40 years),29 injury status (injured or healthy), and athletic status (ie, competitive athlete and combined recreational or occupational athletes).
Alternate Model Generation
Because the model fit for the 16-item DPA scale did not meet contemporary recommendations,19,26,27 we performed alternate model generation using AMOS to identify a more parsimonious factor structure. Modification indices and factor loadings, along with assessment of the items and theoretical fit, were used to guide item removal.19,20,30 We also used bivariate correlations between items and Cronbach α to guide decisions about item removal within subdimensions.19,31,32 One modification was made at a time, and global and local fit were assessed after item removal. The final model fit was assessed using the recommendations19,26,27 described in the CFA procedures. A bivariate correlation analysis was conducted on the composite scores of the DPAS and the new model to determine if the proposed model explained an acceptable amount of the variance in responses on the DPAS; an acceptable percentage of the variance explained was set at r ≥ 0.90 (R2 = 0.81).33
RESULTS
Preliminary Analysis
A total of 1445 individuals took the survey. Thirty-six individuals were missing responses to >10% of the DPAS items and their data were, therefore, removed from the dataset. A total of 133 individuals reported scores that indicated either univariate (z scores ≥ 3.4) or multivariate (Mahalanobis distance ≥ 32.0) outliers. Thus, data from 1276 participants (667 [52.3%] males, 600 [47.0%] females; age = 20.8 ± 4.4 years) remained for analysis. Participants were grouped by sex, age, injury classification, and athletic status (Table 3).
Table 3.
Participant Characteristics (N = 1276)
| Characteristic |
Mean ± SD |
| Age, y | 20.8 ± 4.4 |
| No. (%) |
|
| Sex | |
| Male | 667 (52.3) |
| Female | 600 (47.0) |
| Unknown | 9 (0.7) |
| Injury classification | |
| Healthy | 236 (18.5) |
| Acute | 295 (23.1) |
| Subacute | 368 (28.8) |
| Persistent | 372 (29.2) |
| Unknown | 5 (0.4) |
| Athletic status classification | |
| Competitive | 677 (53.1) |
| Recreational | 311 (24.4) |
| Occupational | 283 (22.2) |
| Unknown | 5 (0.4) |
Confirmatory Factor Analysis
The CFA of the 16-item DPAS indicated marginal but not preferred model fit to the sample data. The goodness-of-fit indices approached but did not meet recommended values (CFI = 0.936, TLI = 0.923, RMSEA = 0.081, IFI = 0.936; Figure 2). Factor loadings from individual items to their respective first-order latent variables ranged from 0.60 to 0.89. Path coefficients between the second-order latent variable, disablement, and the first-order latent variables were very high, ranging from 0.94 to 1.02 (Figure 2). Correlations among the first-order latent variables—impairment, functional limitations, and disability—were very high, ranging from 0.89 to 0.97 (Figure 3). Additionally, modification indices indicated that several items had meaningful cross-loadings and suggested alternative specifications that could maximize fit and parsimony.
Figure 2.
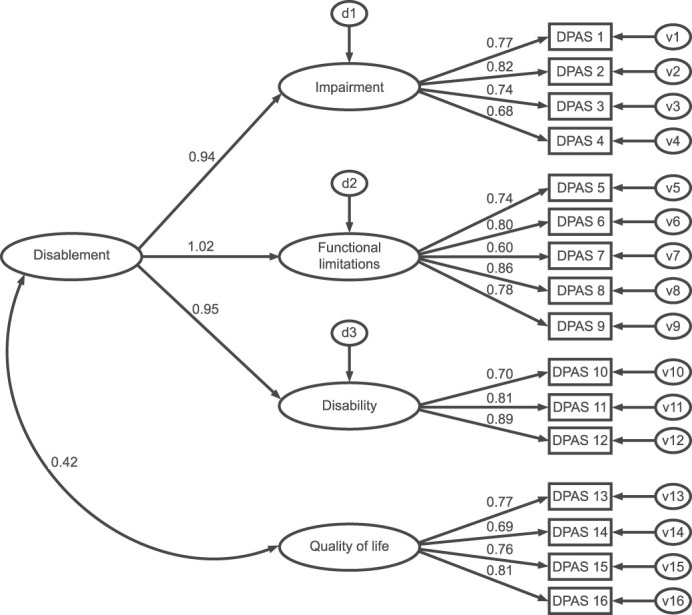
Confirmatory factor analysis of the 16-item Disablement in the Physically Active (DPA) scale. Abbreviations: d, disturbance variable; v, unique variance. Adapted with permission.12,22 χ2 = 927.755; degrees of freedom = 100; χ2 statistic/degrees of freedom ratio = 9.278; Comparative Fit Index = 0.936; Tucker-Lewis Index = 0.923; root mean square error of approximation = 0.081; Bollen Incremental Fit Index = 0.936; P < .001.
Figure 3.
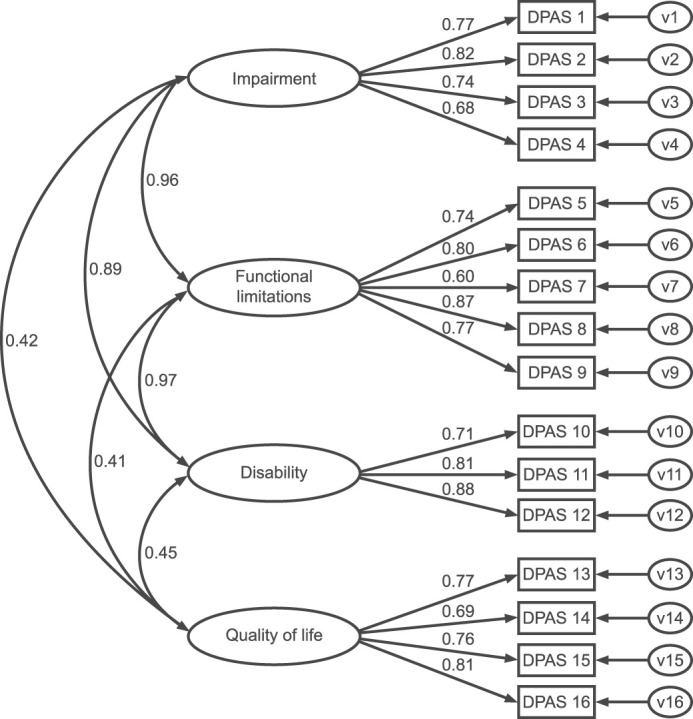
First-order confirmatory factor analysis of the 16-item Disablement in the Physically Active Scale (DPAS). Abbreviations: d, disturbance variable; v, unique variance. Adapted with permission.12,22 χ2 = 904.827; degrees of freedom = 98; χ2 statistic/degrees of freedom ratio = 9.233; Comparative Fit Index = 0.937; Tucker-Lewis Index = 0.923; root mean square error of approximation = 0.080; Bollen Incremental Fit Index = 0.937; P < .001.
Invariance Analysis
Sex Subgroups
In the sample, 1267 participants reported their sex (male = 667, female = 600), and these data were included in the analysis. Baseline models for males and females indicated acceptable but not ideal model fit (CFI = 0.931 and 0.943, respectively), with both groups exceeding the RMSEA cutoff of ≤0.06 (Table 4). The initial model (equal form) demonstrated acceptable but not ideal fit (CFI = 0.936; χ2 = 1001.70; RMSEA = 0.057; Table 4). The metric model (ie, equal loadings) met both the CFIDIFF and the χ2DIFF (CFI = 0.936; χ2 = 1019.32). Satisfactory metric invariance criteria warranted examination of the equal first-order latent variables. Both the CFIDIFF and χ2DIFF criteria were met (Table 4); therefore, males and females exhibited similar variability on the first-order DPAS latent variables. The scalar model (ie, equal indicator intercepts) exceeded the χ2DIFF but did meet the criteria for the CFIDIFF, indicating that it was invariant and allowed for assessment of means between groups. The equal latent means slightly exceeded the χ2DIFF but did meet the CFIDIFF, indicating no apparent differences between levels of disablement and quality of life between males and females.
Table 4.
Goodness-of-Fit Indices for the Measurement Invariance Analyses Across Sex
| χ2 |
df |
χ2 Difference Test (df) |
Comparative Fit Index |
Comparative Fit Index Difference Test |
Tucker-Lewis Index |
Root Mean Square Error of Approximation |
|
| Males (n = 667) | 576.95 | 98 | NC | 0.931 | NC | 0.916 | 0.086 |
| Females (n = 600) | 424.76 | 98 | NC | 0.943 | NC | 0.930 | 0.075 |
| Model A (equal form) | 1001.70 | 196 | NC | 0.936 | NC | 0.922 | 0.057 |
| Model B (equal loadings) | 1019.32 | 208 | 17.62 (12) | 0.936 | 0.000 | 0.926 | 0.056 |
| Model C (equal factor variances) | 1027.75 | 212 | 26.05 (16) | 0.936 | 0.000 | 0.927 | 0.055 |
| Model D (equal indicator intercepts) | 1071.95 | 220 | 70.25 (24)a | 0.933 | 0.003 | 0.927 | 0.055 |
| Model E (equal latent means) | 1100.99 | 224 | 99.29 (28)a | 0.931 | 0.005 | 0.926 | 0.056 |
Abbreviation: NC, not calculated at this step.
Indicates the model did not pass (ie, exceeded) the invariance criteria.
Age Subgroups
In the sample, 1151 individuals reported their ages, and these data were included in the analysis. Individuals were categorized into 1 of 3 age groups: ages 14 to 18 years (n = 332), ages 19 to 24 years (n = 665), or ages 25 to 40 years (n = 154). Baseline models for age groups indicated acceptable but not ideal model fit (CFI range = 0.924–0.940); all groups exceeded the RMSEA cutoff of ≤0.06 (Table 5). The initial equal form model again demonstrated acceptable but not ideal fit (CFI = 0.937; χ2 = 1036.04; RMSEA = 0.047; Table 5). The metric model (ie, equal loadings) met both the CFIDIFF and the χ2DIFF. Satisfactory metric invariance criteria warranted examination of the equal latent variances. Both the CFIDIFF and χ2DIFF criteria were met (Table 5); thus, all age groups exhibited similar variability on the DPAS first-order latent variables. The scalar model (ie, equal indicator intercepts) exceeded the χ2DIFF but did meet the CFIDIFF. The invariant scalar model warranted assessment of the means between groups. The equal latent means slightly exceeded the χ2DIFF but did meet the CFIDIFF, indicating similar levels of disablement and quality of life among age groups.
Table 5.
Goodness-of-Fit Indices for the Measurement Invariance Analyses Across Age Groups
| χ2 |
df |
χ2 Difference Test (df) |
Comparative Fit Index |
Comparative Fit Index Difference Test |
Tucker-Lewis Index |
Root Mean Square Error of Approximation |
|
| Adolescents aged 14 to18 y (n = 332) | 340.704 | 98 | NC | 0.937 | NC | 0.923 | 0.086 |
| Emerging adulthood aged 19 to 24 y (n = 665) | 481.05 | 98 | NC | 0.940 | NC | 0.927 | 0.077 |
| Early adulthood aged 25 to 40 y (n = 154) | 213.85 | 98 | NC | 0.924 | NC | 0.907 | 0.088 |
| Model A (equal form) | 1036.04 | 294 | NC | 0.937 | NC | 0.923 | 0.047 |
| Model B (equal loadings) | 1052.03 | 318 | 15.99 (24) | 0.938 | +0.001b | 0.930 | 0.045 |
| Model C (equal factor variances) | 1067.95 | 326 | 31.91 (32) | 0.937 | 0.000 | 0.931 | 0.045 |
| Model D (equal indicator intercepts) | 1137.11 | 342 | 85.08 (48)a | 0.933 | 0.004 | 0.929 | 0.045 |
| Model E (equal latent means) | 1157.79 | 350 | 121.75 (56)a | 0.932 | 0.005 | 0.930 | 0.045 |
Abbreviation: NC, not calculated at this step.
Indicates model did not pass the invariance criteria.
Positive sign indicates the model improved.
Injury Classification Subgroups
In the sample, 1271 reported their injury classification, and these data were included in the analysis. Individuals were categorized into 2 groups: injured (n = 1035) or healthy (n = 236). Baseline models for injury status indicated less than ideal fit: neither group met the RMSEA cutoff of ≤0.06 or the CFI cutoff of ≥0.95, with model fit slightly exceeding a CFI of >0.90 (Table 6). The initial equal form model demonstrated less than ideal fit (CFI = 0.905; χ2 = 1002.19; RMSEA = 0.057; Table 6). The metric model (ie, equal loadings) slightly exceeded the χ2DIFF but did meet the CFIDIFF.
Table 6.
Goodness-of-Fit Indices for the Measurement Invariance Analyses Across Injury Classification
| χ2 |
df |
χ2 Difference Test (df) |
Comparative Fit Index |
Comparative Fit Index Difference Test |
Tucker-Lewis Index |
Root Mean Square Error of Approximation |
|
| Injured (n = 1035) | 761.56 | 98 | NC | 0.903 | NC | 0.881 | 0.081 |
| Healthy (n = 236) | 240.45 | 98 | NC | 0.912 | NC | 0.893 | 0.079 |
| Model A (equal form) | 1002.19 | 196 | NC | 0.905 | NC | 0.884 | 0.057 |
| Model B (equal loadings) | 1063.08 | 208 | 60.89 (12)a | 0.899 | 0.006 | 0.884 | 0.057 |
| Model C (equal factor variances) | 1211.27 | 212 | 209.08 (16)a | 0.882 | 0.023a | 0.867 | 0.061 |
| Model D (equal indicator intercepts) | 1187.70 | 220 | 185.51 (24)a | 0.886 | 0.019a | 0.875 | 0.059 |
Abbreviation: NC, not calculated at this step.
Indicates model did not pass invariance criteria.
Satisfactory metric invariance criteria warranted examination of the equal latent variances of the DPAS. When testing equal factor variances, both the CFIDIFF and χ2DIFF noninvariant criteria were exceeded (Table 6). When variances were not constrained to be equal, the injured subsample exhibited substantially more variability of the first-order latent variables, impairment (healthy variance = 0.18, injured variance = 0.23), functional limitations (healthy variance = 0.20, injured variance = 0.58), disability (healthy variance = 0.12, injured = 0.49), and quality of life (healthy variance = 0.31, injured = 0.61). The scalar model (ie, equal indicator intercepts) exceeded the CFIDIFF and the χ2DIFF, suggesting item-level bias among injury classification subgroups (Table 6).
Athletic Status Classification Subgroups
In the sample, 1271 reported their athletic status classification. and these data were included in the analysis. Individuals were categorized into 2 groups: competitive athlete (n = 677) or combined recreational or occupational athlete (n = 594). Baseline models for athletic status classification indicated acceptable but not ideal fit, with both groups exceeding the RMSEA cutoff of ≤0.06 (Table 7). The initial equal form model demonstrated acceptable but not ideal fit (CFI = 0.937; χ2 = 1004.69; RMSEA = 0.057; Table 7). The metric model (ie, equal loadings) met both the CFIDIFF and χ2DIFF.
Table 7.
Goodness-of-Fit Indices for the Measurement Invariance Analyses Across Athletic Status
| χ2 |
df |
χ2 Difference Test (df) |
Comparative Fit Index |
Comparative Fit Index Difference Test |
Tucker-Lewis Index |
Root Mean Square Error of Approximation |
|
| Competitive athlete (n = 677) | 527.83 | 98 | NC | 0.943 | NC | 0.930 | 0.081 |
| Recreational or occupational athlete (n = 594) | 476.86 | 98 | NC | 0.928 | NC | 0.911 | 0.081 |
| Model A (equal form) | 1004.69 | 196 | NC | 0.937 | NC | 0.922 | 0.057 |
| Model B (equal loadings) | 1028.73 | 208 | 24.04 (12) | 0.936 | 0.001 | 0.926 | 0.056 |
| Model C (equal factor variances) | 1051.57 | 212 | 46.88 (16)a | 0.934 | 0.003 | 0.926 | 0.056 |
| Model D (equal indicator intercepts) | 1101.20 | 220 | 96.51 (24)a | 0.931 | 0.006 | 0.925 | 0.056 |
| Model E (equal latent means) | 1145.60 | 224 | 140.91 (28)a | 0.928 | 0.009 | 0.923 | 0.057 |
Abbreviation: NC, not calculated at this step.
Indicates model did not pass the invariance criteria.
Satisfactory metric invariance criteria warranted examination of the equal latent variances. The χ2DIFF was exceeded; however, the CFIDIFF noninvariant criteria were met (Table 7), indicating that both athletic classification groups exhibited similar variability on the first-order latent variables of the DPAS. The scalar model (ie, equal indicator intercepts) exceeded the χ2DIFF but did meet the CFIDIFF criteria. The invariant scalar model warranted assessment of the means between groups. The equal latent means slightly exceeded the χ2DIFF but did meet the CFIDIFF test, indicating similar levels of disablement and quality of life among athletic classification subgroups.
Alternate Model Generation
The CFA of the 16-item DPAS indicated marginal fit to the data (CFI = 0.936, TLI = 0.923, RMSEA = 0.081, IFI = 0.936; Figure 2); therefore, we used alternate model generation to create a more parsimonious scale. Assessment of modification indices suggested several meaningful cross-loadings and alternative specifications that could maximize fit and parsimony. Given the high correlation values (>0.95), the impairments, functional limitations, and disability factor items were combined into 1 factor, renamed physical. The final solution resulted from the removal of 8 items, consisted of 2 factors (ie, physical and quality of life) that contained 4 items each, and met recommended goodness-of-fit indices (CFI = 0.993, TLI = 0.989, RMSEA = 0.036, IFI = 0.993; Figure 4). All factor loadings were different, ranging from 0.69 to 0.86, and the correlation between physical and quality of life was 0.40 (P < .001). The Cronbach α for both factors met recommended values (physical: α = .84; quality of life: α = .83). Cumulative scores for the 8-item DPAS were highly correlated (r = 0.98, P < .001, R2 = 0.96) with the cumulative scores for the 16-item DPAS.
Figure 4.
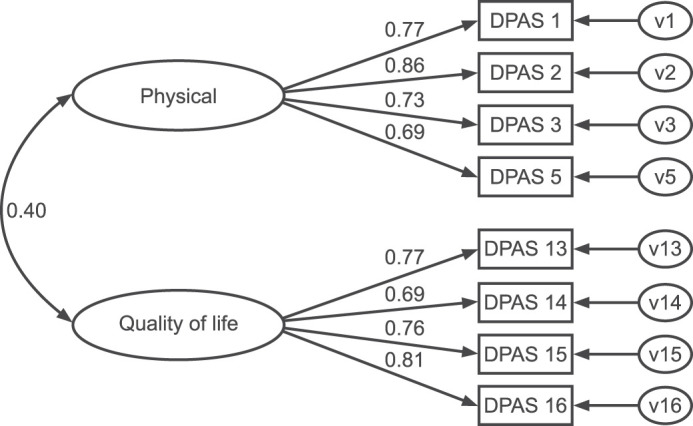
First-order 8-item alternative Disablement in the Physically Active Scale (DPAS) model. Abbreviations: d, disturbance variable; v, unique variance. Adapted with permission.12,22 χ2 = 49.718; degrees of freedom = 19; χ2 statistic/degrees of freedom ratio = 2.617; Comparative Fit Index = 0.993; Tucker-Lewis Index = 0.989; root mean square error of approximation = 0.036; Bollen Incremental Fit Index = 0.993; P < .001.
DISCUSSION
The purpose of our study was to assess the psychometric properties of the 16-item DPAS, a frequently used clinical assessment tool. The psychometric properties were evaluated in a large, heterogeneous sample across sex, age, injury classification, and athletic status groups. We used contemporary CFA and structural equation modeling procedures to more rigorously examine the DPAS for model fit and multigroup invariance.19,28 Our results suggested that the 16-item DPAS does not meet contemporary fit index recommendations, does not meet the criteria to demonstrate invariance, and should be modified to produce a more parsimonious and psychometrically sound instrument that will improve instrument precision and reduce the item-response burden for clinicians and patients.
Confirmatory Factor Analysis
The overall findings of our CFA are consistent with previous results,22 indicating that the 16-item scale does not meet model fit recommendations, and the solution presents with model misspecification and constructs that have multicollinearity bordering on singularity.19,20,24 Therefore, item removal is necessary to effectively measure the unique subconstructs (ie, impairments, functional limitations, and disability) of disablement8,12,34 that were originally intended in the creation of the DPAS.12,35 Without item modification (eg, item removal, rewriting items to improve clarity, reducing overlapping examples for patients),36 items from different subconstructs will continue to measure the same phenomenon, or participants will continue to struggle to interpret the intended differences among the items.
Invariance Testing
Invariance testing may be conducted for a number of reasons, such as to ensure an instrument's items are being interpreted similarly across groups (eg, injured and healthy individuals), underlying constructs (eg, functional limitation, disablement) are being measured similarly across groups, or measurement properties are being maintained across repeated measures.19,28 To our knowledge, we are the first to assess any of the invariance procedures involving the DPAS. The initial (eg, CFA) results indicated that the model did not meet more stringent goodness-of-fit standards that would typically prohibit invariance testing under the more contemporary guidelines.19,28 Given the common use of the DPAS in clinical practice, conducting invariance testing using less rigorous criteria was deemed relevant. The DPAS met the less rigorous invariance criteria (ie, the underlying constructs were being measured and interpreted similarly) across age, sex, and athletic status groups but did not meet the criteria for injury status. The DPAS was not invariant in this analysis, suggesting that the disablement and quality-of-life constructs and items did not have the same meaning across group membership (ie, healthy and injured). The differences may result from the items or examples included with the items having different meanings to people, depending on their current health status. Therefore, differences in scores (ie, healthy people had lower levels of disablement than injured people) based on this group membership cannot be solely attributed to injury status. The results indicated that the differences were being confounded by measurement artifact (eg, item interpretation, error), and drawing inferences based on group membership differences (ie, healthy versus injured) is not supported.19
Additionally, although testing between groups appeared to pass the less stringent criteria, several concerns with the DPAS were raised during the process. Acceptable but not preferred model fit indices were observed for all groups (ie, no models met the more stringent global fit guidelines: CFI ≥ 0.95, TLI ≥ 0.95, RMSEA ≤ 0.06, IFI ≥ 0.95),19,27 and a number of concerns were present (eg, high cross-loadings, high correlations among first-order latent variables) within the models. Although we did not modify the 16-item DPAS models (eg, releasing a constraint) during our invariance testing procedures, researchers could assess individual items and constructs to identify the most problematic items, remove problematic items, and attempt to improve model fit through the invariance testing process.19,20
Alternate Model Generation
Using alternate model generation, we identified a more parsimonious model that met the more stringent model fit standards.19,27 The 8-item DPAS exceeded the model fit recommendations19,20 and matched the proposed DPAS Short Form-8 that has been previously published.22 The final model contained 2 factors, physical and quality of life. The physical factor combined items originally in the impairment and functional limitations factors. All items from the disability factor were eliminated, whereas all 4 items in the quality-of-life factor were retained. The problems noted in the 16-item CFA and multigroup invariance (eg, high cross-loadings, high correlations among first-order latent variables) tests were not present in the 8-item version. Furthermore, despite the number of items being reduced by 50%, the 8-item version accounted for an acceptable amount of the variance in participants' responses on the DPAS. The high correlation (r = 0.98, P < .001, R2 = 0.96) between the 2 versions of the scale indicated substantial overlap between them and provided evidence that the short-form version captures the same information as the complete scale. The correlation value in our study exceeded the previously published correlation value (r = 0.94, P ≤ .001, R2 = 0.88) between the DPAS and the DPAS Short Form-8.22
Implications for Clinical Practice and Research
The effective use of PROs in clinical practice requires instruments that measure multiple constructs relevant to patient care (eg, health status, functional limitations)7,12,34; however, the constructs should be unique, and the scale should produce precise measurement of those constructs.19,20 Clinically, the identification of an 8-item instrument was relevant because the solution resolved the model fit concerns found in the original DPAS, improved the measurement precision for assessing the proposed constructs, had substantial overlap with the original scale, and reduced barriers (eg, contained fewer items) for clinicians and patients.4,22,37 Our invariance results also provided insight regarding differences between certain groups (ie, healthy versus injured) that are clinically relevant for using the DPAS to track health improvements. The findings supplied preliminary evidence that differences between certain groups may be related to the instrument (eg, measurement error) and not the respondents' stages of health (ie, health improvements over time). Further research (eg, longitudinal invariance testing) is needed to assess group differences using repeated measures and ensure that the changes experienced result from treatment outcomes indicating improved health and not measurement error.19,20 In addition, our results support previous findings18,22 that showed the distinctness of the quality-of-life and disablement constructs, which indicates clinicians should examine construct scores individually and not as a summative measure of disablement when the quality-of-life and disablement constructs are unique dimensions within the scale.
Limitations and Future Research
Although we tested a fairly diverse population, the participants were recruited from a relatively small group of clinics from across the United States. Further, our convenience sample primarily consisted of young, physically active participants; therefore, we do not know if the DPAS is invariant in other (eg, geriatric) populations who were not tested. Additionally, fairly conservative standards were used to assess model fit19,28; however, none of the models would have met the stricter recommendation guidelines. Whereas our invariance testing results identified potential concerns with the DPAS, further invariance testing (eg, longitudinal testing) is needed to fully elucidate the potential group differences and scale precision for measuring health status improvement over time. Yet future attention should likely be focused on the modified DPAS (ie, DPAS Short Form-8) because it does not have the same concerns as identified in the original DPAS by previous authors22 or us. The DPAS Short Form-8 model22 was also identified using alternate model generation in our sample. Whereas the 8-item version is promising, a true cross-validation analysis with invariance testing is still needed before adoption. Therefore, the DPAS Short Form-8 findings from our study should be interpreted with caution until more psychometric analyses (eg, invariance testing, longitudinal testing) are conducted in a cross-validation sample.30 Future researchers should identify whether the model meets the strict criteria when participants respond to only the 8 items and if the new model meets the recommended guidelines for invariance testing.
CONCLUSIONS
The 16-item DPAS did not meet model fit recommendations and may not be the most parsimonious or reliable measure for assessing disablement and quality of life. Given the model fit concerns and measurement noninvariance, clinicians should use the DPAS with caution. Whereas we also identified the DPAS Short Form-8, a more parsimonious model, additional research in a true cross-validation sample should be completed before this scale is fully adopted in research and clinical practice.
REFERENCES
- 1.Abrams D, Davidson M, Harrick J, Harcourt P, Zylinski M, Clancy J. Monitoring the change: current trends in outcome measure usage in physiotherapy. Man Ther. 2006;11(1):46–53. doi: 10.1016/j.math.2005.02.003. [DOI] [PubMed] [Google Scholar]
- 2.Evans TA, Lam KC. Clinical outcomes assessment in sport rehabilitation. J Sport Rehabil. 2011;20(1):8–16. doi: 10.1123/jsr.20.1.8. [DOI] [PubMed] [Google Scholar]
- 3.Hankemeier DA, Popp JK, Walker SE. Familiarity with and use of clinical prediction rules and patient-rated outcome measures. Athl Train Sports Health Care. 2017;9(3):108–123. doi: 10.3928/19425864-20170112-02. [DOI] [Google Scholar]
- 4.Nicholas P, Hefford C, Tumilty S. The use of the Patient-Specific Functional Scale to measure rehabilitative progress in a physiotherapy setting. J Man Manip Ther. 2012;20(3):147–152. doi: 10.1179/2042618612Y.0000000006. [DOI] [PMC free article] [PubMed] [Google Scholar]
- 5.Stucki G, Liang MH, Fossel AH, Katz JN. Relative responsiveness of condition-specific and generic health status measures in degenerative lumbar spinal stenosis. J Clin Epidemiol. 1995;48(11):1369–1378. doi: 10.1016/0895-4356(95)00054-2. [DOI] [PubMed] [Google Scholar]
- 6.Valier ARS, Jennings AL, Parsons JT, Vela LI. Benefits of and barriers to using patient-rated outcome measures in athletic training. J Athl Train. 2014;49(5):674–683. doi: 10.4085/1062-6050-49.3.15. [DOI] [PMC free article] [PubMed] [Google Scholar]
- 7.Jette A. Outcomes research: shifting the dominant research paradigm in physical therapy. Phys Ther. 1995;75(11):965–970. doi: 10.1093/ptj/75.11.965. [DOI] [PubMed] [Google Scholar]
- 8.Jette DU, Halbert J, Iverson C, Miceli E, Shah P. Use of standardized outcome measures in physical therapist practice: perceptions and applications. Phys Ther. 2009;89(2):125–135. doi: 10.2522/ptj.20080234. [DOI] [PubMed] [Google Scholar]
- 9.Childs JD, Cleland JA. Development and application of clinical prediction rules to improve decision making in physical therapist practice. Phys Ther. 2006;86(1):122–131. doi: 10.1093/ptj/86.1.122. [DOI] [PubMed] [Google Scholar]
- 10.Michener LA. Patient- and clinician-rated outcome measures for clinical decision making in rehabilitation. J Sport Rehabil. 2011;20(1):37–45. doi: 10.1123/jsr.20.1.37. [DOI] [PubMed] [Google Scholar]
- 11.Valovich McLeod TC, Snyder AR, Parsons JT, Bay RC, Michener LA, Sauers EL. Using disablement models and clinical outcomes assessment to enable evidence-based athletic training practice, part II: clinical outcomes assessment. J Athl Train. 2008;43(4):437–445. doi: 10.4085/1062-6050-43.4.437. [DOI] [PMC free article] [PubMed] [Google Scholar]
- 12.Vela LI, Denegar CR. The Disablement in the Physically Active Scale, part II: the psychometric properties of an outcomes scale for musculoskeletal injuries. J Athl Train. 2010;45(6):630–641. doi: 10.4085/1062-6050-45.6.630. [DOI] [PMC free article] [PubMed] [Google Scholar]
- 13.Hoch JM, Druvenga B, Ferguson BA, Houston MN, Hoch MC. Patient-reported outcomes in male and female collegiate soccer players during an athletic season. J Athl Train. 2015;50(9):930–936. doi: 10.4085/1062-6050-50.5.03. [DOI] [PMC free article] [PubMed] [Google Scholar]
- 14.McAllister DR, Motamedi AR, Hame SL, Shapiro MS, Dorey FJ. Quality of life assessment in elite collegiate athletes. Am J Sports Med. 2001;29(6):806–810. doi: 10.1177/03635465010290062201. [DOI] [PubMed] [Google Scholar]
- 15.Huffman GR, Park J, Roser-Jones C, Sennett BJ, Yagnik G, Webner D. Normative SF-36 values in competing NCAA intercollegiate athletes differ from values in the general population. J Bone Joint Surg Am. 2008;90(3):471–476. doi: 10.2106/JBJS.G.00325. [DOI] [PubMed] [Google Scholar]
- 16.Fritz JM, Clifford SN. Low back pain in adolescents: a comparison of clinical outcomes in sports participants and nonparticipants. J Athl Train. 2010;45(1):61–66. doi: 10.4085/1062-6050-45.1.61. [DOI] [PMC free article] [PubMed] [Google Scholar]
- 17.Hsu JE, Nacke E, Park MJ, Sennett BJ, Huffman GR. The Disabilities of the Arm, Shoulder, and Hand questionnaire in intercollegiate athletes: validity limited by ceiling effect. J Shoulder Elbow Surg. 2010;19(3):349–354. doi: 10.1016/j.jse.2009.11.006. [DOI] [PubMed] [Google Scholar]
- 18.Houston MN, Hoch JM, Van Lunen BL, Hoch MC. The development of summary components for the Disablement in the Physically Active scale in collegiate athletes. Qual Life Res. 2015;24(11):2657–2662. doi: 10.1007/s11136-015-1007-6. [DOI] [PubMed] [Google Scholar]
- 19.Kline RB. Principles and Practice of Structural Equation Modeling 4th ed. New York, NY: Guilford Publications; 2015. [Google Scholar]
- 20.Brown TA. Confirmatory Factor Analysis for Applied Research 2nd ed. New York, NY: Guilford Publications; 2014. [Google Scholar]
- 21.Chen FF. Sensitivity of goodness of fit indexes to lack of measurement invariance. Struct Equ Modeling. 2007;14(3):464–504. doi: 10.1080/10705510701301834. [DOI] [Google Scholar]
- 22.Baker RT, Burton D, Pickering MA, Start A. Confirmatory factor analysis of the Disablement in the Physically Active Scale and preliminary testing of short-form versions: a calibration and validation study. J Athl Train. 2019;54(3):302–318. doi: 10.4085/1062-6050-355-17. [DOI] [PMC free article] [PubMed] [Google Scholar]
- 23.Strong J, Unruh AM, Wright A, Baxter GD. Pain A Textbook for Therapists. Edinburgh, United Kingdom: Churchill Livingstone; 2002. [Google Scholar]
- 24.Jöreskog K, Sörbom D. LISREL 8 Structural Equation Modeling with the SIMPLIS Command Language. Chicago, IL: Scientific Software International; 1993. [Google Scholar]
- 25.Tabachnick BG, Fidell LS. Using Multivariate Statistics 4th ed. Needham Heights, MA: Allyn & Bacon; 2001. [Google Scholar]
- 26.Bryant FB, Yarnold PR. Principal-components analysis and exploratory and confirmatory factor analysis. In: Grimm LG, Yarnold PR, editors. Reading and Understanding Multivariate Statistics. Washington, DC: American Psychological Association; 1995. pp. 99–136. [Google Scholar]
- 27.Hu L, Bentler PM. Cutoff criteria for fit indexes in covariance structure analysis: conventional criteria versus new alternatives. Struct Equ Modeling. 1999;6(1):1–55. doi: 10.1080/10705519909540118. [DOI] [Google Scholar]
- 28.Byrne B. Structural Equation Modeling with AMOS Basic Concepts Applications and Programming 3rd ed. New York, NY: Routledge; 2016. [Google Scholar]
- 29.Sigelman CK, Rider EA. LifeSpan Human Development 9th ed. Boston, MA: Cengage Learning; 2017. [Google Scholar]
- 30.Schermelleh-Engel K, Moosbrugger H, Müller H. Evaluating the fit of structural equation models: tests of significance and descriptive goodness-of-fit measures. Methods Psychol Res. 2003;8(2):23–74. https://www.dgps.de/fachgruppen/methoden/mpr-online/ Accessed May 22, 2020. [Google Scholar]
- 31.Cohen L, Manion L, Morrison K. Research Methods in Education 6th ed. New York, NY: Routledge; 2007. [Google Scholar]
- 32.Pesudovs K, Burr JM, Harley C, Elliott DB. The development, assessment, and selection of questionnaires. Optom Vis Sci. 2007;84(8):663–674. doi: 10.1097/OPX.0b013e318141fe75. [DOI] [PubMed] [Google Scholar]
- 33.Ware J, Jr, Kosinski M, Keller SD. A. 12-item short-form health survey: construction of scales and preliminary tests of reliability and validity. Med Care. 1996;34(3):220–233. doi: 10.1097/00005650-199603000-00003. [DOI] [PubMed] [Google Scholar]
- 34.Verbrugge LM, Jette AM. The disablement process. Soc Sci Med. 1994;38(1):1–14. doi: 10.1016/0277-9536(94)90294-1. [DOI] [PubMed] [Google Scholar]
- 35.Vela LI, Denegar C. Transient disablement in the physically active with musculoskeletal injuries, part I: a descriptive model. J Athl Train. 2010;45(6):615–629. doi: 10.4085/1062-6050-45.6.615. [DOI] [PMC free article] [PubMed] [Google Scholar]
- 36.Dillman DA, Smyth JD. Melani Christian L Internet Phone Mail and MixedMode Surveys The Tailored Design Method 4th ed. Hoboken, NJ: John Wiley & Sons; 2014. [Google Scholar]
- 37.Westaway MD, Stratford PW, Binkley JM. The Patient-Specific Functional Scale: validation of its use in persons with neck dysfunction. J Orthop Sports Phys Ther. 1998;27(5):331–338. doi: 10.2519/jospt.1998.27.5.331. [DOI] [PubMed] [Google Scholar]