

Abstract
Background
The effect of bariatric surgery on ‘emotional eating’ (EE) in people with obesity is unclear. This systematic review and meta‐analysis aimed to examine changes in self‐reported emotional eating behaviour after bariatric surgery.
Methods
Fifteen electronic databases were searched from inception to August 2019. Included studies encompassed patients undergoing primary bariatric surgery, quantitatively assessed EE, and reported EE scores before and after surgery in the same participants. Studies were excluded if they were not in English or available in full text. The systematic review and meta‐analysis were conducted according to the PRISMA guidelines. Random‐effects models were used for quantitative analysis. Study quality was assessed using the National Heart, Lung, and Blood Institute quality assessment tool for before–after (pre–post) studies with no control group.
Results
Some 23 studies containing 6749 participants were included in the qualitative synthesis, with follow‐up of from 2 weeks to 48 months. EE scores decreased to 12 months after surgery. Results were mixed beyond 12 months. Quantitative synthesis of 17 studies (2811 participants) found that EE scores decreased by a standardized mean difference of 1·09 (95 per cent c.i. 0·76 to 1·42) 4–18 months after surgery, indicating a large effect size.
Conclusion
Bariatric surgery may mitigate the tendency to eat in response to emotions in the short to medium term.
In this meta‐analysis involving 17 studies, self‐reported emotional eating scores decreased significantly by a standardized mean difference of 1·09 (95 per cent c.i. 0·76 to 1·42) at 4–18 months after bariatric surgery. This raises the possibility of a mitigating effect of bariatric surgery on emotional eating in the short to medium term.
Little evidence of an effect beyond 12 months
Antecedentes
El efecto de la cirugía bariátrica sobre la “alimentación emocional” (emotional eating, EE) en personas con obesidad no esta claro. Esta revisión sistemática y metaanálisis tuvo como objetivo examinar los cambios en el comportamiento de la alimentación emocional referida por los mismos pacientes después de cirugía bariátrica.
Métodos
Se realizó una búsqueda en 15 bases de datos electrónicas desde el inicio de las mismas hasta agosto de 2019. Los estudios seleccionados incluían pacientes con cirugía bariátrica primaria, EE evaluada de forma cuantitativa, y descripción de las puntuaciones de EE antes y después de la cirugía en los mismos participantes. Se excluyeron estudios que no estuvieran publicados en inglés o si no se disponía del texto completo. Esta revisión sistemática y metaanálisis se llevó a cabo de acuerdo con las recomendaciones PRISMA (Preferred Reporting Items for Systematic Reviews and Meta-Analyses). Se utilizó un modelo de efectos aleatorios para el análisis cuantitativo. La calidad de los estudios individuales se evaluó utilizando la herramienta de evaluación de la calidad NHLBI para estudios de antes‐después (pre‐post) sin grupo control.
Resultados
Se incluyeron un total de 23 estudios con 6.749 participantes en la síntesis cualitativa, y un seguimiento de 2 semanas a 48 meses. Las puntuaciones EE disminuyeron a los 12 meses postoperatorios. Los resultados fueron variados más allá de los 12 meses. La síntesis cuantitativa de 17 estudios (2.811 participantes) encontró que las puntuaciones EE disminuyeron con una diferencia de medias ponderada de 1,09 (i.c. del 95% 0,76, 1,42) a los 4‐18 meses tras la operación, lo que indica una magnitud de efecto grande.
Conclusión
La cirugía bariátrica puede atenuar la tendencia a comer en respuesta a las emociones en el corto y medio plazo.
Introduction
Bariatric surgery is the most effective treatment for obesity, resulting in a mean weight loss of 26–38 per cent at 3–5 years, compared with 0–3 per cent for lifestyle interventions 1 , 2 . Although the exact mechanisms are not understood completely, it is thought that postoperative neurohormonal changes promote sustained weight loss by contributing to control of hunger and enhanced meal‐induced satiety, particularly after sleeve gastrectomy (SG) and Roux‐en‐Y gastric bypass (RYGB). The efficacy of bariatric surgery relative to pharmaceutical modulation of hunger and satiety (mean placebo‐subtracted weight losses of 3–8 per cent at 12 months 3 ) raises the possibility that bariatric surgery has wider‐ranging effects on eating behaviour. This is supported by reports of alterations in food preferences (such as reduced appeal of sweet, fatty foods) and reduced cravings after bariatric surgery 4 , 5 .
Consumption of highly palatable foods in response to emotional states (‘emotional eating’) affects 15–47 per cent of the general population, and as much as 63 per cent of people with obesity 6 . This is concerning, as emotional eating is associated with food preoccupation 7 , loss of control over eating 8 , 9 , overeating 10 , 11 , 12 and reduced success of obesity treatment 13 . It is not clear whether emotional eating behaviour is altered after bariatric surgery, owing to considerable heterogeneity between studies in methods of assessing eating behaviour, types of bariatric surgery performed, and timing of postoperative follow‐up.
This systematic review and meta‐analysis aimed to review comprehensively emotional eating changes following bariatric surgery in studies that used pre–post assessments of eating behaviour. It was hypothesized that emotional eating scores would be lower after bariatric surgery than before surgery.
Methods
This systematic review and meta‐analysis was guided by the PRISMA statement 14 and MOOSE guidelines 15 . It was registered on PROSPERO (identification number CRD42019134042).
Eligibility criteria
Studies were considered eligible if they included patients of any age and sex undergoing primary bariatric surgery, quantitatively assessed emotional eating, and reported emotional eating scores before and after surgery in the same participants. Studies were excluded if they included only revisional surgery, did not include human participants, were not in the English language, or were not published as full‐text versions (for example, conference abstracts).
Search strategy
Fifteen databases (Table S1 , supporting information) were searched up to 16 August 2019 by one author and a clinical librarian. The following search terms were adapted for each source and included Medical Subject Headings (MeSH) and keywords such as ‘emotion* eat*’, ‘comfort eat*’, ‘stress eat’, ‘eating behaviour’, ‘bariatric surgery’, ‘sleeve gastrectomy’, ‘RYGB’, ‘biliopancreatic diversion’, ‘LAGB’ and ‘gastric band*’. No limits were placed on year of publication, publication status, study design, sample size, language or full‐text availability. Animal studies were excluded. The search results from all the databases were downloaded and electronically managed using EndNote X9™ (Clarivate Analytics, Philadelphia, Pennsylvania, USA).
Study selection
Duplicates were removed and references imported into Rayyan 16 (http://rayyan.qcri.org) for screening of titles and abstracts by two authors independently. Relevant full‐text articles were retrieved, and two authors independently reviewed each according to the inclusion and exclusion criteria. Conflicts were resolved by consensus following discussion. Additional papers were found via hand‐searches of reference lists of full‐text papers and key systematic reviews.
Data extraction
A data extraction sheet was created and one author extracted the following information: study characteristics (author, year of publication); design (aim, sample size, setting, type of intervention, follow‐up, tools used to identify emotional eating); participant characteristics (age, sex, BMI); description of surgery; and emotional eating scores before and after surgery. In addition, 11 authors were contacted to retrieve mean(s.d.) values of emotional eating assessments, of whom five responded. Graphical outcome data for two studies were estimated using PlotDigitizer™ 2.6.8 (SourceForge; Slashdot Media, La Jolla, California, USA) 17 .
Quality assessment
Two authors independently assessed study quality using the National Heart, Lung, and Blood Institute (NHLBI) ‘quality assessment tool for before–after (pre–post) studies with no control group’ 18 , to give each an overall quality rating of poor, fair or good. Disagreements were resolved by consensus.
Statistical analysis
Meta‐analysis was conducted using Review Manager™ 5.3 (The Cochrane Collaboration, The Nordic Cochrane Centre, Copenhagen, Denmark) 19 . The primary outcome was the standardized mean difference (SMD) of emotional eating scores after surgery. Review Manager™ facilitates the input of data in several formats (for example, mean, mean difference (MD), standard deviation (s.d.), standard error, 95 per cent c.i., P value), which can be converted into SMD and 95 per cent c.i. for quantitative synthesis. Study outcomes were calculated to two decimal places, unless otherwise reported in the original study. Studies were pooled for meta‐analysis if sufficient outcome data could be obtained or estimated, and if postsurgical assessment occurred within 4–18 months (the longest time point was used if multiple were reported). This time frame was chosen as maximum weight loss occurs up to 1–2 years after bariatric surgery.
As emotional eating was assessed using a number of different tools, quantitative assessment outcomes were reported as SMDs to facilitate comparison between different scales. Effect sizes were considered small, medium and large for SMDs of 0·2, 0·5 and 0·8 respectively 20 . Pooled estimates of study outcomes were obtained using an inverse‐variance weighted random‐effects model. All studies that satisfied inclusion criteria for quantitative synthesis were included in one meta‐analysis, followed by prespecified subgroup analyses based on type of surgery. To avoid confounding between‐ and within‐study variability, subgroup analyses by surgical type were based on individual questionnaires that were used in more than one study: the Dutch Eating Behaviour Questionnaire (DEBQ), and the 18‐ and 21‐item revisions of the Three‐Factor Eating Questionnaire (TFEQ). For studies that divided participants receiving the same operation into subgroups, subgroups were combined to form one group using the sample size and mean(s.d.) values for meta‐analysis. Heterogeneity was quantified using the I 2 test, where values greater than 25 per cent, more than 50 per cent and above 75 per cent represent low, moderate and high heterogeneity respectively 21 . Publication bias was evaluated by visual interpretation of funnel plots and Egger's regression test, with significance set at P < 0·050. Statistical analyses were conducted in Review Manager™ 5.3 and STATA® version IC15.1 (StataCorp, College Station, Texas, USA).
Sensitivity analysis
A number of sensitivity analyses were performed. These were undertaken initially to assess the robustness of the conclusion by changing the eligibility criteria (removing studies that contained only participants aged 18 years or less, those that included only female patients, and those rated as poor quality). Between‐study heterogeneity was assessed by stratifying studies based on the questionnaire used to assess emotional eating, and by sequentially excluding individual studies from meta‐analysis one at a time. Finally, studies were excluded if reported presurgery or postsurgery mean(s.d.) values indicated that emotional eating scores were not distributed normally (if mean minus 3 standard deviations included negative values). Effect sizes, statistical significance and heterogeneity were examined for each analysis to determine whether the summary estimates differed meaningfully from the main analysis.
Results
Screening of databases resulted in 1275 citations, and hand‐searching provided an additional five articles. After duplicates were removed, 949 studies remained. Title and abstract screening yielded 80 studies, of which 23 4 , 22 , 23 , 24 , 25 , 26 , 27 , 28 , 29 , 30 , 31 , 32 , 33 , 34 , 35 , 36 , 37 , 38 , 39 , 40 , 41 , 42 , 43 were included in the qualitative synthesis and 17 in the meta‐analysis (Fig. 1 ).
Fig. 1.
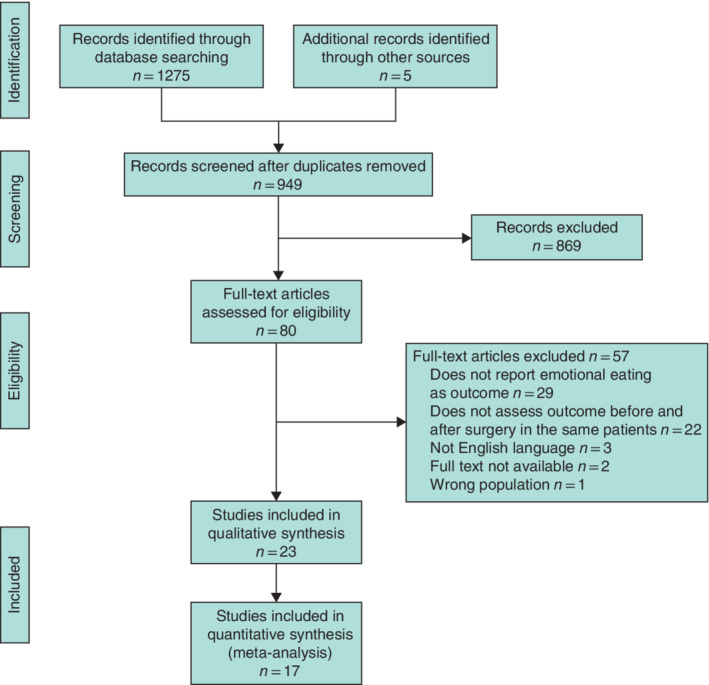
PRISMA diagram for the review
Study characteristics
An overview of the study characteristics is provided in Table 1 . Twenty were prospective cohort studies 4 , 22 , 23 , 24 , 25 , 26 , 27 , 28 , 29 , 30 , 31 , 32 , 33 , 34 , 35 , 36 , 37 , 38 , 39 , 40 , one 41 was a retrospective cohort study, and two 42 , 43 were RCTs. One RCT 42 randomized patients with a BMI of 50–60 kg/m2 to either duodenal switch or gastric bypass, and the other 43 randomized patients to either lifestyle intervention or usual care after bariatric surgery. A total of 6749 (range 9–4569; mean 293; median 71) surgical participants were involved. One study 41 was conducted in an adolescent population, and the remainder included only adults. The mean age range was 16·9–47·1 years and mean preoperative BMI ranged from 36 to 57 kg/m2. Every study had a predominantly female population (range 65–100 per cent). The vast majority of patients underwent RYGB (19 studies, 6140 patients) 4 , 23 , 24 , 25 , 26 , 27 , 28 , 29 , 30 , 31 , 32 , 33 , 34 , 35 , 36 , 38 , 39 , 41 , 42 , seven studies (381 patients) 4 , 22 , 26 , 30 , 32 , 36 , 40 investigated SG, three (48 patients) 28 , 36 , 38 examined laparoscopic adjustable gastric banding (LAGB), two (121 patients) 37 , 43 included vertical banded gastroplasty (VBG), and one each duodenal switch (29 patients) 42 , biliopancreatic diversion (BPD) (26 patients) 28 and anastomosis gastric bypass (4 patients) 32 .
Table 1.
Characteristics of studies included in the qualitative analysis
| Reference | Setting | No. of women* | Age (years)‡ | Baseline BMI (kg/m2)‡ | Procedure† |
|---|---|---|---|---|---|
| Alfonsson et al. 34 | Sweden (n.r.) | 101 of 129 (78·3) | 42·8(10·52) | 42·95(3·98) | RYGB (129) |
| Van der Zwaal et al. 35 | Netherlands (multicentre) | 14 of 14 (100) | 44·3(6) | 45·2(6·7) | RYGB (14) |
| Monpellier et al. 24 | Netherlands (single‐centre) | 3733 of 4569 (81·7) | 47·1(10·7) | 44·4(5·7) | RYGB (4569) |
| Pepino et al. 36 | USA (single‐centre) | 39 of 44 (89) | 42·8(10·8) | 47·7(8·0) | Mixed (RYGB 25, SG 8, LAGB 11) |
| Subramaniam et al. 32 | Malaysia (multicentre) | 37 of 57 (65) | 39·40(10·01) | 45·52(9·94) | Mixed (RYGB 30, SG 23, 1 anastomosis, gastric bypass–mini gastric bypass 4) |
| Pepino et al.38 | USA (single‐centre) | 27 of 27 (100) | LAGB: 46·8(13·9)¶ | LAGB: 48·5(10·5)¶ | LAGB (10) |
| RYGB: 42·1(8·4)¶ | RYGB: 46·3(7·7)¶ | RYGB (17) | |||
| Nance et al. 4 | USA (single‐centre) | RYGB: 20 of 23 (87) | RYGB: 43·0(9·6) | RYGB: 46·9(7·5) | RYGB (23) |
| SG: 7 of 8 (88) | SG: 36·6(9·0) | SG: 53·3(8·7) | SG (8) | ||
| Van Hout et al. 37 | Netherlands (single‐centre) | 80 of 91 (88) | 38·6(8·3) | 45·7(5·1) | VBG (91) |
| Papalazarou et al. 43 | Greece (single‐centre) | 30 of 30 (100) | Lifestyle intervention: 32·7(6·2)¶ | Lifestyle intervention: 48·5(8·1)¶ | VBG (30) |
| Usual care group: 33·4(7·7)¶ | Usual care group: 49·8(6·2)¶ | ||||
| Holsen et al. 40 | USA (multicentre) | 16 of 18 (89) | 38·4(10·1) | 41·8(4·5) | SG (18) |
| Järvholm et al. 41 | Sweden (multicentre) | 55 of 82 (67) | 16·9(1·15) | 45·4(6·08) | RYGB (82) |
| Willmer et al.33 | Sweden (multicentre) | 63 of 63 (100) | 39(5·5) | 39·2(3·3) | RYGB (63) |
| Laurenius et al.31 | Sweden (n.r.) | 28 of 43 (65) | 42·6(9·7) | 44·5(4·9) | RYGB (43) |
| Turkmen et al.29 | Sweden (single‐centre) | 9 of 9 (100) | 31·4(7·41) | 47·2(8·85) | RYGB (9) |
| Søvik et al.42 | Norway and Sweden (multicentre) | RYGB: 23 of 31 (74) | RYGB: 35·2(7·0) | RYGB: 54·8(3·24) | RYGB (31) |
| DS: 19 of 29 (66) | DS: 36·1(5·26) | DS: 55·2(3·49) | DS (29) | ||
| Bryant et al.23 | UK (n.r.) | 9 of 12 (75) | 36(2) | 45·3(1·9) | RYGB (12) |
| Petereit et al. 25 | Lithuania (single‐centre) | 128 of 180 (71·1) | 42·7(10·5) | 45·2(6·4) | RYGB (180) |
| Woodard et al. 27 | USA (single‐centre) | 28 of 35 (80) | 48(11)¶ | 48·7(8·3)¶ | RYGB (35) |
| Nasirzadeh et al. 26 | Canada (multicentre) | 658 of 844# (81·2) | 45 (38–53)§ | 48·6(7·8) | Mixed (RYGB 760, SG 84) |
| Castellini et al.28 | Italy (single‐centre) | LAGB: 23 of 27 (85) | LAGB: 43·85(11·36) | LAGB: 44·79(5·3) | LAGB (27) |
| RYGB: 28 of 30 (93) | RYGB: 43·63(9·83) | RYGB: 49·49(6·76) | RYGB (30) | ||
| BPD: 24 of 26 (92) | BPD: 48·84(8·36) | BPD: 50·57(6·55) | BPD (26) | ||
| Dymek et al. 39 | USA (single‐centre) | 26 of 32 (81) | 39·1(8·47) | 56·7(11·5) | RYGB (32) |
| Weineland et al. 30 | Sweden (single‐centre) | 171 of 186 (91·9) | 42·2(9·3) | 36·2(3·6) | Mixed (SG 130, RYGB 56) |
| Sioka et al. 22 | Greece (single‐centre) | < 3 months: 7 of 10 (70) | < 3 months: 38·2(10·76) | < 3 months: 43·68(8·29) | SG (110) |
| 3–6 months: 11 of 11 (100) | 3–6 months: 38(9·96) | 3–6 months: 43·85(5·69) | |||
| 6–12 months: 7 of 11 (64) | 6–12 months: 42·1(10·9) | 6–12 months: 45·85(6·13) | |||
| 1–2 years: 31 of 39 (79) | 1–2 years: 39·56(9·15) | 1–2 years: 46·05(5·83) | |||
| 2–3 years: 19 of 23 (83) | 2–3 years: 40·39(9·68) | 2–3 years: 46·52(6·81) | |||
| > 3 years: 11 of 16 (69) | > 3 years 38·63(10·83) | > 3 years: 44·81(5·63) |
Values in parentheses are *percentages and †number of patients. ‡Values are mean(s.d.) unless indicated otherwise; §values are mean (i.q.r.). ¶Data converted from originally reported outcome data into mean(s.d.) values using Review Manager 5.3. #Of a total 844 participants, only 810 had their sex recorded (658 women and 152 men). n.r., Not reported; RYGB, Roux‐en‐Y gastric bypass; SG, sleeve gastrectomy; LAGB, laparoscopic adjustable gastric band; VBG, vertical banded gastroplasty; DS, duodenal switch; BPD, biliopancreatic diversion.
Assessment of emotional eating
Details of outcomes are summarized in Table 2 . The timing of postsurgical assessment ranged from 3 days to 48 months, with the most common final duration of follow‐up being 12 months (7 studies) 23 , 25 , 27 , 28 , 29 , 34 , 40 . The most common measure of emotional eating was the DEBQ 44 , used in nine studies 4 , 24 , 32 , 35 , 36 , 37 , 38 , 40 , 43 . The 21‐ and 18‐item revisions of the original 51‐item TFEQ (TFEQ‐R21 45 and TFEQ‐R18) 46 , 47 were used in six 29 , 31 , 33 , 40 , 41 , 42 and three 23 , 25 , 27 studies respectively. The remaining seven studies used a mix of questionnaires, including the Emotional Eating Scale (EES) 26 , 28 , 39 , General Food Craving Questionnaire – Trait (GFCQ‐T) 34 , 35 , the Yale Emotional Overeating Questionnaire (EOQ) 30 , and dietician interview 22 , in which eating patterns were defined by the International Federation for the Surgery of Obesity and Metabolic Disorders (IFSO) European Accreditation Council for Bariatric Surgery.
Table 2.
Emotional eating outcomes of studies included in the qualitative analysis
| Change from preop. baseline/control§ | Trends after surgery§ | |||||||
|---|---|---|---|---|---|---|---|---|
| Reference | Questionnaire | Assessment time points (months) | Outcome* | MD | P | MD | P | No. analysed of total enrolled (retention rate)# |
| 34 | GFCQ‐T | Preop. | 2·27(1·03) | n.a. | n.a. | 129 of 177 (72·9) | ||
| 1 | 1·39(0·72) | −0·88 (−1·10, −0·66)** | < 0·001 | n.a. | 129 of 177 (72·9) | |||
| 35 | DEBQ and GFCQ‐T | Preop. | DEBQ: 2·53(0·86) | n.a. | n.a. | 14 of 20 (70) | ||
| GFCQ‐T: 2·97(1·37) | ||||||||
| > 24 | DEBQ: 2·10(0·72) | DEBQ: −0·43 (−1·05, 0·19)** | 0·034 | n.a. | 14 of 20 (70) | |||
| GFCQ‐T: 2·14(0·80) | GFCQ‐T: −0·83 (−1·71, 0·05)** | 0·035 | ||||||
| 24 | DEBQ | Preop. | 2·43(0·82) | n.a. | n.a. | 2028 of 4829 (42·0) | ||
| 15 | 1·94(0·77) | −0·49 (−0·54, −0·44)** | ≤ 0·001 | n.a. | 1939 of 4829 (40·2) | |||
| 24 | 2·09(0·78) | −0·34 (−0·39, −0·29)** | 15 versus 24 months: 0·15 (0·10, 0·20)** | ≤ 0·001 | 1401 of 4829 (29·0) | |||
| 36 | 2·27(0·82) | −0·16 (−0·25, −0·07)** | 24 versus 36 months: 0·18 (0·09, 0·27)** | > 0·05 | 388 of 4829 (8·0) | |||
| 48 | 2·35(0·86) | −0·08 (−0·24, 0·08)** | 36 versus 48 months: 0·08 (−0·09, 0·25)** | > 0·05 | 112 of 4829 (2·3) | |||
| 36 | DEBQ | Preop. | 2·73(0·97)†† | n.a. | n.a. | 44 of 51 (86) | ||
| After about 20% (range 15–28%) surgery‐induced weight loss (within 9 months) | 1·95(0·80)†† | −0·78 (−1·15, −0·41)** | < 0·001 | n.a. | 44 of 51 (86) | |||
| 32 | DEBQ | Preop. | 2·06(0·94) | n.a. | n.a. | 57 of 80 (71) | ||
| 3 | 1·64(0·80) | −0·42 (−0·78, −0·06)** | n.a. | 45 of 80 (56) | ||||
| 6 | 1·81(0·81) | −0·25 (−0·63, 0·13)** | 3 versus 6 months: 0·17 (−0·19, 0·53)** | 36 of 80 (45) | ||||
| 38 | DEBQ | Preop. | RYGB: 2·8(0·8) | n.a. | n.a. | RYGB: 17 of 17 (100)†† | ||
| LAGB: 3·2(1·0) | LAGB: 10 of 10 (100)†† | |||||||
| After about 20% surgery‐induced weight loss (within 9 months) | RYGB: 1·9(0·7) | RYGB: −0·90 (−1·41, −0·39)** | n.a. | RYGB: 17 of 17 (100)†† | ||||
| LAGB: 2·3(1·0) | LAGB: −0·90 (−1·78, −0·023)** | < 0·001 | LAGB: 10 of 10 (100)†† | |||||
| 4 | DEBQ | Preop. | SG: 2·8(0·9) | n.a. | n.a. | SG: 8 of 8 (100)†† | ||
| RYGB: 2·6(0·9) | RYGB: 23 of 23 (100)†† | |||||||
| After about 20% surgery‐induced weight loss | SG: 2·2(0·6) | SG: −0·6 (−1·04, −0·16)** | n.a. | SG: 8 of 8 (100)†† | ||||
| RYGB: 1·8(0·7) | RYGB: −0·80 (−1·66, 0·07)** | RYGB: 23 of 23 (100)†† | ||||||
| 37 | DEBQ | Preop. | 2·4(0·8) | n.a. | n.a. | 81 of 91 (89) | ||
| 6 | 1·9(0·8) | −0·50 (−0·75, −0·25)** | ≤ 0·01 | n.a. | 81 of 91 (89) | |||
| 12 | 2·0(0·8) | −0·40 (−0·65, −0·15)** | ≤ 0·01 | 6 versus 12 months: 0·10 (−0·15, 0·35)** | > 0·05 | 81 of 91 (89) | ||
| 24 | 2·2(0·9) | −0·20 (−0·46, 0·06)** | > 0·05 | 12 versus 24 months: 0·20 (0·06, 0·46)** | > 0·05 | 81 of 91 (89) | ||
| 43 | DEBQ | Preop. | Usual care: 3·2(0·77)** | n.a. | n.a. | Usual care: 15 of 15 (100)†† | ||
| Lifestyle: 3·6(0·77)** | Lifestyle: 15 of 15 (100)†† | |||||||
| 3 | Usual care: 2·6(0·39)** | −0·60 (−1·0, −0·16)** | n.a. | Usual care: 15 of 15 (100)†† | ||||
| Lifestyle: 2·6(0·39)** | −1·00 (−1·44, −0·56)** | Lifestyle: 15 of 15 (100)†† | ||||||
| 12 | Usual care: 2·5(0·77)** | −0·70 (−1·13, −0·15)** | 3 versus 12 months: −0·10 (−0·54, 0·34)** | Usual care: 15 of 15 (100)†† | ||||
| Lifestyle: 2·5(0·39)** | −1·10 (−1·54, −0·66)** | 3 versus 12 months: −0·10 (−0·38, 0·18)** | Lifestyle: 15 of 15 (100)†† | |||||
| 36 | Usual care: 3·2(0·39)** | −0·00 (−0·44, 0·44)** | 12 versus 36 months: 0·65 (0·58, 0·72)** | Usual care: 15 of 15 (100)†† | ||||
| Lifestyle: 3·1(0·39)** | −0·50 (−0·94, −0·06)** | 12 versus 36 months: 0·60 (0·32, 0·88)** | Lifestyle: 15 of 15 (100)†† | |||||
| 40 | DEBQ and TFEQ‐R21 | Preop. | DEBQ: 3·2(0·7) | n.a. | n.a. | 18 of 20 (90) | ||
| TFEQ‐R21: 60·2(24·8) | ||||||||
| 12 | DEBQ: 1·9(0·9) | DEBQ: −1·30 (−1·83, −0·77)** | < 0·001 | n.a. | 18 of 20 (90) | |||
| TFEQ‐R21: 27·5(22·4) | TFEQ‐R21: −32·70 (−44·16, ‐21·24)** | < 0·001 | ||||||
| 41 | TFEQ‐R21 | Preop. | Mixed model: 40·6 (35·4, 45·8)† | n.a. | n.a. | 81 of 82 (99) | ||
| 12 | Mixed model: 20·8 (15·7, 25·8)† | Mixed model: −19·9 (−27·7, −12·0)† | n.a. | 81 of 82 (99) | ||||
| 24 | Mixed model: 24·9 (19·6, 30·2)† | Mixed model: −15·7 (−24·2, −7·3)† | 12 versus 24 months, mixed model: 4·1 (−4·1, 12·3)† | 73 of 82 (89) | ||||
| 33 | TFEQ‐R21 | Preop. | 15·2(n.r.) | n.a. | n.a. | 52 of 63 (83) | ||
| 9 | 9·9(n.r.) | −5·31 (−6·66, −3·96) | ≤ 0·001 | n.a. | 52 of 63 (83) | |||
| 31 | TFEQ‐R21 | Preop. | 53·7 (46·8, 60·7)†‡‡ | n.a. | n.a. | 43 of 47 (91) | ||
| 6 weeks | 27·4 (20·4, 34·5)†‡‡ | −26·3 (−36·9, −15·6)** | < 0·001 | n.a. | RYGB: 42 of 47 (89) | |||
| 12 | 27·1 (19·3, 34·8)†‡‡ | −26·6 (−36·6, −16·6)** | < 0·001 | 6 weeks versus 12 months: −0·30 (−10·40, 9·77)** | RYGB: 27 of 47 (57) | |||
| 24 | 38·8 (29·8, 47·9)†‡‡ | −14·90 (−21·99, −7·81)** | 0·046 | 12 versus 24 months: 11·70 (3·92, 19·50)** | RYGB: 34 of 47 (72) | |||
| 29 | TFEQ‐R21 | Preop. | 47·90(27·56) | n.a. | n.a. | 9 of 9 (100)** | ||
| 6 | 32·06(27·46) | −15·84 (−42·0, 10·36)** | n.a. | 8 of 9 (89)§§ | ||||
| 12 | 33·76 (23·96) | −14·14 (−38·63, 10·35)** | 6 versus 12 months: −1·70 (−25·94, 29·34)** | 8 of 9 (89)§§ | ||||
| 42 | TFEQ‐R21 | Preop. | RYGB: 44·4 (34·1, 54·8)†¶¶ | n.a. | n.a. | RYGB: 31 of 31 (100) | ||
| DS: 50·0 (39·8, 60·2)†¶¶ | DS: 29 of 29 (100) | |||||||
| 12 | RYGB: 36·4 (26·1, 46·8)†¶¶ | RYGB: −8·00 (−22·04, 6·04)** | < 0·05 | n.a. | RYGB: 31 of 31 (100) | |||
| DS: 28·8 (18·1, 39·5)†¶¶ | DS: −21·20 (−35·34, −7·06)** | < 0·05 | DS: 29 of 29 (100) | |||||
| 24 | RYGB: 35·1 (25·2, 45·0)†¶¶ | RYGB: −9·30 (−23·04, 4·44)** | < 0·05 | 12 versus 24 months (RYGB): −1·3 (−15·0, 12·4)** | 0·853 | RYGB: 31 of 31 (100)## | ||
| DS: 32·5 (22·2, 42·9)†¶¶ | DS: −17·5 (−31·4, −3·6)** | < 0·05 | 12 versus 24 months (DS): 3·7 (−11·2, 18·6)** | DS: 29 of 29 (100)## | ||||
| 23 | TFEQ‐R18 | Preop. | 58·89 (33·15) | n.a. | n.a. | 12 of 14 (86) | ||
| 3 days | 61·11 (31·25) | 2·22 (−25·06, 29·50)** | > 0·05 | n.a. | 12 of 14 (86) | |||
| 2 | 37·04 (24·77) | −21·85 (−46·63, 2·93)** | > 0·05 | 3 days versus 2 months: −24·07 (−47·94, 3·15)** | 12 of 14 (86) | |||
| 12 | 37·37 (24·48) | −21·52 (−46·19, 3·152)** | > 0·05 | 2 versus 12 months: 0·33 (−20·52, 21·18)** | 12 of 14 (86) | |||
| 25 | TFEQ‐R18 | Preop. | 28·2(n.r.) | n.a. | n.a. | 180 of 180 (100)‡‡ | ||
| 12 | 17·2(n.r.) | < 0·001 | n.a. | 180 of 180 (100)‡‡ | ||||
| 27 | TFEQ‐R18 | Preop. | 56(6)‡ | n.a. | n.a. | 35 of 35 (100)‡‡ | ||
| 12 | 25(5)‡ | −51·0 (−66·3, −35·7)** | < 0·001 | n.a. | 35 of 35 (100)‡‡ | |||
| 26 | EES | Preop. | n.r. | n.a. | n.a. | 698 of 844 (82·7) | ||
| 12 | n.r. | Preop. versus 12 months: −21·4 (−23·7, −19·1) | < 0·01 | n.a. | 549 of 844 (65·0) | |||
| 24 | n.r. | Preop. versus 24 months: −20·1 (−22·7, −17·4) | < 0·01 | 12 versus 24 months: 2·0 (0·1, 3·9) | < 0·05 | 382 of 844 (45·3) | ||
| 36 | n.r. | Preop. versus 36 months: −21·4 (−25·3, −17·5) | < 0·01 | 12 versus 36 months: 4·9 (1·9, 8·0) | < 0·01 | 240 of 844 (28·4) | ||
| 24 versus 36 months: 0·2 (−2·3, 2·7) | > 0·05 | |||||||
| 28 | EES | Preop. | LAGB: 46·25(9·88) | n.a. | n.a. | LAGB: 27 of 30 (90) | ||
| RYGB: 43·14(12·43) | RYGB: 30 of 31 (97) | |||||||
| BPD: 46·76(10·01) | BPD: 26 of 30 (87) | |||||||
| 12 | LAGB: 1·30(1·03) | LAGB: −44·95 (−48·70, −41·20)** | n.a. | LAGB: 27 of 30 (90) | ||||
| RYGB: 0·75(0·73) | RYGB: −42·39 (−46·85, −37·93)** | RYGB: 30 of 31 (97) | ||||||
| BPD: 0·79(0·51) | BPD: −45·97 (−49·82, −42·12)** | BPD: 26 of 30 (87) | ||||||
| 39 | EES | Preop. | EES anger subscale: 13·9(10·3) | n.a. | n.a. | 32 of 32 (100) | ||
| EES anxiety subscale: 11·3(8·0) | ||||||||
| EES depression subscale: 8·9(5·3) | ||||||||
| 2 weeks | EES anger subscale: 5·3(8·4) | EES anger subscale: −8·60 (−13·2, −4·00)** | n.a. | 32 of 32 (100) | ||||
| EES anxiety subscale: 4·7(7·3) | EES anxiety subscale: −6·60 (−10·35, −2·85)** | |||||||
| EES depression subscale: 3·8(5·3) | EES depression subscale: −5·10 (−7·70, −2·50)** | |||||||
| 6 | EES anger subscale: 5·1(9·5) | EES anger subscale: −8·80 (−14·3, −3·31)** | EES anger subscale, 2 weeks versus 6 months: −0·20 (−5·28, 4·88) | 20 of 32 (63) | ||||
| EES anxiety subscale: 5·4(7·8) | EES anxiety subscale: −5·9 (−1·5, −10·3)** | EES anxiety subscale, 2 weeks versus 6 months: 0·70 (−3·55, 4·95) | ||||||
| EES depression subscale: 2·5(4·2) | EES depression subscale: −6·40 (−9·00, −3·80)** | EES depression subscale, 2 weeks versus 6 months: −1·30 (−3·90, 1·30) | ||||||
| 30 | EOQ | Preop. | 1·28(1·05) | n.a. | n.a. | 32 of 186 (17·2) | ||
| 6 | 0·83(0·88) | −0·45 (−0·92, 0·03)** | n.a. | 32 of 186 (17·2) | ||||
| 22 | Interview assessment by dietician††† | Preop. | < 3 months: 0% | n.a. | n.a. | < 3 months: 10*** | ||
| 3–6 months: 46·8%¶¶ | 3–6 months: 11*** | |||||||
| 6–12 months: 19·5%¶¶ | 6–12 months: 11*** | |||||||
| 1–2 years: 9·0%¶¶ | 1–2 years: 39*** | |||||||
| 2–3 years: 14·5%¶¶ | 2–3 years: 23*** | |||||||
| > 3 years: 6·0%¶¶ | > 3 years: 16*** | |||||||
| Postop. | < 3 months: 10%¶¶ | n.r. | n.a. | < 3 months: 10*** | ||||
| 3–6 months: 0%¶¶ | 3–6 months: 11*** | |||||||
| 6–12 months: 0%¶¶ | 6–12 months: 11*** | |||||||
| 1–2 years: 2·5%¶¶ | 1–2 years: 39*** | |||||||
| 2–3 years: 0%¶¶ | 2–3 years: 23*** | |||||||
| > 3 years: 12·4%¶¶ | > 3 years: 16*** | |||||||
*Values are mean(s.d.) unless indicated otherwise; values are †mean (95 per cent c.i.) and ‡mean(s.e.). §Values are mean difference (MD) (95 per cent c.i.) unless indicated otherwise; ¶values are mean (95 per cent c.i.). #Values in parentheses are percentages. **Data converted using Review Manager 5.3 from originally reported outcome data into standard deviation, MD and/or 95 per cent confidence intervals. ††Data received through personal email communication with author. ‡‡For purposes of analysis, retention rate assumed to be 100 per cent as the number of people excluded or loss to follow‐up was not reported explicitly; retention rate may be overestimated. §§Ambiguous interpretation of data from study; number of analysed participants may be either eight or nine. ¶¶Results converted electronically from a graphical to numerical format using PlotDigitizer. ##Two participants were lost to follow‐up at 24 months, but it was not mentioned which groups this occurred in, or numbers used for analysis. ***Study had a total of 23 dropouts/exclusions, but did not state in which groups these dropouts occurred; these patients were excluded from analysis. †††Interview assessment by dietician according to International Federation for the Surgery of Obesity and Metabolic Disorders (IFSO) European Accreditation Council for Bariatric Surgery (proportion classified as ‘emotional eaters’). GFCQ‐T, General Food Craving Questionnaire – Trait; n.a., not applicable; DEBQ, Dutch Eating Behaviour Questionnaire; RYGB, Roux‐en‐Y gastric bypass; LAGB, laparoscopic adjustable gastric band; SG, sleeve gastrectomy; TFEQ‐R21/R18, Three‐Factor Eating Questionnaire – Revised 21/18; n.r., not reported; DS, duodenal switch; EES, Emotional Eating Scale; BPD, biliopancreatic diversion; EOQ, Emotional Overeating Questionnaire.
Risk of bias
Using the NHLBI quality assessment tool 18 , four studies 28 , 37 , 40 , 41 were rated as good, 13 4 , 25 , 26 , 27 , 29 , 31 , 32 , 33 , 36 , 38 , 39 , 42 , 43 as fair, and six 22 , 23 , 24 , 30 , 34 , 35 as poor (Table 3 ). Many papers did not clearly define the study population, period of recruitment, specific inclusion or exclusion criteria, or ethnicity. The overall retention rate ranged from 2·3 to 100 per cent, with eight studies 24 , 26 , 30 , 31 , 32 , 34 , 35 , 39 reporting loss to follow‐up of more than 20 per cent of participants (Table 2 ). Six studies 4 , 25 , 27 , 38 , 42 , 43 did not report the number of participants lost or excluded from follow‐up.
Table 3.
Quality assessment of included studies according to the National Heart, Lung, and Blood Institute quality assessment tool for before–after (pre–post) studies with no control group
| Reference | 1 | 2 | 3 | 4 | 5 | 6 | 7 | 8 | 9 | 10 | 11 | 12 | Quality rating (of 11) |
|---|---|---|---|---|---|---|---|---|---|---|---|---|---|
| 34 | Y | N | Y | ? | ? | N | Y | ? | N | Y | N | n.a. | Poor (4) |
| 23 | Y | N | N | ? | ? | Y | Y | ? | Y | Y | N | n.a. | Poor (5) |
| 28 | N | Y | Y | N | ? | Y | Y | ? | Y | Y | N | n.a. | Good (6) |
| 39 | Y | N | N | ? | ? | Y | Y | ? | N | Y | N | n.a. | Fair (4) |
| 40 | Y | Y | N | ? | ? | N | Y | ? | Y | Y | N | n.a. | Good (5) |
| 41 | Y | Y | N | N | ? | Y | Y | ? | Y | Y | N | n.a. | Good (6) |
| 31 | Y | N | N | ? | ? | Y | Y | ? | Y | Y | N | n.a. | Fair (5) |
| 24 | Y | N | ? | N | ? | N | Y | ? | N | Y | N | n.a. | Poor (3) |
| 4 | Y | N | N | ? | Y | Y | Y | ? | Y | Y | N | n.a. | Fair (6) |
| 26 | Y | Y | Y | Y | ? | N | Y | ? | N | Y | N | n.a. | Fair (6) |
| 43 | Y | Y | N | ? | ? | N | Y | ? | ? | Y | N | n.a. | Fair (4) |
| 36 | Y | N | N | ? | ? | Y | Y | ? | Y | Y | N | n.a. | Fair (5) |
| 38 | Y | N | N | ? | ? | Y | Y | ? | ? | Y | N | n.a. | Fair (4) |
| 25 | Y | Y | Y | N | ? | Y | Y | ? | N | Y | N | n.a. | Fair (6) |
| 22 | Y | Y | Y | Y | ? | Y | N | ? | Y | N | N | n.a. | Poor (6) |
| 42 | Y | Y | N | ? | Y | Y | Y | N | Y | Y | N | n.a. | Fair (7) |
| 32 | N | N | Y | ? | ? | N | Y | ? | N | Y | N | n.a. | Fair (3) |
| 29 | Y | N | N | Y | ? | Y | Y | ? | Y | Y | N | n.a. | Fair (6) |
| 35 | Y | N | N | ? | ? | N | Y | ? | Y | Y | N | n.a. | Poor (4) |
| 37 | Y | Y | Y | N | ? | Y | Y | ? | Y | Y | N | n.a. | Good (7) |
| 30 | Y | N | Y | Y | ? | N | Y | ? | N | N | N | n.a. | Poor (4) |
| 33 | Y | Y | N | ? | ? | N | Y | ? | Y | Y | N | n.a. | Fair (5) |
| 27 | N | N | N | ? | ? | N | Y | ? | Y | Y | N | n.a. | Fair (3) |
| Total (of 23) | 20 | 10 | 8 | 4 | 2 | 13 | 22 | 0 | 14 | 21 | 0 | n.a. |
1. Was the study question or objective clearly stated?
2. Were eligibility/selection criteria for the study population prespecified and described clearly?
3. Were the participants in the study representative of those who would be eligible for the test/service/intervention in the general or clinical population of interest?
4. Were all eligible participants that met the prespecified entry criteria enrolled?
5. Was the sample size sufficiently large to provide confidence in the findings?
6. Was the test/service/intervention clearly described and delivered consistently across the study population?
7. Were the outcome measures prespecified, clearly defined, valid, reliable, and assessed consistently across all study participants?
8. Were the people assessing the outcomes blinded to the participants' exposures/interventions?
9. Was the loss to follow‐up after baseline 20 per cent or less? Were those lost to follow‐up accounted for in the analysis?
10. Did the statistical methods examine changes in outcome measures from before to after the intervention? Were statistical tests done that provided P values for the pre‐to‐post changes?
11. Were outcome measures of interest taken multiple times before the intervention and multiple times after the intervention (did they use an interrupted time‐series design)?
12. If the intervention was conducted at a group level (such as a whole hospital or community), did the statistical analysis take into account the use of individual‐level data to determine effects at the group level?
Y, yes; N, no; ?, not reported or cannot be determined; n.a., not applicable.
Changes in emotional eating after bariatric surgery
A summary of findings is presented in Table 2 . Most studies observed that emotional eating decreased in the first 3 months after RYGB 31 , 32 , 39 , VBG 43 , SG 32 and one anastomosis gastric bypass 32 , compared with preoperative scores. Changes were seen as early as 2 weeks after surgery 39 . Reduced postoperative emotional eating was reported also in studies with a 6–9‐month follow‐up 4 , 33 , 36 , 37 , 38 , 39 . Three studies 4 , 36 , 38 assessed emotional eating patterns using the DEBQ after approximately 20 per cent weight loss (which occurred 4–9 months after surgery), and reported significant decreases in emotional eating after RYGB, LAGB and SG. Eleven prospective cohort studies 25 , 26 , 27 , 28 , 31 , 34 , 37 , 40 , 41 , 42 , 43 including a range of surgical modalities such as VBG, RYGB, SG and LAGB showed a significant decrease in emotional eating at 12 months after surgery. Four studies showed no change in emotional eating within the first year, of which two 23 , 29 had small sample sizes of 12 or fewer participants, one 32 was the only study performed in Asia, and one 30 assessed emotional overeating rather than emotional eating.
Longer‐term studies tended to show mixed results beyond 12 months. Some 24 , 26 , 31 , 41 , 42 found that emotional eating at 15, 24 and 36 months was still significantly reduced compared with baseline, whereas one small study 35 of 14 patients did not see a significant reduction in emotional eating at 24 months after surgery. The only two studies 37 , 43 that examined VBG reported significant decreases in emotional eating at 3, 6 and 12 months that were no longer evident at 24 months 37 or 36 months 43 . Only one study 24 examined changes beyond 36 months and did not demonstrate significant changes in emotional eating at 48 months compared with before surgery. However, emotional eating scores at 48 months were available for only 112 (5·5 per cent) of 2028 participants with preoperative emotional eating assessments, implying significant risk of attrition bias for these results.
Longitudinal postoperative assessments of emotional eating
Twelve studies 22 , 23 , 24 , 26 , 29 , 31 , 32 , 37 , 39 , 41 , 42 , 43 assessed emotional eating at more than one postoperative time point. Generally, emotional eating scores did not significantly differ between any two time points within the first 12 months after surgery 23 , 29 , 31 , 32 , 37 , 39 , 43 . Some studies reported increases in emotional eating from 12 to 24 months 26 , 31 , 37 , 12 to 36 months 43 and 15 to 24 months 24 after operation, whereas two studies 41 , 42 did not. Longer‐term studies also showed mixed results. One study 24 found a significant increase in emotional eating from 24 to 36 months after RYGB, although this was not found in a study 26 involving patients undergoing RYGB and SG.
Synthesis of results
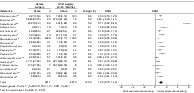
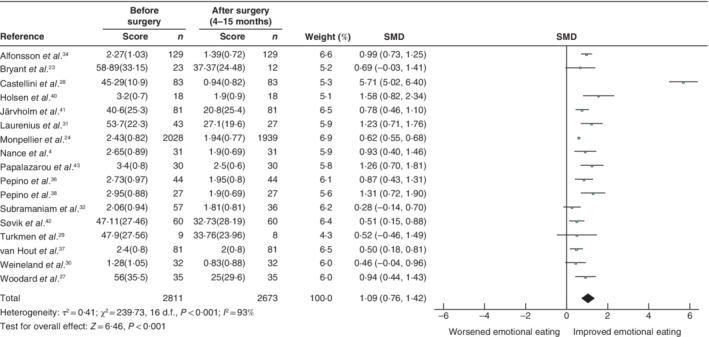
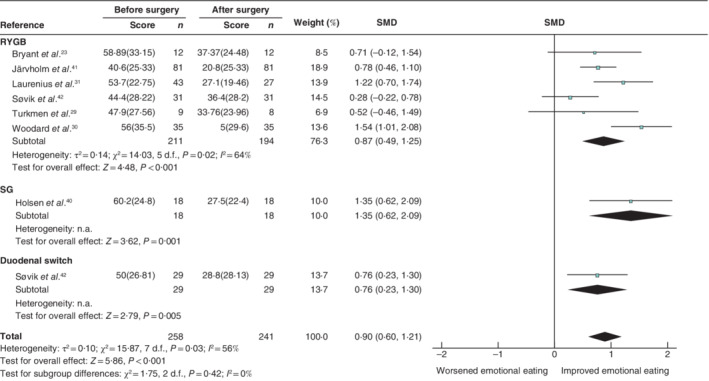
A meta‐analysis of 17 studies containing 2811 surgical participants showed that emotional eating improved after bariatric surgery by a SMD of 1·09 (95 per cent c.i. 0·76, 1·42), indicating a large effect size (Fig. 2 ). This effect remained consistent in sensitivity analyses following removal of studies consisting of non‐adult or women‐only cohorts, those in which emotional eating scores were not normally distributed, and fair and/or poor‐quality studies (Table 4 ). A moderate‐to‐large effect size was also seen in meta‐analyses involving only the revised TFEQ (SMD 0·90, 0·60 to 1·21; MD 24·65, 95 per cent c.i. 16·22 to 33·08 (score range 0–100)) (Figs 3 and 4 ), and DEBQ (SMD 0·74, 0·54 to 0·94; MD 0·63, 0·46 to 0·80 (score range: 0–5)) (Figs 5 and 6 ). Subgroup analysis by type of surgical intervention showed that emotional eating reductions were significant after RYGB, SG, duodenal switch, VBG and LAGB (Figs 3 , 4 , 5 , 6 ).
Fig. 2.
Forest plot of the effect of bariatric surgery on emotional eating Values are mean(s.d.). An inverse‐variance random‐effects model was used for meta‐analysis. Standardized mean differences (SMDs) are shown with 95 per cent confidence intervals.
Table 4.
Effect of sensitivity analysis on meta‐analysis
| Total no. of patients | |||||
|---|---|---|---|---|---|
| Outcome of interest | No. of studies | Before surgery | After surgery | SMD | I 2 (%) |
| Age | |||||
| Removal of studies with only age ≤ 18 years | 16 | 2730 | 2592 | 1·11 (0·76, 1·47) | 94 |
| Sex | |||||
| Removal of women‐only studies | 14 | 2745 | 2608 | 1·10 (0·73, 1·46) | 94 |
| Quality assessment | |||||
| Good quality studies only | 3 | 263 | 263 | 2·12 (0·34, 3·90) | 98 |
| Good and fair quality studies only | 13 | 599 | 561 | 1·24 (0·69, 1·80) | 94 |
| Questionnaire used | |||||
| TFEQ‐R18 | 2 | 58 | 47 | 0·86 (0·45, 1·27) | n.a. |
| TFEQ‐R21 | 5 | 211 | 194 | 0·85 (0·54, 1·16) | 47 |
| DEBQ | 8 | 2316 | 2206 | 0·81 (0·57, 1·04) | 68 |
| EES | 1 | 83 | 83 | 5·71 (5·02, 6·40) | n.a. |
| EOQ | 1 | 32 | 32 | 0·46 (−0·04, 0·96) | n.a. |
| GFCQ‐T | 1 | 129 | 129 | 0·99 (0·73, 1·25) | n.a. |
| One‐sample removed analysis | |||||
| Alfonsson et al. 34 | 16 | 2682 | 2544 | 1·10 (0·74, 1·47) | 94 |
| Bryant et al. 23 | 16 | 2788 | 2661 | 1·11 (0·77, 1·46) | 94 |
| Castellini et al. 28 | 16 | 2728 | 2590 | 0·79 (0·64, 0·94) | 59 |
| Holsen et al. 40 | 16 | 2793 | 2655 | 1·06 (0·72, 1·40) | 94 |
| Järvholm et al. 41 | 16 | 2730 | 2592 | 1·11 (0·76, 1·47) | 94 |
| Laurenius et al. 31 | 16 | 2768 | 2646 | 1·08 (0·74, 1·43) | 94 |
| Monpellier et al. 24 | 16 | 783 | 734 | 1·14 (0·70, 1·57) | 93 |
| Nance et al. 4 | 16 | 2780 | 2642 | 1·10 (0·75, 1·45) | 94 |
| Papalazarou et al. 43 | 16 | 2781 | 2643 | 1·08 (0·74, 1·42) | 94 |
| Pepino et al. 36 | 16 | 2767 | 2629 | 1·11 (0·76, 1·46) | 94 |
| Pepino et al. 38 | 16 | 2784 | 2646 | 1·08 (0·73, 1·42) | 94 |
| Subramaniam et al. 32 | 16 | 2754 | 2637 | 1·14 (0·80, 1·49) | 94 |
| Søvik et al. 42 | 16 | 2751 | 2613 | 1·13 (0·78, 1·49) | 94 |
| Turkmen et al. 29 | 16 | 2802 | 2665 | 1·12 (0·78, 1·46) | 94 |
| van Hout et al. 37 | 16 | 2730 | 2592 | 1·13 (0·77, 1·49) | 94 |
| Weineland et al. 30 | 16 | 2779 | 2641 | 1·13 (0·78, 1·48) | 94 |
| Woodard et al. 27 | 16 | 2776 | 2638 | 1·10 (0·75, 1·45) | 94 |
| Non‐normally distributed studies | |||||
| Removal of all studies where mean(3 s.d.) included negative values | 1 | 30 | 30 | 1·26 (0·70, 1·81) | n.a. |
Values in parentheses are 95 per cent confidence intervals. SMD, standardized mean difference; TFEQ‐R18/21, Three‐Factor Eating Questionnaire – Revised 18/21; n.a. not applicable; DEBQ, Dutch Eating Behaviour Questionnaire; EES, Emotional Eating Scale; EOQ, Emotional Overeating Questionnaire; GFCQ‐T, General Food Craving Questionnaire – Trait.
Fig. 3.
Forest plot of the effect of different types of bariatric surgery on emotional eating in studies using revised versions of the Three‐Factor Eating Questionnaire: standardized mean differences Values are mean(s.d.). An inverse‐variance random‐effects model was used for meta‐analysis. Standardized mean differences (SMDs) are shown with 95 per cent confidence intervals. RYGB, Roux‐en‐Y gastric bypass; SG, sleeve gastrectomy; n.a., not applicable.
Fig. 4.
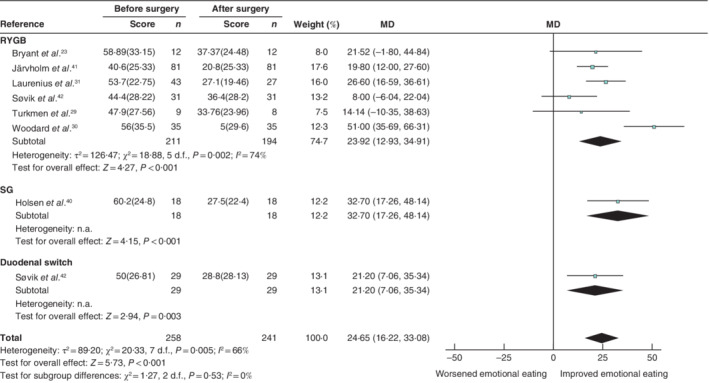
Forest plot of the effect of different types of bariatric surgery on emotional eating in studies using revised versions of the Three‐Factor Eating Questionnaire: mean differences Values are mean(s.d.). An inverse‐variance random‐effects model was used for meta‐analysis. Mean differences (MDs) are shown with 95 per cent confidence intervals. RYGB, Roux‐en‐Y gastric bypass; SG, sleeve gastrectomy; n.a., not applicable.
Fig. 5.
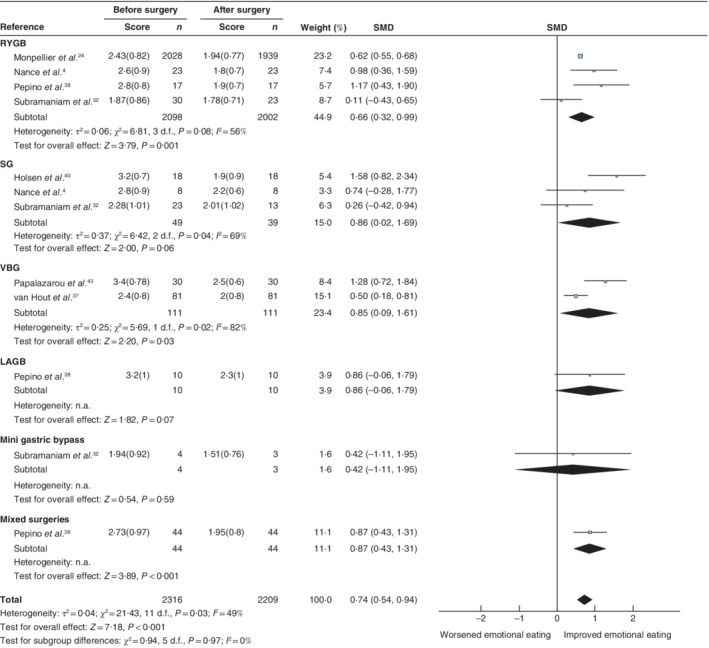
Forest plot of the effect of different types of bariatric surgery on emotional eating in studies using the Dutch Eating Behaviour Questionnaire: standardized mean differences Values are mean(s.d.). An inverse‐variance random‐effects model was used for meta‐analysis. Standardized mean differences (SMDs) are shown with 95 per cent confidence intervals. RYGB, Roux‐en‐Y gastric bypass; SG, sleeve gastrectomy; VBG, vertical banded gastroplasty; LAGB, laparoscopic adjustable gastric banding; n.a., not applicable.
Fig. 6.
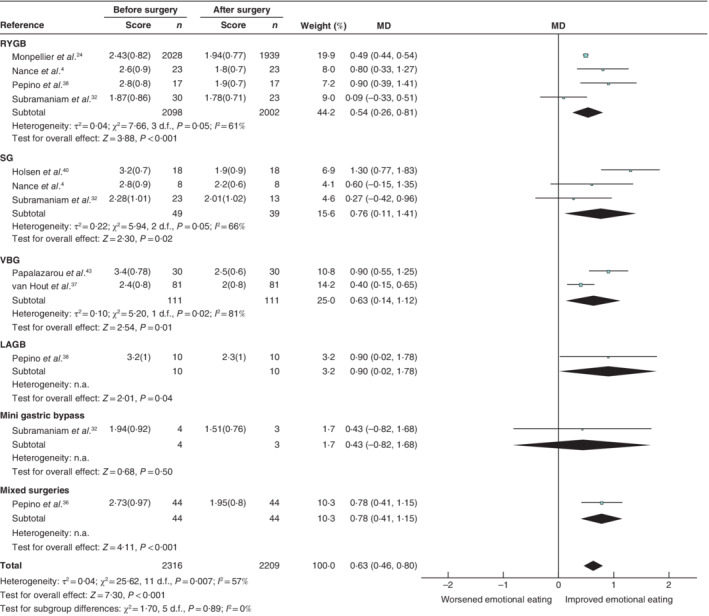
Forest plot of the effect of different types of bariatric surgery on emotional eating in studies using the Dutch Eating Behaviour Questionnaire: mean differences Values are mean(s.d.). An inverse‐variance random‐effects model was used for meta‐analysis. Mean differences (MDs) are shown with 95 per cent confidence intervals. RYGB, Roux‐en‐Y gastric bypass; SG, sleeve gastrectomy; VBG, vertical banded gastroplasty; LAGB, laparoscopic adjustable gastric banding; n.a., not applicable.
Included studies had high heterogeneity (I 2 = 93 per cent). Heterogeneity was moderate in sensitivity analyses that removed the study done by Castellini et al. 28 (SMD 0·79, 95 per cent c.i. 0·64 to 0·94; I 2 = 59 per cent) and which included studies using DEBQ only (SMD 0·81, 0·57 to 1·04; I 2 = 68 per cent) (Table 4 ). Heterogeneity was low if only studies using TFEQ‐R21 were included (SMD 0·85, 0·54 to 1·16; I 2 = 47 per cent) (Table 4 ). No publication bias was detected from visual examination of a funnel plot of all included studies (Fig. 7 ) and from Egger's test (P = 0·092).
Fig. 7.
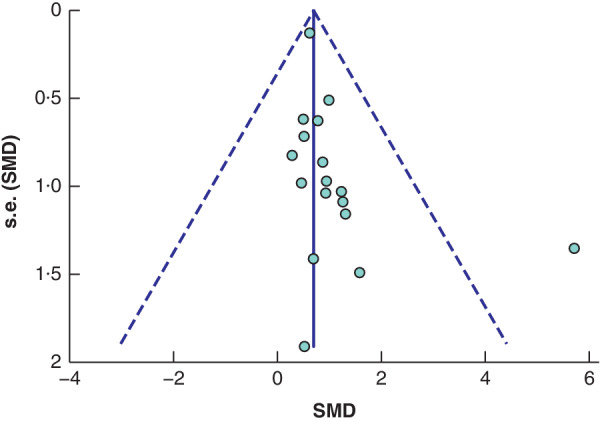
Funnel plot with pseudo 95 per cent confidence limits SMD, standardized mean difference.
Discussion
The main finding of this meta‐analysis of 17 studies was that emotional eating improved 4–18 months after bariatric surgery by a SMD of 1·09 (95 per cent c.i. 0·76 to 1·42). Qualitative analysis indicated an improvement in emotional eating in the first 12 months after bariatric surgery 25 , 26 , 27 , 28 , 31 , 34 , 37 , 39 , 40 , 41 , 42 , 43 , and mixed findings thereafter. The observation in longitudinal studies that early postoperative changes in emotional eating may not be sustained in the longer term are consistent with findings from cross‐sectional studies comparing patients at 24–68 months after LAGB with presurgical controls 48 and patients at 7 years post‐RYGB with control groups with obesity 49 , as well as with a 2016 systematic review by Opozda and colleagues 50 which examined preoperative and postoperative emotional eating patterns, mostly after RYGB.
There are several reasons why emotional eating behaviour may improve after bariatric surgery. In preparation for surgery and for the first few postoperative months, most patients will have received comprehensive nutritional and psychobehavioural evaluation, education and support, including strategies to modify eating behaviour. This may strengthen their efforts to avoid consuming food in response to emotions, which may wane over time 51 . Emotional eating typically involves a preference for highly palatable foods 52 , whereas after bariatric surgery avoidance of high‐fat/high‐sugar foods may occur as a learnt response to postprandial discomfort or dumping syndrome 53 , 54 . A conditioned avoidance might then override the desire to consume these foods. Longitudinal studies have found reduced activation of the medial frontal gyrus 55 , 56 , insula 55 , 56 and mesolimbic reward regions 5 , 57 , 58 in patients who had RYGB 55 , 58 and SG 1–6 months after surgery 57 . RYGB and SG are associated with changes in the release of several gut hormones, including increased postprandial release of glucagon‐like peptide 1 and peptide YY, with reduced circulating acyl‐ghrelin 59 , 60 , 61 . These changes contribute to alterations in neural activity 62 , but cannot fully account for the reported improvement in emotional eating, as this is also observed in patients who have LAGB but do not have these same postsurgical hormonal changes. Functional neuroimaging after LAGB demonstrates diminished activation of areas involved in food motivation and reward in response to images of food, and increased activity in areas involved in cognitive restraint 63 , 64 . Reduced food reward may also diminish the effectiveness of consuming palatable food as a coping mechanism during times of emotional distress. Several studies have reported that in the short to medium term after bariatric surgery, some patients experience improvements in the emotional states (low self‐esteem 39 , 65 , depressive 34 , 39 , 65 and anxiety 32 , 65 symptoms) that previously had led them to consume highly palatable foods.
Overall, this review is limited by a high number of poor‐ to fair‐quality studies, as well as high heterogeneity between studies. There was large variability between types of bariatric surgery used, methods of outcome assessment, and duration and timing of postoperative follow‐up. Further limitations common to many of the studies reviewed were their small sample size, short follow‐up and high attrition rates. Most had observational designs, which did not allow assessment of causal relationships with risks of confounding. Only three studies 4 , 36 , 38 considered weight loss as a confounder, assessing emotional eating after approximately 20 per cent weight loss. Few studies reported details of preoperative or postoperative management of participants, and whether this differed from standard practice. Where reported, there was wide variation in practice (weekly contact with a dietician to monitor bodyweight, review dietary intake, provide behavioural education and adjust recommended energy intake needed to achieve weight loss target 4 , 36 , 38 , preoperative education sessions 27 , advice from sports medicine specialists 32 , and psychological support 26 , 37 , 41 ). These differences are likely to affect eating behaviour, and are sources of further confounding. All studies used subjective self‐report questionnaires, which may be influenced by the requirement to recall negative emotions, food intake, and the association between the two, as well as socially desirable responses, whereby some participants may report changes in eating behaviour to reflect expectations of the clinicians 66 .
Despite the comprehensive search strategy, the present review may be subject to selective reporting bias. Emotional eating behaviours are often not the main study outcomes and may not have been mentioned in the title or abstract. The exclusion of non‐English‐language studies may also have introduced bias, as negative findings are more likely to be published in a local journal rather than an international English‐language journal 67 . Most study populations comprised middle‐aged Caucasian women, generally from westernized, industrialized countries (mainly in North America and Europe), and therefore cannot be generalized to other settings or underrepresented groups such as men, adolescents, older patients, or people with very high BMIs.
Supporting information
Appendix S1: Supporting Information
Acknowledgements
The authors thank Helen Baxter, clinical librarian at Austin Health, who helped to develop search strategies and performed computerized searches.
This work received no specific funding. E.I.E. was supported by research grants from the Sir Edward Weary Dunlop Medical Research Foundation. P.S. is supported by a David Bickart Clinical Research Fellowship from the University of Melbourne and an Investigator Grant from the National Health and Medical Research Council.
Disclosure: The authors declare no conflict of interest.
Funding information
No funding
References
- 1. Chang S‐H, Stoll CRT, Song J, Varela JE, Eagon CJ, Colditz GA. The effectiveness and risks of bariatric surgery: an updated systematic review and meta‐analysis, 2003‐2012. JAMA Surg 2014; 149: 275–287. [DOI] [PMC free article] [PubMed] [Google Scholar]
- 2. Anderson JW, Konz EC, Frederich RC, Wood CL. Long‐term weight‐loss maintenance: a meta‐analysis of US studies. Am J Clin Nutr 2001; 74: 579–584. [DOI] [PubMed] [Google Scholar]
- 3. Bessesen DH , Van Gaal LF. Progress and challenges in anti‐obesity pharmacotherapy. Lancet Diabetes Endocrinol 2018; 6: 237–248. [DOI] [PubMed] [Google Scholar]
- 4. Nance K, Eagon JC, Klein S, Pepino MY. Effects of sleeve gastrectomy vs . Roux‐en‐Y gastric bypass on eating behavior and sweet taste perception in subjects with obesity. Nutrients 2018; 10: 18. [DOI] [PMC free article] [PubMed] [Google Scholar]
- 5. Ochner CN, Kwok Y, Conceição E, Pantazatos SP, Puma LM, Carnell S et al Selective reduction in neural responses to high calorie foods following gastric bypass surgery. Ann Surg 2011; 253: 502–507. [DOI] [PMC free article] [PubMed] [Google Scholar]
- 6. Gibson EL. The psychobiology of comfort eating: implications for neuropharmacological interventions. Behav Pharmacol 2012; 23: 442–460. [DOI] [PubMed] [Google Scholar]
- 7. Crowley NM, LePage ML, Goldman RL, O'Neil PM, Borckardt JJ, Byrne TK. The Food Craving Questionnaire – Trait in a bariatric surgery seeking population and ability to predict post‐surgery weight loss at six months. Eat Behav 2012; 13: 366–370. [DOI] [PubMed] [Google Scholar]
- 8. Wiedemann AA, Ivezaj V, Grilo CM. An examination of emotional and loss‐of‐control eating after sleeve gastrectomy surgery. Eat Behav 2018; 31: 48–52. [DOI] [PMC free article] [PubMed] [Google Scholar]
- 9. Masheb RM, Grilo CM. Emotional overeating and its associations with eating disorder psychopathology among overweight patients with binge eating disorder. Int J Eat Disord 2006; 39: 141–146. [DOI] [PubMed] [Google Scholar]
- 10. Patel KA, Schlundt DG. Impact of moods and social context on eating behavior. Appetite 2001; 36: 111–118. [DOI] [PubMed] [Google Scholar]
- 11. Schneider KL, Appelhans BM, Whited MC, Oleski J, Pagoto SL. Trait anxiety, but not trait anger, predisposes obese individuals to emotional eating. Appetite 2010; 55: 701–706. [DOI] [PMC free article] [PubMed] [Google Scholar]
- 12. Chua JL, Touyz S, Hill AJ. Negative mood‐induced overeating in obese binge eaters: an experimental study. Int J Obes 2004; 28: 606–610. [DOI] [PubMed] [Google Scholar]
- 13. Wedin S, Madan A, Correll J, Crowley N, Malcolm R, Byrne TK, et al Emotional eating, marital status and history of physical abuse predict 2‐year weight loss in weight loss surgery patients. Eat Behav 2014; 15: 619–624. [DOI] [PubMed] [Google Scholar]
- 14. Moher D, Liberati A, Tetzlaff J, Altman DG. Preferred reporting items for systematic reviews and meta‐analyses: the PRISMA statement. PLoS Med 2009; 339: b2535. [DOI] [PMC free article] [PubMed] [Google Scholar]
- 15. Stroup DF, Berlin JA, Morton SC, Olkin I, Williamson GD, Rennie D et al Meta‐analysis of observational studies in epidemiology: a proposal for reporting. Meta‐analysis of Observational Studies in Epidemiology (MOOSE) group. JAMA 2000; 283: 2008–2012. [DOI] [PubMed] [Google Scholar]
- 16. Ouzzani M, Hammady H, Fedorowicz Z, Elmagarmid A. Rayyan – a web and mobile app for systematic reviews. Syst Rev 2016; 5: 210. [DOI] [PMC free article] [PubMed] [Google Scholar]
- 17.SourceForge. Plot Digitizer https://sourceforge.net/projects/plotdigitizer/ [accessed 16 March 2019].
- 18.National Heart, Lung and Blood Institute. Quality Assessment Tool for Observational Cohort and Cross‐Sectional Studies https://www.nhlbi.nih.gov/health‐topics/study‐quality‐assessment‐tools [accessed 11 September 2019].
- 19. The Cochrane Collaboration . Review Manager (RevMan). The Nordic Cochrane Centre: Copenhagen, 2014. [Google Scholar]
- 20. Cohen J. Statistical Power Analysis for the Behavioral Sciences. Routledge: New York, 2013. [Google Scholar]
- 21. Higgins JPT, Thompson SG, Deeks JJ, Altman DG. Measuring inconsistency in meta‐analyses. BMJ 2003; 327: 557–560. [DOI] [PMC free article] [PubMed] [Google Scholar]
- 22. Sioka E, Tzovaras G, Oikonomou K, Katsogridaki G, Zachari E, Papamargaritis D et al Influence of eating profile on the outcome of laparoscopic sleeve gastrectomy. Obes Surg 2013; 23: 501–508. [DOI] [PubMed] [Google Scholar]
- 23. Bryant EJ, King NA, Falkén Y, Hellström PM, Holst JJ, Blundell JE et al Relationships among tonic and episodic aspects of motivation to eat, gut peptides, and weight before and after bariatric surgery. Surg Obes Relat Dis 2012; 9: 802–808. [DOI] [PubMed] [Google Scholar]
- 24. Monpellier VM, Janssen IMC, Antoniou EE, Jansen ATM. Weight change after Roux‐en‐Y gastric bypass, physical activity and eating style: is there a relationship? J Obes Surg 2019; 29: 526–533. [DOI] [PubMed] [Google Scholar]
- 25. Petereit R, Jonaitis L, Kupcinskas L, Maleckas A. Gastrointestinal symptoms and eating behavior among morbidly obese patients undergoing Roux‐en‐Y gastric bypass. J Med 2014; 50: 118–123. [DOI] [PubMed] [Google Scholar]
- 26. Nasirzadeh Y, Kantarovich K, Wnuk S, Okrainec A, Cassin SE, Hawa R et al Binge eating, loss of control over eating, emotional eating, and night eating after bariatric surgery: results from the Toronto Bari‐PSYCH Cohort Study. Obes Surg 2018; 28: 2032–2039. [DOI] [PubMed] [Google Scholar]
- 27. Woodard GA, Encarnacion B, Peraza J, Hernandez‐Boussard T, Morton J. Halo effect for bariatric surgery: collateral weight loss in patients' family members. J Arch Surg 2011; 146: 1185–1190. [DOI] [PubMed] [Google Scholar]
- 28. Castellini G, Godini L, Amedei SG, Faravelli C, Lucchese M, Ricca V. Psychological effects and outcome predictors of three bariatric surgery interventions: a 1‐year follow‐up study. Eat Weight Disord 2009; 19: 217–224. [DOI] [PubMed] [Google Scholar]
- 29. Turkmen S, Andreen L, Cengiz Y. Effects of Roux‐en‐Y gastric bypass surgery on eating behaviour and allopregnanolone levels in obese women with polycystic ovary syndrome. J Gynecol Endocrinol 2015; 31: 301–305. [DOI] [PubMed] [Google Scholar]
- 30. Weineland S, Brogie M, Dahl J. Do experiential avoidance and emotional eating habits predict outcomes of bariatric surgery at a 2 years follow‐up? A short report. Int J Behav Consult Ther 2015; 9: 29–31. [Google Scholar]
- 31. Laurenius A, Larsson I, Bueter M, Melanson KJ, Bosaeus I, Forslund HB et al Changes in eating behaviour and meal pattern following Roux‐en‐Y gastric bypass. Int J Obes (Lond) 2012; 36: 348–355. [DOI] [PubMed] [Google Scholar]
- 32. Subramaniam K, Low W‐Y, Lau P‐C, Chin K‐F, Chinna K, Kosai NR et al Eating behaviour predicts weight loss six months after bariatric surgery: a longitudinal study. J Nutr 2018; 10: 1616. [DOI] [PMC free article] [PubMed] [Google Scholar]
- 33. Willmer M, Berglind D, Tynelius P, Ghaderi A, Naslund E, Rasmussen F. Changes in eating behaviour and food choices in families where the mother undergoes gastric bypass surgery for obesity. Eur J Clin Nutr 2015; 70: 35–40. [DOI] [PubMed] [Google Scholar]
- 34. Alfonsson S, Sundbom M, Ghaderi A. Is age a better predictor of weight loss one year after gastric bypass than symptoms of disordered eating, depression, adult ADHD and alcohol consumption? Eat Behav 2014; 15: 644–647. [DOI] [PubMed] [Google Scholar]
- 35. van der Zwaal EM, de Weijer BA, van de Giessen EM, Janssen I, Berends FJ, van de Laar A et al Striatal dopamine D2/3 receptor availability increases after long‐term bariatric surgery‐induced weight loss. Eur Neuropsychopharmacol 2016; 26: 1190–1200. [DOI] [PubMed] [Google Scholar]
- 36. Pepino MY, Stein RI, Eagon JC, Klein S. Bariatric surgery‐induced weight loss causes remission of food addiction in extreme obesity. J Obes 2014; 22: 1792–1798. [DOI] [PMC free article] [PubMed] [Google Scholar]
- 37. van Hout GC, Jakimowicz JJ, Fortuin FA, Pelle AJ, van Heck GL. Weight loss and eating behavior following vertical banded gastroplasty. Obes Surg 2007; 17: 1226–1234. [DOI] [PMC free article] [PubMed] [Google Scholar]
- 38. Pepino MY, Bradley D, Eagon J, Sullivan S, Abumrad NA, Klein S. Changes in taste perception and eating behavior after bariatric surgery‐induced weight loss in women. Obesity 2014; 22: E13–E20. [DOI] [PMC free article] [PubMed] [Google Scholar]
- 39. Dymek MP, le Grange D, Neven K, Alverdy J. Quality of life and psychosocial adjustment in patients after Roux‐en‐Y gastric report bypass: a brief report. Obes Surg 2001; 11: 32–39. [DOI] [PubMed] [Google Scholar]
- 40. Holsen LM, Davidson P, Cerit H, Hye T, Moondra P, Haimovici F et al Neural predictors of 12‐month weight loss outcomes following bariatric surgery. Int J Obes (Lond) 2012; 42: 785–793. [DOI] [PMC free article] [PubMed] [Google Scholar]
- 41. Järvholm K, Olbers T, Peltonen M, Marcus C, Dahlgren J, Flodmark C‐E et al Binge eating and other eating‐related problems in adolescents undergoing gastric bypass: results from a Swedish nationwide study (AMOS). Appetite 2018; 127: 349–355. [DOI] [PubMed] [Google Scholar]
- 42. Søvik TT, Karlsson J, Aasheim ET, Fagerland MW, Björkman S, Engström M et al Gastrointestinal function and eating behavior after gastric bypass and duodenal switch. J Surg Obes Relat Dis 2013; 9: 641–647. [DOI] [PubMed] [Google Scholar]
- 43. Papalazarou A, Yannakoulia M, Kavouras SA, Komesidou V, Dimitriadis G, Papakonstantinou A et al Lifestyle intervention favorably affects weight loss and maintenance following obesity surgery. Obesity (Silver Spring) 2010; 18: 1348–1353. [DOI] [PubMed] [Google Scholar]
- 44. van Strien T, Frijters JER, Bergers GPA, Defares PB. The Dutch Eating Behavior Questionnaire (DEBQ) for assessment of restrained, emotional, and external eating behavior. Int J Eat Disord 1986; 5: 295–315. [Google Scholar]
- 45. Tholin S, Rasmussen F, Tynelius P, Karlsson J. Genetic and environmental influences on eating behavior: the Swedish Young Male Twins Study. Am J Clin Nutr 2005; 81: 564–569. [DOI] [PubMed] [Google Scholar]
- 46. Karlsson J, Persson LO, Sjostrom L, Sullivan M. Psychometric properties and factor structure of the Three‐Factor Eating Questionnaire (TFEQ) in obese men and women. Results from the Swedish Obese Subjects (SOS) study. Int J Obes Relat Metab Disord 2000; 24: 1715–1725. [DOI] [PubMed] [Google Scholar]
- 47. Stunkard AJ, Messick S. The Three‐Factor Eating Questionnaire to measure dietary restraint, disinhibition and hunger. J Psychosom Res 1985; 29: 71–83. [DOI] [PubMed] [Google Scholar]
- 48. Larsen JK, van Ramshorst B, Geenen R, Brand N, Stroebe W, van Doornen LJP. Binge eating and its relationship to outcome after laparoscopic adjustable gastric banding. Obes Surg 2004; 14: 1111–1117. [DOI] [PubMed] [Google Scholar]
- 49. Vangoitsenhoven R, Frederiks P, Gijbels B, Lannoo M, Van der Borght W, Van den Eynde A et al Long‐term effects of gastric bypass surgery on psychosocial well‐being and eating behavior: not all that glitters is gold. Acta Clin Belg 2016; 71: 395–402. [DOI] [PubMed] [Google Scholar]
- 50. Opozda M, Chur‐Hansen A, Wittert G. Changes in problematic and disordered eating after gastric bypass, adjustable gastric banding and vertical sleeve gastrectomy: a systematic review of pre–post studies. Obes Rev 2016; 17: 770–792. [DOI] [PubMed] [Google Scholar]
- 51. Ostovan MA, Zibaeenezhad MJ, Keshmiri H, Shekarforoush S. The impact of education on weight loss in overweight and obese adults. Int Cardiovasc Res J 2013; 7: 79–82. [PMC free article] [PubMed] [Google Scholar]
- 52. O'Connor DB, Jones F, Conner M, McMillan B, Ferguson E. Effects of daily hassles and eating style on eating behavior. Health Psychol 2008; 27: S20–S31. [DOI] [PubMed] [Google Scholar]
- 53. Elliot K. Nutritional considerations after bariatric surgery. Crit Care Nurs Quart 2003; 26: 133–138. [DOI] [PubMed] [Google Scholar]
- 54. Tack J, Arts J, Caenepeel P, De Wulf D, Bisschops R. Pathophysiology, diagnosis and management of postoperative dumping syndrome. Nat Rev Gastroenterol Hepatol 2009; 6: 583–590. [DOI] [PubMed] [Google Scholar]
- 55. Ochner CN, Laferrere B, Afifi L, Atalayer D, Geliebter A, Teixeira J. Neural responsivity to food cues in fasted and fed states pre and post gastric bypass surgery. Neurosci Res 2012; 74: 138–143. [DOI] [PMC free article] [PubMed] [Google Scholar]
- 56. Bruce JM, Hancock L, Bruce A, Lepping RJ, Martin L, Lundgren JD et al Changes in brain activation to food pictures after adjustable gastric banding. Surg Obes Relat Dis 2012; 8: 602–608. [DOI] [PubMed] [Google Scholar]
- 57. Faulconbridge LF, Ruparel K, Loughead J, Allison KC, Hesson LA, Fabricatore AN et al Changes in neural responsivity to highly palatable foods following Roux‐en‐Y gastric bypass, sleeve gastrectomy, or weight stability: an fMRI study. Obesity (Silver Spring) 2016; 24: 1054–1060. [DOI] [PMC free article] [PubMed] [Google Scholar]
- 58. Ochner CN, Stice E, Hutchins E, Afifi L, Geliebter A, Hirsch J et al Relation between changes in neural responsivity and reductions in desire to eat high‐calorie foods following gastric bypass surgery. Neuroscience 2012; 209: 128–135. [DOI] [PMC free article] [PubMed] [Google Scholar]
- 59. Morínigo R, Moizé V, Musri M, Lacy AM, Navarro S, Marín JL et al Glucagon‐like peptide‐1, peptide YY, hunger, and satiety after gastric bypass surgery in morbidly obese subjects. J Clin Endocrinol Metabol 2006; 91: 1735–1740. [DOI] [PubMed] [Google Scholar]
- 60. Yousseif A, Emmanuel J, Karra E, Millet Q, Elkalaawy M, Jenkinson AD et al Differential effects of laparoscopic sleeve gastrectomy and laparoscopic gastric bypass on appetite, circulating acyl‐ghrelin, peptide YY3‐36 and active GLP‐1 levels in non‐diabetic humans. Obes Surg 2014; 24: 241–252. [DOI] [PMC free article] [PubMed] [Google Scholar]
- 61. Dirksen C, Jørgensen NB, Bojsen‐Møller KN, Kielgast U, Jacobsen SH, Clausen TR et al Gut hormones, early dumping and resting energy expenditure in patients with good and poor weight loss response after Roux‐en‐Y gastric bypass. Int J Obes (Lond) 2013; 37: 1452–1459. [DOI] [PubMed] [Google Scholar]
- 62. Goldstone AP, Miras AD, Scholtz S, Jackson S, Neff KJ, Pénicaud L et al Link between increased satiety gut hormones and reduced food reward after gastric bypass surgery for obesity. J Clin Endocrinol Metabol 2016; 101: 599–609. [DOI] [PMC free article] [PubMed] [Google Scholar]
- 63. Bruce AS, Bruce JM, Ness AR, Lepping RJ, Malley S, Hancock L et al A comparison of functional brain changes associated with surgical versus behavioral weight loss. Obesity (Silver Spring) 2014; 22: 337–343. [DOI] [PMC free article] [PubMed] [Google Scholar]
- 64. Bruce JM, Hancock L, Bruce A, Lepping RJ, Martin L, Lundgren JD et al Changes in brain activation to food pictures after adjustable gastric banding. Surg Obes Relat Dis 2012; 8: 602–608. [DOI] [PubMed] [Google Scholar]
- 65. Gill H, Kang S, Lee Y, Rosenblat JD, Brietzke E, Zuckerman H et al The long‐term effect of bariatric surgery on depression and anxiety. J Affect Disord 2019; 246: 886–894. [DOI] [PubMed] [Google Scholar]
- 66. Allison DB, Heshka S. Social desirability and response bias in self‐reports of ‘emotional eating’. Eat Disord 1993; 1: 31–38. [Google Scholar]
- 67. Egger M, Zellweger‐Zahner T, Schneider M, Junker C, Lengeler C, Antes G. Language bias in randomised controlled trials published in English and German. Lancet 1997; 350: 326–329. [DOI] [PubMed] [Google Scholar]
Associated Data
This section collects any data citations, data availability statements, or supplementary materials included in this article.
Supplementary Materials
Appendix S1: Supporting Information