

Acute promyelocytic leukemia (APL) is an uncommon cancer, comprising approximately 10% of acute myeloid leukemia (AML) with annual incidence of approximately 1500 cases in the United States (U.S.) [1]. Increased APL incidence has been observed in ulcerative colitis patients [2], patients on bimolane [3], the overweight and obese [4], electricians [5], and shoemakers [6]. Although the PML-RARα rearrangement is well studied, the mechanism of initiation of malignancy is still unknown. Cancer cluster investigations may provide the opportunity to further understand disease etiology. The National Cancer Institute (NCI) and the Centers for Disease Control and Prevention (CDC) define a cancer cluster as a greater than expected number of cancer cases occurring within a group of people in a geographic region over a specific time period (https://www.cdc.gov/nceh/clusters/default.htm, accessed December 22, 2019), (https://www.cancer.gov/about-cancer/causes-prevention/risk/substances/cancer-clusters-fact-sheet, accessed December 22, 2019).
There are few APL clusters reported in the literature. A cluster of 9 children at a Children’s Hospital in Cape Town, South Africa, including 7 who resided in Eastern Cape presented with APL from January 1, 1981 to December 31, 1985. Out of all 134 admitted leukemias including APL, 50 patients (37%) were from Eastern Cape (p < 0.05)[7]. Three patients were consecutively diagnosed with classical PML-RARα APL in a span of 4 months in the United Kingdom (U.K.) at Russells Hall Hospital, which is higher than the expected single annual case of APL per population of 400,000 and incidence of 149 cases per 77 million subject-years. Interestingly all three patients had come into contact with one another years before their presentations. [8].
Three cases of treatment-related APL (t-APL) were reported in a cohort of non-small cell lung cancer (NSCLC) patients who received gefinitib therapy from November 2001 to December 2004 at a single institution in Okayama prefecture, Japan. The incidence rate ratio between cohort crude incidence rate of APL and crude incidence rate of all leukemias was significantly high at 639.9 (95% CI: 131.6–1878.9, p < 0.0001)[9]. Two clusters of 5 (p = 0.019) and one cluster of 6 (p = 0.005) cases of APL per month occurred in hospitals across Massachusetts, events which are highly unlikely to occur by chance alone assuming Poisson distribution with average event rate of 1.6 cases per month[10]. Although no definitive etiological agents were identified, observed clusters of APL have exceeded statistical expectations and are a promising field of study.
We noted similar clustered incidences of APL of 4 to 5 cases per month admitted to the adult hematology services of two major tertiary referral hospitals, University of Maryland Medical Center (UMMC) and Johns Hopkins Hospital (JHH), which serve the greater Baltimore area extending across Maryland and its border states. Clinical and epidemiological data were reviewed for each cluster in order to determine possible shared medical and environmental factors.
Patients age 18 years or older with newly diagnosed APL were included in an institution review board-approved de-identified database. APL was defined by molecular and/or cytogenetic confirmation of the PML-RARα fusion gene. Patients (n = 228) who were admitted to UMMC or JHH from January 2000 to September 2018 (225 months) residing in zip codes within a 150-mile radius were included. Patients with zip codes outside of this radius (California, Illinois, Canada, etc.) and those without zip codes were excluded. APL is mostly treated at tertiary centers such as UMMC and JHH at first encounter or through referral systems from community hospitals and oncologists. The 150-mile radius encapsulates the majority of the catchment area and local referral base around the tertiary centers in Baltimore. Patient zip codes were plotted through BatchGeo (https://batchgeo.com/, accessed December 23, 2019).
The admission date was utilized to define expected APL incidence rate as total number of cases divided by interval time (1-month intervals). Using population-based data from the National Cancer Institute Surveillance, Epidemiology, and End Results (SEER) 18 Registries database, November 2018 submission and SEER*Stat version 8.3.6, we calculated the crude and age-adjusted incidence rates for APL (record 9866) for patients age 15 years and older between 2000 – 2016 [11]. These rates include non-adult patients age 15 to 17 years as SEER groups 15–19 year old patients together. The age-adjusted incidence rate and 2010 U.S. Census Zip Code Tabulation Area (ZTCA) population total of cohort zip codes were utilized to estimate the expected incident case rate (https://factfinder.census.gov/faces/tableservices/jsf/pages/productview.xhtml?pid=DEC_10_SF1_P1&prodType=table, accessed January 14, 2020). To test for clustering of cases over time, we assumed that the cases would present over time with a Poisson probability distribution. Using this assumption, we compared the expected cases (from the Poisson distribution) with the observed cases presenting each month using a chi-square goodness of fit analysis. One-way analysis of variance (ANOVA) was used to calculate differences between incidence means per season, defined as spring (March, April, May), summer (June, July, August), fall (September, October, November), and winter (December, January, February).
The crude and age-adjusted incidence rates for APL from 2000 to 2016 calculated using the SEER 18 Registries November 2018 submission dataset were both 0.38 cases per 100,000 person-years. Utilizing the 2010 U.S. Census ZTCA population of 3,812,510 for our cohort with the SEER 18 age-adjusted incidence rate of 0.38 cases per 100,000, 14.6 cases per year and 1.22 cases per month were predicted in our 150-mile radius. The average event rate for our 228 patients between both institutions from January 2000 and September 2018 was slightly lower than predicted, at 12.1 cases per year or 1.01 cases per month. Assuming a Poisson distribution, λ = 228/225 = 1.01, the expected probabilities of 0, 1, 2, 3, 4, ≥5 incident cases of APL per month are 36.3%, 36.8%, 18.6%, 6.30%, 1.59%, 0.32% respectively. The expected/observed number of cases per category were 81.7/95 for 0 case/month, 82.8/76 for 1 case/month, 41.9/32 for 2 cases/month, 14.2/13 for 3 cases/month, 3.6/11 for 4 cases/month, and 0.73/1 for 5 cases/month. A chi-square goodness of fit comparing the expected and observed numbers showed that the distribution departed significantly from a Poisson distribution; X2 (4) = 20.6, p < 0.001. This is primarily because there were 11 clusters of 4 incident cases of APL per month, which is unlikely to occur by chance alone. As such, 12 clusters were identified, 11 of which were 4 cases/month and 1 of which was 5 cases/month (Figure 1A). Conversely, there were far more months with 0 cases than expected.
Fig. 1. A).
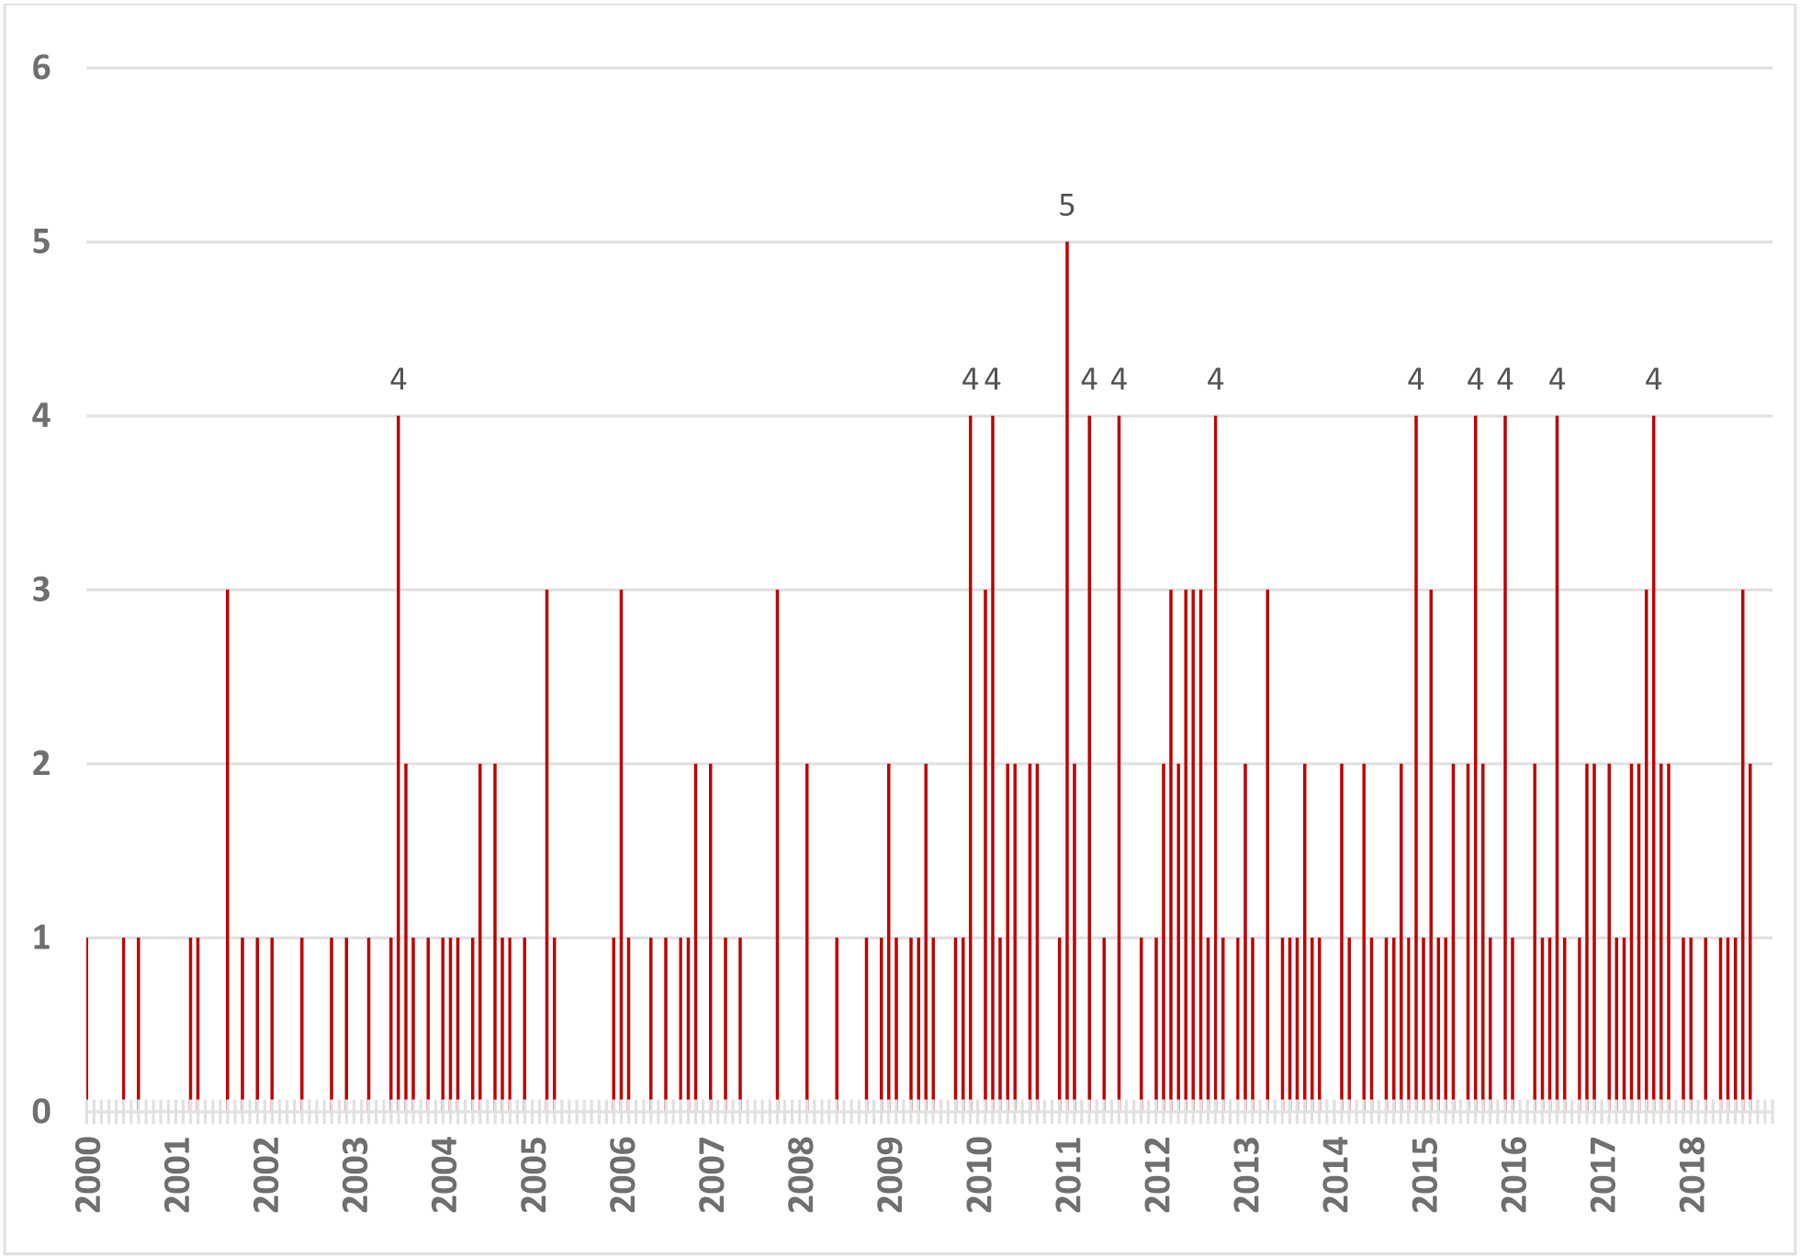
Adult APL incidence in Maryland and surrounding regions from January 2000 to September 2018. Clustered incidences of July 2003, December 2009, March 2010, January 2011, April 2011, August 2011, September 2012, December 2014, August 2015, December 2015, July 2016, and August 2017 are labeled with respective number of cases per month.
Of the 228 patients included this study, 102 were men and 126 were women. The mean age was 49 years. The patients were 62.9% Caucasian, 25.2% African American, 6.7% Hispanic, 4.8% Asian Pacific American, and 0.4% Middle Eastern. Stratified by Sanz Score, 25.3% were low risk (LR), 45.3% were intermediate risk (IR), and 29.3% were high risk (HR). Differentiation syndrome (DS) occurred in 37.2% of patients. All-cause mortality within the study period was 19.9%. These figures were similar to those of our cluster subset (i.e., patients presenting in months with 4 or more patients), which consisted of 26 women, 23 men, average age of 51 years, 61.0% Caucasian, 29.3% African American, 7.3% Hispanic, 2.4% Asian, 28.6% LR, 49.0% IR, 22.4% HR, 42.6% DS, 16.3% mortality. The majority of clustered patients had classic karyotypes of t(15;17)(q24;q21), with few variants. Mutations were few and included FLT3-ITD (n = 6), FLT3-D835 (n = 4), ASXL1 (n = 1), and DNMT3A (n = 1) (Table 1). No correlation between clustered APL incidence and zip code was found (Figure 1B).
Table 1.
Demographic and clinical data of 49 clustered cases, in 12 clusters of APL from January 2000 to September 2018.
| APL Cluster | Age | Gender | Ethnicity | ABO | Risk | DS | Death | Karyotype | Mutations |
|---|---|---|---|---|---|---|---|---|---|
| July 2003 |
52 | Male (2), Female (2) | White (3), Black (1) | A+ (2), O+ (2) | IR (3), HR (1) | Yes (2), No (2) | Yes (3), No (1) | 46,XX,t(15;17)(q22;q11.2)›13!/46,XX›7! t (15;17) – FISH only 46,XY,t(15;17)(q22;q11.2)›6!/46,XY,add(7)(q?34),t(15;17)(q22;q11.2)›14 45,X,−Y,t(15;17)(q22;q11.2)›19!/46,XY›1! |
|
| December 2009 |
44 | Male (1), Female (3) | White (1), Black (1), Hispanic (1), Asian (1) | B+ (1), O+ (1), O− (1), AB+ (1) | LR (1), IR (2) | Yes (1), No (2) | Yes (1), No (2) | 46,XY,t(15;17)(q22;q11.2)[20] 45,XX,der(7;13)(p10;q10),t(15;17)(q22;q11.2)[5]/46,XX[35] 46,XX,t(15;17)(q22;q21) |
|
| March 2010 |
54 | Male (2), Female (2) | White (4) | A+ (2), O+ (1), O− (1) | IR (2), HR (2) | Yes (1), No (3) | No (2) | 47,XY,+8,t(15;17)(q22;q21) 46,XY,t(15;17)(q22;q21) 46,XX,t(15;17)(q22;q21) 46,XX,add(13)(q34),add(15)(q26), add(17)(q11.2)[16]/46,XX[4] |
FLT3-ITD (2), FLT3-D835 (1) |
| January 2011 |
48 | Male (2), Female (3) | White (2), Black (3) | B+ (2), O+ (2), O− (1) | LR (1), IR (4) | Yes (3), No (2) | No (4) | 46,XY,t(15;17)(q22;q21)[17] t(15;17) – FISH only 46,XX,t(15;17)(q24;q21) 46,XX,t(15;17)(q24;q21) |
|
| April 2011 |
55 | Male (2), Female (2) | White (3), Hispanic (1) | A+ (1), O+ (2), O− (1) | LR (3), IR (1) | Yes (1), No (3) | No (4) | 46,XY,t(15;17)(q24;q21)[19]/46,XY[1] 46,XX,t(15;17)(q24;q21) 46,XY,t(15;17)(q24;q21)[4]/46,XY[17] 47,XX,+8,t(15;17)(q24;q21)[18]/46,XX[2] |
FLT3-D835 (2) |
| August 2011 |
68 | Male (3), Female (1) | White (2), Unknown (2) | O+ (3), O− (1) | LR (2), IR (1), HR (1) | Yes (2), No (2) | No (3) | 46,XY,t(15;17)(q24;q21) 46,XX,t(5;17;15)(q33;q21;q24)[19]/46,XX[1] 46,XY,t(15;17)(q24;q21) 46,XY,t(15;17)(q24;q21),add(16)(p?13.1)[5] |
FLT3-ITD (1) |
| September 2012 |
53 | Male (2), Female (2) | White (2), Black (2) | A+ (1), O+ (3) | LR (2), IR (1), HR (1) | Yes (2), No (2) | No (4) | 46,XX,t(15;17)(q24;q21)[20] 46,XY,t(15;17)(q24;q21)[19]/45,X,−Y[1] 46,XX,t(15;17)(q24;q21) 46,XY,t(15;17)(q24;q21)[13]/46,XY[7] |
FLT3-ITD (1) |
| December 2014 |
60 | Male (1), Female (3) | White (3), Black (1) | A+ (1), B+ (1), O+ (2) | LR (2), IR (2) | Yes (3), No (1) | No (4) | 46,XX,t(15;17)(q22;q21) 46,XY,t(15;17)(q24;q21)[11]/46,XY,der(15)t(15;17)(q24;q21),ider(17)(q10)t(15;17)[9] 46,XX,t(15;17)(q24;q11.2)[20] t(15;17) – FISH only |
|
| August 2015 |
57 | Male (1), Female (3) | Black (2), Unknown (2) | O+ (3), AB+ (1) | LR (1), IR (2), HR (1) | Yes (2), No (2) | Yes (1), No (3) | 46,XX,t(15;17)(q24;q21) | FLT3-ITD (1), FLT3-D835 (1) |
| December 2015 |
38 | Male (2), Female (2) | White (2), Hispanic (1), Unknown (1) | A+ (1), B+ (1), O+ (2) | IR (2), HR (2) | Yes (1), No (3) | Yes (1), No (3) | 46,XX,t(15;17)(q24;q21) 46,XY,t(15;17)(q24;q21) |
|
| July 2016 |
44 | Male (2), Female (2) | White (3), Black (1) | A+ (2), O+ (1), O− (1) | IR (2), HR (2) | No (4) | No (4) | 46,XY,der(15)t(15;17)(q24;q21),ider(17)(q10)t(15;17)(q24;q21)[19]/46,XY[1] 46,XY,t(15;17)(q24;q21) 46,XX,t(15;17)(q24;q21) 46,XX,t(15;17)(q24;q21) |
FTL3-ITD (1), ASXL1 (1), DNMT3A (1) |
| August 2017 |
44 | Male (3), Female (1) | Black (1), Unknown (3) | O+ (3), O− (1) | LR (1), IR (2), HR (1) | Yes (2), No (1) | Yes (1), No (2) | 46,XY,del(7)(q21),t(15;17)(q24;q21) |
Age = mean age, Gender = male or female, Ethnicity = race or unknown if not available, ABO = blood type, LR = low risk, IR = intermediate risk, HR = high risk, DS = differentiation syndrome, Death = death from any cause, Karyotype = karyotype at diagnosis, Mutations = mutations at diagnosis.
Fig. 1. B).

Zip code distribution of 12 clustered incidences of APL from January 2000 to September 2018.
ABO blood group antigen loss and alterations have been reported in acute myeloid leukemia (AML) and other hematologic malignancies. The majority (60%) of ABO allelic variants was detected in O alleles [12]. Proposed mechanisms for this change include inactivation of A/B/H transferases, gene methylation, and other epigenetic mechanisms [13,14]. Per case reports, these changes suggest a higher proportion of O alleles in AML compared to the general population. The frequencies of O+ and O− blood types in the U.S. are 37.4% and 6.6% respectively according to the Stanford School of Medicine Blood Center (https://www2.palomar.edu/anthro/blood/table_of_ABO_and_Rh_blood_type_frequencies_in_US.htm, accessed December 24, 2019). Interestingly, we observed 44.3% O+ and 7.01% O− in our entire cohort and 50% O+ and 14.6% O− in our cluster subset (Table 1).
There was no statistically significant difference in cohort APL case incidence between spring, summer, fall and winter via one-way ANOVA test [F (3, 225) = 6.26, p = 0.20]. Likewise, there was no difference in seasons seen in our clustered cases of 2 in the spring, 5 in the summer, 1 in the fall and 4 in the winter. The clustered incidences did not consistently correlate with peak onset of influenza, coronavirus, human metapneumovirus, respiratory syncytial virus, or rotavirus per CDC surveillance data (https://gis.cdc.gov/grasp/fluview/FluView8.html, accessed December 23, 2019) and the National Respiratory and Enteric Virus Surveillance System (NREVSS) (https://www.cdc.gov/surveillance/nrevss/index.html, accessed December 26, 2019).
Here we report on 12 clusters of adult APL cases per month in the vicinity of Baltimore over a fourteen-year period, deviations from the expected pattern that are highly unlikely to occur by chance alone. The rare phenomenon of APL clusters is now observed geographically in the Baltimore and Boston metropolitan areas [10] and province of Eastern Cape [7], occupationally and socially in the U.K. [8], and post-therapeutically in Japan [9]. The presence of these clustered incidences suggests an environmental factor that may contribute to leukemogenesis. Further study into the spatiotemporal clusters of APL may identify etiological agents that will improve understanding and prevention of disease.
Acknowledgements
This work was partially supported by the University of Maryland Greenebaum Comprehensive Cancer Center Support grant (P30CA134274), NHLBI – K08 HL127269, NHLBI – R03 HL145226, NCI – P01CA225618, and the State of Maryland’s Cigarette Restitution Funds.
Footnotes
Disclosure of interest
The authors report no relevant conflicts of interest related to the current work.
References
- 1.Chen Y, Kantarjian H, Wang H, et al. Acute promyelocytic leukemia: a population-based study on incidence and survival in the United States, 1975–2008. Cancer. 2012;118(23):5811–5818. [DOI] [PMC free article] [PubMed] [Google Scholar]
- 2.Cuttner J. Increased Incidence of Acute Promyelocytic Leukemia in Patients with Ulcerative Colitis. Annals of Internal Medicine. 1982;97(6):864. [DOI] [PubMed] [Google Scholar]
- 3.Xue Y, Lu D, Guo Y, et al. Specific chromosomal translocations and therapy-related leukemia induced by bimolane therapy for psoriasis. Leuk Res. 1992;16:1113–1123. [DOI] [PubMed] [Google Scholar]
- 4.Li S, Chen L, Jin W, et al. Influence of body mass index on incidence and prognosis of acute myeloid leukemia and acute promyelocytic leukemia: A meta analysis. Scientific reports. 2017;7(1):17998. [DOI] [PMC free article] [PubMed] [Google Scholar]
- 5.Pulsoni A, Stazi A, Cotichini R, et al. Acute promyelocytic leukaemia: epidemiology and risk factors. A report of the GIMEMA Italian archive of adult acute leukaemia. GIMEMA Cooperative Group. European Journal Of Haematology. 1998;61(5):327–332. [DOI] [PubMed] [Google Scholar]
- 6.Mele A, Stazi MA, Pulsoni A, et al. Epidemiology of acute promyelocytic leukemia. Haematologica. 1995;80(5):405–408. [PubMed] [Google Scholar]
- 7.Gilbert RD, Karabus CD, Mills AE, et al. Acute promyelocytic leukemia. A childhood cluster. Cancer (0008543X). 1987;59(5):933. [DOI] [PubMed] [Google Scholar]
- 8.Murrin RJA, Harrison P, Neilson JR. A highly unusual cluster of acute promyelocytic leukaemia: an environmental aetiology? Clinical & Laboratory Haematology. 2005;27(1):71–73. [DOI] [PubMed] [Google Scholar]
- 9.Matsuo K, Kiura K, Tabata M, et al. Clustered incidence of acute promyelocytic leukemia during gefitinib treatment for non-small-cell lung cancer: experience at a single institution. American Journal Of Hematology. 2006;81(5):349–354. [DOI] [PubMed] [Google Scholar]
- 10.Brunner AM, Kim PG, Sadrzadeh H, et al. Clustered incidence of adult acute promyelocytic leukemia. Leukemia Research. 2018;74:47–50. [DOI] [PubMed] [Google Scholar]
- 11.Howlader N, Noone AM, Krapcho M, et al. SEER Cancer Statistics Review, 1975–2016, National Cancer Institute; Bethesda, MD, https://seer.cancer.gov/csr/1975_2016/, based on November 2018 SEER data submission, posted to the SEER web site, April 2019. [Google Scholar]
- 12.Novaretti MCZ, Domingues AE, Manhani R, et al. ABO genotyping in leukemia patients reveals new ABO variant alleles. Genetics And Molecular Research: GMR. 2008;7(1):87–94. [DOI] [PubMed] [Google Scholar]
- 13.Chenna D, Mohan G, Reddy VR, et al. The disappearance of blood group antigens: A clue to the clinical diagnosis of leukemia. Transfusion And Apheresis Science: Official Journal Of The World Apheresis Association: Official Journal Of The European Society For Haemapheresis. 2019;58(1):48–49. [DOI] [PubMed] [Google Scholar]
- 14.Nambiar RK, Narayanan G, Prakash NP, et al. Blood group change in acute myeloid leukemia. Baylor University Medical Center Proceedings. 2017;30(1):74–75. [DOI] [PMC free article] [PubMed] [Google Scholar]