

Kinome profiles of endometrial tumors and normal tissues have been determined using Multiplexed Inhibitor Beads and Mass Spectrometry. Overexpression of SRPK1 in endometrial tumors was observed, which was associated with poor survival. Inhibition of SRPK1 in endometrial cancer cells revealed SRPK1 was integral for growth under serum-starved conditions. Compensatory activation of EGFR, IGF1R, and AKT promoted resistance to SRPK1 inhibitor SPHINX31. Combination therapies involving SRPK1 and EGFR or IGF1R inhibitors synergized to block growth and survival of endometrial cancer cells.
Keywords: kinases, cancer biomarker(s), pathway analysis, affinity proteomics, therapeutic targets, combination therapies, endometrial carcinoma, kinome, splicing, tissue proteomics
Graphical Abstract

Highlights
SRPK1 is overexpressed in endometrial cancer and associated with poor survival.
SRPK1 promotes endometrial cancer cell growth under nutrient-deprived conditions.
Activation of EGFR-IGF1R-AKT signaling promotes resistance to SRPK1 inhibitors.
Co-targeting SRPK1 and EGFR-IGF1R synergize blocking endometrial cancer cell growth.
Abstract
Endometrial carcinoma (EC) is the most common gynecologic malignancy in the United States, with limited effective targeted therapies. Endometrial tumors exhibit frequent alterations in protein kinases, yet only a small fraction of the kinome has been therapeutically explored. To identify kinase therapeutic avenues for EC, we profiled the kinome of endometrial tumors and normal endometrial tissues using Multiplexed Inhibitor Beads and Mass Spectrometry (MIB-MS). Our proteomics analysis identified a network of kinases overexpressed in tumors, including Serine/Arginine-Rich Splicing Factor Kinase 1 (SRPK1). Immunohistochemical (IHC) analysis of endometrial tumors confirmed MIB-MS findings and showed SRPK1 protein levels were highly expressed in endometrioid and uterine serous cancer (USC) histological subtypes. Moreover, querying large-scale genomics studies of EC tumors revealed high expression of SRPK1 correlated with poor survival. Loss-of-function studies targeting SRPK1 in an established USC cell line demonstrated SRPK1 was integral for RNA splicing, as well as cell cycle progression and survival under nutrient deficient conditions. Profiling of USC cells identified a compensatory response to SRPK1 inhibition that involved EGFR and the up-regulation of IGF1R and downstream AKT signaling. Co-targeting SRPK1 and EGFR or IGF1R synergistically enhanced growth inhibition in serous and endometrioid cell lines, representing a promising combination therapy for EC.
Endometrial carcinoma (EC) is the most common gynecologic malignancy in the United States with 60,050 new cases and 10,470 deaths expected in 2020 (1). There are two major histological types of EC, Type I and Type II, each displaying distinctive overall prognosis and survival outcomes (2). Type 1 ECs are composed of low-grade endometrioid tumors representing the majority of EC (80%) with early stage detection and favorable prognosis. In contrast, Type II ECs are high-grade, display poor prognosis, and consist of 3 distinct histologies: serous adenocarcinomas, clear cell adenocarcinomas, and carcinosarcomas (2). Uterine serous carcinoma (USC) is the most lethal form of Type II EC because of late stage detection and high recurrence rates with current treatments only modestly impacting survival (3). Moreover, there has been a steady increase in the mortality rate for EC that has been attributed to higher proportions of patients presenting with USC (4). EC tumors are characterized by alterations in TP53, PPP2R1A, FBXW7, CDKN2A, PTEN, EGFR, ERBB2, PIK3CA, and KRAS (5, 6), and consequently inhibitors targeting EGFR, ERBB2, PI3K/AKT, and MAPK pathway components have been extensively explored as molecular targeted therapies (2). However, inhibiting these kinases has shown limited therapeutic benefit in EC because of drug resistance (7), prompting the search for new therapeutic avenues with a strong focus on combination therapies.
Protein kinases are a family of ∼535 enzymes that collectively are termed the kinome (8). Uncontrolled protein kinase activity has been linked to the development of nearly 25% of all cancers; consequently, protein kinases represent one of the most promising avenues for cancer therapy (9, 10). Indeed, ∼60 kinase-specific inhibitors are currently approved for therapy of various cancer types, with several hundred kinase inhibitors in Phase 1-3 clinical trials across all diseases (8, 11). However, most of these kinase-specific inhibitors target a relatively small fraction of the human kinome with the majority untargeted for cancer therapy (12–14). Moreover, a significant proportion of the kinome is largely uncharacterized with respect to the function of these kinases in cancer (12–14). Notably, several CRISPR/Cas9 and/or RNAi loss-of-function studies have shown that many understudied kinases are essential for cancer cell viability, highlighting the therapeutic potential of the understudied kinome for the treatment of cancer (15, 16).
Chemical proteomics strategies, such as KinobeadsTM, Kinativ, and Multiplexed Inhibitor Beads (MIBs) have been widely utilized to measure kinase abundance in cancer cell lines and tissues (17–19). Endogenous kinases are enriched from lysates by immobilized kinase inhibitors and subsequently identified by quantitative MS (17, 18). Importantly, these proteomics approaches can measure the levels of numerous understudied kinases, providing a strategy to interrogate the unexplored cancer kinome. Several methods for quantitating kinases enriched by MIBs or kinobeads have been explored, including isobaric tagging (i.e. iTRAQ or TMT), label-free quantitation (LFQ) approaches, and labeled methods such as stable isotope labeling with amino acids in cell culture (SILAC) (17, 18, 20). Super-SILAC (s-SILAC) approaches (21) that spike in a mixture of SILAC-labeled cell lines with tissues have also been used to measure kinases in tumors (22, 23). In our prior work, we utilized a s-SILAC reference mixed with tumor tissues to measure kinase abundance in ovarian tumors (24). Additionally, combining multiple quantitative approaches such as LFQ and labeling techniques has been shown to increase coverage and quantitative precision for tissue proteomics (25).
Here, we employed MIB-MS kinome profiling using LFQ and s-SILAC quantitation to measure the abundance of kinases in patient endometrial carcinoma (EC) tumors and normal endometrial (NE) tissues. MIB-MS profiling identified several kinases overexpressed in endometrial tumors including Serine/Arginine-Rich Splicing Factor Kinase 1 (SRPK1). Inhibition of SRPK1 in USC cells using SPHINX31 altered RNA splicing, blocked cell growth, and induced apoptosis under nutrient-deficient conditions. Moreover, SRPK1 inhibitors had minimal impact on EC cell growth in the presence of serum because of compensatory EGFR, IGF1R, and AKT signaling. Together, our findings nominate SRPK1 as a putative target in combination with EGFR, IGF1R, or AKT inhibitors for the treatment of EC.
EXPERIMENTAL PROCEDURES
Experimental Design, Data Analysis and Statistical Rationale
For proteomic measurement of kinase abundance in tissues, we used MIB-MS profiling and quantitated kinase levels using a combination of Label-Free Quantitation (LFQ) and super-SILAC (s-SILAC) (26, 27). Briefly, an equal amount of s-SILAC reference (5 mg) was spiked into each primary tissue sample (5 mg) and kinases purified from tissues using MIB-resins, kinases were eluted, digested, and peptides analyzed by LC–MS/MS as previously described (24). To identify kinases elevated in endometrial tumors relative to normal endometrial tissues, we performed MIB-MS analysis on 20 distinct primary endometrial tumors and 16 distinct normal endometrial tissues. Measurement of MIB-enriched kinase abundance in tissues was performed by LFQ and s-SILAC quantitation using MaxQuant software version 1.6.1.0. POWER analysis of MIB-MS profiling of tissues: Measuring changes in kinase abundance among 20 tumors and 16 normal tissues using LFQ or s-SILAC was sufficiently powered. With 16 normal and 20 tumor samples, we would be able to detect a standardized effect size of 1.15 between these groups (in terms of log2 LFQ z-scores, this corresponds to a 2.22-fold difference between these groups), and achieve 80% power at the 1% significance level. A Type I Error of 1% has been used to account for the large number of kinases. With 16 normal and 20 tumor samples, we would be able to detect a difference of 1.03 between these groups (in terms of log2 s-SILAC ratios, this corresponds to a 2.04-fold difference between these groups), and achieve 80% power at the 1% significance level. A Type I Error of 1% has been used to account for the large number of kinases. Data analysis of MIB-MS profiling of tissues: MaxQuant normalized LFQ values or SILAC ratios (H/L) were filtered for human protein kinases in excel and then imported into Perseus software (1.6.2.3) for quantitation. LFQ data processing: Kinase LFQ intensity values were filtered in the following manner: kinases identified by site only were removed, reverse or potential contaminants were removed then filtered for kinases identified by >1 unique peptide. Kinase LFQ intensity values were then log2 transformed, technical replicates averaged, and rows filtered for minimum valid kinases measured (n= >70% of runs). No imputation of missing values was performed. s-SILAC data processing: Kinase s-SILAC ratios were transformed 1/(x) to generate light/heavy ratios, log2 transformed, technical replicates averaged, and rows filtered for minimum valid kinases measured (n= >70% of runs). No imputation of missing values was performed. Student's t test analysis of tumors versus normal tissues: Kinase log2 LFQ intensity values or s-SILAC ratios were subjected to a Student's t test comparing tumors (n = 20) versus normal tissues (n = 16) using Perseus Software. Parameters for the Student's t test for LFQ data were the following: S0 = 2, side both using Permutation-based FDR <0.05. Parameters for the Student's t test for s-SILAC ratios were the following: S0 = 0.1, side both using Permutation-based FDR <0.05. Volcano plots depicting differences in kinases abundance determined by LFQ or s-SILAC analysis were generated using R studio software. For PCA analysis of kinase log2 LFQ intensities, rows were filtered for kinases measured in 100% of MIB-MS runs and principal component analysis (PC1 versus PC2, PC2 versus PC3 and PC1 versus PC3) performed to visualize kinome profiles among tissue samples. For hierarchical clustering (Euclidean) of kinase levels among tissues samples, all MIB-enriched protein log2 LFQ intensities were z-score normalized in Perseus, then filtered for kinases, followed by row filtering for minimum valid kinases measured (n= >70% of runs). Scatter plots depicting differences in kinases abundance were generated using R studio software and bar graphs generated in excel or Prism.
MIBs Preparation and Chromatography
Experiments using MIB-MS were performed as previously described (24). Briefly, cells or tumors were lysed and an equal amount of the s-SILAC reference (5 mg) lysate was added to nonlabeled (5 mg) lysate (cell, or tumor tissue) and endogenous kinases isolated by flowing lysates over kinase inhibitor-conjugated Sepharose beads (purvalanol B, VI16832, PP58 and CTx-0294885 beads) in 10 ml gravity-flow columns. Eluted kinases were reduced by incubation with 5 mm DTT at 65 °C for 25 min, alkylated with 20 mm iodoacetamide at room temperature for 30 min in the dark, and alkylation was quenched with DTT for 10 min, followed by digestion with sequencing-grade modified trypsin (Promega) overnight at 37 °C. C-18 purified peptides were dried in a speed vac, and subsequent LC-/MS/MS analysis was performed.
Reproducibility analysis of MIB-enriched kinases using LFQ or s-SILAC quantitation-Reproducibility of MIB-MS paired with LFQ or s-SILAC quantitation was assessed as previously described (28). Briefly, MIB-MS-determined kinase expression data (log2 ratios) were transformed onto the nonnegative scale using 2^x transformation. In the case of triplicate or quadruplicate measurements, all pairs of replicates were considered in this analysis. Pairs of replicates with either missing observations or identical values across duplicates were removed from further analysis. The primary measures utilized in this analysis include the coefficient of variation (Z) and the difference (Δ) in duplicate observations computed for each pair of replicates. Using this method, a small number of outliers were identified from SILAC-based data and no outliers were identified from LFQ-based data, verifying the reproducibility of MIB-MS paired with either LFQ or s-SILAC.
MIB-MS Profiling and Data Analysis of SPEC-2 Cells Treated with SPHINX31, BMS754807 or the Combination
MIB-MS analysis of SPHINX31, BMS754807 or the combination of SPHINX31 and BMS754807 treatment in SPEC-2 cells was performed as previously described (24). Briefly, serum-competent SPEC-2 cells were treated with 5 μm SPHINX31 (n = 3 biological replicates), 2 μm BMS754807 (n = 3 biological replicates), or 5 μm SPHINX31 + 2 μm BMS754807 (n = 3 biological replicates) for 48 h and lysates incubated with MIB-beads. Measurement of MIB-enriched kinase abundance in cell lines was performed by LFQ using MaxQuant software version 1.6.1.0. MaxQuant normalized LFQ values were filtered for human protein kinases in excel and then imported into Perseus software (1.6.2.3) for quantitation. LFQ values were filtered in the following manner: kinases identified by site only were removed, reverse or potential contaminants were removed, then filtered for kinases identified by >1 unique peptide. Kinase LFQ intensity values were then log2 transformed and rows filtered for minimum valid kinases measured (n= >70% of runs). No imputation of missing values was performed. Log2 LFQ intensity values were subjected to a Student's t test comparing treatment versus DMSO using Perseus Software. Parameters for the Student's t test for LFQ data were the following: S0 = 2, side both using Permutation-based FDR <0.05. Volcano plots depicting differences in kinases abundance determined by LFQ or s-SILAC analysis were generated using R studio software.
Single-run Proteome Profiling and Data Analysis
To determine changes in proteome landscape in SPHINX31 treated cells, we performed single-run proteome analysis as previously described (29). Briefly, serum-competent or starved SPEC-2 cells were treated with 5 μm SPHINX31 (n = 3 biological replicates) or DMSO (n = 3 biological replicates) for 24 h, cells lysed as previously described and 100 µg of proteins digested using LysC and trypsin. Digested peptides were isolated using C-18 and PGC columns, then dried and cleaned using ethyl acetate. 5 µg of peptides were analyzed using LC–MS/MS. MaxQuant normalized LFQ values were imported into Perseus software (1.6.2.3) and filtered in the following manner: kinases identified by site only were removed, reverse, or potential contaminant were removed then filtered for kinases identified by >1 unique peptide. Protein LFQ values were log2 transformed, filtered for a minimum valid number of 3, normalized using Z-scores, annotated, and subjected to a Student's t test with comparing SPHINX31 versus DMSO in serum-competent or starved SPEC-2 cells. Parameters for the Student's t test were the following: S0 = 0.1, side both using Benjamini-Hochberg FDR <0.05. Volcano plots depicting differences in protein abundance were generated using R studio software. Proteins induced or repressed by SPHINX31 treatment (FDR < 0.05) were imported into Metascape for pathway analysis (30).
Nano-LC–MS/MS
Proteolytic peptides were resuspended in 0.1% formic acid and separated with a Thermo Scientific RSLC Ultimate 3000 on a Thermo Scientific Easy-Spray C18 PepMap 75 μm × 50 cm C-18 2 μm column. For MIB runs, a 240 min gradient of 4–25% acetonitrile with 0.1% formic acid was used. For total proteome runs, a 305 min gradient of 2–20% (180 min) 20-28% (45 min) 28–48% (20 min) acetonitrile with 0.1% formic acid was used. Both gradients were run at 300 nL/min at 50 °C. Eluted peptides were analyzed by Thermo Scientific Q Exactive or Q Exactive plus mass spectrometer using a top 15 methodology in which the 15 most intense peptide precursor ions were subjected to fragmentation. The AGC for MS1 was set to 3 × 10⁶ with a max injection time of 120 ms, the AGC for MS2 ions was set to 1 × 10⁵ with a max injection time of 150 ms, and the dynamic exclusion was set to 90 s.
Proteomics Data Processing
Raw data analysis of LFQ or s-SILAC experiments was performed using MaxQuant software 1.6.1.0 and searched using Andromeda 1.5.6.0 against the Swiss-Prot human protein database (downloaded on April 24, 2019, 20402 entries). The search was set up for full tryptic peptides with a maximum of two missed cleavage sites. All settings were default and searched using acetylation of protein N terminus and oxidized methionine as variable modifications. Carbamidomethylation of cysteine was set as fixed modification. The precursor mass tolerance threshold was set at 10 ppm and maximum fragment mass error was 0.02 Da. LFQ quantitation was performed using MaxQuant with the following parameters; LFQ minimum ratio count: 2, Fast LFQ: selected, LFQ minimum number of neighbors; 3, LFQ average number of neighbors: 6. SILAC quantification was performed using MaxQuant by choosing multiplicity as 2 in group-specific parameters and Arg10 and Lys8 as heavy labels. Global parameters for protein quantitation were as follows: label minimum ratio count: 1, peptides used for quantitation: unique, only use modified proteins selected and with normalized average ratio estimation selected. Match between runs was employed for LFQ and s-SILAC quantitation and the significance threshold of the ion score was calculated based on a false discovery rate of < 1%.
CPTAC Proteome and Expression Data Analysis
SRPK1 mRNA and protein alterations in endometrial tumors compared with normal endometrial tissues were queried from the endometrial cancer study by CPTAC and analyzed for differential expression (31). The relative abundance of SRPK1 protein across endometrial tissue samples was determined by TMT-based quantitation (31). Statistical differences in SRPK1 log2 TMT protein ratios or SRPK1 log2 (+1) mRNA levels comparing tumors versus normal tissues were determined by paired t test, Benjamini-Hochberg adjusted p value at FDR of <0.05. A positive correlation was observed among SRPK1 protein and RNA levels in endometrial tumors (R2 = 0.66, p < 0.05).
Cell Lines
The SPEC-2 cell line was generously provided by Chunxiao Zhou, University of North Carolina. All cell lines were verified by IDEXX laboratories and were verified Mycoplasma-negative (1/7/20) using the Hoechst DNA stain method. OVCAR5 and MOLT4 cells were cells were maintained in RPMI 1640. SPEC-2, RL95-2, and KLE cells were maintained in DMEM/F12. AN3CA, HEC1A and HEC1B cells were maintained in MEM. All media were supplemented with 10% FBS, 100 U/ml Penicillin-Streptomycin and 2 mm GlutaMAX. Cell lines used for the s-SILAC reference sample (MOLT4, UACC257, ACHN, COLO205, and PC-3) were grown for seven doublings in arginine- and lysine-depleted media supplemented with heavy isotope labeled [13C6,15N4]arginine (Arg10) (84 mg/L) and [13C6,15N4] lysine (Lys8) (48 mg/L) (Sigma), and unlabeled leucine (50 mg/L) (ThermoFisher Scientific) as described previously (32). All cells were kept at 37 °C in a 5% CO2 incubator.
Patient Samples
All patient samples used in this study were obtained from the Fox Chase Cancer Center (FCCC) Biosample Repository Facility (BRF). The FCCC BRF maintains a longstanding Institutional Review Board-approved protocol for collection, banking and distribution of de-identified biospecimens and associated clinical data. Consent and authorization for the use of de-identified specimens and associated clinical data for unrestricted research was obtained from all BRF participants prior to specimen collection.
Frozen Tumor Samples
Endometrial tumors and matched normal adjacent endometrial tissues were obtained from the FCCC BRF for this IRB-approved research (16-9031). Tumor tissue was snap frozen at the time of collection and stored at −80 °C in the FCCC BRF. Tumor histology and cellularity was confirmed by the FCCC BRF pathologist at the time of banking.
Compounds
For the compounds utilized in MIB synthesis, Purvalanol B was purchased from Abcam. PP58 and VI16832 were custom synthesized according to previously described methods by The Center for Combinatorial Chemistry and Drug Discovery, Jilin University, P.R. China (33). CTx-0294885 was purchased from MedKoo Biosciences, Inc (406457). Conjugation of inhibitors to beads was performed by carbodiimide coupling to ECH Sepharose 4B (CTx-0294885, VI16832 and PP58) or EAH Sepharose 4B (purvalanol B) (GE Healthcare). A list of compounds used in cell treatments can be found in Data file S1.
Immunoblotting
Samples were harvested in MIB lysis buffer, subjected to SDS-PAGE chromatography, and transferred to PVDF membranes before western blotting with primary antibodies. Secondary HRP-anti-rabbit and HRP-anti-mouse were obtained from ThermoFisher Scientific. SuperSignal West Pico and Femto Chemiluminescent Substrates (Thermo Scientific) were used to visualize blots. A list of primary antibodies used can be found in Data file S1. Western blot images were quantified using the Analyze>Gels function in Image J open source software (National Institutes of Health). Optical density values for total protein levels were normalized by GAPDH. Phosphorylated proteins were normalized to loading control, then normalized to total abundance of the respective protein.
Endometrial Tissues and Tumor Specimens for IHC
Cancerous and benign endometrial specimens were obtained from patients who underwent surgical resection at Fox Chase Cancer Center. Two endometrial tumor tissue microarrays (TMAs) containing a total of 57 EC patient tumors (39 USC and 18 endometrioid) and 12 normal endometrial tissues in duplicate were provided by the Biosample Repository of Fox Chase Cancer Center. All these samples were used with informed patient consent, and the study was approved by the Institutional Review Boards of Fox Chase Cancer Center. Typically, tissue specimens were fixed in 10% buffered formalin, embedded in paraffin, sectioned, and stained with hematoxylin and eosin. All tumors were histologically classified according to the World Health Organization (WHO) classification, and the surgical stages were determined according to the classification of International Federation of Gynecology and Obstetrics (FIGO). Two-Tiered histological grading system was also used for grading the serous carcinoma.
Immunohistochemistry (IHC) and IHC Evaluation
Immunohistochemical staining was carried out according to standard methods by the FCCC Histopathology Facility. Briefly, 5 μm formalin-fixed, paraffin-embedded TMA sections were deparaffinized and hydrated. Sections were then subjected to heat-induced epitope retrieval with 0.01 M citrate buffer (pH 6.0). Endogenous peroxidases were quenched by the immersion of slides in 3% hydrogen peroxide solution. The sections were incubated overnight with primary antibodies to SRPK1 (Rabbit, 1:200, HPA016431, Sigma-Aldrich) at 4 °C in a humidified slide chamber. Immunodetection was performed using the Dako Envision+ polymer system and immunostaining was visualized with the chromogen 3, 3'-diaminobenzidine. The sections were then washed, counterstained with hematoxylin, dehydrated with ethanol series, cleared in xylene, and mounted. Known positive cancer tissues were used as positive controls. As a negative control, the primary antibody was replaced with normal rabbit IgG to confirm absence of specific staining. All slides were viewed with a Nikon Eclipse 50i microscope and photomicrographs were taken with an attached Nikon DS-Fi1 camera. Immunoreactivity of SRPK1 protein was evaluated by a pathologist and IHC score was given based on the intensity of the staining. 0: Negative; 1: mild/weak; 2: moderate/intermediate; 3: strong/intensive. Sample size justification for IHC analysis: To explore the protein abundance of SRPK1 in endometrial tumors relative to normal endometrial tissues we performed immunohistochemistry on 57 distinct endometrial tumors (39 serous, 18 endometrioid) and 12 normal endometrial tissues. With 39 serous and 12 normal tissue samples, we would be able to detect a difference of 86 in mean IHC scores between these groups and achieve 99% power at the 2.5% significance level for a two-sided test. Similarly, with 18 endometrioid and 12 normal tissue samples, we would be able to detect a difference of 79 in mean IHC scores between these groups and achieve 97% power at the 2.5% significance level for a two-sided test. A Type I Error of 2.5% has been used to account for the two hypotheses of interest. These calculations are based on observed group means (and estimated standard deviations) of 181 (34), 174 (35) and 95 (36), respectively for the serous, endometrioid and normal groups. Overexpression of SRPK1 in endometrioid (n = 18) and serous (37) endometrial tumors relative to normal endometrial tissues (n = 12) was by paired t test Benjamini-Hochberg adjusted p value at FDR of <0.05.
RNA Expression and Alternative Splicing Analysis
The sequencing libraries were constructed from 500 ng of total RNA using Illumina's TruSeq RNA Sampleprep kit V2 (Illumina) following the manufacturer's instructions. The fragment size of RNAseq libraries was verified using the Agilent 2100 Bioanalyzer (Agilent), and the concentrations were determined using a Qubit instrument (LifeTech). The libraries were loaded onto the Illumina HiSeq 2500 at 8 pm and run in rapid mode for 2 × 40 bp paired end sequencing. The fastq files were generated on Illumina's BaseSpace, and further data analysis was performed using TopHat for read alignment and Cufflinks Assembly & DE for gene expression assessment (38). Genes significantly altered by SPHINX31 treatment in SPEC-2 cells were determined by paired t test Benjamini-Hochberg adjusted p value at FDR of <0.05 comparing DMSO versus SPHINX31 treatment. Pathway enrichment of genes down-regulated >1.5-fold was performed using Metascape. Alternative splicing analysis was performed as described previously (39). Briefly, for detection of splicing changes in SPHINX31 treated SPEC-2 cells, the MATS algorithm was implemented using the aligned BAM files (34). The spliced events were filtered using False Discovery Rate by Benjamini-Hochberg method (FDR < 0.01). Furthermore, the events were sorted based on difference between average of inclusion level for treated and control samples. Each splicing change was visualized using the IGV program (Integrative Genomics Viewer). Enrichment analysis for Gene Ontology (GO) terms was assessed using the GOstats program (35). Pathway enrichment was performed by Metascape on genes significantly mis-spliced in response to SPHINX31 treatment.
Bioinformatics Analyses of TCGA Datasets
Analysis of SRPK1 CNA and mRNA alterations in EC from TCGA studies (37) was performed at the Biostatistics and Bioinformatics Facility, FCCC. SRPK1 expression is associated with survival (Fisher's two-sided p < 0.05). Overall survival was based on vital status and “days to death” from initial pathologic diagnosis. Individuals who were still alive at the time of the last follow-up were censored. Survival curves were compared with log-rank tests, and these calculations were done using the R 'survival' package (Therneau, T. M. & Grambsch, P. M. Modeling Survival Data: Extending the Cox Model (Springer-Verlag, 2010). Survival data were obtained from TCGA data repository.
SPHINX31 Treatments
For all experiments comparing the effects of SPHINX31 in the presence or absence of serum, cells were serum starved (if indicated) for 24 h, then treated with inhibitor for 24 h before processing.
Drug Synergy Analysis
Drug synergy was determined using SynergyFinder (https://synergyfinder.fimm.fi) using the Bliss model and viability as the readout (40). Data are presented as means of 3 biological replicates.
Cell Proliferation Assays
For short-term growth assays, 1500–5000 cells were plated per well in 96-well plates and allowed to adhere and incubated overnight. Inhibitors were added the following morning and after 120 h of drug treatment, cell viability was assessed using the CellTiter-Glo luminescent cell viability assay (Promega) according to manufacturer's instructions. Student's t-tests were performed for statistical analyses and p value ≤ 0.05 were considered significant. For colony formation assays, cells were plated in 24-well dishes (5000 cells per well) and incubated overnight before continuous drug treatment for 12 days, with drug and medium replenished twice weekly. Following the final treatment, cells were rinsed with PBS and fixed with chilled methanol for 10 min at −20 °C. Methanol was removed by aspiration, and cells were stained with 0.5% crystal violet in 20% methanol for 1 h at room temperature, washed with distilled water, and scanned. For SPHINX31 viability assays in the presence or absence of serum, 50,000 cells were plated, treated with drug for 24 h, and then stained in the same manner as the colony formation assays. The crystal violet was de-stained with 30% ethanol + 1% acetic acid for 2 h and the absorbance was read at 595 nm.
RNAi Knockdown Studies
siRNA transfections were performed using 25 nm siRNA duplex and the reverse transfection protocol. 3000 cells per well were added to 96 well plates with media containing the siRNA and transfection reagent (Lipofectamine RNAiMax) according to the manufacturer's instructions. In experiments where inhibitors were used, the inhibitor was added at the time of transfection. Cells were grown for 72 h (for immunoblots) or 120 h (for viability assays) post-transfection prior to collection or CellTiter-Glo analysis. Two-to-three independent experiments were performed with each cell line and siRNA. Student's t-tests were performed for statistical analyses and p value ≤0.05 were considered significant. A list of siRNA product numbers can be found in Data file S1.
RESULTS
Mapping the Kinome Landscape of Primary Endometrial Carcinoma Tumors Using MIB-MS
To identify kinases overexpressed in endometrial tumors relative to normal tissues, we performed MIB-MS profiling on 20 primary endometrial tumors (17 endometrioid, 3 serous) and 16 normal endometrial tissues and quantitated kinase abundance using LFQ paired with a s-SILAC standard (Fig. 1A, Data file S2). A previously designed s-SILAC standard consisting of a mixture of cancer cell lines was spiked into unlabeled endometrial tissues prior to MIB-MS profiling (24). Pairing MIB-MS with the s-SILAC standard measured a significant proportion of the kinome (n = 325, ∼60% of the kinome) from a cohort of cell lines and tumor tissues (Data file S3). Reproducibility of the s-SILAC standard to quantitate MIB-bound kinases was shown to be comparable with LFQ quantitation using a model-based approach (28) for assessing technical reproducibility and outlier detection (supplemental Fig. S1A–S1B). Moreover, quantifying differences in kinase levels using MIBs paired with LFQ or s-SILAC between distinct cancer cell lines was highly correlated (r2 = 0.85), demonstrating the complementary utility of these quantitative methods to measure MIB-enriched kinase levels (supplemental Fig. S1C, supplemental Data file S4).
Fig. 1.

Profiling the Endometrial Cancer Kinome Using Quantitative MIB-MS. A, Workflow of kinome profiling of endometrial tumors and normal endometrial tissues using MIB-MS with kinases quantitated using LFQ and super-SILAC. B, Kinome tree depicts coverage of kinases measured by LFQ, s-SILAC or both LFQ and s-SILAC in endometrial tissues. The kinome tree was generated in KinMap and was reproduced courtesy of Cell Signaling Technology. Data are from one independent assay per sample in 20 tumor tissues and 16 normal tissues. C, Box plots depict the average number of kinases measured by LFQ or s-SILAC per individual MIB-run. D, Bar graph shows the number of kinases measured by LFQ or s-SILAC at >90% frequency across all tissue MIB-MS runs. The frequency of kinases across datasets was determined using Perseus software. E, Hierarchical clustering of kinase log2 LFQ z-scores of endometrial tumors (n = 20) and normal tissues (n = 16), as determined by MIB-MS. F, PCA analysis, including PC1 versus PC2 of kinase log2 LFQ intensities of endometrial tumors (n = 20) and normal tissues (n = 16), as determined by MIB-MS.
In total, we measured MIB-binding values for 347 kinases across the endometrial tumors and normal tissues, with 300 kinases quantitated by both LFQ and s-SILAC, 37 kinases uniquely measured by LFQ, and 10 by s-SILAC (Fig. 1B, supplemental Fig. S1D and supplemental Data file S5). The fraction of the kinome not captured by MIB-MS profiling of endometrial tissues can be found in supplemental Data file S5, which likely can be attributed to lack of affinity for MIB-resins or low expression in endometrial tissues. An average of 288 (normal) and 287 (tumor) kinases were measured by LFQ per MIB-MS run compared with fewer by s-SILAC, 224 (normal) and 214 (tumor) (Fig. 1C). Frequency analysis of kinase measurements across MIB-MS runs showed LFQ quantitated an overall greater number of kinases (n = 239) at >90% frequency compared with s-SILAC (n = 127) (Fig. 1D). These findings are consistent with prior reports showing s-SILAC approaches can be limited by the composition of the super-SILAC cell line mixtures (41).
Unsupervised hierarchical clustering or principal component analysis (PCA) of MIB-MS tissue signatures showed kinase levels of normal endometrial tissues were relatively similar to endometrial tumors, demonstrating the tumor kinome(s) retain overall similarity with the tissue of origin (Fig. 1E–1F, supplemental Fig. S1E–S1F). Notably, a higher diversity in kinase expression was observed among endometrial tumors compared with normal tissues.
Identification of Kinases Elevated in Endometrial Patient Tumors Relative to Normal Endometrial Tissues
Volcano plot analysis of kinase log2 LFQ intensities (Fig. 2A) or log2 s-SILAC ratios (supplemental Fig. S2A) revealed numerous kinases exhibited differential protein abundance among endometrial tumors and normal tissues (supplemental Data file S6). A scatterplot comparing LFQ or s-SILAC-determined log2 differences in kinases levels among tumors and normal tissues shows the 2 quantitative methods exhibit overlap, with an r2 = 0.51 (Fig. 2B). Several kinases (n = 31) identified to be significantly up-regulated or down-regulated in tumors by LFQ analysis were validated by s-SILAC-based quantitation, representing high-confident kinase measurements.
Fig. 2.

Identification of Kinases Overexpressed in Endometrial Tumors Relative to Normal Tissues. A, Volcano plot depicts kinases elevated or reduced in endometrial tumors (n = 20) relative to normal endometrial tissues (n = 16). Differences in kinase log2 LFQ intensities among tumors and normal tissues determined by paired t test Benjamini-Hochberg adjusted P values at FDR of <0.05 using Perseus software. Each tissue sample was run in biological duplicate (n = 2) and kinase log2 LFQ intensities averaged. Kinases exhibiting a ≥2-fold difference and P value ≤0.01 among tumors versus normal are depicted in volcano plot. B, Scatterplot depicts the overlap in kinases elevated or reduced determined by LFQ or s-SILAC. Regression analysis (R2) among quantitative methods was performed in Perseus Software. Differential expressed kinases identified by LFQ and s-SILAC quantitation (FDR <0.05) are labeled. C, Bar graph depicts high-confident kinase log2 LFQ intensities overexpressed in endometrial tumors determined by LFQ and s-SILAC quantitation (FDR <0.05). D, Bar graph depicts medium-confident kinase log2 LFQ intensities overexpressed in endometrial tumors identified by either LFQ or s-SILAC quantitation (FDR <0.05) but exhibiting a similar trend in expression difference. E, Associated pathways of kinases overexpressed in endometrial tumors relative to normal endometrial tissues determined by quantitative MIB-MS profiling. Pathway analysis was performed using Metascape. Kinases previously investigated as a target or identified as a biomarker of endometrial cancer are depicted with asterisks.
Nineteen kinases displayed reduced protein abundance in tumors compared with normal tissues by both LFQ and s-SILAC quantitation with several being stromal-associated kinases (i.e. PDGFRB, DDR2 and MYLK) (42) (supplemental Fig. S2B). Twelve kinases were shown to be elevated in endometrial tumors relative to normal tissues by LFQ and s-SILAC quantitation, signifying high-confident kinases overexpressed in endometrial tumors (Fig. 2C). Additionally, 2 kinases were identified to be elevated in tumors relative to normal tissues by LFQ only (BMPR1B and CLK4), which likely can be attributed to low or no expression in the s-SILAC standard (Fig. 2D). Other kinases were shown to be significantly elevated in tumor versus normal tissues by LFQ but not s-SILAC (AURKB, PTK6, and STK3), or by s-SILAC but not LFQ (CLK2, DYRK2, RIOK2, MET, CDK9, and CSNK1A1). Notably, both quantitation strategies showed a similar trend in predicted kinase abundance, representing medium-confident kinase measurements (Fig. 2D). Despite overlap among LFQ and s-SILAC quantitation, several kinases were distinctly identified by LFQ or s-SILAC to be elevated or repressed in tumors versus normal tissues, indicating low-confident kinase measurements requiring further validation (supplemental Fig. S2C).
Next, we performed pathway analysis using Metascape (30) on the high/medium-confident kinases elevated in endometrial tumors relative to normal tissues to explore associated functions of these kinases (supplemental Fig. S2D). Pathway analysis showed kinases elevated in tumors were implicated in a number of processes, including transcriptional regulation of TP53, phosphorylation of RNA polymerase II C-terminal domain, regulation of RNA splicing, positive regulation of cell death, and regulation of mitotic cell cycle (Fig. 2E). Some of the kinases identified by MIB-MS profiling to be elevated in tumors have previously been reported to promote endometrial cancer (depicted by * in Fig. 2E). High expression of c-MET and its ligand hepatocyte growth factor (HGF) have been reported in endometrial carcinomas (43) and several groups have shown blockade of MET signaling impairs endometrial cancer cell growth and invasion (44). Elevated gene expression of DDR1 has been reported in primary EC tumors and represent biomarkers of EC in uterine fluid aspirates (45). A recent large-scale proteogenomics evaluation of endometrial tumors by CPTAC identified frequent alteration of AURKB and CDK12 in endometrial tumors, representing promising therapeutic targets (31). Of particular interest, most kinases overexpressed in endometrial tumors have not been previously explored as therapeutic targets in endometrial cancer. Moreover, several of these unexplored kinases have established roles in other cancers, representing plausible therapeutic avenues to pursue for endometrial cancer.
SRPK1 is Overexpressed in Endometrial Tumors and Represents a Prognostic Indicator for Poor Survival
Accumulating evidence suggests a significant role for aberrant RNA splicing in promoting cancer development and progression, as well as in drug resistance to targeted therapies and immunotherapies (46). MIB-MS profiling identified several kinases up-regulated in endometrial tumors with established roles in regulating RNA splicing (i.e. SRPK1, SRPK2, CLK2 and CLK4) (Fig. 2E). SRPK1 overexpression has been correlated with poor survival of several cancers including colorectal, lung, and breast cancers (47). Overexpression of SRPK1 has been observed in highly aggressive breast cancers, such as triple negative breast cancers (TNBCs) and may be linked to development of resistance to therapy, highlighting SRPK1 as an attractive therapeutic target (48). Moreover, SRPK1 has been shown to be essential for mRNA alternative splicing in cells and blockade of SRPK1 function alters several oncogenic processes including angiogenesis, migration/invasion, proliferation, cancer stem cell (CSC) phenotype, and sensitivity to chemotherapy (49).
To characterize SRPK1 levels across larger numbers of patient endometrial tumors, we queried publicly available endometrial cancer proteomics (CPTAC) and genomics (TCGA) studies (31, 37). Consistent with our MIB-MS kinome profiling findings, querying SRPK1 protein abundance in CPTAC proteomics datasets of 95 patient endometrial tumors and 49 normal endometrial tissues showed SRPK1 protein levels were elevated in endometrial tumors compared with normal endometrial tissues (Fig. 3A, Data file S7). SRPK1 RNA levels were also elevated in endometrial tumors relative to normal tissues and positively correlated with SRPK1 protein abundance (supplemental Fig. S3A–S3B, supplemental Data file S7). Analysis of SRPK1 genetic alterations among endometrial tumors showed genomic alteration of SRPK1 (37%, 189 of 507 tumors), with frequently altered gene expression (up-regulation in 18%, 93 of 507 and down-regulation in 13%, 68 of 507) (Fig. 3B). Infrequent gene amplification (0.2%, 1 of 507) and mutations in SRPK1 were observed (2.96%, 15 of 507), with no homozygous deletions detected. Moreover, levels of SRPK1 mRNA expression were associated with poor survival in EC, where patients harboring endometrial tumors with high levels of SRPK1 exhibited reduced overall survival (P <0.05) (Fig. 3C, supplemental Fig. S3C).
Fig. 3.

SRPK1 Is Overexpressed in Endometrial Tumors and Associated with Poor Survival. A, Plot depicts relative protein abundance of SRPK1 in endometrial tumors (n = 95) relative to normal endometrial tissues (n = 45) queried from CPTAC analysis of endometrial cancer (32). Data represent log2 transformed relative abundance values of SRPK1 across tissues determined by TMT-based quantitation. Statistical differences in SRPK1 log2 relative abundance values comparing tumors versus normal tissues was determined by paired t test Benjamini-Hochberg adjusted P values at FDR of <0.05. B, Analysis of SRPK1 copy number analysis (CNA), mRNA and mutation changes in EC tumors from Uterine (TCGA PanCancer Atlas 2018) studies (39). mRNA levels were determined by U133 microarray and change in SRPK1 abundance among tumors determined at z-score > 1 or < −1. C, Survival plot of HGSOC patients with SRPK1 expression segregated into lower (low - blue), middle (no change - gray) and upper quartiles (up - orange) show statistically significant difference in overall survival. Survival data were obtained from TCGA data (39). D, IHC analysis of SRPK1 in endometrial tumor TMAs. A pathologist evaluated immunoreactivity of SRPK1 protein and IHC score was given based on the intensity of protein stain. Data are from duplicate analysis of 57 endometrial tumors (39 serous and 18 endometrioid) and 12 normal tissues. E, Box plots shows elevated SRPK1 protein abundance determined by IHC in endometrioid and serous subtypes of endometrial tumors relative to normal tissues. Differences in SRPK1 IHC scores comparing endometrial tumors versus normal tissues determined by paired t test Benjamini-Hochberg adjusted P values at FDR of <0.05 using Perseus software. F, Immunoblot of SRPK1 in matched patient endometrial tumors and normal tissues. G, Box plot shows elevated SRPK1 protein levels in endometrial tumors (n = 18) relative to matched normal tissues (n = 18) determined by SRPK1 immunoblot. Densitometric analysis of immunoblots presented in (F and supplemental Fig. S3D). Values indicate the optical density of total protein levels from an immunoblot normalized to total protein content (loading control, GAPDH). Quantitation of immunoblot bands was performed in ImageJ. Differences in SRPK1 protein abundance among endometrial tumors versus normal tissues was determined by paired t test Benjamini-Hochberg adjusted P values at FDR of <0.05.
Elevated SRPK1 protein abundance in endometrial tumor tissues was validated by immunohistochemical (IHC) analysis of tissue microarrays (TMAs) containing 57 endometrial patient tumors (39 serous and 18 endometrioid) and 12 normal endometrial tissues (Fig. 3D and supplemental Data file S8). SRPK1 protein was localized to the membrane and cytoplasmic regions of the tumor with predominant staining in the cytoplasm. Endometrial tumor subtypes (endometrioid or serous) displayed elevated levels of SRPK1 by IHC compared with normal endometrial tissues (Fig. 3E). Immunoblot analysis of SRPK1 protein abundance among matched patient endometrial tumors (endometrioid or serous) and normal tissues similarly showed increased SRPK1 protein levels (Fig. 3F). Notably, multiple SRPK1 bands were detected using the SRPK1 antibody (supplemental Fig. S3D). Knockdown of SRPK1 in an endometrial cancer cell line revealed the 95 kDa immunoblot band was the most down-regulated by siRNAs suggesting this was the predominant SRPK1 form. Overexpression of SRPK1 was detected in 11 out of 18 matched patient specimens analyzed (Fig. 3G, supplemental Fig. S3E).
SRPK1 Inhibition Reduces USC Cell Growth in Serum and Induces Apoptosis following Nutrient Deprivation
Uterine serous carcinoma (USC) is the most aggressive and lethal variant of endometrial cancers with limited effective therapeutic avenues (3). To explore the therapeutic potential of SRPK1 in USC, we carried out loss of functions studies in an established USC cell line, SPEC-2. Knockdown of SRPK1 for 72 h using 2 distinct siRNAs or a siRNA-pool reduced SRPK1 protein levels and inhibited cell viability of SPEC-2 cells by ∼50% (Fig. 4A–4B).
Fig. 4.

Inhibition of SRPK1 Reduces Viability of USC Cells and Induces Apoptosis Under Nutrient-deprived Conditions. A, Immunoblot for SRPK1 confirms sufficient knockdown by SRPK1 siRNAs. SPEC-2 cells were transfected with siRNAs targeting SRPK1 or with control siRNA, cultured for 72 h, lysed, and immunoblotted for SRPK1 protein abundance. B, CellTiter-Glo assay for cell viability of established USC cell line SPEC-2 transfected with siRNAs targeting SRPK1 or with control siRNA and cultured for 120 h. Data were analyzed as % cell viability presented as means ± S.D. of 3 independent assays. *P ≤ 0.05 by Student's t test. C, Volcano plot depicts MIB-MS kinome profile of SPEC-2 cells treated with SPHINX31 for 4 h. SPEC-2 cells were treated with 5 μm SPHINX31 or DMSO for 4 h and lysates incubated with MIB-beads. Volcano plot shows difference in kinase log2 LFQ intensities in SPHINX31 treated versus control-treated SPEC-2 cells. Biological triplicates SPHINX31 (n = 3) and DMSO (n = 3) were MIB-profiled. D, CellTiter-Glo assay for cell viability of SPEC-2 cell lines treated with increasing concentrations of SPHINX31 or DMSO and cultured for 120 h. Data were analyzed as % cell viability of DMSO control presented as means of 3 independent assays. E, Long-term 12-day colony formation assay of SPEC-2 cells treated with SPHINX31 or DMSO. Colony formation was assessed by crystal violet staining. Representative images of 3 biological replicates. F, Crystal violet absorbance assays for cell viability of SPEC-2 cell lines cultured in the presence (+FBS) or absence (-FBS) of serum and treated with 5 μm SPHINX31 or DMSO for 24 h. Data were analyzed as % absorbance of DMSO control presented as means of 3 biological replicates. G, Apoptosis assessed by immunoblotting for cleaved-PARP abundance in serum-competent (+FBS) or serum-starved (-FBS) SPEC-2 cells treated with DMSO or 5 μm of SPHINX31 for 24 h. Blots are representative of 3 independent experiments.
Next, we explored the impact of SRPK1 kinase inhibition on SPEC-2 cell growth and survival using the SRPK1 inhibitor SPHINX31 (50). Selectivity of SPHINX31 for SRPK1 has previously been confirmed by KinomeScan analysis (51), which showed SRPK1 was the primary target of SPHINX31 with SRPK1 exhibiting an IC50 16-fold higher than SRPK2. To further explore the selectivity of SPHINX31 in cell-based assays, we treated SPEC-2 cells with DMSO or 5 μm SPHINX31 for 4 h, lysed cells and performed kinome profiling using MIB-MS (Fig. 4C, supplemental Data file S9). Differences in kinase MIB-binding can be attributed to various factors, including inhibitor competition of targets with MIB-resins and inhibitor-mediated changes in protein abundance (18). Of note, differences in MIB-binding of kinase targets with rapid inhibitor off-rates may not be detected in this assay because of inhibitor dilution and reestablishment of binding equilibrium during cell lysis. Out of 238 kinases measured by MIB-MS, SRPK1 exhibited the most significant and greatest reduction in MIB-binding in SPHINX31 treated cells, followed by SRPK2, further supporting the selectivity of SPHINX31 for SRPK1 and to a lesser extent SRPK2.
Consistent with SRPK1 knockdown, treatment of SPEC-2 cells with SPHINX31 reduced cell growth by ∼50% at higher doses (10 μm) in both 5-day viability and 12-day colony formation assays, demonstrating SRPK1 contributes to cell growth of USC cells (Fig. 4D–4E). As SPHINX31 targets SRPK1 and to a lesser extent SRPK2, we determined if SRPK2 was integral for SPEC-2 cell growth. Knockdown of SRPK2 reduced cell viability of SPEC-2 cells by ∼30% and the combined knockdown of SRPK1/2 did not enhance growth inhibition observed with SRPK1 knockdown alone (supplemental Fig. S4A–S4B). Together, these findings suggest inhibition of SRPK2 may minimally contribute to the observed growth effects mediated by SPHINX31 in SPEC-2 cells.
Growth and survival of cancer cells in the absence of nutrients is essential for tumor development, progression and metastasis (36). Of particular interest, treatment of serum-starved SPEC-2 cells with 5 μm SPHINX31 reduced cell viability to a greater extent than cells grown in serum, as well as uniquely induced apoptosis in nutrient-deprived SPEC-2 cells (Fig. 4F–G). Together, these findings suggest SRPK1 marginally contributes to USC cell proliferation in serum-competent cells, but appears to promote growth and survival following nutrient deprivation.
Proteogenomics Characterization of SPHINX31 Treated SPEC-2 Cells Reveals an Integral Role for SRPK1 in RNA Splicing, Cell Cycle and Survival
To explore SRPK1 functions in SPEC-2 USC cells under nutrient-supplemented or nutrient-deprived conditions, we carried out proteomics analysis of cells in response to SRPK1 inhibition. Serum-competent (+FBS) or serum-starved (-FBS) SPEC-2 cells were treated with DMSO or 5 μm SPHINX31 for 24 h and subjected to single-run proteome analysis (29). Differences in protein levels among treatments were determined using LFQ (26) and pathways altered by SRPK1 inhibition were defined using Metascape gene annotation and analysis resources (30) (Fig. 5A).
Fig. 5.

Proteogenomics Characterization of SRPK1 Inhibition in SPEC-2 Cells. A. Proteomics workflow for exploring the function of SRPK1 in SPEC-2 cells. Serum-competent (+FBS) or serum-starved (-FBS) SPEC-2 cells were treated with 5 μm SPHINX31 for 24 h, subjected to single-run proteome analysis and differences in protein abundance determined by LFQ. B–C, Volcano plots depict proteins induced or repressed by SPHINX31 treatment in +FBS (B) or –FBS (C) SPEC-2 cells. Differences in protein log2 LFQ intensities among SPHINX31 or DMSO treated SPEC-2 cells was determined by paired t test Benjamini-Hochberg adjusted P values at FDR of <0.05 using Perseus software. Proteins induced by SPHINX31 treatment are labeled red whereas those reduced by SRPK1 inhibition are labeled blue. D–E, Hierarchical clustering of pathways up-regulated (D) or down-regulated (E) by SPHINX31 treatment in serum-competent (+FBS) or serum-starved (-FBS) SPEC-2 cells. Proteins induced or repressed by SPHINX31 treatment (FDR < 0.05) were imported into Metascape pathway analysis. Heat map color depicts P values for pathway enrichment. gray colors indicate the lack of pathway enrichment for that term in the protein list. F, Schematic illustrating the type and number of alternative splicing events identified by RNA-seq in SPHINX31 treated (5 μm) SPEC-2 cells. G, Immunoblot shows increased protein levels of the VEGF165b isoform in response to SPHINX31 treatment for 24 h. H, Bar graph depicts the optical density levels of total VEGF165b isoform from an immunoblot normalized to total protein content expressed as a percent change (SPHINX31/DMSO). Quantitation of immunoblot bands was performed in ImageJ using 3 independent biological replicates. *P ≤ 0.05 by Student's t test. I, Immunoblot for VEGF165b in SPEC-2 cells following knockdown by SRPK1 siRNAs. SPEC-2 cells were transfected with siRNAs targeting SRPK1 or with control siRNA, cultured for 72 h, lysed, and immunoblotted for VEGF165b protein abundance. J, Circos plot shows overlap in pathway enrichment analysis among splice targets (splicing analysis), proteins (proteomics) or mRNAs (RNA-seq) down-regulated by SPHINX31 treatment in serum-starved SPEC-2 cells. K, Hierarchical clustering of pathways commonly enriched in alternatively spliced targets, and those proteins or mRNAs down-regulated by SPHINX31 treatment in serum-starved SPEC-2 cells. Alternatively spliced genes, proteins, or mRNA repressed by SPHINX31 treatment (FDR < 0.05) were imported into Metascape pathway analysis. Heat map color depicts P values for pathway enrichment. Grey colors indicate the lack of pathway enrichment for that term in the protein list. L, Apoptosis and cell cycle markers assessed by immunoblotting for cleaved PARP and p21 abundance in serum-starved (-FBS) SPEC-2 cells treated with DMSO or 5 μm SPHINX31 for 24 h. Blots are representative of 3 independent experiments.
Volcano plot analysis of single-run proteome measurements of SPHINX31 treated SPEC-2 cells revealed SRPK1 inhibition remodeled the proteome with serum-starved cells exhibiting an overall greater number of alterations in protein levels (Fig. 5B–5C, supplemental Data file S10). Hierarchical clustering of Metascape pathway analysis of proteins up-regulated by SPHINX31 treatment in serum-competent or serum-starved SPEC-2 cells showed common enrichment for metabolism signaling (Fig. 5D). Clustering of pathways down-regulated by SPHINX31 treatment revealed inhibition of SRPK1 reduced wound healing, cell junction assembly, and actin filament-based process signaling in serum-competent and serum-starved SPEC-2 cells (Fig. 5E). Notably, down-regulation of focal adhesion, cholesterol biosynthesis, cell cycle, and mitotic cell cycle phase transition was strongly enriched in nutrient-deprived SPEC-2 cells in response to SRPK1 inhibition, consistent with the greater growth inhibition and apoptosis observed in serum-starved SPHINX31 treated SPEC-2 cells.
Next, we performed RNA-sequencing to explore changes in gene expression following SRPK1 inhibition (supplemental Fig. S5A, supplemental Data file S11). Similar to our proteomics findings, Metascape pathway analyses of genes down-regulated by SPHINX31 treatment in nutrient-deprived cells were enriched in regulation of cell adhesion, actin cytoskeleton organization, cell cycle, and mitotic cell cycle phase transition signaling (supplemental Fig. S5B). Additionally, RNA-seq analysis showed genes involved in DNA replication, the AURKB pathway, and transcriptional regulation of TP53 were down-regulated by SPHINX31 treatment. SRPK1 has been shown to regulate RNA splicing in cancer cells, where inhibition of SRPK1 causes mis-splicing of genes impacting cell growth and survival (49, 51). To gain insight into the role of SRPK1 in alternative splicing in SPEC-2, we assessed changes in pre-mRNA splicing following SPHINX31 treatment in serum-starved SPEC-2 cells. RNA-seq analysis revealed SRPK1 inhibition for 24 h resulted in substantial mis-splicing of gene targets, including 2759 SKIP events, 518 mutually exclusive exons (MXE), 225 5' splice site (5'SS), 364 3' splice site (3'SS) and 640 retained intron (RI) (Fig. 5F, supplemental Data file S11). Pathway analysis of genes exhibiting mis-splicing following SRPK1 inhibition were enriched in cell-cell adhesion, protein transport, cell cycle, protein phosphorylation and mRNA splicing signaling (supplemental Fig. S5C). BIOCARTA pathway analysis showed an enrichment of alternative spliced targets in RHO pathway, ECM pathway and VEGF pathway signaling (supplemental Fig. S5D). Previous reports showed inhibition of SRPK1 in serum-starved cells promoted splicing of VEGF-A to VEGF165b isoforms blocking VEGF signaling and angiogenesis (49). Consistent with these findings, we detected increased splicing of VEGF-A to the VEGF165b isoform in response to SPHINX31 treatment and demonstrated SRPK1 inhibition or knockdown of SRPK1 increased the protein levels of VEGF165b isoform (Fig. 5G–5I, supplemental Fig. S5E).
Further characterization of mis-spliced genes following SRPK1 inhibition showed they were enriched for similar pathways down-regulated by SPHINX31 treatment in proteomics and mRNA analysis, including prevalent enrichment for cell division and cell cycle signaling (Fig. 5J–5K). Consistent with these findings, several proteins involved in cell cycle progression were shown to be down-regulated at the RNA and protein levels in response to SRPK1 blockage, including established oncogenes BIRC5 (Survivin), CDK6, PLK1, and CCND1 (supplemental Fig. S5F). Knockdown of Survivin has been shown to induce apoptosis and mitotic catastrophe in several cancer cell lines (52), whereas CDK6 inhibition induces cell cycle arrest (53). Immunoblot analysis of SPHINX31 treated cells confirmed reduced levels of CDK6 and Survivin, as well as other cell cycle-associated proteins that coincided with increased p21 levels and cleaved PARP levels indicating induction of cell cycle arrest and apoptosis (Fig. 5L).
Together, proteomic assessment of SRPK1 inhibition in SPEC-2 cells revealed a role for SRPK1 in promoting RNA splicing, cell adhesion, and actin filament-based processes, as well as cell cycle progression and survival in nutrient-deprived SPEC-2 cells. SPHINX31 treatment of nutrient-deprived cells induced significant alternative splicing of genes involved in cell cycle, as well as down-regulated several proteins essential for growth and survival, including the oncogenes CDK6 and Survivin.
EGF and IGF-1 Receptor Signaling Promote Resistance to SRPK1 Inhibitors in USC Cells
Drug resistance to targeted kinase inhibitor therapies represents a significant limitation in cancer therapies (54). Adaptive kinome reprogramming frequently occurs in cancer cells in response to kinase inhibitors, resulting in activation of compensatory kinase signaling bypassing the intended drug action (18). Based on our observation that nutrient-deprived SPEC-2 cells were more sensitive to SPHINX31 than serum-competent cells (Fig. 4F–4G), we hypothesized co-targeting SRPK1 and growth factor signaling may influence the sensitivity of SPEC-2 cells to SPHINX31 treatment. Notably, treatment of serum-competent SPEC-2 cells with SPHINX31 and inhibitors targeting EGF or IGF-1-receptors enhanced growth inhibition relative to single agents in 5-day cell viability assays, as well as blocked colony formation to a greater extent than single agent therapies (Fig. 6A–6D). Blockade of FGF receptor or VEGF receptors in combination with SPHINX31 did not provide better growth inhibition than single agents (supplemental Fig. S6A–6B).
Fig. 6.
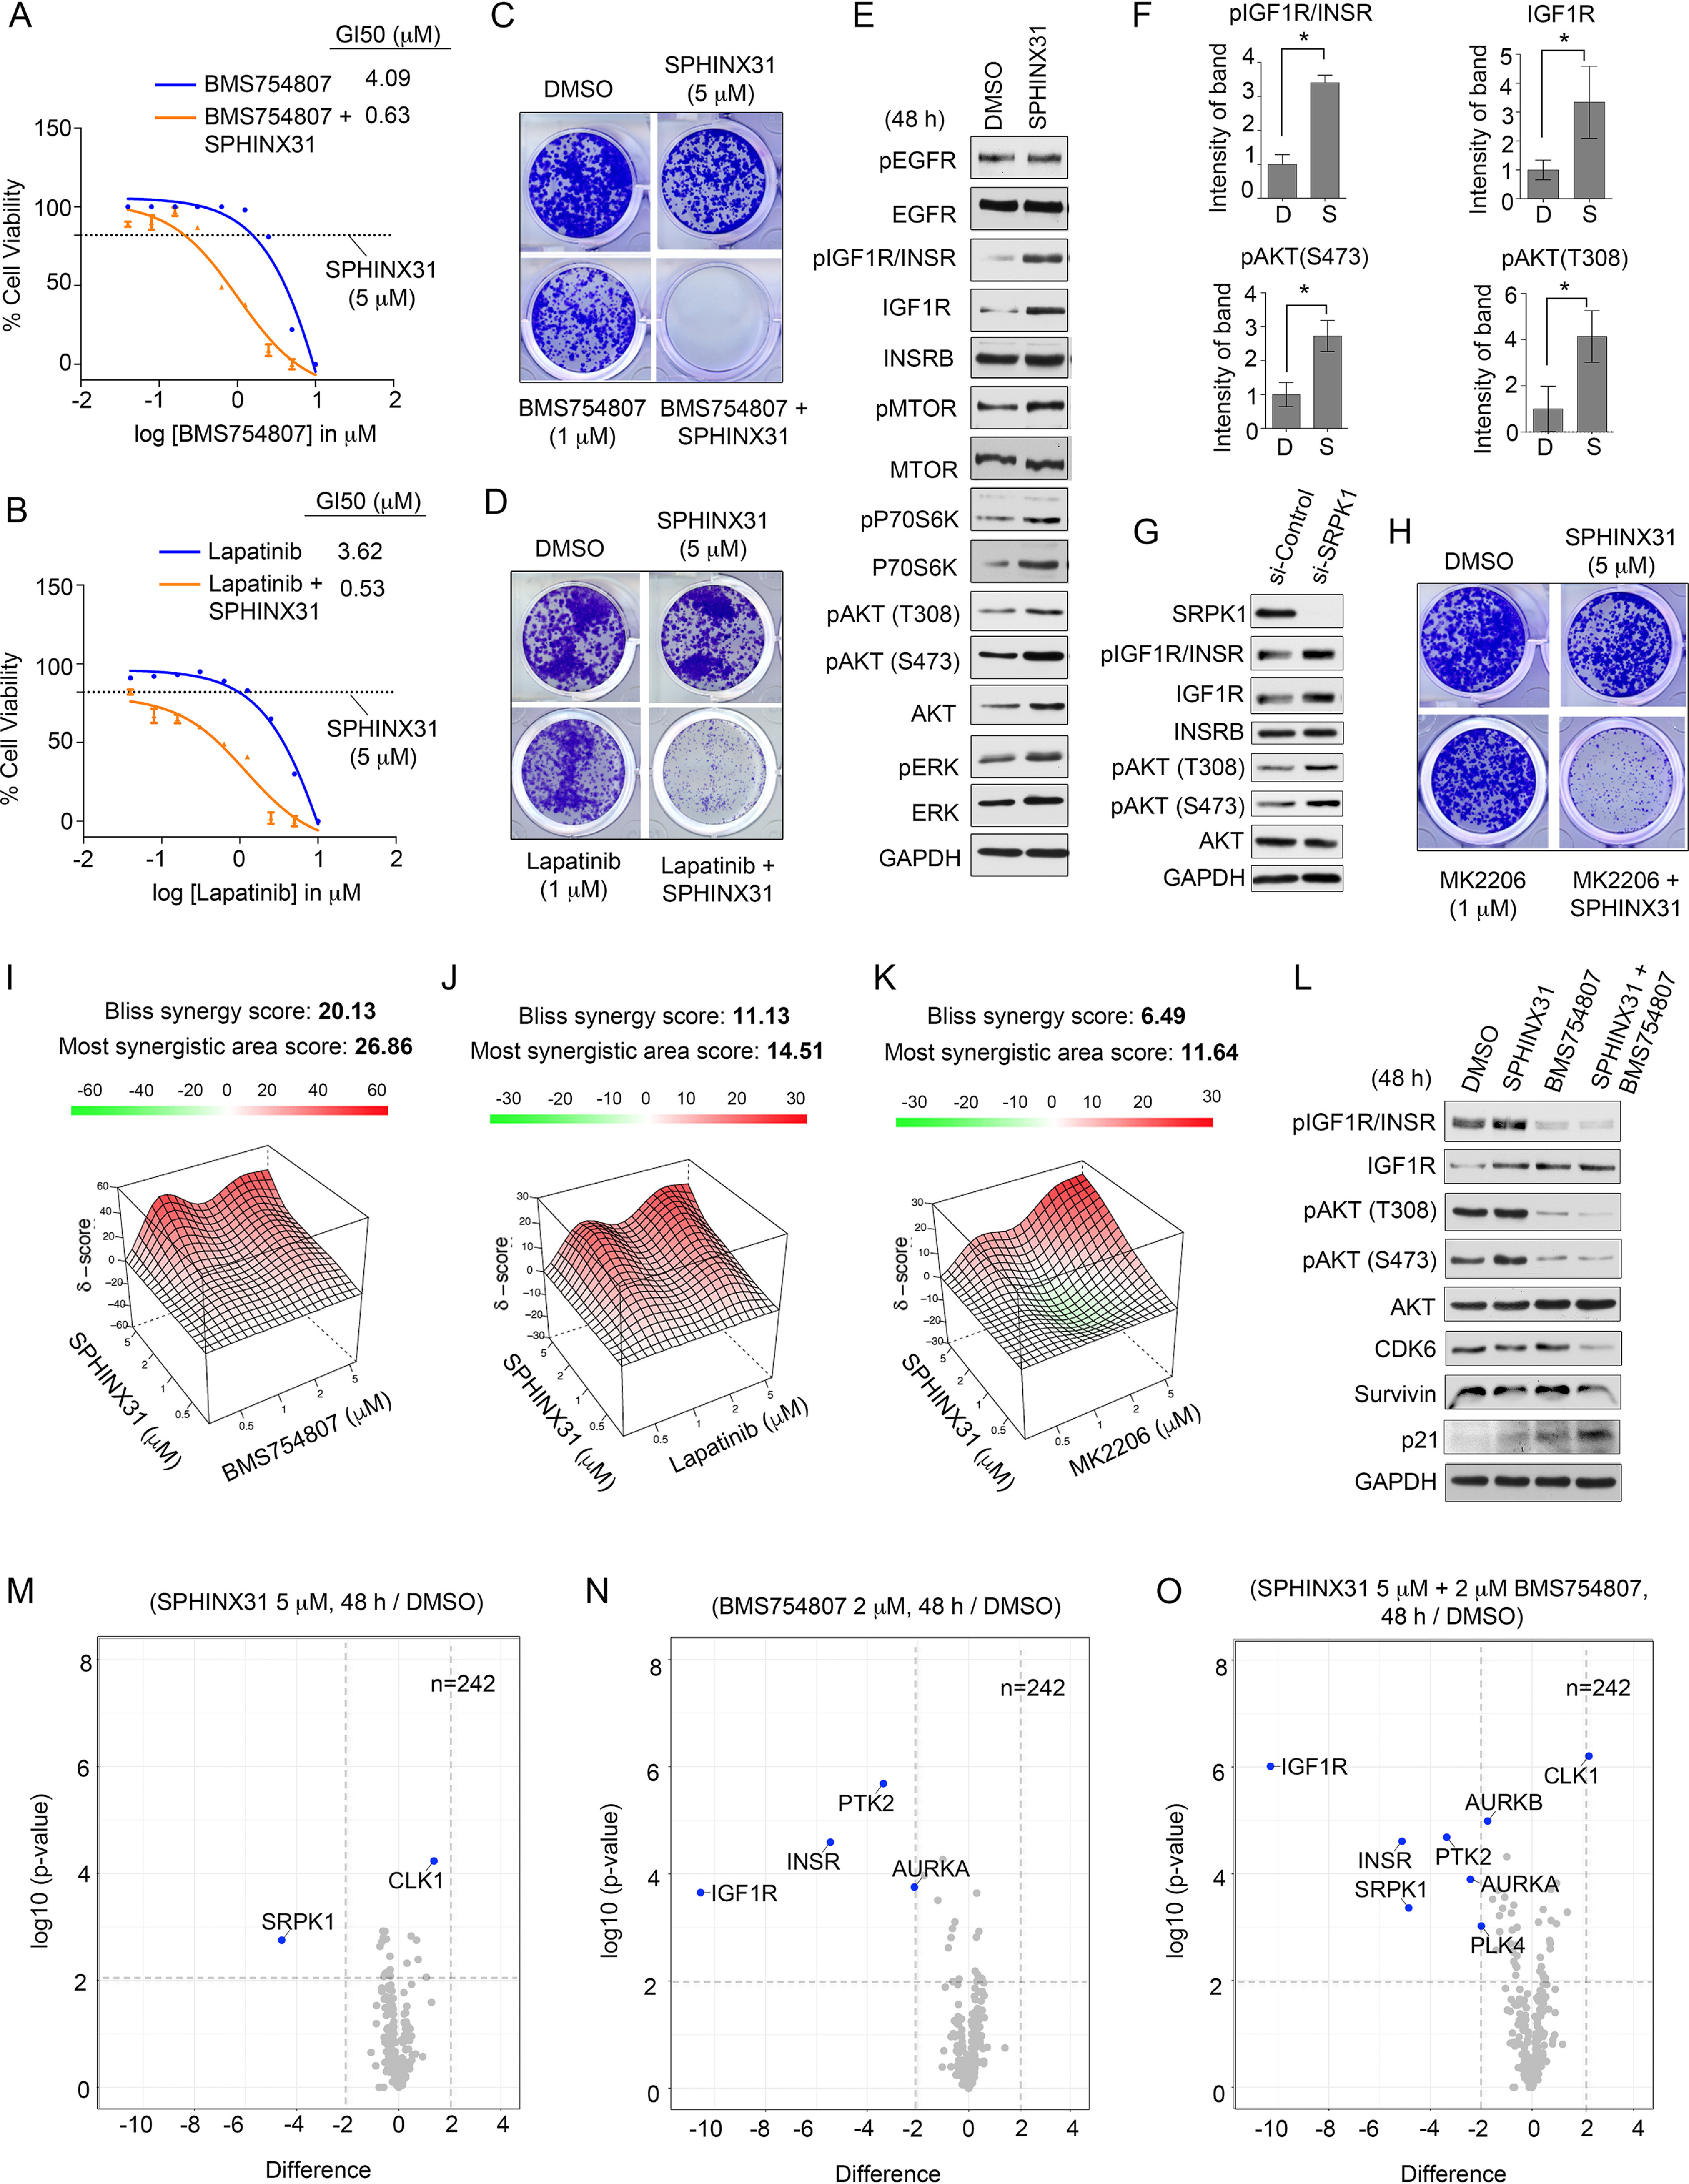
EGF and IGF-1 Receptor Signaling Promotes Resistance to SPHINX31 in SPEC-2 Cells. A–B, CellTiter-Glo assay for cell viability of serum-competent SPEC-2 cell lines treated with increasing concentrations of (A) BMS754807, BMS754807 + 5 μm SPHINX31, 5 μm SPHINX31 or DMSO, or (B) lapatinib, lapatinib + 5 μm SPHINX31, 5 μm SPHINX31 or DMSO and cultured for 120 h. Data were analyzed as % cell viability of DMSO control; presented as means of 3 independent assays. GI50 values were generated in Prism. C–D, Long-term 12-day colony formation assay of SPEC-2 cells treated with (C) DMSO, 1 μm BMS754807, 5 μm SPHINX31 or 1 μm BMS754807 + 5 μm SPHINX31 or (D) DMSO, 1 μm lapatinib, 5 μm SPHINX31 or 1 μm lapatinib + 5 μm SPHINX31. Colony formation was assessed by crystal violet staining. Representative images of 3 biological replicates. E, Immunoblot analysis of the consequence of SPHINX31 treatment on EGF and IGF-1 receptors and downstream signaling in SPEC-2 cells. SPEC-2 cells were treated with 5 μm SPHINX31 for 24 h and total protein abundance and activating phosphorylation of signaling components determined by immunoblot. Blots are representative of 3 independent experiments. F, Values indicate the optical density levels of total and phosphorylated IGF1R (Y1135/1136) or phosphorylated AKT (S473) or (T308) from an immunoblot normalized to total protein content expressed as a percent change (SPHINX31/DMSO). Phosphorylated proteins were normalized to loading control, then normalized to total abundance of the respective protein. Quantitation of immunoblot bands was performed in ImageJ using 3 independent biological replicates. *P ≤ 0.05 by Student's t test. G, Immunoblot analysis IGF1R/AKT axis in SPEC-2 cells transfected with SRPK1 or control siRNAs and cultured for 72 h. H, Long-term 12-day colony formation assay of SPEC-2 cells treated with (C) DMSO, 1 μm MK2206, 5 μm SPHINX31 or 1 μm MK2206 + 5 μm SPHINX31. Colony formation was assessed by crystal violet staining. Representative images of 3 biological replicates. I–K, Drug synergy analysis of (I) BMS754807, (J) lapatinib, (K) MK2206 in combination with SPHINX31 in SPEC-2 cells (n = 3). L, Immunoblot analysis of SPHINX31 and BMS754807 combination in SPEC-2 cells. SPEC-2 cells were treated with DMSO, 2 μm BMS754807, 5 μm SPHINX31 or 2 μm BMS754807 + 5 μm SPHINX31 and IGF1R/AKT signaling axis assessed by immunoblot. Blots are representative of 3 independent experiments. M-O, Volcano plot depicts MIB-MS kinome profile of SPEC-2 cells treated with (M) SPHINX31, (N) BMS754807 or (O) SPHINX31 + BMS754807. SPEC-2 cells were treated with DMSO, 2 μm BMS754807, 5 μm SPHINX31 or 2 μm BMS754807 + 5 μm SPHINX31 for 48 h and lysates incubated with MIB-beads. Volcano plot shows difference in kinase log2 LFQ intensities in drug-treated versus control-treated SPEC-2 cells. Biological triplicates for each condition were used for MIB-profiling.
Immunoblot analysis of SPHINX31 treated SPEC-2 cells revealed SRPK1 inhibition increased total and activating phosphorylation levels of IGF1R/INSR (Y1135/1136), whereas total and activated levels of EGFR (Y1068) were unaffected by SPHINX31 treatment. An increase in activating phosphorylation of MTOR, P70S6K, AKT and ERK activity was also observed in response to SPHINX31 treatment, consistent with up-regulation of IGF1R signaling (Fig. 6E). Quantitation of immunoblots confirmed induced total and phosphorylated IGF1R/INSR (Y1135/1136), as well as increased activating phosphorylation of AKT (S473 and T308) (Fig. 6F). Total AKT levels were not significantly induced by SPHINX31 (supplemental Fig. S6C). Similarly, knockdown of SRPK1 in SPEC-2 cells induced IGF1R total and phosphorylation levels, as well as increased AKT activity (Fig. 6G). These findings are consistent with previous SRPK1 knockout studies that showed depletion of SRPK1 resulted in robust activation of PI3K/MTOR signaling (55). Moreover, combined treatment of SPEC-2 cells with SPHINX31 and the AKT inhibitor MK2206 enhanced growth inhibition relative to single agents in 5-day cell viability assays, as well as blocked colony formation to a greater extent than single agent therapies, supporting a role for AKT signaling in promoting SPHINX31 resistance (Fig. 6H, supplemental Fig. S6D).
Drug synergy analysis using the Bliss method (40) showed combination therapies involving SPHINX31 and BMS754807 exhibited the greatest synergy (Bliss synergy score 20.13), whereas SPHINX31 combined with lapatinib (Bliss synergy score 11.13) or MK2206 (Bliss synergy score 6.49) both trended toward synergy (Fig. 6I–6K, supplemental Fig. S6E–S6G). Knockdown of SRPK1 enhanced growth inhibition of BMS754807 in SPEC-2 cells (supplemental Fig. S6H) and blockade of SPHINX31-induced IGF1R and downstream AKT activation by BMS754807 was confirmed by immunoblot (Fig. 6L). Moreover, the combination of SPHINX31 and BMS754807 reduced CDK6 and Survivin protein levels, as well as induced p21, indicating cell cycle arrest. The enhanced growth inhibition achieved combining IGF1R/INSR and SRPK1 inhibitors was further validated using a different IGF1R/INSR inhibitor OSI-906 and SPHINX31 (supplemental Fig. S6I). Co-treatment of SPEC-2 cells with SPHINX31 and lapatinib also blocked SPHINX31-induction of AKT activity, reducing CDK6, Survivin and inducing p21, demonstrating both IGF1R and EGFR contributed to the increased AKT activation following SRPK1 inhibition (supplemental Fig. S6J).
Next, we performed kinome profiling using MIB-MS of SPEC-2 cells treated with SPHINX31, BMS754807 or the drug combination for 48 h. Volcano plot analysis of SPHINX31 treatment confirmed on-target inhibition of SRPK1, and showed an increase in CLK1 protein levels following SRPK1 inhibition (Fig. 6M, supplemental Data file S12). CDC Like Kinase 1 (CLK1) phosphorylates serine/arginine-rich proteins involved in pre-mRNA processing regulating mRNA splicing in cells, and has recently been shown to function in conjunction with SRPK1 to control RNA splicing (56). SPHINX31-mediated induction of CLK1 protein levels, as well as following SRPK1 knockdown was confirmed by immunoblot (supplemental Fig. S6K–S6L). CLK1 activity is regulated by alternative splicing (57), whereby, exon 4 skipping or intron 4-retention precludes the kinase domain inactivating the kinase. Mis-splicing of CLK1 in response to SPHINX31 was observed in our RNA-seq analysis, where SPEC-2-treated cells exhibited an increase in the inclusion of exon 4 following SRPK1 inhibition (supplemental Fig. S6M). Additionally, up-regulation of CLK1 levels in response to CLK1 inhibitors has been reported (57), and CLK1 has been shown to be a low-affinity target of SPHINX31 (50), suggesting direct targeting of CLK1 by SPHINX31 could also contribute to elevated protein levels. The observed increase rather than decrease in MIB-binding of CLK1 could be attributed to our experimental design, where CLK1 protein levels may be up-regulated by SPHINX31 engagement in cells, then SPHINX31 concentrations diluted during lysis preparations, obscuring competition with MIB-resins. To determine if CLK1 up-regulation impacted SPHINX31 therapies, we co-treated SPEC-2 cells with SPHINX31 and the CLK1/4 inhibitor TG003 (57) and assessed the impact on cell viability. The combined treatment of SPEC-2 cells with SPHINX31 and TG003 did not enhance growth inhibition of SPHINX31 but rather exhibited a negative synergy (Bliss synergy score, -3.086) (supplemental Fig. S6N–S6O). These findings suggest SPHINX31-mediated up-regulation of CLK1 may represent a potential biomarker of SRPK1 inhibition but appears not to promote resistance to SPHINX31.
Treatment of SPEC-2 cells with BMS754807 reduced MIB-binding of primary targets IGF1R and INSR, as well as reduced MIB-binding of PTK2 and AURKA (Fig. 6N, supplemental Data file S12). MIB-MS analysis of the combination therapy of SPHINX31 and BMS754807 at 48 h confirmed on-target inhibition of primary targets IGF1R, INSR and SRPK1 in SPEC-2 cells (Fig. 6O, supplemental Data file S12). Reduced MIB-binding of PTK2, as well as cell cycle-associated kinases AURKA, AURKB and PLK4 were observed, consistent with cell cycle arrest induced by the drug combination.
Dual Blockade of SRPK1 and EGFR and/or IGF1R Enhances Growth Inhibition of Endometrioid Cancer Cell Lines
Endometrioid endometrial carcinomas represent the predominant subtype of endometrial carcinomas (80%), and exhibit frequent overexpression of EGFR (58) and/or IGF1R (59), as well as activated PI3K/MTOR signaling (2). To further explore the efficacy of SRPK1 inhibitors in EC, we treated a panel of 5 established endometrioid cancer cell lines with SPHINX31 alone or in combination therapies and measured cell viability. SPHINX31 treatment had minimal impact on growth of RL95-2, AN3CA, HEC-1-A or HEC-1-B cells, and inhibited cell viability >50% of KLE cells at the highest concentration assayed (10 μm) (Fig. 7A). Notably, similar to SPEC-2 cells, nutrient-deprivation of AN3CA, KLE, or RL95-2 cells improved SPHINX31-mediated growth inhibition; suggesting activated growth factor signaling affected SPHINX31 sensitivity in these cell lines (Fig. 7B–7D). Moreover, SRPK1 inhibition in serum-starved but not serum-competent RL95-2 cells reduced MYC and Survivin protein levels, and increased p21 and cleaved PARP levels indicating induction of cell cycle arrest and apoptosis (Fig. 7E).
Fig. 7.

Combined Inhibition of SRPK1 and EGFR or IGF1R Enhances Growth Inhibition of Endometrial Cancer Cell Lines. A, CellTiter-Glo assay for cell viability of serum-competent endometrioid endometrial cancer cell lines treated with increasing concentrations of SPHINX31 or DMSO and cultured for 120 h. Data were analyzed as % cell viability of DMSO control presented as means of 3 independent assays. B–D, Crystal violet absorbance assays for cell viability of ANC3A, KLE, or RL95-2 cell lines cultured in the presence (+FBS) or absence (-FBS) of serum and treated with 5 μm SPHINX31 or DMSO for 24 h. Data were analyzed as % cell viability of DMSO control presented as means of 3 biological replicates. E, Apoptosis and cell cycle markers assessed by immunoblotting for cleaved-PARP abundance in serum-competent (+FBS) or serum-starved (-FBS) RL95-2 cells treated with DMSO or 5 μm SPHINX31 for 24 h. Blots are representative of 3 independent experiments. F, CellTiter-Glo assay for cell viability of endometrioid cancer cells treated with DMSO, 5 μm SPHINX31, 1 μm lapatinib or 1 μm lapatinib + 5 μm SPHINX31 and cultured for 120 h. Data were analyzed as % cell viability of DMSO control presented as means of 3 independent assays. G, CellTiter-Glo assay for cell viability of endometrioid cancer cells treated with DMSO, 5 μm SPHINX31, 0.5 μm BMS754807 or 0.5 μm BMS754807 + 5 μm SPHINX31 and cultured for 120 h. Data were analyzed as % cell viability of DMSO control presented as means of 3 independent assays. H–J, Drug synergy analysis of SPHINX31 and BMS754807 in (H) RL95-2, (I) AN3CA or (J) KLE cells (n = 3). K, Immunoblot analysis of the consequence of SPHINX31 treatment on EGF and IGF-1 receptors and downstream signaling in RL95-2 cells. RL95-2 cells were treated with 5 μm SPHINX31 for 24 h and total protein abundance and activating phosphorylation of signaling components determined by immunoblot. Blots are representative of 3 independent experiments. L, CellTiter-Glo assay for cell viability of RL95-2 cells treated with DMSO, 5 μm SPHINX31, 1 μm MK2206 or 1 μm MK2206 + 5 μm SPHINX31 and cultured for 120 h. Data were analyzed as % cell viability of DMSO control; presented as means of 3 independent assays. M, Model for resistance to single agent SRPK1 inhibitors predicts combination therapies co-targeting EGF or IGF-1 receptor signaling to achieve durable growth repression of endometrial cancer cells.
Next, we tested whether blocking EGF or IGF-1 receptor signaling concurrently with SRPK1 inhibition improved growth inhibition. The RL95-2, ANC3A and KLE cell lines exhibited sensitivity toward single agent lapatinib or BMS754807, demonstrating both EGF and IGF-1 receptor signaling promote growth of these cells (supplemental Fig. S7A–S7B). In contrast, HEC-1-A and HEC-1-B cells were resistant to lapatinib and less sensitive to BMS754807. The SPHINX31 and lapatinib combination enhanced growth inhibition of RL95-2 and KLE cells and co-treatment of RL95-2, AN3CA, and KLE cells with SPHINX31 and BMS754807 greatly improved growth inhibition compared with single agents (Fig. 7F–7G). No benefit of either drug combination was observed in HEC-1-A or HEC-1-B, suggesting these cells exhibited intrinsic resistance to the single and dual agent therapies (supplemental Fig. S7C–S7D).
The SPHINX31 and BMS754807 combination therapy exhibited drug synergy in RL95-2 (Bliss synergy score 12.86), AN3CA (Bliss synergy score 11.73) and KLE (Bliss synergy score 8.74) (Fig. 7H–7J, supplemental Fig. S7E–S7G). Consistent with our findings in SPEC-2 cells, increased activating phosphorylation of IGF1R/INSR (Y1135/1136) and AKT (T308 and S473) were detected in response to SPHINX31 treatment in RL95-2 cells, demonstrating SRPK1 triggers the compensatory activation of IGF1R-INSR/AKT signaling (Fig. 7K). Dual blockade of SRPK1 and AKT in RL95-2 cells improved growth inhibition compared with single agents, signifying the inhibition of downstream AKT signaling was integral to the observed drug synergies (Fig. 7L). Additionally, co-treatment of AN3CA and KLE cells with SPHINX31 and MK2206 also enhanced growth inhibition relative to single agent therapies, whereas no benefit was observed in HEC1A or HEC1B with the dual agent therapy (supplemental Fig. S7H–S7I).
Collectively, our findings demonstrated EGF and IGF-1 growth factor signaling promotes resistance to SPHINX31 treatment bypassing SRPK1 inhibition in serous and endometrioid endometrial cancer cell lines (Fig. 7M). Nutrient-deprivation or combined inhibition of EGFR, IGF1R or AKT sensitized endometrial cancer cells to SRPK1 inhibitors, representing promising combination therapies for the treatment of endometrial cancer.
DISCUSSION
Endometrial cancer is the fourth most common cancer in women, and incidence of this cancer is on the rise (37). The protein kinome represents an attractive target for the treatment of EC as these tumors harbor frequent alterations in kinase pathways (31). However, therapies targeting well-established kinases such as EGFR, IGF1R, or AKT have shown limited therapeutic benefit, prompting the search for novel kinase therapeutic targets (2). Here, we performed kinome profiling of patient endometrial tumors and normal tissues using MIB-MS and identified several kinases overexpressed in tumors, including SRPK1. Loss-of-function studies targeting SRPK1 in endometrial cancer cell lines revealed an integral role for SRPK1 in RNA splicing, as well as cell proliferation and survival under nutrient-deficient conditions. Moreover, we discovered a resistance mechanism to SRPK1 inhibitors that involved activation of the EGFR-IGF1R-AKT signaling axis, which could be overcome by inhibition of EGFR, IGF1R, or AKT.
Several methods for quantitating kinases enriched by MIB-MS have been explored, including both labeled and label-free approaches (24, 60). Here, we compared LFQ versus s-SILAC measurement of MIB-enriched kinases from endometrial tissues, which revealed LFQ measured a greater number of MIB-enriched kinases at higher frequency among tissue samples than s-SILAC quantitation. These findings are consistent with the s-SILAC method being limited by measurement of only those kinases present in the s-SILAC standard. The heterogeneity of the kinome among cancers, and even within tumor tissues, makes the design of an optimal s-SILAC cancer cell line mix capable of quantitating all MIB-enriched kinases at high frequency a nearly impossible task. Additionally, over-or-under represented kinases in the s-SILAC cancer cell line mixture or inefficient SILAC-labeling of kinases because of low turnover rates could potentially skew the measurement of kinases in tissue samples, resulting in technical artifacts. Generation of SILAC-labeled peptides for each kinase within the kinome that could be spiked into tissue samples at a standardized concentration could improve the coverage and frequency of s-SILAC measurements, though would be costly. Comparison of the quantitation of MIB-enriched kinases using LFQ or s-SILAC in endometrial tissues revealed ∼30 kinases commonly up-regulated or down-regulated in tumor versus normal tissues by both LFQ and s-SILAC quantitative strategies. Despite overlap, numerous kinases exhibited discordant kinase measurements among the LFQ and s-SILAC, suggesting the 2 methods were not uniform. Additional studies including global proteome profiling using intensity-based absolute quantitation (iBAQ) (61) and immunoblot analysis of tissues will be required to determine the abundance of these discordant kinases in tumors versus normal endometrial tissues. Based on our findings, we propose LFQ should be the primary quantitative method for measuring MIB-enriched kinases, with s-SILAC used as a complementary validation method.
Pairing MIB-MS with LFQ measured >280 kinases per sample, providing MIB-enriched abundance values for a significant proportion of the kinome. Kinases are enriched by MIB-resins based on several factors including their affinity, abundance, and in some instances their activation state (18, 62). Notably, these MIB-binding properties could interfere with quantitation of the actual abundance of the kinase within a tissue sample. Recent advances in global proteome analysis and iBAQ quantitation methods (26) capable of measuring numerous kinases without enrichments may represent an alternative or complementary method for quantitating kinase abundance in tissues. Here, we identified SRPK1 to be elevated in endometrial tumors using MIB-MS and validated increased SRPK1 protein abundance by querying a recent global proteome analysis of endometrial tumors by CPTAC. Nevertheless, MIB-MS remains a valuable tool, particularly in determining abundance of those kinases expressed at low levels within samples. In our hands, applying single-run proteome analysis using the LC–MS/MS equipment and methods detailed, we measured ∼190 kinases/sample by single-run proteome analysis in SPEC-2 cells, whereas MIB-MS enrichment quantified ∼240 kinases/sample. Thus, combining MIB-MS and single-run proteome profiling may be the optimal strategy for quantitating kinase abundance in samples increasing the overall kinome coverage measured and providing additional validation.
SRPK1 has emerged as a promising therapeutic target in cancer because of its roles in a variety of oncogenic process including RNA splicing, cell proliferation and survival, as well as migration and metastasis (47). SRPK1 has been shown to regulate alternative splicing in cancer cells through phosphorylation of SRSF (SR Splicing Factors) by SRPK1 controlling splicing, RNA export, and other processes of RNA metabolism in cells (56). Consistent with these findings, we observed a substantial increase in alternative splicing following treatment with the SRPK1 inhibitor SPHINX31, including mis-spliced gene targets enriched in VEGF pathways, cell adhesion, and cell cycle. Inhibition of SRPK1 has been previously shown to induce splicing of VEGF-A to VEGF165b reducing angiogenesis in cells and tumor models, represent a promising anti-angiogenic therapy (63). SPHINX31 treatment or knockdown of SRPK1 in USC cells altered splicing of VEGF-A and increased VEGF165b protein levels, suggesting SRPK1 inhibitors could impact angiogenesis in endometrial cancer models. However, further studies in USC xenograft tumor models will be required to assess whether SPHINX31 treatment increases VEGF165b and blocks angiogenesis observed with other tumor models such as melanoma and prostate cancers (49, 64).
In addition to identifying a role of SRPK1 in RNA splicing in endometrial cancer cells, our proteogenomics characterization of SPHINX31 treated USC cells revealed SRPK1 was required for growth and survival of cells under nutrient deprivation. Comparative pathway analysis of gene targets mis-spliced and those mRNA and proteins down-regulated by SPHINX31 treatment showed they were commonly enriched for cell cycle and cell division signaling. SRPK1 has been implicated in cell cycle progression in other cancer models (65). Our findings suggest SRPK1 may be integral for cell cycle progression when nutrients are limiting through regulation of alternative splicing of cell cycle associated proteins. SRPK1 has been shown to shuttle to the nucleus upon growth factor stimulation where it in turn phosphorylates SRSF proteins influencing mRNA splicing (66). Further characterization of the cellular localization of SRPK1, as well as defining SRPK1 interacting proteins in serum-competent and nutrient-deprived cells could provide insight into the mechanisms by which SRPK1 promotes growth and survival in the absence of growth factors. Notably, SRPK1 has been shown to directly interact with activated AKT following EGF stimulation, where AKT activates SRPK1 promoting its nuclear localization, facilitating growth factor induced mRNA splicing (66). In the absence of EGF-driven AKT-SRPK1 interactions, SRPK1 could have distinct functions in the regulation of cell cycle, potentially through kinase-independent roles when nutrients are limiting. However, further studies exploring the AKT-SRPK1 interactions through co-immunoprecipitations in serum-competent or serum-starved USC cells, as well as in response to SPHINX31 treatment would help address the impact of AKT-binding on SRPK1 function following serum-starvation. Additionally, performing phosphoproteomics in response to SPHINX31 treatment or utilizing ATP-analog sensitive SRPK1 mutants (67) to identify SRPK1 substrates would help define signaling pathways regulated by SRPK1 under serum starvation.
Drug resistance to kinase inhibitors frequent occurs representing a significant limitation in the treatment of cancer (54). One mechanism by which cancer cells bypass kinase inhibition is through adaptive kinome reprogramming, a process involving compensatory activation of alternative kinase survival pathways (18). Combination therapies that block these compensatory kinases often provide more durable therapeutic responses (10). Here, we identified EGF and IGF-1 receptors and their downstream AKT signaling to promote resistance to SRPK1 inhibitors in endometrioid and serous endometrial cancer cell lines. SPHINX31 treatment or SRPK1 knockdown in SPEC-2 cells resulted in up-regulation of IGF1R protein and activating phosphorylation that coincided with increased AKT phosphorylation. Notably, although we did not observe an increase in EGFR total or activating phosphorylation, inhibition of EGFR or IGF1R blocked SPHINX31-mediated AKT activation, suggesting both EGFR and IGF1R contributed to AKT activation. Our findings are consistent with SRPK1 knockout studies, which showed genetic loss of SRPK1 resulted robust activation of AKT and MTOR signaling (55). These studies showed SRPK1 was essential for maintaining a protein-complex consisting of SRPK1, activated AKT and the AKT phosphatase PHLPP2, where knockout of SRPK1 destabilizes the interaction between AKT and PHLPP2, leading to increased phosphorylation of AKT. Defining the impact of SRPK1 inhibitors on the SRPK1-AKT-PHLPP2 complex stability in endometrial cancer cells could help decipher whether disruption of AKT-PHLPP2 interactions promotes the activated AKT observed with SPHINX31 treatment. Notably, our findings suggest that EGFR and IGF1R were integral to the SPHINX31-mediated activation of AKT, as inhibition of either growth factor receptor blocked SPHINX31-induced AKT activation. Cross-talk among EGFR and IGF1R has been shown to occur at many levels in cancer cells, including direct interactions, altering availability of ligands, or indirectly through downstream effectors (68). Determining the mechanism by which IGF1R is up-regulated in response to SRPK1 inhibition and how this impacts EGFR activity will be of particular interest, as both these receptors are frequently altered in EC. Several compensatory feedback mechanisms have been reported to regulate IGF1R signaling in cancer cells, including epigenetic and/or negative feedback phosphorylation events (69). Molecular characterization of the impact of SRPK1 inhibitors on these established IGF1R feedback responses should provide insight into the link between SRPK1 and EGF/IGF-1 signaling in EC cells.
Overexpression of EGFR, IGF1R and activation of AKT signaling frequently occurs in endometrial tumors and is associated with poor overall survival (58, 59, 70). However, single agent therapies targeting EGFR, IGF1R, or AKT have not shown therapeutic benefit in EC (2). Here, we observed drug synergy combining SRPK1 and EGFR, IGF1R, or AKT inhibitors in serous or endometrioid endometrial cancer cell lines. Our findings suggest blocking SRPK1 activity using the selective inhibitor SPHINX31 may provide more durable therapeutic responses than single agent EGFR, IGF1R, or AKT inhibitors in EC. Furthermore, our studies demonstrated SRPK1 was required to maintain growth and survival under nutrient-deprived conditions, suggesting SRPK1 may contribute to EGFR or IGF1R inhibitor resistance observed in EC cells. Additional studies investigating the impact of overexpression of SRPK1 WT or kinase-dead mutants in EC cells on EGFR, IGF1R, or AKT inhibitor sensitivity could provide insight into the role of SRPK1 in resistance these inhibitors. Furthermore, determining the in vivo efficacy of SRPK1 inhibitors alone or in combination with EGFR, IGF1R, or AKT inhibitors in EC tumor models, as well as the potential cytotoxic effects of these combinations will be essential for therapeutic proof-of-concept.
Together, profiling endometrial tumors using MIB-MS in combination with loss-of-function studies led to the discovery of SRPK1 as an integral kinase regulating mRNA splicing in EC cells, as well as cell proliferation and survival under nutrient deprivation. Moreover, dual blockade of SRPK1 and EGFR, IGF1R, or AKT synergized to block growth and survival providing more durable therapeutic response than single agent therapies. As several inhibitors targeting EGFR, IGF1R, or AKT are avidly being explored in clinical trials, our findings support the addition of SRPK1 inhibitors to improve anti-tumor responses for the treatment of EC.
DATA AVAILABILITY
All relevant proteomics files are available through the PRIDE partner repository (http://www.ebi.ac.uk) with the data set identifier PXD020357. Annotated spectra for each proteomics data set have been deposited in MS-Viewer (http://msviewer.ucsf.edu/prospector/cgi-bin/msform.cgi?form=msviewer), the search keys are provided in Data File S13. The BioProject ID number for the mRNA sequencing data reported in this paper is PRJNA608466 (https://www.ncbi.nlm.nih.gov/bioproject/?term=PRJNA608466). All other data needed to evaluate the conclusion in the paper are present in the paper or the supplemental material.
Supplementary Material
Acknowledgments
We thank Chunxiao Zhou (University of North Carolina) for providing the SPEC-2 cell line.
Competing interests—J.S.D. is an inventor on International patent application PCT/US2019/048053 for using multiplexed inhibitor beads for measuring kinase levels in patient tumors. The other authors declare that they have no competing interests.
Footnotes
This article contains supplemental data.
Funding and additional information—This work was supported by grants from National Institutes of Health CORE Grant CA06927 (Fox Chase Cancer Center), R01 CA211670 (J.S.D.), National Institutes of Health T32 CA009035 (A.M.K) and generous donations from Peggy's Pathway for Women's Cancer Care (https://www.peggyspathway.com/). Kinome profiling studies were funded by the Cancer Kinome Initiative (CKI) at FCCC, which was established by a donation from Don Morel.
Conflict of interest—The authors declare that they have no conflicts of interest with the contents of this article.
Abbreviations—The abbreviations used are:
- EC
- Endometrial carcinoma
- MIB-MS
- multiplexed inhibitor beads and mass spectrometry
- SRPK1
- Serine/Arginine-Rich Splicing Factor Kinase 1
- IHC
- immunohistochemical
- USC
- uterine serous cancer
- IGV
- Integrative Genomics Viewer.
REFERENCES
- 1. Siegel R. L., Miller K. D., and Jemal A. (2016) Cancer statistics, 2016. CA Cancer J. Clin. 66, 7–30 [DOI] [PubMed] [Google Scholar]
- 2. Remmerie M., and Janssens V. (2018) Targeted Therapies in Type II Endometrial Cancers: Too Little, but Not Too Late. Int. J. Mol. Sci. 19 [DOI] [PMC free article] [PubMed] [Google Scholar]
- 3. Black J. D., English D. P., Roque D. M., and Santin A. D. (2014) Targeted therapy in uterine serous carcinoma: an aggressive variant of endometrial cancer. Womens Health (Lond) 10, 45–57 [DOI] [PMC free article] [PubMed] [Google Scholar]
- 4. Ueda S. M., Kapp D. S., Cheung M. K., Shin J. Y., Osann K., Husain A., Teng N. N., Berek J. S., and Chan J. K. (2008) Trends in demographic and clinical characteristics in women diagnosed with corpus cancer and their potential impact on the increasing number of deaths. Am. J. Obstet. Gynecol. 198, 218, e211–e216 [DOI] [PubMed] [Google Scholar]
- 5. Hecht J. L., and Mutter G. L. (2006) Molecular and pathologic aspects of endometrial carcinogenesis. J. Clin. Oncol. 24, 4783–4791 [DOI] [PubMed] [Google Scholar]
- 6. Kuhn E., Wu R. C., Guan B., Wu G., Zhang J., Wang Y., Song L., Yuan X., Wei L., Roden R. B., Kuo K. T., Nakayama K., Clarke B., Shaw P., Olvera N., Kurman R. J., Levine D. A., Wang T. L., and Shih Ie M. (2012) Identification of molecular pathway aberrations in uterine serous carcinoma by genome-wide analyses. J. Natl. Cancer Inst. 104, 1503–1513 [DOI] [PMC free article] [PubMed] [Google Scholar]
- 7. Mitamura T., Dong P., Ihira K., Kudo M., and Watari H. (2019) Molecular-targeted therapies and precision medicine for endometrial cancer. Jap. J. Clin. Oncol. 49, 108–120 [DOI] [PubMed] [Google Scholar]
- 8. Wilson L. J., Linley A., Hammond D. E., Hood F. E., Coulson J. M., MacEwan D. J., Ross S. J., Slupsky J. R., Smith P. D., Eyers P. A., and Prior I. A. (2018) New perspectives, opportunities, and challenges in exploring the human protein kinome. Cancer Res. 78, 15–29 [DOI] [PubMed] [Google Scholar]
- 9. Metz J. T., Johnson E. F., Soni N. B., Merta P. J., Kifle L., and Hajduk P. J. (2011) Navigating the kinome. Nat. Chem. Biol. 7, 200–202 [DOI] [PubMed] [Google Scholar]
- 10. Knight Z. A., Lin H., and Shokat K. M. (2010) Targeting the cancer kinome through polypharmacology. Nat. Rev. Cancer 10, 130–137 [DOI] [PMC free article] [PubMed] [Google Scholar]
- 11. Roskoski R. (2020) Properties of FDA-approved small molecule protein kinase inhibitors: A 2020 update. Pharmacol. Res. 152, 104609. [DOI] [PubMed] [Google Scholar]
- 12. Knapp S., Arruda P., Blagg J., Burley S., Drewry D. H., Edwards A., Fabbro D., Gillespie P., Gray N. S., Kuster B., Lackey K. E., Mazzafera P., Tomkinson N. C. O., Willson T. M., Workman P., and Zuercher W. J. (2013) A public-private partnership to unlock the untargeted kinome. Nat. Chem. Biol. 9, 3–6 [DOI] [PubMed] [Google Scholar]
- 13. Fedorov O., Muller S., and Knapp S. (2010) The (un)targeted cancer kinome. Nat. Chem. Biol. 6, 166–169 [DOI] [PubMed] [Google Scholar]
- 14. Drewry D. H., Wells C. I., Andrews D. M., Angell R., Al-Ali H., Axtman A. D., Capuzzi S. J., Elkins J. M., Ettmayer P., Frederiksen M., Gileadi O., Gray N., Hooper A., Knapp S., Laufer S., Luecking U., Michaelides M., Müller S., Muratov E., Denny R. A., Saikatendu K. S., Treiber D. K., Zuercher W. J., and Willson T. M. (2017) Progress towards a public chemogenomic set for protein kinases and a call for contributions. PLoS ONE 12, e0181585. [DOI] [PMC free article] [PubMed] [Google Scholar]
- 15. Scholl C., Fröhling S., Dunn I. F., Schinzel A. C., Barbie D. A., Kim S. Y., Silver S. J., Tamayo P., Wadlow R. C., Ramaswamy S., Döhner K., Bullinger L., Sandy P., Boehm J. S., Root D. E., Jacks T., Hahn W. C., and Gilliland D. G. (2009) Synthetic lethal interaction between oncogenic KRAS dependency and STK33 suppression in human cancer cells. Cell 137, 821–834 [DOI] [PubMed] [Google Scholar]
- 16. Barbie D. A., Tamayo P., Boehm J. S., Kim S. Y., Moody S. E., Dunn I. F., Schinzel A. C., Sandy P., Meylan E., Scholl C., Frohling S., Chan E. M., Sos M. L., Michel K., Mermel C., Silver S. J., Weir B. A., Reiling J. H., Sheng Q., Gupta P. B., Wadlow R. C., Le H., Hoersch S., Wittner B. S., Ramaswamy S., Livingston D. M., Sabatini D. M., Meyerson M., Thomas R. K., Lander E. S., Mesirov J. P., Root D. E., Gilliland D. G., Jacks T., and Hahn W. C. (2009) Systematic RNA interference reveals that oncogenic KRAS-driven cancers require TBK1. Nature 462, 108–112 [DOI] [PMC free article] [PubMed] [Google Scholar]
- 17. Bantscheff M., Eberhard D., Abraham Y., Bastuck S., Boesche M., Hobson S., Mathieson T., Perrin J., Raida M., Rau C., Reader V., Sweetman G., Bauer A., Bouwmeester T., Hopf C., Kruse U., Neubauer G., Ramsden N., Rick J., Kuster B., and Drewes G. (2007) Quantitative chemical proteomics reveals mechanisms of action of clinical ABL kinase inhibitors. Nat. Biotechnol. 25, 1035–1044 [DOI] [PubMed] [Google Scholar]
- 18. Duncan J. S., Whittle M. C., Nakamura K., Abell A. N., Midland A. A., Zawistowski J. S., Johnson N. L., Granger D. A., Jordan N. V., Darr D. B., Usary J., Kuan P.-F., Smalley D. M., Major B., He X., Hoadley K. A., Zhou B., Sharpless N. E., Perou C. M., Kim W. Y., Gomez S. M., Chen X., Jin J., Frye, Stephen V., Earp H. S., Graves L. M., and Johnson G. L. (2012) Dynamic reprogramming of the kinome in response to targeted MEK inhibition in triple-negative breast cancer. Cell 149, 307–321 [DOI] [PMC free article] [PubMed] [Google Scholar]
- 19. Franks C. E., and Hsu K.-L. (2019) Activity-based kinome profiling using chemical proteomics and ATP acyl phosphates. Curr. Protoc. Chem. Biol. 11, e72. [DOI] [PMC free article] [PubMed] [Google Scholar]
- 20. Klaeger S., Heinzlmeir S., Wilhelm M., Polzer H., Vick B., Koenig P.-A., Reinecke M., Ruprecht B., Petzoldt S., Meng C., Zecha J., Reiter K., Qiao H., Helm D., Koch H., Schoof M., Canevari G., Casale E., Depaolini S. R., Feuchtinger A., Wu Z., Schmidt T., Rueckert L., Becker W., Huenges J., Garz A.-K., Gohlke B.-O., Zolg D. P., Kayser G., Vooder T., Preissner R., Hahne H., Tõnisson N., Kramer K., Götze K., Bassermann F., Schlegl J., Ehrlich H.-C., Aiche S., Walch A., Greif P. A., Schneider S., Felder E. R., Ruland J., Médard G., Jeremias I., Spiekermann K., and Kuster B. (2017) The target landscape of clinical kinase drugs. Science 358, eaan4368. [DOI] [PMC free article] [PubMed] [Google Scholar]
- 21. Geiger T., Cox J., Ostasiewicz P., Wisniewski J. R., and Mann M. (2010) Super-SILAC mix for quantitative proteomics of human tumor tissue. Nat. Methods 7, 383–385 [DOI] [PubMed] [Google Scholar]
- 22. Deeb S. J., D'Souza R. C. J., Cox J., Schmidt-Supprian M., and Mann M. (2012) Super-SILAC allows classification of diffuse large B-cell lymphoma subtypes by their protein expression profiles. Mol. Cell. Proteomics 11, 77–89 [DOI] [PMC free article] [PubMed] [Google Scholar]
- 23. Zhang W., Wei Y., Ignatchenko V., Li L., Sakashita S., Pham N.-A., Taylor P., Tsao M. S., Kislinger T., and Moran M. F. (2014) Proteomic profiles of human lung adeno and squamous cell carcinoma using super-SILAC and label-free quantification approaches. Proteomics 14, 795–803 [DOI] [PubMed] [Google Scholar]
- 24. Kurimchak A. M., Herrera-Montávez C., Brown J., Johnson K. J., Sodi V., Srivastava N., Kumar V., Deihimi S., O'Brien S., Peri S., Mantia-Smaldone G. M., Jain A., Winters R. M., Cai K. Q., Chernoff J., Connolly D. C., and Duncan J. S. (2020) Functional proteomics interrogation of the kinome identifies MRCKA as a therapeutic target in high-grade serous ovarian carcinoma. Sci. Signal. 13, eaax8238. [DOI] [PMC free article] [PubMed] [Google Scholar]
- 25. Gunawardena H. P., O'Brien J., Wrobel J. A., Xie L., Davies S. R., Li S., Ellis M. J., Qaqish B. F., and Chen X. (2016) QuantFusion: novel unified methodology for enhanced coverage and precision in quantifying global proteomic changes in whole tissues. Mol. Cell. Proteomics 15, 740–751 [DOI] [PMC free article] [PubMed] [Google Scholar]
- 26. Cox J., Hein M. Y., Luber C. A., Paron I., Nagaraj N., and Mann M. (2014) Accurate proteome-wide label-free quantification by delayed normalization and maximal peptide ratio extraction, termed MaxLFQ. Mol. Cell. Proteomics 13, 2513–2526 [DOI] [PMC free article] [PubMed] [Google Scholar]
- 27. Neubert T. A., and Tempst P. (2010) Super-SILAC for tumors and tissues. Nat. Meth. 7, 361–362 [DOI] [PubMed] [Google Scholar]
- 28. Anastassiadis T., Deacon S. W., Devarajan K., Ma H., and Peterson J. R. (2011) Comprehensive assay of kinase catalytic activity reveals features of kinase inhibitor selectivity. Nat. Biotech. 29, 1039–1045 [DOI] [PMC free article] [PubMed] [Google Scholar]
- 29. Coscia F., Watters K. M., Curtis M., Eckert M. A., Chiang C. Y., Tyanova S., Montag A., Lastra R. R., Lengyel E., and Mann M. (2016) Integrative proteomic profiling of ovarian cancer cell lines reveals precursor cell associated proteins and functional status. Nat. Commun. 7, 12645. [DOI] [PMC free article] [PubMed] [Google Scholar]
- 30. Zhou Y., Zhou B., Pache L., Chang M., Khodabakhshi A. H., Tanaseichuk O., Benner C., and Chanda S. K. (2019) Metascape provides a biologist-oriented resource for the analysis of systems-level datasets. Nat. Commun. 10, 1523. [DOI] [PMC free article] [PubMed] [Google Scholar]
- 31. Dou Y., Kawaler E. A., Cui Zhou D., Gritsenko M. A., Huang C., Blumenberg L., Karpova A., Petyuk V. A., Savage S. R., Satpathy S., Liu W., Wu Y., Tsai C.-F., Wen B., Li Z., Cao S., Moon J., Shi Z., Cornwell M., Wyczalkowski M. A., Chu R. K., Vasaikar S., Zhou H., Gao Q., Moore R. J., Li K., Sethuraman S., Monroe M. E., Zhao R., Heiman D., Krug K., Clauser K., Kothadia R., Maruvka Y., Pico A. R., Oliphant A. E., Hoskins E. L., Pugh S. L., Beecroft S. J. I., Adams D. W., Jarman J. C., Kong A., Chang H.-Y., Reva B., Liao Y., Rykunov D., Colaprico A., Chen X. S., Czekański A., Jędryka M., Matkowski R., Wiznerowicz M., Hiltke T., Boja E., Kinsinger C. R., Mesri M., Robles A. I., Rodriguez H., Mutch D., Fuh K., Ellis M. J., DeLair D., Thiagarajan M., Mani D. R., Getz G., Noble M., Nesvizhskii A. I., Wang P., Anderson M. L., Levine D. A., Smith R. D., Payne S. H., Ruggles K. V., Rodland K. D., Ding L., Zhang B., Liu T., and Fenyö D. and Clinical Proteomic Tumor Analysis, C, (2020) Proteogenomic characterization of endometrial carcinoma. Cell 180, 729–748 [DOI] [PMC free article] [PubMed] [Google Scholar]
- 32. Ong S.-E., Blagoev B., Kratchmarova I., Kristensen D. B., Steen H., Pandey A., and Mann M. (2002) Stable isotope labeling by amino acids in cell culture, SILAC, as a simple and accurate approach to expression proteomics. Mol. Cell. Proteomics 1, 376–386 [DOI] [PubMed] [Google Scholar]
- 33. Kurimchak A. M., Shelton C., Duncan K. E., Johnson K. J., Brown J., O'Brien S., Gabbasov R., Fink L. S., Li Y., Lounsbury N., Abou-Gharbia M., Childers W. E., Connolly D. C., Chernoff J., Peterson J. R., and Duncan J. S. (2016) Resistance to BET bromodomain inhibitors is mediated by kinome reprogramming in ovarian cancer. Cell Reports 16, 1273–1286 [DOI] [PMC free article] [PubMed] [Google Scholar]
- 34. Shen S., Park J. W., Huang J., Dittmar K. A., Lu Z-X., Zhou Q., Carstens R. P., and Xing Y. (2012) MATS: a Bayesian framework for flexible detection of differential alternative splicing from RNA-Seq data. Nucleic Acids Res. 40, e61. [DOI] [PMC free article] [PubMed] [Google Scholar]
- 35. Falcon S., and Gentleman R. (2007) Using GOstats to test gene lists for GO term association. Bioinformatics 23, 257–258 [DOI] [PubMed] [Google Scholar]
- 36. Srinivasan D., Sims J. T., and Plattner R. (2008) Aggressive breast cancer cells are dependent on activated Abl kinases for proliferation, anchorage-independent growth and survival. Oncogene 27, 1095–1105 [DOI] [PubMed] [Google Scholar]
- 37. Cancer Genome Atlas Research N., Kandoth C., Schultz N., Cherniack A. D., Akbani R., Liu Y., Shen H., Robertson A. G., Pashtan I., Shen R., Benz C. C., Yau C., Laird P. W., Ding L., Zhang W., Mills G. B., Kucherlapati R., Mardis E. R., and Levine D. A, Cancer Genome Atlas Research Network, (2013) Integrated genomic characterization of endometrial carcinoma. Nature 497, 67–73 [DOI] [PMC free article] [PubMed] [Google Scholar]
- 38. Trapnell C., Roberts A., Goff L., Pertea G., Kim D., Kelley D. R., Pimentel H., Salzberg S. L., Rinn J. L., and Pachter L. (2012) Differential gene and transcript expression analysis of RNA-seq experiments with TopHat and Cufflinks. Nat. Protocols 7, 562–578 [DOI] [PMC free article] [PubMed] [Google Scholar]
- 39. Zhang Y., O'Leary M. N., Peri S., Wang M., Zha J., Melov S., Kappes D. J., Feng Q., Rhodes J., Amieux P. S., Morris D. R., Kennedy B. K., and Wiest D. L. (2017) Ribosomal proteins Rpl22 and Rpl22l1 control morphogenesis by regulating pre-mRNA splicing. Cell Reports 18, 545–556 [DOI] [PMC free article] [PubMed] [Google Scholar]
- 40. Ianevski A., He L., Aittokallio T., and Tang J. (2017) SynergyFinder: a web application for analyzing drug combination dose-response matrix data. Bioinformatics (Oxford, England) 33, 2413–2415 [DOI] [PMC free article] [PubMed] [Google Scholar]
- 41. Savitski M. M., Zinn N., Faelth-Savitski M., Poeckel D., Gade S., Becher I., Muelbaier M., Wagner A. J., Strohmer K., Werner T., Melchert S., Petretich M., Rutkowska A., Vappiani J., Franken H., Steidel M., Sweetman G. M., Gilan O., Lam E. Y. N., Dawson M. A., Prinjha R. K., Grandi P., Bergamini G., and Bantscheff M. (2018) Multiplexed proteome dynamics profiling reveals mechanisms controlling protein homeostasis. Cell 173, 260–274 [DOI] [PMC free article] [PubMed] [Google Scholar]
- 42. Liu Y., Chanana P., Davila J. I., Hou X., Zanfagnin V., McGehee C. D., Goode E. L., Polley E. C., Haluska P., Weroha S. J., and Wang C. (2019) Gene expression differences between matched pairs of ovarian cancer patient tumors and patient-derived xenografts. Sci. Rep. 9, 6314. [DOI] [PMC free article] [PubMed] [Google Scholar]
- 43. Li M., Xin X., Wu T., Hua T., and Wang H. (2015) HGF and c-Met in pathogenesis of endometrial carcinoma. Front. Biosci. 20, 635–643 [DOI] [PubMed] [Google Scholar]
- 44. Kogata Y., Tanaka T., Ono Y. J., Hayashi M., Terai Y., and Ohmichi M. (2018) Foretinib (GSK1363089) induces p53-dependent apoptosis in endometrial cancer. Oncotarget 9, 22769–22784 [DOI] [PMC free article] [PubMed] [Google Scholar]
- 45. Colas E., Perez C., Cabrera S., Pedrola N., Monge M., Castellvi J., Eyzaguirre F., Gregorio J., Ruiz A., Llaurado M., Rigau M., Garcia M., Ertekin T., Montes M., Lopez-Lopez R., Carreras R., Xercavins J., Ortega A., Maes T., Rosell E., Doll A., Abal M., Reventos J., and Gil-Moreno A. (2011) Molecular markers of endometrial carcinoma detected in uterine aspirates. Int.J. Cancer 129, 2435–2444 [DOI] [PubMed] [Google Scholar]
- 46. Wang B.-D., and Lee N. H. (2018) Aberrant RNA Splicing in Cancer and Drug Resistance. Cancers (Basel) 10 [DOI] [PMC free article] [PubMed] [Google Scholar]
- 47. Bullock N., and Oltean S. (2017) The many faces of SRPK1. J. Pathol. 241, 437–440 [DOI] [PMC free article] [PubMed] [Google Scholar]
- 48. van Roosmalen W., Le Dévédec S. E., Golani O., Smid M., Pulyakhina I., Timmermans A. M., Look M. P., Zi D., Pont C., de Graauw M., Naffar-Abu-Amara S., Kirsanova C., Rustici G., Hoen P. A. C. T., Martens J. W. M., Foekens J. A., Geiger B., and van de Water B. (2015) Tumor cell migration screen identifies SRPK1 as breast cancer metastasis determinant. J. Clin. Investigation 125, 1648–1664 [DOI] [PMC free article] [PubMed] [Google Scholar]
- 49. Bullock N., Potts J., Simpkin A. J., Koupparis A., Harper S. J., Oxley J., and Oltean S. (2016) Serine-arginine protein kinase 1 (SRPK1), a determinant of angiogenesis, is upregulated in prostate cancer and correlates with disease stage and invasion. J. Clin. Pathol. 69, 171–175 [DOI] [PMC free article] [PubMed] [Google Scholar]
- 50. Batson J., Toop H. D., Redondo C., Babaei-Jadidi R., Chaikuad A., Wearmouth S. F., Gibbons B., Allen C., Tallant C., Zhang J., Du C., Hancox J. C., Hawtrey T., Da Rocha J., Griffith R., Knapp S., Bates D. O., and Morris J. C. (2017) Development of potent, selective SRPK1 inhibitors as potential topical therapeutics for neovascular eye disease. ACS Chem. Biol. 12, 825–832 [DOI] [PubMed] [Google Scholar]
- 51. Tzelepis K., De Braekeleer E., Aspris D., Barbieri I., Vijayabaskar M. S., Liu W.-H., Gozdecka M., Metzakopian E., Toop H. D., Dudek M., Robson S. C., Hermida-Prado F., Yang Y. H., Babaei-Jadidi R., Garyfallos D. A., Ponstingl H., Dias J. M. L., Gallipoli P., Seiler M., Buonamici S., Vick B., Bannister A. J., Rad R., Prinjha R. K., Marioni J. C., Huntly B., Batson J., Morris J. C., Pina C., Bradley A., Jeremias I., Bates D. O., Yusa K., Kouzarides T., and Vassiliou G. S. (2018) SRPK1 maintains acute myeloid leukemia through effects on isoform usage of epigenetic regulators including BRD4. Nat. Commun. 9, 5378–5378 [DOI] [PMC free article] [PubMed] [Google Scholar]
- 52. Lamers F., van der Ploeg I., Schild L., Ebus M. E., Koster J., Hansen B. R., Koch T., Versteeg R., Caron H. N., and Molenaar J. J. (2011) Knockdown of survivin (BIRC5) causes apoptosis in neuroblastoma via mitotic catastrophe. Endocrine-related Cancer 18, 657–668 [DOI] [PubMed] [Google Scholar]
- 53. Goel S., DeCristo M. J., McAllister S. S., and Zhao J. J. (2018) CDK4/6 Inhibition in cancer: beyond cell cycle arrest. Trends Cell Biol. 28, 911–925 [DOI] [PMC free article] [PubMed] [Google Scholar]
- 54. Lovly C. M., and Shaw A. T. (2014) Molecular pathways: resistance to kinase inhibitors and implications for therapeutic strategies. Clin. Cancer Res. 20, 2249–2256 [DOI] [PMC free article] [PubMed] [Google Scholar]
- 55. Wang P., Zhou Z., Hu A., Ponte de Albuquerque C., Zhou Y., Hong L., Sierecki E., Ajiro M., Kruhlak M., Harris C., Guan K.-L., Zheng Z.-M., Newton A. C., Sun P., Zhou H., and Fu X.-D. (2014) Both decreased and increased SRPK1 levels promote cancer by interfering with PHLPP-mediated dephosphorylation of Akt. Mol. Cell 54, 378–391 [DOI] [PMC free article] [PubMed] [Google Scholar]
- 56. Aubol B. E., Wu G., Keshwani M. M., Movassat M., Fattet L., Hertel K. J., Fu X.-D., and Adams J. A. (2016) Release of SR proteins from CLK1 by SRPK1: a symbiotic kinase system for phosphorylation control of pre-mRNA splicing. Mol. Cell 63, 218–228 [DOI] [PMC free article] [PubMed] [Google Scholar]
- 57. Uzor S., Zorzou P., Bowler E., Porazinski S., Wilson I., and Ladomery M. (2018) Autoregulation of the human splice factor kinase CLK1 through exon skipping and intron retention. Gene 670, 46–54 [DOI] [PubMed] [Google Scholar]
- 58. Konecny G. E., Venkatesan N., Yang G., Dering J., Ginther C., Finn R., Rahmeh M., Fejzo M. S., Toft D., Jiang S. W., Slamon D. J., and Podratz K. C. (2008) Activity of lapatinib a novel HER2 and EGFR dual kinase inhibitor in human endometrial cancer cells. Br. J. Cancer 98, 1076–1084 [DOI] [PMC free article] [PubMed] [Google Scholar]
- 59. Bruchim I., Sarfstein R., and Werner H. (2014) The IGF hormonal network in endometrial cancer: functions, regulation, and targeting approaches. Front. Endocrinol. (Lausanne) 5, 76. [DOI] [PMC free article] [PubMed] [Google Scholar]
- 60. Zawistowski J. S., Bevill S. M., Goulet D. R., Stuhlmiller T. J., Beltran A. S., Olivares-Quintero J. F., Singh D., Sciaky N., Parker J. S., Rashid N. U., Chen X., Duncan J. S., Whittle M. C., Angus S. P., Velarde S. H., Golitz B. T., He X., Santos C., Darr D. B., Gallagher K., Graves L. M., Perou C. M., Carey L. A., Earp H. S., and Johnson G. L. (2017) Enhancer remodeling during adaptive bypass to MEK inhibition is attenuated by pharmacologic targeting of the P-TEFb complex. Cancer Discovery 7, 302–321 [DOI] [PMC free article] [PubMed] [Google Scholar]
- 61. Krey J. F., Wilmarth P. A., Shin J.-B., Klimek J., Sherman N. E., Jeffery E. D., Choi D., David L. L., and Barr-Gillespie P. G. (2014) Accurate label-free protein quantitation with high- and low-resolution mass spectrometers. J. Proteome Res. 13, 1034–1044 [DOI] [PMC free article] [PubMed] [Google Scholar]
- 62. Ruprecht B., Zecha J., Heinzlmeir S., Médard G., Lemeer S., and Kuster B. (2015) Evaluation of kinase activity profiling using chemical proteomics. ACS Chem. Biol. 10, 2743–2752 [DOI] [PubMed] [Google Scholar]
- 63. Charo L. M., and Plaxe S. C. (2019) Recent advances in endometrial cancer: a review of key clinical trials from 2015 to 2019. F1000Res. 8, F1000 Faculty Rev [DOI] [PMC free article] [PubMed] [Google Scholar]
- 64. Gammons M. V., Lucas R., Dean R., Coupland S. E., Oltean S., and Bates D. O. (2014) Targeting SRPK1 to control VEGF-mediated tumour angiogenesis in metastatic melanoma. Br. J. Cancer 111, 477–485 [DOI] [PMC free article] [PubMed] [Google Scholar]
- 65. Xu X., Wei Y., Wang S., Luo M., and Zeng H. (2017) Serine-arginine protein kinase 1 (SRPK1) is elevated in gastric cancer and plays oncogenic functions. Oncotarget 8, 61944–61957 [DOI] [PMC free article] [PubMed] [Google Scholar]
- 66. Zhou Z., Qiu J., Liu W., Zhou Y., Plocinik R. M., Li H., Hu Q., Ghosh G., Adams J. A., Rosenfeld M. G., and Fu X.-D. (2012) The Akt-SRPK-SR axis constitutes a major pathway in transducing EGF signaling to regulate alternative splicing in the nucleus. Mol. Cell 47, 422–433 [DOI] [PMC free article] [PubMed] [Google Scholar]
- 67. Hertz N. T., Wang B. T., Allen J. J., Zhang C., Dar A. C., Burlingame A. L., and Shokat K. M. (2010) Chemical genetic approach for kinase-substrate mapping by covalent capture of thiophosphopeptides and analysis by mass spectrometry. Curr. Protoc. Chem. Biol. 2, 15–36 [DOI] [PMC free article] [PubMed] [Google Scholar]
- 68. Veeken J. V D., Oliveira S., Schiffelers R. M., Storm G., van Bergen En Henegouwen P. M., and Roovers R. C. (2009) Crosstalk between epidermal growth factor receptor- and insulin-like growth factor-1 receptor signaling: implications for cancer therapy. Current Cancer Drug Targets 9, 748–760 [DOI] [PubMed] [Google Scholar]
- 69. Simpson A., Petnga W., Macaulay V. M., Weyer-Czernilofsky U., and Bogenrieder T. (2017) Insulin-like growth factor (IGF) pathway targeting in cancer: role of the IGF axis and opportunities for future combination studies. Targeted Oncol. 12, 571–597 [DOI] [PMC free article] [PubMed] [Google Scholar]
- 70. Roncolato F., Lindemann K., Willson M. L., Martyn J., and Mileshkin L. (2019) PI3K/AKT/mTOR inhibitors for advanced or recurrent endometrial cancer. Cochrane Database of Systematic Reviews [DOI] [PMC free article] [PubMed] [Google Scholar]
Associated Data
This section collects any data citations, data availability statements, or supplementary materials included in this article.
Supplementary Materials
Data Availability Statement
All relevant proteomics files are available through the PRIDE partner repository (http://www.ebi.ac.uk) with the data set identifier PXD020357. Annotated spectra for each proteomics data set have been deposited in MS-Viewer (http://msviewer.ucsf.edu/prospector/cgi-bin/msform.cgi?form=msviewer), the search keys are provided in Data File S13. The BioProject ID number for the mRNA sequencing data reported in this paper is PRJNA608466 (https://www.ncbi.nlm.nih.gov/bioproject/?term=PRJNA608466). All other data needed to evaluate the conclusion in the paper are present in the paper or the supplemental material.