

Major depressive disorder is linked with disturbances of gut bacterial, viral, and metabolic signatures.
Abstract
Gut microbiome disturbances have been implicated in major depressive disorder (MDD). However, little is known about how the gut virome, microbiome, and fecal metabolome change, and how they interact in MDD. Here, using whole-genome shotgun metagenomic and untargeted metabolomic methods, we identified 3 bacteriophages, 47 bacterial species, and 50 fecal metabolites showing notable differences in abundance between MDD patients and healthy controls (HCs). Patients with MDD were mainly characterized by increased abundance of the genus Bacteroides and decreased abundance of the genera Blautia and Eubacterium. These multilevel omics alterations generated a characteristic MDD coexpression network. Disturbed microbial genes and fecal metabolites were consistently mapped to amino acid (γ-aminobutyrate, phenylalanine, and tryptophan) metabolism. Furthermore, we identified a combinatorial marker panel that robustly discriminated MDD from HC individuals in both the discovery and validation sets. Our findings provide a deep insight into understanding of the roles of disturbed gut ecosystem in MDD.
INTRODUCTION
Major depressive disorder (MDD) is a common and debilitating mental disorder (1, 2). Currently, the underlying molecular basis of MDD remains mostly obscure, although several hypotheses have attempted to explain its pathophysiological mechanisms (3). Moreover, because of the lack of biomarkers, MDD diagnosis is still based on clinical interviews, which results in a high rate of misdiagnosis (4). Thus, it is critical to identify the molecular basis and new diagnostic biomarkers for MDD.
The gut microbiome, a vital and direct environmental contributor to central nervous system development, consists of a vast bacterial and viral community that can significantly influence host health and disease (5, 6). The gut bacterial microbiome has gained the greatest attention. It has been hypothesized to play a critical role in the onset of various neuropsychiatric disorders such as Parkinson’s disease, autism, and bipolar disorder (7–10), via the “microbiota-gut-brain” axis (11). Disturbances in the gut bacterial microbiome in MDD have been observed in prior studies using the 16S ribosomal RNA (rRNA) sequencing method (12, 13). Moreover, using fecal transplantation experiments, two studies have further shown that transplanting the “MDD microbiota” into germ-free mice or microbiota-depleted rats can induce depression-like behaviors in recipient animals, which clarifies a causal role of gut microbiome in MDD onset (14, 15).
However, several pivotal questions are not clearly and comprehensively elaborated. The previous studies focused on characterizing the bacterial microbial composition of MDD using the 16S rRNA sequencing method. Such investigations demonstrated a valuable clinical association between a disturbed gut microbiome and MDD. However, because of the relatively limited resolution of this method, it was impossible to obtain information on the definitive bacterial species of MDD. Two recent studies tried to address this issue using the shotgun metagenomic method (16, 17). One study has a limited sample size (MDD, n = 26) and included patients with MDD who were taking various antidepressant drugs, which may affect the microbial composition. The other study focused on identification of microbial signatures for general practitioner–reported depression (17), showing that genera Coprococcus and Dialister were depleted in unmedicated patients with depression. In addition, some microbial pathways such as γ-aminobutyric acid (GABA) synthesis were disturbed in depression, which guides the researchers to comprehensively understand the gut microbial function in MDD. Last, although the gut virome is generally considered inclusively within the concept of a gut “microbiome,” relatively few studies have looked specifically at the gut virome composition in various disease states (18, 19). Emerging pioneering studies have shown that the enteric virome, which is mainly composed of bacteriophages, could regulate bacterial microbial composition, profoundly influence host physiology, and contribute to disease development such as inflammatory bowel diseases and colorectal cancer (18, 19). However, thus far, no research has been conducted to explore whether MDD is accompanied by enteric virome disturbances.
To bridge the above-mentioned knowledge gaps, we performed a cross-sectional whole-genome shotgun metagenomics analysis of 311 fecal samples from patients with MDD and healthy controls (HCs) to characterize the signatures of gut bacteriophages and bacteria as well as their functional potential. Fecal metabolomics is considered as the functional readout of the gut microbiome (20). Combination of metagenomic and metabolic analyses is a well-established strategy for uncovering both the taxonomic and functional features of the gut microbiome (21). Thus, in parallel with metagenomic analysis, gas chromatography–mass spectrometry (GC-MS)–based fecal metabolomics analysis was also performed. Integrating these multilevel omics findings, we sought to characterize the landscapes of altered bacteriophages, bacteria, and fecal metabolites, and their reciprocal interaction in the gut ecosystem of MDD to further uncover how these disturbed signatures modulated host metabolism. Last, on the basis of the multiparametric markers, a combinatorial biomarker panel discriminating between MDD and HCs was identified and independently confirmed in the discovery and the validation sets, respectively.
RESULTS
Clinical characteristics of the participants
Here, we performed an integrated analysis of the gut virome, bacterial microbiome, and fecal metabolome on 311 samples from the MDD and HC groups. These samples were derived from the discovery (n = 236) and validation sets (n = 75). In the discovery set, all the patients with MDD were unmedicated, and there was no significant difference in demographic indexes, including gender, age, or body mass index (BMI) between the two groups. These well-matched samples were used to identify molecular signatures inherent in MDD. In contrast, to independently verify the diagnostic generalizability of these markers, the clinical characteristics of samples in the validation set were relatively diverse and not completely matched (table S1).
Gut bacteria differences between MDD and HC subjects
We obtained an average of 15,024,809,536 bases per sample from the whole-genome shotgun sequencing of 311 fecal samples. Initially, bacterial α-diversity analysis showed that there was no significant difference among these indexes between the two groups (Fig. 1A). Then, we sought to explore whether the overall bacterial phenotypes of patients with MDD and HC subjects were different. Principal coordinates analysis (PCoA) showed that bacterial signatures between the two groups were significantly distinct [permutational multivariate analysis of variance (PERMANOVA), P = 0.003; Fig. 1B]. Here, we identified a total of 47 discriminative bacterial species between the MDD and HC groups (Fig. 2A and table S2). Compared with HCs, MDD subjects were characterized by 18 enriched species mainly belonging to the genus Bacteroides (10 species: Bacteroides_thetaiotaomicron, Bacteroides_stercoris, Bacteroides_stercoris_CAG:120, Bacteroides_fragilis, Bacteroides_massiliensis, Bacteroides_dorei, Bacteroides_vulgatus, Bacteroides_ovatus, Bacteroides_eggerthii, and unclassified_g_Bacteroides) and by 29 depleted species mainly belonging to the genus Blautia (5 species: Blautia_obeum, Blautia_sp._GD8, Blautia_wexlerae, Blautia_sp._Marseille-P2398, and Blautia_sp._CAG:237), Eubacterium (5 species: Eubacterium_sp._CAG:202, Eubacterium_sp._CAG:156, Eubacterium_hallii, Eubacterium_hallii_CAG:12, and Eubacterium_ventriosum), and Clostridium (3 species: Clostridium_sp._CAG:217, Clostridium_sp._CAG:510, and Clostridium_sp._CAG:62). The majority of the up-regulated species in MDD belonged to the phylum Bacteroidetes (12 of 18), whereas the major down-regulated species in MDD belonged to the phylum Firmicutes (25 of 29) relative to HCs.
Fig. 1. Gut microbiome characteristics in MDD versus HC.
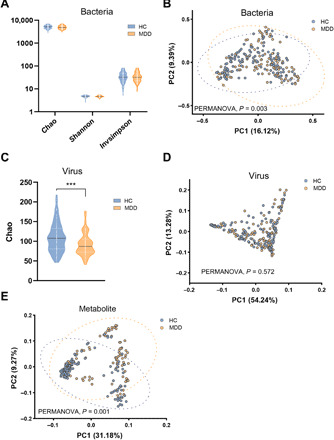
(A) There were no significance bacterial αaciversity differences between the two groups. (B) Bacterial signatures between the two groups were significantly different (Bray-Curtis distance, PERMANOVA, P = 0.003). (C) α-Phylogenetic diversity analysis of gut viromes showed that the index of Chao (community richness) was decreased in the MDD subjects relative to HCs. (D) Overall viral signatures of the MDD group were not significantly discriminated from the HC group (Bray-Curtis distance, PERMANOVA, P = 0.572). (E) Metabolic signatures of MDD subjects were significantly distinguished from HCs (Bray-Curtis distance, PERMANOVA, P = 0.001). Discovery set: HC, n = 118; MDD, n = 118. ***P < 0.001.
Fig. 2. The bacteriophages, bacterial species, and fecal metabolites that discriminate MDD from HC.
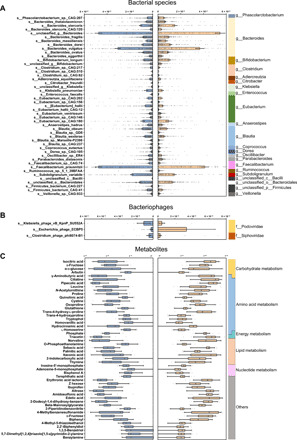
(A) Relative abundances of 47 bacterial species responsible for discriminating the MDD and HC groups. The taxonomic assignment of each species is shown on the left. At the genus level, the MDD subjects showed 18 enriched species, mainly belonging to the genus Bacteroides (10 species), and 29 depleted species mainly belonging to the genera Blautia (5 species), Eubacterium (5 species), and Clostridium (3 species). (B) Three bacteriophages, mainly assigned to Podoviridae at the family level, were differentially expressed in the MDD subjects relative to HCs. (C) Relative abundances of 50 fecal metabolites differentiating between the two groups. Compared with HC, the MDD group was characterized by 16 up-regulated metabolites and 34 down-regulated metabolites. These metabolites were mainly involved in amino acid, nucleotide, carbohydrate, and lipid metabolism. The discriminative variants (gut bacteriophages, bacterial species, and fecal metabolites) were identified on the basis of an LDA score >2.5. Discovery set: HC, n = 118; MDD, n = 118.
Bacteriophage differences between MDD and HC subjects
Metagenomic sequencing was also mapped to the known viral genomes National Center for Biotechnology Information (NCBI) non-redundant (NR) database. One α-phylogenetic diversity index (Chao) was decreased in MDD relative to HC subjects (Fig. 1C). PCoA showed that there was no major global alteration of gut virome between the two groups (PERMANOVA, P = 0.572; Fig. 1D), suggesting a limited number of differential viruses between MDD and HCs. As expected, only three differential bacteriophages were identified using the linear discriminant analysis effect size (LEfSe) analysis (Fig. 2B and table S3). Compared with HCs, patients with MDD had decreased abundances of Clostridium_phage_phi8074-B1 and Klebsiella_phage_vB_KpnP_SU552A, as well as increased abundance of Escherichia_phage_ECBP5. These three differential bacteriophages were consistently assigned to the Caudovirales order. With regard to detected fungi and protozoa, we did not identify any differences between the MDD and HC groups (table S4).
Altered fecal metabolites in MDD
The fecal metabolome can provide the functional readout of the gut microbiome. GC-MS–based metabolomic analysis was simultaneously applied to compare the metabolic signatures between the MDD and HC groups. The overall metabolic signatures of MDD were significantly different with that in HCs (PERMANOVA, P = 0.001; Fig. 1E). Compared with the HC group, the MDD group displayed enrichment in 16 metabolites and depletion in 34 metabolites (Fig. 2C and table S5). These altered metabolites were mainly involved in amino acid metabolism (pipecolic acid, homoserine, N-acetylornithine, proline, quinolinic acid, cystine, oxoproline, GABA, tryptophol, homovanillic acid, hydrocinnamic acid, leucine, and trans-4-hydroxy-l-proline), nucleotide metabolism, carbohydrate metabolism, and lipid metabolism.
Co-occurrence analysis among the bacteriophages, bacteria, and metabolites
We next explored the potential correlations of abundances of these differential gut bacteriophages, bacterial species, and fecal metabolites. Overall, co-occurrence analysis showed that bacterial species formed strong and broad co-occurring relationships with fecal metabolites; the bacteriophages showed a mild correlation with both the bacterial species and fecal metabolites (Fig. 3). Within this coexpression network, these differential bacterial species mainly generated three covarying clusters (clusters 1 to 3). In the MDD group relative to the HC group, cluster 1 was composed of eight enriched bacterial species belonging to the genus Bacteroides; cluster 2 mainly comprised five depleted species belonging to the genus Blautia; and cluster 3 contained two up-regulated and four down-regulated species that were assigned to the genus Eubacterium.
Fig. 3. A co-occurrence network constructed from the relative abundances of differential bacteriophages, bacterial species, and fecal metabolites in MDD subjects versus HCs.
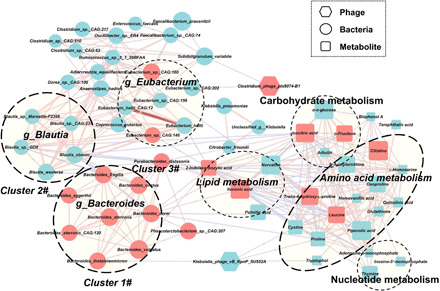
The differential bacterial species mainly generated three covarying units (clusters 1 to 3). Cluster 1 was composed of eight enriched species belonging to the genus Bacteroides (Bacteroides_stercoris_CAG:120, Bacteroides_stercoris, Bacteroides_dorei, Bacteroides_vulgatus, Bacteroides_fragilis, Bacteroides_thetaiotaomicron, Bacteroides_eggerthii, and Bacteroides_ovatus) in MDD subjects compared with HCs. Cluster 2 comprised five depleted species belonging to the genus Blautia (Blautia_obeum, Blautia_sp._GD8, Blautia_wexlerae, Blautia_sp._Marseille-P2398, and Blautia_sp._CAG:237). Within cluster 1 or 2, each bacterial species positively correlated with each other. In contrast, some members from cluster 1 (Bacteroides_fragilis) showed negative correlations with the members from the cluster 2 (Blautia_obeum and Blautia_sp._GD8). For bacteriophages, Klebsiella_phage_vB_KpnP_SU552A was positively correlated with one species of genus Bacteroides in cluster 1. Another bacteriophage, Clostridium_phage_phi8074-B1, showed positive correlations with two bacterial species (Subdoligranulum_variabile and Eubacterium_sp._CAG:202). Klebsiella_phage_vB_KpnP_SU552A was also negatively correlated with three metabolites (proline, cysteine, and tryptophol) belonging to amino acid metabolism. In this network, these altered metabolites were mainly involved in amino acid metabolism. Size of the nodes represents the abundance of these variables. Red and blue dots indicate the increased and decreased relative abundances of variables in MDD subjects relative to HCs, respectively. Bacterial species annotated to the genus level are marked. Edges between nodes indicate Spearman’s negative (light blue) or positive (light red) correlation; edge thickness indicates range of P value (P < 0.05).
We found that members within cluster 1 or cluster 2 were positively correlated to each other. In contrast, some members from cluster 1 showed negative correlations with the members from cluster 2. For example, Bacteroides_fragilis displayed negative correlations with both Blautia_obeum and Blautia_sp._GD8. Clusters 1 and 2 were linked by a common node (Parabacteroides_distasonis). All cluster 1 members were positively correlated with Parabacteroides_distasonis, yet two cluster 2 members showed negative correlations with this node. These findings suggest that these key differential bacterial species may form synergistic and niche-related relationships in patients with MDD.
For the bacteriophages, we found that Klebsiella_phage_vB_KpnP_SU552A was positively correlated with one species of the genus Bacteroides (Bacteroides_thetaiotaomicron) in cluster 1. Another bacteriophage, Clostridium_phage_phi8074-B1, showed positive correlations with two species (Subdoligranulum_variabile and Eubacterium_sp._CAG:202). Moreover, we found that Klebsiella_phage_vB_KpnP_SU552A was also negatively correlated with proline, cysteine, and tryptophol, three amino acid metabolites. Meanwhile, we found that microbial clusters 1 and 2 were mainly correlated with fecal metabolites belonging to the amino acid metabolism (proline, leucine, and trans-4-hydroxy-l-proline) through some node species (e.g., Parabacteroides_distasonis) and metabolites (e.g., isocitric acid and 2-indolecarboxylic acid). Thus, these characteristic coexpression networks generated another synergistic and niche-related relationship.
Alterations in microbial function and fecal metabolites in MDD
Here, we identified a total of 608 differential Kyoto Encyclopedia of Genes and Genomes (KEGG) orthology genes (KO genes) between the MDD and HC groups. These differential KO genes were mainly involved in nine biological processes (Fig. 4), especially the various metabolic pathways such as amino acid metabolism. Meanwhile, metabolomics analysis showed that patients with MDD were mainly characterized by disturbances of amino acid, carbohydrate, nucleotide, and lipid metabolism. Integration of these findings showed that disturbance of amino acid metabolism was of particular relevance to gut ecosystem of MDD.
Fig. 4. Biological processes enriched by differential microbial genes in MDD subjects (red) or HCs (green).
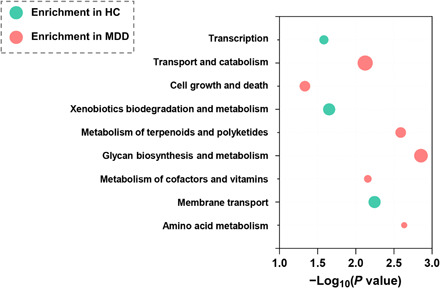
Abscissa variations indicate levels of significance; size of the nodes indicates the fold change.
We explored the direct roles of the gut microbiome in modulating fecal amino acid metabolism by mapping the differential enzyme commission numbers (ECs) to disturbed amino acid metabolism. In total, we identified 561 differential ECs in the patients with MDD relative to HCs. We found that these microbial genes and fecal metabolites were simultaneously related to “arginine, proline, and GABA metabolism” (Fig. 5A), “phenylalanine metabolism” (Fig. 5B), and “tryptophan metabolism” (Fig. 5C). Here, we found that the fecal levels of GABA and its relevant metabolites (N-acetylornithine, proline, oxoproline, and glutathione) were decreased in the MDD group relative to the HC group (Fig. 5A). In line with this finding, we also found that a microbial enzyme–related gene (BetB) involved in arginine metabolism to GABA was down-regulated in MDD. Meanwhile, three microbial genes (glsA, gltB, and GLT1) involved in the metabolism of glutamine to GABA were up-regulated in MDD (Fig. 5A). These findings suggest that fecal GABA level in the patients with MDD may be modulated by a panel of gut microbes, which may collectively participate in the development of MDD. Also, we found that the majority of genes (AOC3, hpaB, hpaE, and hpaG) involved in the phenylalanine catabolic pathways were decreased in the MDD group relative to HC group, suggesting an inhibition of fecal phenylalanine degradation in MDD. Consistent with this finding, the downstream catabolic product of homovanillate was also decreased in MDD (Fig. 5B). Furthermore, we observed that the gene (kynu) was enriched in MDD relative to HC subjects (Fig. 5C), which may result in increased synthesis of neurotoxic metabolite (quinolinic acid) relative to kynurenic acid. Meanwhile, lower stool quinolinic acid level was observed in the MDD group. These findings support that blood quinolinic acid level would be increased in MDD, which has been linked with MDD (22).
Fig. 5. Key amino acid metabolic pathways mapped by microbial genes and fecal metabolism in gut ecosystem of MDD.
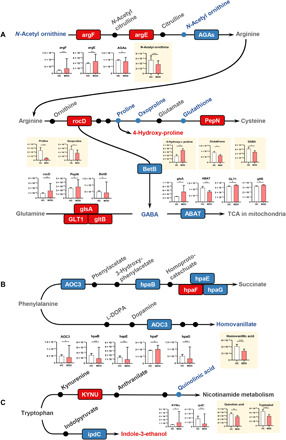
(A) Fecal levels of GABA and its relevant metabolites (N-acetylornithine, proline, oxoproline, and glutathione) were decreased in the MDD relative to the HC group. In addition, a microbial enzyme–related gene (BetB) that participated in arginine metabolism to GABA was down-regulated in MDD. Meanwhile, three microbial genes (glsA, gltB, and GLT1) involved in the metabolism of glutamine to GABA was up-regulated in MDD. (B) Microbial genes (AOC3, hpaB, hpaE, and hpaG) and metabolite (homovanillate) involved in the phenylalanine catabolic pathways were decreased in MDD relative to HCs, suggesting an inhibition of fecal phenylalanine degradation in MDD. (C) The gene (KYNU) involved in the metabolism of kynurenate to quinolinate was up-regulated in patients with MDD. Meanwhile, fecal quinolinate levels were down-regulated in MDD subjects relative to HCs. KEGG genes (squares) and metabolites are colored. Red indicates enriched microbial genes or fecal metabolites in the MDD group, and blue indicates enriched in the HC group. Fecal metabolites are colored gray, while no information was available. The pathways were generated on the basis of KEGG pathway maps. Bar plots show the relative abundances of differential microbial genes and fecal metabolites between two groups (*P < 0.05 and **P < 0.01; Wilcoxon rank-sum test).
Combinatorial biomarkers for discriminating MDD from HC
The potential value of gut metagenomic and metabolomic markers was investigated in MDD diagnosis using three types of diagnostic models based on differential bacteriophages, bacterial species, and fecal metabolites, respectively. Given that a diagnostic tool based on the quantification of a small number of parameters would be more feasible and economical in clinical practice, a fivefold cross-validation method was used to identify the representative variations, which could describe the most significant deviations between the MDD and HC groups. We found that individual marker panels could discriminate patients with MDD from HC subjects with an area under the curve (AUC) ranging from 0.77 to 0.93 (bacteriophages: Clostridium_phage_phi8074-B1 and Escherichia_phage_ECBP5, AUC = 0.77; bacterial species: unclassified Klebsiella and Eubacterium_sp._CAG:146, AUC = 0.89; and fecal metabolites: sebacic acid and 2-indolecarboxylic acid, AUC = 0.93; Fig. 6A).
Fig. 6. Multiple markers for diagnosis and disease severity of MDD.
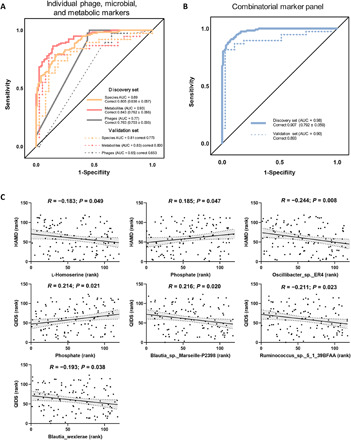
(A) Random forest analysis was used to quantify the diagnostic performance. In the discovery set, individual simplified signature could discriminate the two groups with area under the curve (AUC) ranging from 0.77 to 0.93 (bacteriophages: Clostridium_phage_phi8074-B1 and Escherichia_phage_ECBP5, AUC = 0.77; bacterial species: unclassified Klebsiella and Eubacterium_sp._CAG:146, AUC = 0.89; and fecal metabolites: sebacic acid and 2-indolecarboxylic acid, AUC = 0.93). Using samples from the validation set, the bacterial species and fecal metabolite markers could still effectively discriminate the two groups with AUC of 0.81 and 0.83, respectively. Using the bacteriophage markers alone, a relatively poor diagnostic performance was achieved (AUC = 0.65). (B) This combinatorial marker panel including these six markers yielded more robust diagnostic performance over that of separate bacteriophage or microbial or metabolic markers in both the discovery (AUC = 0.98; sensitivity, 95%, specificity, 87%; positive predictive value, 0.87; and negative predictive value, 0.95) and validation sets (AUC = 0.90; sensitivity, 97%, specificity, 87%; positive predictive value, 0.84; and negative predictive value, 0.97). (C) After adjusting for age and BMI by Spearman’s correlation analysis, 4 of the 47 species and 2 of the 50 metabolites were correlated with clinical scales reflecting disease severity of MDD using Spearman’s rank correlation analysis. HAMD, Hamilton Depression Rating Scale; QIDS, Quick Inventory of Depressive Symptomatology.
Then, the samples from the validation set were used to confirm the diagnostic performance independently. Consequently, we found that the marker panel of bacterial species and fecal metabolites could still effectively discriminate between the two groups with AUC of 0.81 and 0.83, respectively (Fig. 6A). A relatively poor diagnostic performance was achieved (AUC = 0.65) using the bacteriophage markers. However, we found that a combinatorial marker panel of these six biomarkers enabled discriminating MDD from HC subjects with high classification power in both the discovery (AUC = 0.98; sensitivity, 95%, specificity, 87%; positive predictive value, 0.87; and negative predictive value, 0.95) and validation sets (AUC = 0.90; sensitivity, 97%; specificity, 87%; positive predictive value, 0.84; and negative predictive value, 0.97) (Fig. 6B), yielding a more robust discriminative performance over that of the separate bacteriophage, microbial, or metabolic markers.
Multiple markers reflect MDD severity
We also sought to explore the correlations between these discriminative bacteriophages, bacterial species, and fecal metabolites, with MDD rating scales to identify the markers associated with disease severity. The Spearman’s rank correlation analysis showed that four bacterial species (Blautia_wexlerae, Blautia_sp._Marseille-P2398, Ruminococcus_sp._5_1_39BFAA, and Oscillibacter_sp._ER4) and two fecal metabolites (l-homoserine and phosphate), but not bacteriophages, were correlated with MDD severity (Fig. 6C).
DISCUSSION
In this study, we outlined landscapes and interaction networks of differential bacteriophages, bacterial species, and fecal metabolites in the MDD gut ecosystem. Disturbance of amino acid metabolism was a hallmark in the gut ecosystem of MDD. Moreover, we identified and independently validated a combinatorial marker panel that could distinguish MDD from HC subjects with high accuracy. Our findings lay the foundation for understanding the roles of the overall gut ecosystem in MDD pathogenesis and may facilitate developing objective MDD diagnostic methods.
Previous gut microbiome studies in depression have always focused on identifying differential bacteria with a phylogenetic resolution to the genus or family level (12, 13). For example, using 16S rRNA sequencing method, we found that MDD was characterized by enriched family Bacteroidaceae relative to bipolar disorder and HCs. In this study, we found that the bacterial composition of MDD was different from that in HCs. This discrimination was not significantly influenced by potential confounding variables (dietary preference and smoking; table S6). Moreover, our metagenomic analysis identified 47 bacterial species linked with MDD. This step is a prerequisite for screening the key species associated with depression onset and identifying diagnostic markers for clinical applications. We found that enriched species characterized patients with MDD mainly belonged to genus Bacteroides, and depleted species mainly belonging to genera Blautia and Eubacterium. Bacteroides species play significant roles in gut microbiota–host interactions, especially on metabolic pathways and immune system (23). Consistent with this finding, some Bacteroides species were significantly correlated with amino acid and lipid metabolism. Moreover, Bacteroides can induce cytokine production. Thus, the up-regulation of 10 Bacteroides species may account for higher peripheral cytokine levels and increased inflammation in MDD, which were widely reported in previous investigations (24). We also found that Blautia species were decreased in the MDD group relative to the HC group. Blautia species can mediate beneficial anti-inflammatory effects (25). These findings suggest that Bacteroides species and Blautia species changes may synergistically implicate an imbalance in proinflammation/anti-inflammation in MDD.
Previously, the role of gut virome has been unexplored in MDD. Here, although the overall viral composition of the MDD and HC groups was not significantly different, we still identified three differential bacteriophages (Clostridium_phage_phi8074-B1, Klebsiella_phage_vB_KpnP_ SU552A, and Escherichia_phage_ECBP5) assigned to Caudovirales between two groups. In general, those three phages can shape their corresponding well-known hosts including Clostridium sporogenes, Klebsiella pneumoniae, and Escherichia coli. In line with this assumption, we also observed the altered Klebsiella pneumoniae in MDD relative to HC. These findings suggest that it is valuable to explore the roles of these phages and their bacterial hosts in the development of MDD. In addition, we found that some bacteriophages were also correlated with some metabolites, suggesting that these bacteriophages may indirectly affect metabolites by targeting bacterial species. However, it should be admitted that these clinical findings remain preliminary; the influence of environmental and demographic factors cannot be completely excluded.
It is now widely accepted that the gut bacteria may significantly shape several metabolic pathways in the host. In our research, this view is also confirmed by both the statistical correlation (coexpression network) and metabolic function. In the coexpression network analysis, altered bacterial species, especially Bacteroides species and Blautia species, were substantially correlated with the fecal metabolites involved in amino acid metabolism. Significantly, all differential microbial genes and fecal metabolites were consistently mapped into amino acid metabolism. Disturbances of the peripheral and central metabolism of amino acid neurotransmitters such as dopamine, glutamate, and GABA have been prominent in MDD (26, 27). Recent studies have shown that the gut microbiome or microbial species may indicate the onset of mental disorder by modulating amino acid neurotransmitters such as GABA and 5-hydroxytryptamine (10, 28). Here, we found that the levels of fecal GABA and its relevant metabolites (N-acetylornithine, proline, oxoproline, and glutathione) were consistently decreased in MDD relative to HCs, suggesting a decrease in GABA content in the intestine. In line with this finding, we also found that a microbial enzyme–related gene (BetB) that participated in arginine metabolism to GABA was down-regulated in MDD. In contrast, three microbial genes involved in the metabolism of glutamine to GABA was up-regulated in MDD. These findings suggest that fecal GABA level in the patients with MDD may be modulated by a panel of gut microbes, which may be implicated in the development of MDD. In line with our assumption, a previous study has shown that microbial-derived GABA may influence the host through the gut-brain axis (29), and GABA-producing microbes can improve depression-like behavior (30). Thus, we boldly speculate that the decrease in gut GABA level may be correlated with the dysregulation of GABAergic function in the brain (31).
In addition, majority of genes involved in the phenylalanine catabolic pathways were decreased in MDD, suggesting an inhibition of fecal phenylalanine degradation. Meanwhile, we found that a downstream catabolic product of homovanillate was also decreased in MDD. These findings were consistent with disturbances of phenylalanine metabolism in MDD (27). Furthermore, we observed that a gene (kynu) involved in kynurenic acid to quinolinic acid was enriched in MDD subjects relative to HCs, yielding an increased synthesis of the neurotoxic metabolite quinolinic acid. In addition, we observed a lower fecal quinolinic acid level in MDD. These preliminary findings may account for the higher blood level of quinolinic acid observed in MDD (32).
Our research has the following advantages and disadvantages: (i) using well-characterized large cohorts; to our knowledge, we first describe disturbances of the overall gut ecology implicated in MDD, providing a comprehensive, multilevel understanding of the role of the disturbed gut microbiome on the development of MDD, but the specific mechanisms need to be further clarified in animal studies; and (ii) recent studies showed that it was feasible to capture gut virome alterations using metagenomic data (33). Using this method, we first presented the association between altered gut virome and MDD. Also, we further uncover reciprocal interaction among the altered bacteriophages, bacteria, and fecal metabolites. However, it should be admitted that our gut virome analysis in MDD is still in its infancy, as the current approach was not particularly designed to capture the viral changes. For example, this method focused on the members of the enteric DNA virome. Gut RNA virome changes in MDD need to be elaborated on the basis of virus particle sequences. (iii) All samples were collected from a prominent Chinese psychiatric center, which has a relatively wide geographical representation. However, more diverse samples from multiple different geographic areas are required to independently confirm the diagnostic performance of a combinatorial marker panel before clinical application, which is a prerequisite for avoiding overoptimistic reports of diagnostic accuracy. (iv) By integrating fecal metagenomic and metabolomic findings, we found that microbial GABA, phenylalanine, and quinolinic acid metabolisms were linked with MDD onset. Further studies focusing on understanding the potential causal role of these microbial metabolic pathways are required. (v) Blood metabolomic analysis is also valuable to deeply understand how the gut microbiome modulates host metabolism in MDD.
Together, using multiomics data, we have presented evidence that MDD was characterized by disturbances of gut bacteriophages, bacteria, and fecal metabolites, which represented the overall disturbances of MDD gut ecology. Moreover, disturbance of microbial amino acid metabolism was a hallmark in the gut ecosystem of MDD. Furthermore, we developed and independently validated a combinatorial marker panel enabling effective distinction between MDD and HC subjects. Together, these findings provide new directions to uncover pathogenesis and develop novel diagnostic strategies for MDD.
MATERIALS AND METHODS
Subject recruitment
The study protocol was approved by the Human Research and Ethics Committee of Beijing Anding Hospital (no. 2017-24), Capital Medical University (China) in accordance with the Declaration of Helsinki. In total, 311 individuals (between 18 and 65 years old) were recruited, including 155 HCs and 156 patients with MDD. Each participant provided written informed consent. Patients were required to meet the Diagnostic and Statistical Manual of Mental Disorders, 4th Edition (DSM-IV) criteria for MDD according to the Chinese version of the Mini-International Neuropsychiatric Interview (MINI) as our previous studies (15). The 17-item Hamilton Depression Rating Scale (HAMD-17) and 16-item Quick Inventory of Depressive Symptomatology–Self-Report (QIDS-SR16) were used to evaluate MDD severity (34). HCs were recruited through advertisements and were also assessed with the MINI to ensure that they did not meet the criteria for any DSM-IV Axis I psychiatric disorder. Exclusion criteria included (i) a lifetime history of bipolar disorder, schizophrenia, schizoaffective, or other Axis I psychiatric disorders; (ii) having diagnostic diseases (e.g., chronic inflammatory disorders, diabetes, cardiovascular disease, thyroid disease, or cancer); (iii) alcohol abuse, drugs abuse, or acute poisoning; (iv) current pregnancy or breastfeeding; and (v) reporting changes of diet habit or history of antibiotic use within 1 month before sampling. The detailed information of the participants is shown in table S1. Among the recruited subjects, a subcohort including 41 patients with MDD and 64 HCs had completed the “Diet and Lifestyle Questionnaire”, which includes information about dietary preference and smoking, to preliminarily determinate whether the two potential confounders significantly influence bacterial composition.
Metagenomic analysis of fecal samples
Total genomic DNA from fecal samples was extracted using the E.Z.N.A. Soil DNA Kit (Omega Bio-tek, Norcross, GA, USA) according to the manufacturer’s instructions. After extraction, the concentration and purity of the extracted DNA were determined with TBS-380 and NanoDrop 2000, respectively, and quality was checked on 1% agarose gel. DNA was fragmented to an average size of about 300 base pairs (bp) using Covaris M220 for paired-end library construction. The paired-end library was constructed using NEXTFLEX Rapid DNA-Seq (BioScientific, Austin, TX, USA). Paired-end sequencing was performed on Illumina NovaSeq (Illumina Inc., San Diego, CA, USA) using standard protocols in Shanghai Majorbio Bio-pharm Technology Co. Ltd.
Raw fastq files were quality filtered using Sickle (https://github.com/najoshi/sickle), and low-quality reads (length <50 bp or with a quality value <20 or having N bases) were removed. Reads were aligned to the human genome by the Burrows-Wheeler Aligner (http://bio-bwa.sourceforge.net), and any hit associated with the reads and their mated reads were removed. Metagenomics data were assembled using MEGAHIT, and contigs with the length being or more than 300 bp were selected as the final assembling result. Open reading frames from each assembled contig were predicted using Metagene (35). All predicted genes with a 95% sequence identity were clustered using CD-HIT (36). Reads after quality control were mapped to the representative sequences with 95% identity using SOAPaligner.
On the basis of the NCBI NR database, we annotated gene sets for bacteria, fungi, viruses, protozoa, and archaea using Diamond (version 0.8.35). On the basis of a unified database, each gene is assigned to the highest-scoring taxonomy, which facilitates simultaneous assessment of these microbial species in the gut ecosystem of patients with MDD. The KEGG annotation was conducted using Diamond against the database with an e value cutoff of 1 × 10⁻⁵ (37). α-Diversity analysis including Chao, Shannon, and Invsimpson indexes was conducted and visualized using the vegan and fossil packages in R, respectively. PCoA was used to visually evaluate the overall difference and similarity of bacterial and viral communities between the MDD and HC groups (38). The PERMANOVA was used to test group differences. The differential bacterial species and gut virus between the two groups were identified using LEfSe with a linear discriminant analysis (LDA) score >2.5. Moreover, Wilcoxon rank sum test was used to identify the differential ECs between the MDD and HC groups (false discovery rate, <0.05). Then, the corresponding microbial genes in the KEGG pathway were uncovered.
Comparisons of fecal metabolite profiles
GC-MS (Agilent 7890A/5975C) was used to compare the fecal metabolite signatures of MDD and HC subjects. The GC/MS three-dimensional matrices, including peak indexes (RT-m/z pairs), sample names (observations), and normalized peak area percentages, were imported into SIMCA-P+14.0 (Umetrics, Umeå, Sweden). Similarly, PCoA was applied to discriminate the samples from the MDD and HC groups visually. LEfSe was used to identify the differential metabolites between the two groups with LDA score >2.5. The metabolic pathways in which the differential metabolites involved were enriched referred to the KEGG pathway.
Combinatorial marker panel for MDD
On the basis of the bacterial, viral, and metabolic signatures of MDD, a fivefold cross-validation method was used to simplify and optimize the combinatorial biomarker panel. Random forest analysis was used to quantify the diagnostic performance of this microbial marker panel with the AUC in both the discovery and validation sets (39).
Construction of the interaction network of gut bacteria and phages
The co-occurrence among bacteriophages, bacteria, and fecal metabolites was calculated on the basis of the relative abundances by Spearman’s rank correlation coefficient (P < 0.05). The network layout was calculated and visualized using a circular layout by the Cytoscape software. Only edges with correlations greater than 0.5 were shown in the bacteria and fecal metabolites, and unconnected nodes were omitted. Correlation coefficients with a magnitude of 0.5 or above were selected for visualization in Cytoscape (version 3.1.1).
Demographic statistics
Statistical analyses were performed using SPSS (version 21). One-way analysis of variance (ANOVA) was used to compare continuous variables, which were displayed as means ± SD. Categorical data (gender) were analyzed by the chi-square test. Data of metagenome and metabolome were presented as means ± SEM. The statistical significance level was set at P < 0.05.
Supplementary Material
Acknowledgments
Funding: This work was supported by the National Key R&D Program of China (2016YFC1307200 and 2017YFA0505700), the National Natural Science Foundation Project of China (81971296, 81601185, 81771490, 81371310, and 81971271), Chongqing Science and Technology Commission (cstc 2019 jcyjjqX0009), Beijing Young Top-Notch Talent Support project (2018000021223ZK36), Beijing Hospitals Authority Youth Programme (QML20181901), and Beijing Biobank of Clinical Resources–Mental Disorders (BBCR-MD). Author contributions: Designed the experiments: P.X., G.W., and S.H. Performed the metagenomic analysis: P. Zheng, J.Y., Y.L., J.W., W.L., B.Y., X.T., Y.H., T.C., H.Z., and J.D. Performed the metabolomic analysis: P. Zheng, J.Y., J. Lai, T.H., Y.D., P. Zhang, J.J., C.X., L.W., J. Lu, T.M., and Y.X. Collected the clinical samples: J.Y., J.Z., G.Z., Z.S., and X.C. Drafted the manuscript: P.X., P.Z., and J.Y. Revised the manuscript for intellectual content: S.W.P., J. Licinio, and M.-L.W. Competing interests: The authors declare that they have no competing interests. Data and materials availability: All data needed to evaluate the conclusions in the paper are present in the paper and/or the Supplementary Materials. The metagenomic sequencing data were deposited in the China National GeneBank DataBase (CNGBdb) (https://db.cngb.org/; project ID: CNP0001162). Additional data related to this paper may be requested from the authors.
SUPPLEMENTARY MATERIALS
Supplementary material for this article is available at http://advances.sciencemag.org/cgi/content/full/6/49/eaba8555/DC1
REFERENCES AND NOTES
- 1.Kessler R. C., Berglund P., Demler O., Jin R., Koretz D., Merikangas K. R., Rush A. J., Walters E. E., Wang P. S., The epidemiology of major depressive disorder: Results from the National Comorbidity Survey Replication (NCS-R). JAMA 289, 3095–3105 (2003). [DOI] [PubMed] [Google Scholar]
- 2.Mitchell A. J., Chan M., Bhatti H., Halton M., Grassi L., Johansen C., Meader N., Prevalence of depression, anxiety, and adjustment disorder in oncological, haematological, and palliative-care settings: A meta-analysis of 94 interview-based studies. Lancet Oncol. 12, 160–174 (2011). [DOI] [PubMed] [Google Scholar]
- 3.Fava M., Kendler K. S., Major depressive disorder. Neuron 28, 335–341 (2000). [DOI] [PubMed] [Google Scholar]
- 4.Mitchell A. J., Vaze A., Rao S., Clinical diagnosis of depression in primary care: A meta-analysis. Lancet 374, 609–619 (2009). [DOI] [PubMed] [Google Scholar]
- 5.Clemente J. C., Ursell L. K., Parfrey L. W., Knight R., The impact of the gut microbiota on human health: An integrative view. Cell 148, 1258–1270 (2012). [DOI] [PMC free article] [PubMed] [Google Scholar]
- 6.Castro-Mejía J. L., Muhammed M. K., Kot W., Neve H., Franz C. M., Hansen L. H., Vogensen F. K., Nielsen D. S., Optimizing protocols for extraction of bacteriophages prior to metagenomic analyses of phage communities in the human gut. Microbiome 3, 64 (2015). [DOI] [PMC free article] [PubMed] [Google Scholar]
- 7.Sampson T. R., Debelius J. W., Thron T., Janssen S., Shastri G. G., Ilhan Z. E., Challis C., Schretter C. E., Rocha S., Gradinaru V., Chesselet M. F., Keshavarzian A., Shannon K. M., Krajmalnik-Brown R., Wittung-Stafshede P., Knight R., Mazmanian S. K., Gut microbiota regulate motor deficits and neuroinflammation in a model of Parkinson’s disease. Cell 167, 1469–1480.e12 (2016). [DOI] [PMC free article] [PubMed] [Google Scholar]
- 8.Hsiao E. Y., McBride S. W., Hsien S., Sharon G., Hyde E. R., McCue T., Codelli J. A., Chow J., Reisman S. E., Petrosino J. F., Microbiota modulate behavioral and physiological abnormalities associated with neurodevelopmental disorders. Cell 155, 1451–1463 (2013). [DOI] [PMC free article] [PubMed] [Google Scholar]
- 9.Hu S., Li A., Huang T., Lai J., Li J., Sublette M. E., Lu H., Lu Q., Du Y., Hu Z., Ng C. H., Zhang H., Lu J., Mou T., Lu S., Wang D., Duan J., Hu J., Huang M., Wei N., Zhou W., Ruan L., Li M. D., Xu Y., Gut microbiota changes in patients with bipolar depression. Adv. Sci. 6, 1900752 (2019). [DOI] [PMC free article] [PubMed] [Google Scholar]
- 10.Zheng P., Zeng B., Liu M., Chen J., Pan J., Han Y., Liu Y., Cheng K., Zhou C., Wang H., The gut microbiome from patients with schizophrenia modulates the glutamate-glutamine-GABA cycle and schizophrenia-relevant behaviors in mice. Sci. Adv. 5, eaau8317 (2019). [DOI] [PMC free article] [PubMed] [Google Scholar]
- 11.Cryan J. F., O’Riordan K. J., Cowan C. S. M., Sandhu K. V., Bastiaanssen T. F. S., Boehme M., Codagnone M. G., Cussotto S., Fulling C., Golubeva A. V., Guzzetta K. E., Jaggar M., Long-Smith C. M., Lyte J. M., Martin J. A., Molinero-Perez A., Moloney G., Morelli E., Morillas E., O’Connor R., Cruz-Pereira J. S., Peterson V. L., Rea K., Ritz N. L., Sherwin E., Spichak S., Teichman E. M., van de Wouw M., Ventura-Silva A. P., Wallace-Fitzsimons S. E., Hyland N., Clarke G., Dinan T. G., The microbiota-gut-brain axis. Physiol. Rev. 99, 1877–2013 (2019). [DOI] [PubMed] [Google Scholar]
- 12.Jiang H., Ling Z., Zhang Y., Mao H., Ma Z., Yin Y., Wang W., Tang W., Tan Z., Shi J., Altered fecal microbiota composition in patients with major depressive disorder. Brain Behav. Immun. 48, 186–194 (2015). [DOI] [PubMed] [Google Scholar]
- 13.Zheng P., Yang J., Li Y., Wu J., Liang W., Yin B., Tan X., Huang Y., Chai T., Zhang H., Gut microbial signatures can discriminate unipolar from bipolar depression. Adv. Sci. 7, 1902862 (2020). [DOI] [PMC free article] [PubMed] [Google Scholar]
- 14.Kelly J. R., Borre Y., O’Brien C., Patterson E., El Aidy S., Deane J., Kennedy P. J., Beers S., Scott K., Moloney G., Hoban A. E., Scott L., Fitzgerald P., Ross P., Stanton C., Clarke G., Cryan J. F., Dinan T. G., Transferring the blues: Depression-associated gut microbiota induces neurobehavioural changes in the rat. J. Psychiatr. Res. 82, 109–118 (2016). [DOI] [PubMed] [Google Scholar]
- 15.Zheng P., Zeng B., Zhou C., Liu M., Fang Z., Xu X., Zeng L., Chen J., Fan S., Du X., Zhang X., Yang D., Yang Y., Meng H., Li W., Melgiri N. D., Licinio J., Wei H., Xie P., Gut microbiome remodeling induces depressive-like behaviors through a pathway mediated by the host’s metabolism. Mol. Psychiatry 21, 786–796 (2016). [DOI] [PubMed] [Google Scholar]
- 16.Lai W. T., Deng W. F., Xu S. X., Zhao J., Xu D., Liu Y. H., Guo Y. Y., Wang M. B., He F. S., Ye S. W., Yang Q. F., Liu T. B., Zhang Y. L., Wang S., Li M. Z., Yang Y. J., Xie X. H., Rong H., Shotgun metagenomics reveals both taxonomic and tryptophan pathway differences of gut microbiota in major depressive disorder patients. Psychol. Med. , 1–12 (2019). [DOI] [PubMed] [Google Scholar]
- 17.Vallescolomer M., Falony G., Darzi Y., Tigchelaar E. F., Wang J., Tito R. Y., Schiweck C., Kurilshikov A., Joossens M., Wijmenga C., The neuroactive potential of the human gut microbiota in quality of life and depression. Nat. Microbiol. 4, 623–632 (2019). [DOI] [PubMed] [Google Scholar]
- 18.Nakatsu G., Zhou H., Wu W. K. K., Wong S. H., Coker O. O., Dai Z., Li X., Szeto C. H., Sugimura N., Lam T. Y., Yu A. C., Wang X., Chen Z., Wong M. C., Ng S. C., Chan M. T. V., Chan P. K. S., Chan F. K. L., Sung J. J., Yu J., Alterations in enteric virome are associated with colorectal cancer and survival outcomes. Gastroenterology 155, 529–541.e5 (2018). [DOI] [PubMed] [Google Scholar]
- 19.Duerkop B. A., Kleiner M., Paez-Espino D., Zhu W., Bushnell B., Hassell B., Winter S. E., Kyrpides N. C., Hooper L. V., Murine colitis reveals a disease-associated bacteriophage community. Nat. Microbiol. 3, 1023–1031 (2018). [DOI] [PMC free article] [PubMed] [Google Scholar]
- 20.Zierer J., Jackson M. A., Kastenmuller G., Mangino M., Long T., Telenti A., Mohney R. P., Small K. S., Bell J. T., Steves C. J., Valdes A. M., Spector T. D., Menni C., The fecal metabolome as a functional readout of the gut microbiome. Nat. Genet. 50, 790–795 (2018). [DOI] [PMC free article] [PubMed] [Google Scholar]
- 21.Zheng P., Li Y., Wu J., Zhang H., Huang Y., Tan X., Pan J., Duan J., Liang W., Yin B., Deng F., Perry S. W., Wong M. L., Licinio J., Wei H., Yu G., Xie P., Perturbed microbial ecology in myasthenia gravis: Evidence from the gut microbiome and fecal metabolome. Adv. Sci. 6, 1901441 (2019). [DOI] [PMC free article] [PubMed] [Google Scholar]
- 22.Savitz J., Drevets W. C., Smith C. M., Victor T. A., Wurfel B. E., Bellgowan P. S., Bodurka J., Teague T. K., Dantzer R., Putative neuroprotective and neurotoxic kynurenine pathway metabolites are associated with hippocampal and amygdalar volumes in subjects with major depressive disorder. Neuropsychopharmacology 40, 463–471 (2015). [DOI] [PMC free article] [PubMed] [Google Scholar]
- 23.Maier E., Anderson R. C., Roy N. C., Understanding how commensal obligate anaerobic bacteria regulate immune functions in the large intestine. Nutrients 7, 45–73 (2015). [DOI] [PMC free article] [PubMed] [Google Scholar]
- 24.Schiepers O. J., Wichers M. C., Maes M., Cytokines and major depression. Prog. Neuro-Psychopharmacol. Biol. Psychiatry 29, 201–217 (2005). [DOI] [PubMed] [Google Scholar]
- 25.Bajaj J. S., Hylemon P. B., Ridlon J. M., Heuman D. M., Daita K., White M. B., Monteith P., Noble N. A., Sikaroodi M., Gillevet P. M., Colonic mucosal microbiome differs from stool microbiome in cirrhosis and hepatic encephalopathy and is linked to cognition and inflammation. Am. J. Physiol. Gastrointest. Liver Physiol. 303, G675–G685 (2012). [DOI] [PMC free article] [PubMed] [Google Scholar]
- 26.Zheng P., Gao H. C., Li Q., Shao W. H., Zhang M. L., Cheng K., Yang D. Y., Fan S. H., Chen L., Fang L., Plasma metabonomics as a novel diagnostic approach for major depressive disorder. J. Proteome Res. 11, 1741–1748 (2012). [DOI] [PubMed] [Google Scholar]
- 27.Pan J.-X., Xia J.-J., Deng F.-L., Liang W.-W., Wu J., Yin B.-M., Dong M.-X., Chen J.-J., Ye F., Wang H.-Y., Diagnosis of major depressive disorder based on changes in multiple plasma neurotransmitters: A targeted metabolomics study. Transl. Psychiatry 8, 130 (2018). [DOI] [PMC free article] [PubMed] [Google Scholar]
- 28.Yano J. M., Yu K., Donaldson G. P., Shastri G. G., Ann P., Ma L., Nagler C. R., Ismagilov R. F., Mazmanian S. K., Hsiao E. Y., Indigenous bacteria from the gut microbiota regulate host serotonin biosynthesis. Cell 161, 264–276 (2015). [DOI] [PMC free article] [PubMed] [Google Scholar]
- 29.Strandwitz P., Kim K. H., Terekhova D., Liu J. K., Sharma A., Levering J., McDonald D., Dietrich D., Ramadhar T. R., Lekbua A., Mroue N., Liston C., Stewart E. J., Dubin M. J., Zengler K., Knight R., Gilbert J. A., Clardy J., Lewis K., GABA-modulating bacteria of the human gut microbiota. Nat. Microbiol. 4, 396–403 (2019). [DOI] [PMC free article] [PubMed] [Google Scholar]
- 30.Patterson E., Ryan P. M., Wiley N., Carafa I., Sherwin E., Moloney G., Franciosi E., Mandal R., Wishart D. S., Tuohy K., Ross R. P., Cryan J. F., Dinan T. G., Stanton C., Gamma-aminobutyric acid-producing lactobacilli positively affect metabolism and depressive-like behaviour in a mouse model of metabolic syndrome. Sci. Rep. 9, 16323 (2019). [DOI] [PMC free article] [PubMed] [Google Scholar]
- 31.Prevot T., Sibille E., Altered GABA-mediated information processing and cognitive dysfunctions in depression and other brain disorders. Mol. Psychiatry, 10.1038/s41380-020-0727-3 , (2020). [DOI] [PubMed] [Google Scholar]
- 32.Savitz J., Drevets W. C., Wurfel B. E., Ford B. N., Bellgowan P. S., Victor T. A., Bodurka J., Teague T. K., Dantzer R., Reduction of kynurenic acid to quinolinic acid ratio in both the depressed and remitted phases of major depressive disorder. Brain Behav. Immun. 46, 55–59 (2015). [DOI] [PMC free article] [PubMed] [Google Scholar]
- 33.Nakatsu G., Zhou H., Wu W. K. K., Wong S. H., Coker O. O., Dai Z., Li X., Szeto C.-H., Sugimura N., Yuen-Tung Lam T., Alterations in enteric virome associate with colorectal cancer and survival outcomes. Gastroenterology 155, 529–541.e5 (2018). [DOI] [PubMed] [Google Scholar]
- 34.Rush A. J., Trivedi M. H., Ibrahim H. M., Carmody T. J., Arnow B., Klein D. N., Markowitz J. C., Ninan P. T., Kornstein S., Manber R., The 16-Item Quick Inventory of Depressive Symptomatology (QIDS), clinician rating (QIDS-C), and self-report (QIDS-SR): A psychometric evaluation in patients with chronic major depression. Biol. Psychiatry 54, 573–583 (2003). [DOI] [PubMed] [Google Scholar]
- 35.Noguchi H., Park J., Takagi T., MetaGene: Prokaryotic gene finding from environmental genome shotgun sequences. Nucleic Acids Res. 34, 5623–5630 (2006). [DOI] [PMC free article] [PubMed] [Google Scholar]
- 36.Fu L., Niu B., Zhu Z., Wu S., Li W., CD-HIT: Accelerated for clustering the next-generation sequencing data. Bioinformatics 28, 3150–3152 (2012). [DOI] [PMC free article] [PubMed] [Google Scholar]
- 37.Xie C., Mao X., Huang J., Ding Y., Wu J., Dong S., Kong L., Gao G., Li C.-Y., Wei L., KOBAS 2.0: A web server for annotation and identification of enriched pathways and diseases. Nucleic Acids Res. 39, W316–W322 (2011). [DOI] [PMC free article] [PubMed] [Google Scholar]
- 38.Doan T., Hinterwirth A., Worden L., Arzika A. M., Maliki R., Abdou A., Kane S., Zhong L., Cummings S. L., Sakar S., Chen C., Cook C., Lebas E., Chow E. D., Nachamkin I., Porco T. C., Keenan J. D., Lietman T. M., Gut microbiome alteration in MORDOR I: A community-randomized trial of mass azithromycin distribution. Nat. Med. 25, 1370–1376 (2019). [DOI] [PubMed] [Google Scholar]
- 39.Franzosa E. A., Sirota-Madi A., Avila-Pacheco J., Fornelos N., Haiser H. J., Reinker S., Vatanen T., Hall A. B., Mallick H., McIver L. J., Sauk J. S., Wilson R. G., Stevens B. W., Scott J. M., Pierce K., Deik A. A., Bullock K., Imhann F., Porter J. A., Zhernakova A., Fu J., Weersma R. K., Wijmenga C., Clish C. B., Vlamakis H., Huttenhower C., Xavier R. J., Gut microbiome structure and metabolic activity in inflammatory bowel disease. Nat. Microbiol. 4, 293–305 (2019). [DOI] [PMC free article] [PubMed] [Google Scholar]
Associated Data
This section collects any data citations, data availability statements, or supplementary materials included in this article.
Supplementary Materials
Supplementary material for this article is available at http://advances.sciencemag.org/cgi/content/full/6/49/eaba8555/DC1