

Abstract
Background:
Burden of cancer mortality is often measured by death counts or mortality rates, but potential years of life lost (PYLL) and PYLL per death may be more useful to estimate the impact of cancer deaths occurring at younger ages.
Methods:
We used U.S. national death certificate data. A total of 45 categories of common cancers were grouped for cancer-specific calculations of PYLL and PYLL per death. PYLL was defined as the sum of the total years of life lost prior to age 75 years.
Results:
The largest number of PYLL in 2017 were due to deaths from cancers of the lung/bronchus (891,313, 20.8%), colon/rectum (409,538, 9.6%) and breast (400,643, 9.4%). Cancers with the highest PYLLs generally also caused the largest number of deaths and had the highest mortality rates, with the exception of prostate cancer (5.1% of deaths, 2.0% of PYLL). In contrast, PYLL per death were greatest for deaths due to cancers of testis (mean=34.0 years), bones/joints (26.4) and other endocrine sites including thymus (25.2).
Conclusions:
Though PYLL generally reflect mortality rates, they more heavily weigh cancers that occur at younger ages. In contrast, PYLL per death, which is an average quantification of life years lost for individual cancer patients show a different pattern.
Impact:
Mortality rates, PYLL and PYLL per death are complementary measures of the burden of deaths due to cancer that should be considered in tandem to prioritize public health interventions focused on preventing premature mortality.
Keywords: premature mortality, cancer, years of potential life lost
INTRODUCTION
Cancer is the second leading cause of death after heart disease in the United States with almost 600,000 deaths in 2017 (1). The greatest number of cancer deaths are due to cancers of the lung (21%), prostate (10%) and colorectum (9%) in men and the lung (24%), breast (15%) and colorectum (9%) in women. Cancer death rates increase with age with 30% of all cancer deaths occurring among ≥ 80-year-olds. Moreover, cancer is the leading cause of death in less than 80-year-olds (1,2).
Cancer mortality rates provide critical information on the absolute burden of cancer and progress in cancer prevention and control over time. However, these estimates are disproportionately weighted toward deaths occurring at very old ages, the age range where cancer mortality is the greatest. Other metrics of mortality can be used to estimate the impact of cancer on deaths occurring at younger ages (i.e., premature deaths), such as potential years of life lost (PYLL), an estimate of the average years a person would have lived if he or she had not died prematurely. This metric more heavily weights deaths at younger ages, indirectly highlighting loss of economic productivity, social contribution and family stability (3). In addition, PYLL per cancer death is a metric that highlights the enormous loss of life due to deaths from certain cancers that occur at younger ages, even if they occur infrequently.
These metrics are important for quantifying the impact of premature cancer deaths in the US population and should be considered in parallel with cancer death rates. In this study, we estimated PYLL and PYLL per death by cancer site in 2017 using nationwide death certificate data, and also examined these estimates by sex, race/ethnicity and calendar year.
METHODS
Data sources
We utilized US mortality and racial/ethnic data for years 1990 and 2017 from death certificates from the US National Center for Health Statistics (NCHS), Centers for Disease Control and Prevention. Causes of death were defined according to the International Classification of Diseases, Tenth Revision (ICD-10), categorized by the Surveillance, Epidemiology, and End Results (SEER) Cause of Death Recode (4). Out of 85 causes of cancer death of all ages, less common cancers were grouped by organ site and 45 categories were chosen for presentation (Supplementary Table S1). Calculations for all 82 causes of cancer deaths are also provided in Supplementary Table S2. Population data were from the US Census Bureau. Estimates for American Indians and Alaska Natives were restricted to counties in Purchased/Referred Care Delivery Areas to reduce racial misclassification (5).
Statistical analysis
Absolute death counts, mortality rates, PYLLs and PYLL per death are presented. The 2000 US standard population was used to estimate age-standardized cancer death rates. We estimated PYLL for each cancer type and population (i.e., sex [male, female], race/ethnicity [non-Hispanic Whites; NHW, Hispanics, non-Hispanic Blacks; NHB, Asian or Pacific Islanders; API, American Indians/Alaska Natives; AIAN], years [2017 and 1990]) by using the following formula:
PYLL was defined as the number of years of life lost prior to age 75 years, a commonly used reference age for many studies. Calculations using a set age allows for a uniform comparison across sex, race/ethnicity and calendar year. In addition, PYLL per death for age less than 75 was calculated by dividing PYLL by the total number of deaths for each cancer type. As a sensitivity analysis, we have also used age 78.6 as the reference age, which is the current, as of year 2017, average life expectancy in the US (6).
RESULTS
In 2017, there were 599,099 cancer deaths in the United States (age-standardized rate of 152.7 per 100,000 across all age groups). The highest cancer mortality rates were due to cancers in the lung/bronchus, colon/rectum, pancreas, breast and prostate (Table 1).
Table 1.
Cancer deaths, rate and PYLL in both men and women (year 2017)
| Cancer Sites | Death Counts | Mortality Rate | PYLL | PYLL per Death | |||||||
|---|---|---|---|---|---|---|---|---|---|---|---|
| Count | %Count | Rank | ASR* | ASR% | Rank | Years | % | Rank | Years | Rank | |
| Lung and Bronchus | 145,849 | 24.3 | 1 | 36.7 | 24.0 | 1 | 891,313 | 20.8 | 1 | 9.9 | 39 |
| Colon and Rectum | 52,547 | 8.8 | 2 | 13.5 | 8.8 | 2 | 409,538 | 9.6 | 2 | 13.3 | 17 |
| Pancreas | 44,011 | 7.3 | 3 | 11.1 | 7.3 | 3 | 282,886 | 6.6 | 4 | 10.6 | 37 |
| Breast | 42,510 | 7.1 | 4 | 11 | 7.2 | 4 | 400,643 | 9.4 | 3 | 14.5 | 11 |
| Prostate | 30,486 | 5.1 | 5 | 7.8 | 5.1 | 5 | 85,979 | 2.0 | 14 | 7.6 | 45 |
| Liver and Intrahepatic Bile Duct | 27,104 | 4.5 | 6 | 6.6 | 4.3 | 6 | 229,777 | 5.4 | 5 | 11.9 | 26 |
| Leukemia | 23,527 | 3.9 | 7 | 6.2 | 4.1 | 7 | 173,629 | 4.1 | 7 | 14.7 | 9 |
| Non-Hodgkin Lymphoma | 20,459 | 3.4 | 8 | 5.3 | 3.5 | 8 | 113,792 | 2.7 | 9 | 11.5 | 27 |
| Brain and Other Nervous System | 16,804 | 2.8 | 9 | 4.4 | 2.9 | 9 | 221,026 | 5.2 | 6 | 17.3 | 7 |
| Urinary Bladder | 16,657 | 2.8 | 10 | 4.3 | 2.8 | 10 | 59,566 | 1.4 | 20 | 9.1 | 42 |
| Esophagus | 15,321 | 2.6 | 11 | 3.8 | 2.5 | 11 | 120,895 | 2.8 | 8 | 11.4 | 29 |
| Ovary | 14,193 | 2.4 | 12 | 3.6 | 2.4 | 12 | 113,695 | 2.7 | 10 | 12.4 | 21 |
| Kidney and Renal Pelvis | 13,959 | 2.3 | 13 | 3.6 | 2.4 | 13 | 101,928 | 2.4 | 11 | 12.0 | 25 |
| Myeloma | 12,322 | 2.1 | 14 | 3.2 | 2.1 | 14 | 60,873 | 1.4 | 19 | 9.6 | 40 |
| Stomach | 11,158 | 1.9 | 15 | 2.9 | 1.9 | 15 | 95,950 | 2.2 | 12 | 14.0 | 15 |
| Corpus and Uterus, NOS | 10,994 | 1.8 | 16 | 2.7 | 1.8 | 16 | 83,930 | 2.0 | 15 | 11.3 | 31 |
| Oral Cavity and Pharynx | 10,126 | 1.7 | 17 | 2.5 | 1.6 | 17 | 90,344 | 2.1 | 13 | 12.8 | 18 |
| Melanoma of the Skin | 8,056 | 1.3 | 18 | 2.1 | 1.4 | 18 | 69,183 | 1.6 | 17 | 14.1 | 13 |
| Soft Tissue including Heart | 4,970 | 0.8 | 19 | 1.3 | 0.9 | 19 | 68,555 | 1.6 | 18 | 19.4 | 5 |
| Cervix Uteri | 4,207 | 0.7 | 20 | 1.2 | 0.8 | 20 | 73,014 | 1.7 | 16 | 20.7 | 4 |
| Non-Melanoma Skin | 4,042 | 0.7 | 21 | 1 | 0.7 | 21 | 21,457 | 0.5 | 23 | 11.5 | 28 |
| Larynx | 3,708 | 0.6 | 22 | 0.9 | 0.6 | 22 | 29,742 | 0.7 | 22 | 11.4 | 30 |
| Gallbladder | 2,195 | 0.4 | 23 | 0.6 | 0.4 | 23 | 14,212 | 0.3 | 25 | 11.1 | 33 |
| Thyroid | 1,892 | 0.3 | 24 | 0.5 | 0.3 | 24 | 12,818 | 0.3 | 27 | 12.1 | 23 |
| Other Biliary | 1,843 | 0.3 | 25 | 0.5 | 0.3 | 25 | 10,863 | 0.3 | 31 | 10.7 | 36 |
| Bones and Joints | 1,725 | 0.3 | 26 | 0.5 | 0.3 | 26 | 31,193 | 0.7 | 21 | 26.4 | 2 |
| Small Intestine | 1,682 | 0.3 | 27 | 0.4 | 0.3 | 27 | 12,238 | 0.3 | 28 | 12.5 | 20 |
| Other Digestive Organs | 1,471 | 0.2 | 28 | 0.4 | 0.3 | 28 | 10,257 | 0.2 | 32 | 12.2 | 22 |
| Vulva | 1,262 | 0.2 | 29 | 0.3 | 0.2 | 29 | 6,738 | 0.2 | 34 | 11.3 | 32 |
| Anus, Anal Canal and Anorectum | 1,169 | 0.2 | 30 | 0.3 | 0.2 | 30 | 11,671 | 0.3 | 29 | 13.9 | 16 |
| Other Endocrine including Thymus | 1,076 | 0.2 | 31 | 0.3 | 0.2 | 31 | 20,971 | 0.5 | 24 | 25.2 | 3 |
| Hodgkin Lymphoma | 1,009 | 0.2 | 32 | 0.3 | 0.2 | 32 | 11,580 | 0.3 | 30 | 18.1 | 6 |
| Peritoneum, Omentum and Mesentery | 1,008 | 0.2 | 33 | 0.3 | 0.2 | 33 | 6,268 | 0.1 | 35 | 11.0 | 34 |
| Other Female Genital Organs | 897 | 0.1 | 34 | 0.2 | 0.1 | 34 | 7,031 | 0.2 | 33 | 12.1 | 24 |
| Nose, Nasal Cavity and Middle Ear | 579 | 0.1 | 35 | 0.2 | 0.1 | 35 | 5,428 | 0.1 | 36 | 14.6 | 10 |
| Other Urinary Organs | 493 | 0.1 | 36 | 0.1 | 0.1 | 36 | 2,020 | 0.0 | 42 | 9.5 | 41 |
| Ureter | 435 | 0.1 | 37 | 0.1 | 0.1 | 37 | 1,215 | 0.0 | 43 | 8.0 | 44 |
| Testis | 425 | 0.1 | 38 | 0.1 | 0.1 | 38 | 13,448 | 0.3 | 26 | 34.0 | 1 |
| Vagina | 411 | 0.1 | 39 | 0.1 | 0.1 | 39 | 2,157 | 0.1 | 41 | 10.9 | 35 |
| Penis | 352 | 0.1 | 40 | 0.1 | 0.1 | 40 | 2,828 | 0.1 | 38 | 14.1 | 14 |
| Eye and Orbit | 331 | 0.1 | 41 | 0.1 | 0.1 | 41 | 3,096 | 0.1 | 37 | 14.2 | 12 |
| Pleura | 319 | 0.1 | 42 | 0.1 | 0.1 | 42 | 1,102 | 0.0 | 44 | 8.0 | 43 |
| Trachea, Mediastinum and Other Respiratory Organs | 291 | 0.0 | 43 | 0.1 | 0.1 | 43 | 2,760 | 0.1 | 39 | 15.2 | 8 |
| Retroperitoneum | 289 | 0.0 | 44 | 0.1 | 0.1 | 44 | 2,464 | 0.1 | 40 | 12.8 | 19 |
| Other Male Genital Organs | 68 | 0.0 | 45 | 0 | 0.0 | 45 | 416 | 0.0 | 45 | 10.1 | 38 |
cancer sites sorted by largest to smallest counts in total death counts in men and women
mortality rate: per 100,000
PYLL
In 2017, cancer deaths resulted in 4,280,128 PYLL prior to age 75 years in the US (Table 1). The largest contributors to PYLLs were deaths due to cancers of the lung/bronchus (21%), colon/rectum (10%), breast (9%), pancreas (7%) and liver/intrahepatic bile duct (5%), totaling 52% of the overall PYLL. Rankings based on cancer mortality rates were similar to rankings based on PYLL, with a few exceptions, including prostate and urinary bladder cancers that are common causes of cancer death (rank 5 and 10, respectively), but result in fewer PYLL relative to other cancer sites (rank 14 and 20, respectively; Supplementary Figure S1).
In both men and women, lung cancer deaths resulted in the greatest number of PYLL before age 75 in 2017 (Figure 1 and Supplementary Tables S4A, S4B). PYLLs were generally higher in men compared to women with the exception of cancers of the gallbladder (4,743 in males vs. 9,469 in females), anus/anal canal and anorectum (5,002 vs. 6,669) and peritoneum/omentum and mesentery (1,545 vs. 4,723). PYLL ranks were also similar between men and women. Compared to women, men had a higher proportion of PYLL due to deaths from cancers of the liver/intrahepatic bile duct (8% in males vs 3% in females), esophagus (5% vs. 1%) and lung/bronchus (21% vs. 19%). Deaths due to female-specific cancers (female breast, cervix uteri, corpus/uterus, ovary, vagina, vulva and other female organs) accounted for 33% of PYLL in women, and deaths due to male-specific cancers (prostate, testis, penis and other male genital organs) accounted for to 5% of PYLL in men.
Figure 1.
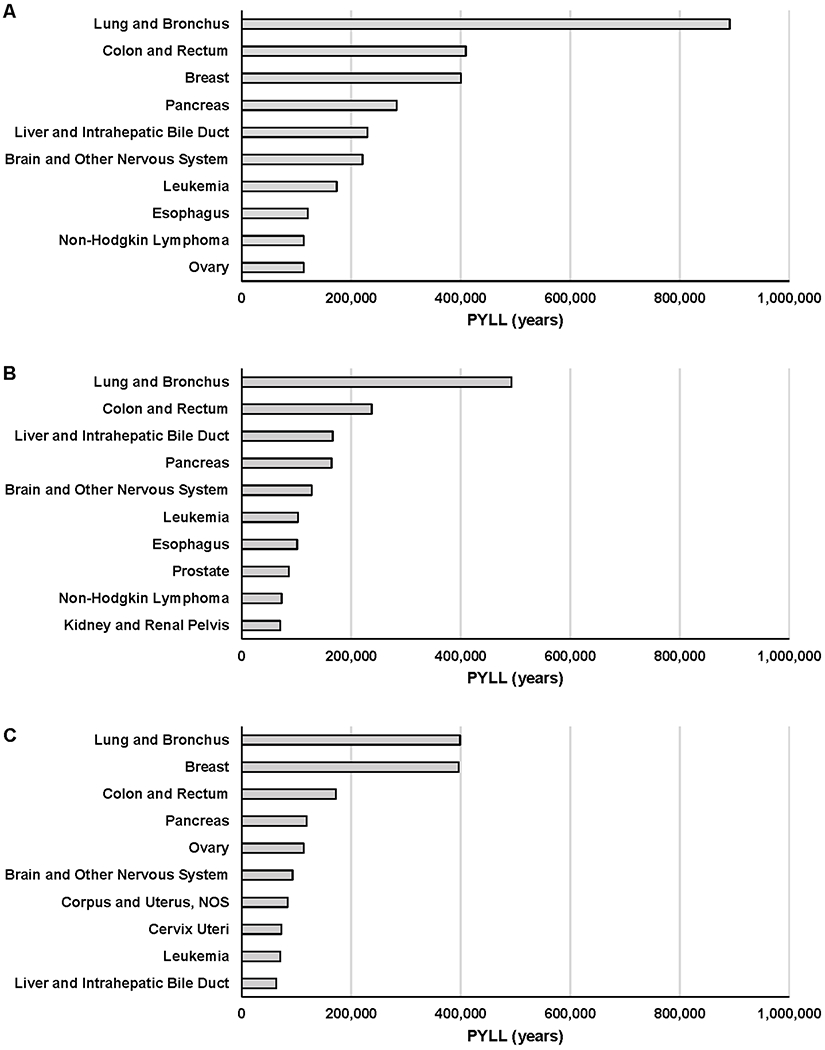
Top 10 PYLL cancers in each population groups; overall (A), men (B) and women (C) (year 2017)
While 78% of all cancer deaths occurred among NHW in 2017, a smaller fraction (70%) of all PYLL due to cancer occurred among NHW, whereas other racial/ethnic groups contributed a higher fraction of PYLL than deaths: Hispanics (10% of all PYLL vs. 7% of all cancer deaths), NHB (15% vs. 12%), API (4% vs. 3%), AIAN (0.55% vs. 0.39%). Within each race/ethnic group, lung/bronchus cancer deaths caused the largest number of PYLLs, with the exception of Hispanics (rank 3) where colorectal cancer deaths caused the largest number of PYLLs (Figure 2, Supplementary Table S5 and Supplementary Figure S2). Lung/bronchus cancers caused 23% of cancer-related PYLLs in NHW, 18% in NHBs, 18% in AIANs, 16% in APIs, and 8% in Hispanics. The largest fraction of PYLL due to colorectal cancer was observed among NHB (11% of all PYLL in NHB) and the smallest in NHW (9%), and to the largest PYLL due to breast cancer was observed among NHB (13%) and the smallest in AIAN (7%). For PYLL due to pancreatic cancer, the fraction was largest in NHW (7%) and smallest in AIAN (5%).
Figure 2.
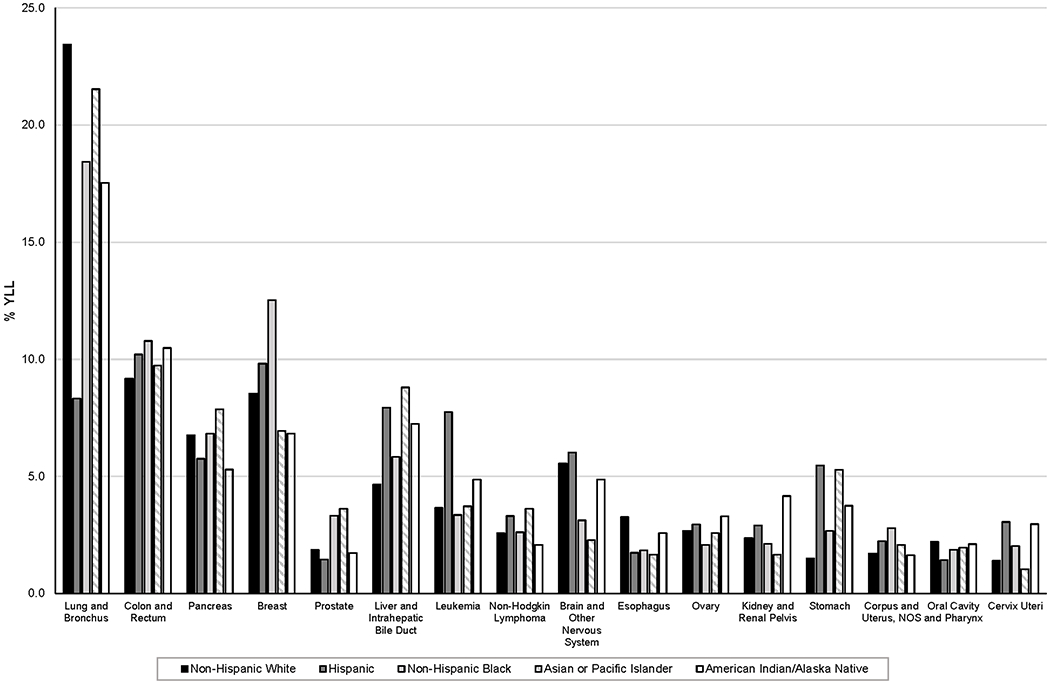
Top 10 PYLL cancers by race/ethnicity (year 2017). %PYLL calculated within each race/ethnic group.
Top 10 PYLL cancers of each race/ethnicity were combined to a total list of 16 cancer types (sorted by largest to smallest counts in total death counts in men and women)
Overall, PYLL for all cancer deaths increased from 4,262,397 in 1990 (20.5% of all PYLL) to 4,280,128 in 2017 (19.3% of all PYLL) (Figure 3, Supplementary Table S6, S8, S9 and Supplementary Figure S3). As the concurrent cancer mortality rates decreased from 214.9 to 152.7 per 100,000, the increase in PYLLs is driven by the growth of the US population. The proportion of total PYLL caused by cancer death decreased among men, women and NHWs, indicating that PYLLs due to other causes grew more rapidly over this time period. However, the fraction of total PYLL due to cancer increased in other racial/ethnic groups (Supplementary Table S3).
Figure 3.
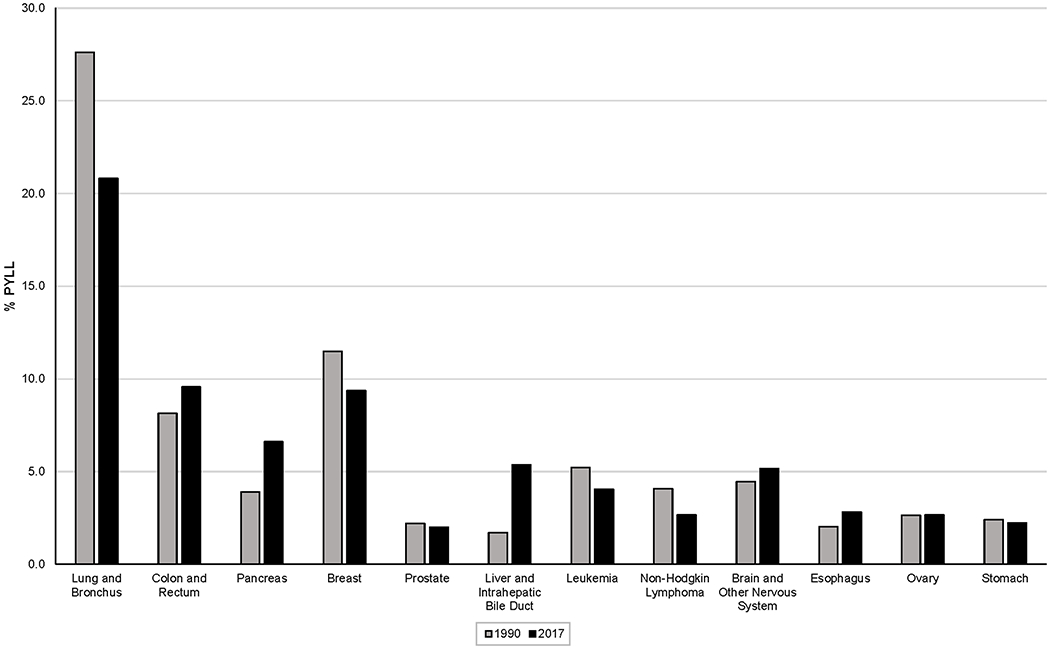
Top 10 PYLL cancers in years 2017 vs. 1990. %PYLL calculated within each year.Top 10 PYLL cancers of each year period were combined to a total list of 12 cancer types (sorted by largest to smallest counts in total death counts in men and women).
The largest increases in the number of PYLL between 1990 and 2017 were for deaths due to cancers of the liver/intrahepatic bile duct (72,873 to 229,777; 1.7% to 5.4% of total PYLL due to cancer), pancreas (166,039 to 282,886; 3.9% to 6.6%), and colon/rectum (347,317 to 408,754; 8.1% to 9.4%), whereas the largest PYLL decreases were for deaths due to cancers of the lung/bronchus (1,176,860 to 891,313; 27.6% to 21.4%), breast (489,491 to 400,643; 11.5% to 9.4%) and non-Hodgkin lymphoma (174,224 to 113,792; 4.1% to 2.7%).
PYLL per death
In 2017, an average of 12.0 years of life before age 75 was lost per cancer death (mean=11.6 years for men and 12.5 years for women; Figure 4, Table 1). Cancer sites with the largest number of PYLL per death differed from those with the largest overall number of PYLL before age 75. The highest PYLLs per death were for cancers of the testis (mean=34.0 years), bones/joints (26.4 years), other endocrine sites including thymus (25.2), cervix uteri (20.7) and soft tissue including heart (19.4 years/death).
Figure 4.
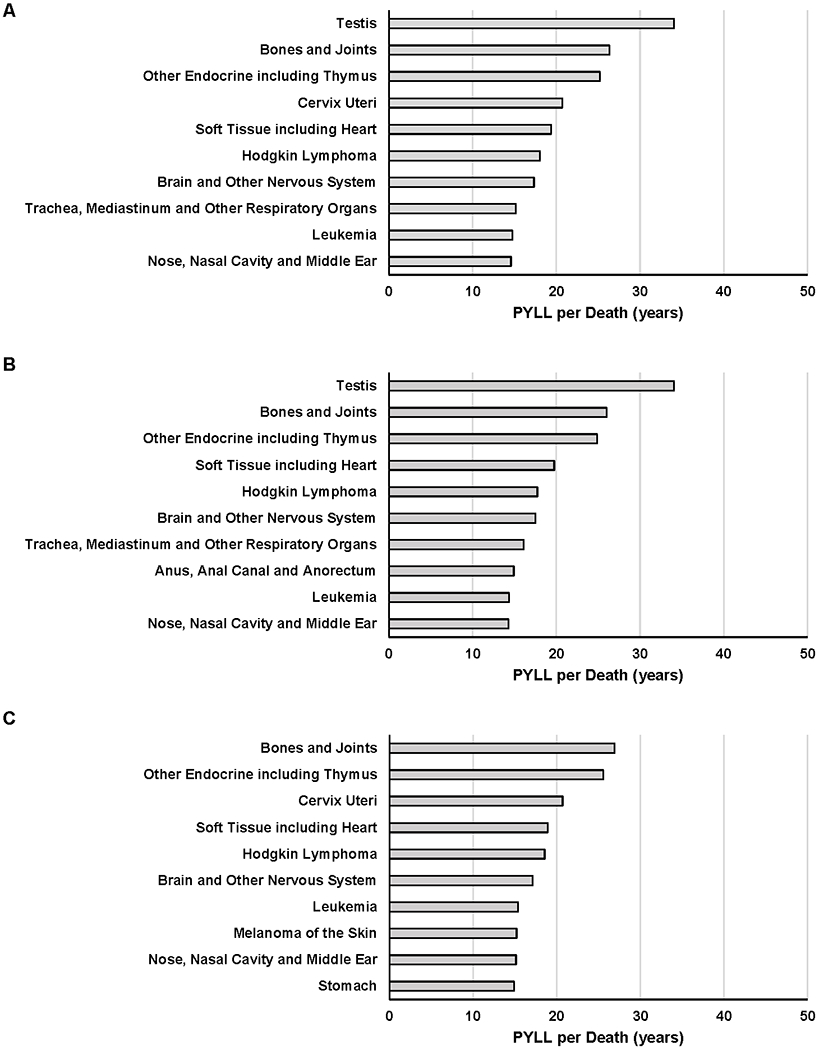
Top 10 PYLL per death cancers in overall (A), men (B) and women (C) (year 2017)
Overall ranks of PYLL per death for sex non-specific cancers were similar among men and women (Supplementary Table S4 and Supplementary Figure S1). Largest differences of PYLL per death by sex were observed for trachea/mediastinum/other respiratory organs (difference=2.7 years; mean=16.1 in men vs. 13.4 in women), anus/anal canal/anorectum (1.7; 14.9 vs. 13.3) and peritoneum/omentum/mesentery (1.6; 12.3 vs. 10.6).
PYLL per death for all cancers was highest in Hispanics (mean=15.9 years), followed by API (14.3), AIAN (13.8), NHB (13.4), and NHW (11.2), reflecting a younger age at cancer death in some racial/ethnic groups (Supplementary Table S7 and Supplementary Figure S2). The highest-ranking cancer for PYLL per death was testis for all race/ethnic groups, except for AIAN for which it was cancers of bones/joints. However, PYLL per death due to testicular cancer varied substantially across race/ethnicity with the largest number of PYLL per death observed among APIs (47.1 years) and the lowest among NHW (30.7 years). In general, the PYLL per death has decreased for most cancer sites over time (mean=12.8 years in 1990 to 12.0 in 2017; Supplementary Table S6 and Supplementary Figure S3). Large decreases of PYLL per death were observed for cancers in Hodgkin lymphoma (mean=28.5 to 18.1 years), other endocrine sites including thymus (34.8 to 25.2) and eye/orbit (20.2 to 14.2).
From 1990 to 2017, a total of 10 cancers had increased PYLL per death, including deaths due to cancers of the colon/rectum (10.9 to 13.3 years per death), stomach (12.1 to 14.0), penis (12.4 to 14.1), other digestive tract (11.0 to 12.2), and corpus/uterus, NOS (10.4 to 11.3) (Supplementary Table S6 and Supplementary Figure S3). PYLL and PYLL per death by sex and race/ethnicity for 1990 are presented in Supplementary Tables S9 and S10.
Sensitivity Analysis with 78.6 as Reference Age
Recalculating using the current average life expectancy in the US of 78.6 for year 2017 data renders an increase of PYLL by 1,361,932 years (from 4,280,128 to 5,642,060 years) and an increase of PYLL per death by 1.9 (from 12.0 to 13.9). However, most of the cancer sites maintained within two places, with 30 out of 45 cancers with no change in ranks (Supplementary Table S11).
DISCUSSION
Using nationwide death certificate data, this study reported two measures of potential years of life lost due to cancer in the United States, for 45 cancer types by sex, race/ethnicity and calendar years. In 2017, the largest number of PYLL occurred in cancers of the lung/bronchus, colon/rectum and breast, whereas the largest number of PYLL per death were in cancers of testis, bones/joints and other endocrine sites including thymus. The total PYLL before age 75 in the US has increased despite decreasing cancer mortality rates between 1990 and 2017, reflecting population growth.
National estimates of cancer deaths and death rates are critical to assess progress in cancer prevention and control. However, PYLLs and PYLL per death are complementary metrics that emphasize the impact of cancer on premature deaths by more heavily weighting cancer deaths that occur at younger ages. The largest contributors to PYLL before age 75 in the US are the same cancer sites that contribute the largest number of deaths - cancers in lung/bronchus, colon/rectum, breast, pancreas and liver. However, not all cancer burden estimates are similar across different metrics. Some cancers like prostate cancer rank high in mortality rate but lower in PYLL, where some like testicular cancer ranks low in mortality rate but higher in PYLL. These discrepancies arise due to the differences in age at death. The median age at prostate cancer death is around 80 (7), whereas the median age at testicular cancer death is around 42 years (8). The effect of age on cancer burden is accentuated in PYLL per death calculations, where testicular cancer ranks first and prostate cancer last.
Cancer burden by sex shows some differences across metrics. While men have higher cancer mortality rates and PYLL due to cancer compared to women overall, women have an excess of almost one year of life lost due to a cancer of any type that occurred in 2017. The excess PYLL in women is partially driven by deaths due to female-specific cancers occurring at earlier ages. For example, female breast cancer deaths occur in median age of 68 years and cervical cancer deaths occur at a median of 58 years (9,10). Moreover, some cancers show higher PYLL per death for one sex over the other despite the lower mortality rate and/or PYLL. An example is melanoma of the skin where mortality rate is more than double among men (3.1 per 100,000) as compared to women (1.3 per 100,000), but PYLL per death is almost two years higher in women (15.2 years) as compared to men (13.5).
Differences in PYLL due to cancer and PYLL per cancer death were also observed by race/ethnicity. Overall, a disproportionately high number of PYLL occurred among minority populations compared to NHWs, and the PYLL per death was greatest among Hispanics and API, suggesting that non-NHW populations are dying from cancer at younger ages than NHWs in the U.S. This could reflect poorer survival among certain racial/ethnic groups (11,12), as well as a higher burden of cancer types that occur at younger ages. Disparities in particular cancer sites were also observed, for instance, prostate cancer ranked similar in mortality rate across different race/ethnic groups, but NHB men had much higher proportion of PYLL due to prostate cancer compared to other groups, highlighting a younger age at death among this group (13).
The change in PYLL due to cancer between 1990 and 2017 is driven by a combination of changes in cancer death rates and increases in the size and changes in the demographics of the US population. Therefore, there was an increase in the total PYLL due to cancer deaths, despite declining mortality rates, which is driven by the growth and aging of the US population (14). Specifically, the population under age 75 has grown from 239 million to 304 million between 1990 and 2017 in the US, with increase of 11 million in 65-74 year-olds (15). The largest reduction in PYLLs over time was observed for cancers of the lung/bronchus, reflecting strongly decreasing lung cancer death rates driven by declining smoking prevalence (16). The largest increase in PYLL was in cancers of liver/intrahepatic bile duct driven by a rising mortality rate for liver/intrahepatic bile duct cancers and the growth of the population (17). A notable increase in PYLL per death for cancers in colon/rectum and stomach between 1990 and 2017 is likely due to the increasing death rates at younger ages for these two cancer sites (18,19).
Approaches for calculating PYLL vary across studies (3). A fixed age of 75 was used as the life expectancy in this study to provide a consistent benchmark for defining premature death. Often PYLLs are calculated based on demographic group, birth cohort and year-specific life expectancy estimates; however, this approach would estimate fewer PYLLs in groups with lower life expectancy, de-emphasizing the importance of premature cancer death in these groups. The SEER Cancer Statistics Review report estimated that approximately 9.3 million PYLL due to cancer occurred in 2017 (20). This estimate is far higher, as it takes into account each individual’s probability of surviving to a certain age based on age, race and sex. By setting our benchmark at 75, we are more strongly focusing on premature deaths. In addition, age 75 is a benchmark for PYLL calculations that has been widely used by international health agencies, including the US CDC (21), the UK National Health Service (22) and the Canadian government (23), allowing for a direct comparison with our work. Finally, using the average life expectancy in the US in PYLL calculation resulted in little difference in ranking across cancer sites.
PYLL depends on may factors including risk factors, cancer screening, cancer treatment and competing risks of other deaths. However, because our study is descriptive, we focused on the overall patterns. Additionally, other components of disease burden, such as disability-adjusted life years are not provided. This study relies on cause of death reported on death certificates, which are known to imperfectly capture cause of death. Death certificates are also known to have racial/ethnic misclassification (24), particularly for AIANs. To mitigate this problem, we have restricted our analysis of AIANs to those living within Purchased/Referred Care Delivery Areas of the country. This approach limits misclassification, but also excludes AIANs living in other parts of the country. In addition, death certificate data available from NCHS combine Asians and Pacific Islanders, two groups with very different health profiles.
No single index may sufficiently quantify the social and economic impact of cancer mortality in a society. Many cancer deaths occur in the elderly, thus relying on the absolute counts may obscure the importance of cancer at younger ages. Age-standardized mortality rates incorporate age structure of the population but fail to capture the magnitude of the impact stemming from the deaths at young ages. PYLL integrate age at death, emphasizing the “premature” component due to the death, and can be used as a public health goal to maximize the “natural” lifespan of those individuals (3). PYLL per death takes a step further and quantifies the burden of that specific cancer death at the individual level. Therefore, although both PYLL and PYLL per death give greater weight to cancers that affect younger populations, their measurements serve different purposes. PYLL is a public health metric that can be used to quantify premature cancer deaths at a population level (25). PYLL per death provides an average quantification of life years lost for individual cancer patients.
When considering the burden of cancer mortality in the US, it is important to consider not only the absolute number of cancer deaths, but also the age at which those deaths occur. Here, we observed that lung cancer contributed the largest number of PYLL and testicular cancers result in the largest number of PYLL per death. Mortality rates, PYLL and PYLL per death are complementary measures of cancer death that should be considered in tandem. PYLL and PYLL per death provide quantification of premature mortality that can be utilized to prioritize public health interventions focused on preventing premature deaths.
Supplementary Material
FUNDING/SUPPORT
This work was supported by the Intramural Research Program of the National Cancer Institute.
Footnotes
Disclosure of conflicts of interest: The authors declare no potential conflicts of interest
REFERENCES
- 1.Siegel RL, Miller KD, Jemal A. Cancer statistics, 2020. CA Cancer J Clin 2020;70(1):7–30 doi 10.3322/caac.21590. [DOI] [PubMed] [Google Scholar]
- 2.Heron M, Anderson RN. Changes in the Leading Cause of Death: Recent Patterns in Heart Disease and Cancer Mortality. NCHS Data Brief 2016(254):1–8. [PubMed] [Google Scholar]
- 3.Gardner JW, Sanborn JS. Years of potential life lost (YPLL)--what does it measure? Epidemiology 1990;1(4):322–9. [DOI] [PubMed] [Google Scholar]
- 4.May 2, 2019. Surveillance Epidemiology and End Results Program. SEER Cause of Death Recode 1969+ (03/01/2018). <https://seer.cancer.gov/codrecode/1969_d03012018/index.html>. May 2, 2019.
- 5.Jim MA, Arias E, Seneca DS, Hoopes MJ, Jim CC, Johnson NJ, et al. Racial misclassification of American Indians and Alaska Natives by Indian Health Service Contract Health Service Delivery Area. Am J Public Health 2014;104 Suppl 3:S295–302 doi 10.2105/AJPH.2014.301933. [DOI] [PMC free article] [PubMed] [Google Scholar]
- 6.Arias E United States Life Tables, 2017. Natl Vital Stat Rep 2019;68(7):1–66. [PubMed] [Google Scholar]
- 7.October 5, 2019. Cancer Stat Facts: Prostate Cancer. <https://seer.cancer.gov/statfacts/html/prost.html>. October 5, 2019.
- 8.October 5, 2019. Cancer Stat Facts: Testicular Cancer. <https://seer.cancer.gov/statfacts/html/testis.html>. October 5, 2019.
- 9.October 5, 2019. Cancer Stat Facts: Female Breast Cancer. <https://seer.cancer.gov/statfacts/html/breast.html>. October 5, 2019.
- 10.October 5, 2019. Cancer Stat Facts: Cervical Cancer. <https://seer.cancer.gov/statfacts/html/cervix.html>. October 5, 2019.
- 11.Singh GK, Jemal A. Socioeconomic and Racial/Ethnic Disparities in Cancer Mortality, Incidence, and Survival in the United States, 1950-2014: Over Six Decades of Changing Patterns and Widening Inequalities. J Environ Public Health 2017;2017:2819372 doi 10.1155/2017/2819372. [DOI] [PMC free article] [PubMed] [Google Scholar]
- 12.Kish JK, Yu M, Percy-Laurry A, Altekruse SF. Racial and ethnic disparities in cancer survival by neighborhood socioeconomic status in Surveillance, Epidemiology, and End Results (SEER) Registries. J Natl Cancer Inst Monogr 2014;2014(49):236–43 doi 10.1093/jncimonographs/lgu020. [DOI] [PMC free article] [PubMed] [Google Scholar]
- 13.Powell IJ, Bock CH, Ruterbusch JJ, Sakr W. Evidence supports a faster growth rate and/or earlier transformation to clinically significant prostate cancer in black than in white American men, and influences racial progression and mortality disparity. J Urol 2010;183(5):1792–6 doi 10.1016/j.juro.2010.01.015. [DOI] [PMC free article] [PubMed] [Google Scholar]
- 14.Taksler GB, Rothberg MB. Assessing Years of Life Lost Versus Number of Deaths in the United States, 1995-2015. Am J Public Health 2017;107(10):1653–9 doi 10.2105/AJPH.2017.303986. [DOI] [PMC free article] [PubMed] [Google Scholar]
- 15.United Nations. Department of Economic and Social Affairs, Population Division (2019). World Prospects 2019, custom data acquired via website. [Google Scholar]
- 16.Jamal A, Phillips E, Gentzke AS, Homa DM, Babb SD, King BA, et al. Current Cigarette Smoking Among Adults - United States, 2016. Mmwr-Morbid Mortal W 2018;67(2):53–9. [DOI] [PMC free article] [PubMed] [Google Scholar]
- 17.Ryerson AB, Eheman CR, Altekruse SF, Ward JW, Jemal A, Sherman RL, et al. Annual Report to the Nation on the Status of Cancer, 1975-2012, featuring the increasing incidence of liver cancer. Cancer 2016;122(9):1312–37 doi 10.1002/cncr.29936. [DOI] [PMC free article] [PubMed] [Google Scholar]
- 18.Siegel RL, Miller KD, Jemal A. Colorectal Cancer Mortality Rates in Adults Aged 20 to 54 Years in the United States, 1970-2014. JAMA 2017;318(6):572–4 doi 10.1001/jama.2017.7630. [DOI] [PMC free article] [PubMed] [Google Scholar]
- 19.Anderson WF, Rabkin CS, Turner N, Fraumeni JF Jr., Rosenberg PS, Camargo MC. The Changing Face of Noncardia Gastric Cancer Incidence Among US Non-Hispanic Whites. J Natl Cancer Inst 2018. doi 10.1093/jnci/djx262. [DOI] [PMC free article] [PubMed] [Google Scholar]
- 20.Howlader N NA, Krapcho M, Miller D, Brest A, Yu M, Ruhl J, Tatalovich Z, Mariotto A, Lewis DR, Chen HS, Feuer EJ, Cronin KA. SEER Cancer Statistics Review, 1975-2017. National Cancer Institute; Bethesda, MD. [Google Scholar]
- 21.July 22nd, 2020. Years of potential life lost before age 75 for selected causes of death, by sex, race, and Hispanic origin: United States, selected years 1980-2016 In Health, United States, 2017. Centers for Disease ontrol and Prevention; <https://www.cdc.gov/nchs/data/hus/2017/018.pdf>. July 22nd, 2020. [Google Scholar]
- 22.July 22nd, 2020. Publication, Part of Compendium: Mortality Compendium – Years of life lost In NHS Digital. UK National Health Service; <https://digital.nhs.uk/data-and-information/publications/clinical-indicators/compendium-of-population-health-indicators/compendium-mortality/current/years-of-life-lost>. July 22nd, 2020. [Google Scholar]
- 23.July 22nd, 2020. Mortality and potential years of life lost, by selected causes of death and sex, five-year period, Canada and Inuit regions In Statistics Canada. Government of Canada; <https://www150.statcan.gc.ca/t1/tbl1/en/tv.action?pid=1310015701>. July 22nd, 2020. [Google Scholar]
- 24.Arias E, Heron M, National Center for Health S, Hakes J, Bureau USC. The Validity of Race and Hispanic-origin Reporting on Death Certificates in the United States: An Update. Vital Health Stat 2 2016(172):1–21. [PubMed] [Google Scholar]
- 25.Burnet NG, Jefferies SJ, Benson RJ, Hunt DP, Treasure FP. Years of life lost (YLL) from cancer is an important measure of population burden--and should be considered when allocating research funds. Br J Cancer 2005;92(2):241–5 doi 10.1038/sj.bjc.6602321. [DOI] [PMC free article] [PubMed] [Google Scholar]
Associated Data
This section collects any data citations, data availability statements, or supplementary materials included in this article.