Abstract
Lung cancer is one of the leading causes of cancer-related death. In recent years, there has been an increasing interest in the fields of tumor and immunity. This study focused on the possible prognostic value of immune genes in non-small cell lung cancer patients. We used The Cancer Genome Atlas (TCGA) to download gene expression data and clinical information of lung adenocarcinoma (LUAD) and lung squamous cell carcinoma (LUSC). The immune gene list was downloaded from the Immport database. We then constructed immune gene prognostic models on the basis of Cox regression analysis. We further evaluated the clinical significance of the models via survival analysis, receiver operating characteristic (ROC) curves, and independent prognostic factor analysis. Moreover, we analyzed the associations of prognostic models with both mutation burdens and neoantigens. Using the Gene Expression Omnibus (GEO) and Kaplan–Meier plotter databases, we evaluated the validity of the prognostic models. The prognostic model of LUAD included 13 immune genes, and the prognostic model of LUSC contained 10 immune genes. High-risk patients based on prognostic models had a lower 5-year survival rate than did low-risk patients. The ROC curve analysis demonstrated the prediction accuracy of the prognostic models, as the area under the curve (AUC) was 0.742, 0.707, and 0.711 for LUAD, and 0.668, 0.703, and 0.668 for LUSC, when the predicted survival times were 1, 3, and 5 years, respectively. The mutation burden analysis showed that mutation level was associated with the risk score in patients with LUAD. The analysis based on GEO and Kaplan–Meier plotter demonstrated the prognostic validity of the models. Therefore, immune gene-related models of LUAD and LUSC can predict prognosis. Further study of these genes may enable us to better distinguish between LUAD and LUSC and lead to improvement in immunotherapy for lung cancer.
Keywords: non-small cell lung cancer, immune gene, prognostic model, tumor immunity, tumor microenvironment
Introduction
It was estimated that lung cancer would lead to the largest number of cancer-related deaths in both male and female patients by 2020.1 The 1-year survival rate of lung cancer is less than 50%. For patients in the early stage, the 5-year survival rate can reach 56%, but is only 5% for patients in the advanced stage.2 Therefore, it is necessary to update the knowledge on lung cancer to help patients achieve a better prognosis.
There is a large volume of published studies describing the role of the immune system in lung cancer initiation and progression.3 At the same time, the immune system is also considered as an important component of the tumor microenvironment, which mainly includes various stromal cells (fibroblasts and endothelial cells), immune cells (T cells, B cells, dendritic cells, macrophages, and neutrophils), various factors secreted by cells (cytokines, chemokines, hormones, etc.), extracellular matrix, and the vascular system.4
These immune-related cancer studies have mainly focused on the following aspects: interaction of tumor cells and tumor-infiltrating immune cells in the tumor microenvironment, especially via exosomes, which further contribute to form the pre-metastatic niche5; immune cells’ influence on cancer activity, such as eosinophils playing an anticancer role in cryothermal treatment6 and reactivation of dysfunctional natural killer (NK) cells inhibiting tumor growth7; levels of immune cells being related to cancer subtypes and prognosis, which is not only demonstrated in research based on cancer databases but also experimentally confirmed for certain cancer types8,9; and some immune factors being identified as prognostic indicators.10,11 Moreover, studies on the progress of immune checkpoint blockers have aroused great interest in researchers studying immune-related cancer therapy.12
The immune system plays a significant role in lung cancer, and its state largely determines the response to treatment.13 Therefore, in this study, we used The Cancer Genome Atlas (TCGA) database to establish immune gene-related prognosis models in lung adenocarcinoma (LUAD) and lung squamous cell carcinoma (LUSC). We evaluated the prognostic effect of models by TCGA, Gene Expression Omnibus (GEO), and Kaplan–Meier plotter databases. This work may provide new ideas for in-depth mechanistic research and immunotherapy.
Materials and Methods
Data Source
The gene expression data (FPKM values) and clinical data as the training set were downloaded from the TCGA database (https://portal.gdc.cancer.gov). The immune gene list was acquired using the Immport database (https://www.immport.org/shared/genelists). The perl script (perl version 5.28.1) was used to process expression data to obtain mRNA matrix, convert Ensembl ID into gene symbols, and extract relevant clinical information (including survival time, survival status, age, gender, TNM stage, and recurrence) from the downloaded clinical data. The test set GSE3141, including the microarray data, was downloaded from the GEO database. R package sva, which removes batch effects and other unwanted variations in high-throughput experiments, was used to calibrate TCGA and GEO data. We summarized the clinical information in Table 1. In the training set, the gene expression data of LUAD involved 535 tumor samples and 39 normal samples, and for LUSC, 502 tumor samples and 49 normal samples.
Table 1.
The Clinical Information of Lung Cancer Patients From TCGA and GEO Databases.
| Database | TCGA | |
|---|---|---|
| Platform | Illumina HiSeq2000 RNA sequencing platform | |
| Histology types | LUAD | LUSC |
| Age | ||
| ≤60 years | 160 (30.7%) | 108 (21.4) |
| >60 years | 343 (65.7.0%) | 387 (76.8) |
| Unknow | 19 (3.6%) | 9 (1.8) |
| Gender | ||
| Male | 242 (46.4%) | 373 (74.0) |
| Female | 280 (53.6%) | 131 (26.0) |
| TNM stage | ||
| Stage I | 279 (53.4%) | 245 (48.6) |
| Stage II | 124 (23.8%) | 163 (32.3) |
| Stage III | 85 (16.3%) | 85 (16.9) |
| Stage IV | 26 (5.0%) | 7 (1.4) |
| Unknow | 8 (1.5%) | 4 (0.8) |
| T stage | ||
| T1 | 172 (33.0%) | 114 (22.6%) |
| T2 | 281 (53.8%) | 295 (58.5%) |
| T3 | 47 (9.0%) | 71 (14.1%) |
| T4 | 19 (3.6%) | 24 (4.8%) |
| TX | 3 (0.6%) | 0 (0.0%) |
| Unknow | 0 (0.0%) | 0 (0.0%) |
| N stage | ||
| N0 | 335 (64.2%) | 320 (63.5%) |
| N1-3 | 175 (33.5%) | 178 (35.3%) |
| NX | 11 (2.1%) | 6 (1.2%) |
| Unknow | 1 (0.2%) | 0 (0.0%) |
| M stage | ||
| M0 | 353 (67.6%) | 414 (82.1%) |
| M1 | 25 (4.8%) | 7 (1.4%) |
| MX | 140 (26.8%) | 79 (15.7%) |
| Unknow | 4 (0.8%) | 4 (0.8%) |
| Recurrence | ||
| Yes | 109 (20.9%) | 84 (16.7%) |
| No | 197 (37.7%) | 193 (38.3%) |
| Unknow | 216 (41.4%) | 227 (45.0%) |
| Survival status | ||
| Alive | 355 (68.0%) | 304 (60.3%) |
| Dead | 167 (32.0%) | 200 (39.7%) |
| Database | GEO (GSE3141) | |
| platform | Affymetrix Human Genome U133 Plus 2.0 Array (GPL570) | |
| Histology types | LUAD | LUSC |
| Survival status | ||
| Alive | 26 (44.8%) | 27 (50.9%) |
| Dead | 32 (55.2%) | 26 (49.1%) |
Identification of Differentially Expressed Immune Genes
Using the R (https://www.r-project.org/, version 3.6.1) software, the shared genes between the mRNA matrix and immune gene lists were obtained. Through this step, we obtained expression data for immune genes. Differential expression analysis of immune genes was performed using the R package limma. The fold change (FC) of genes was indicated as the base-2 logarithm of FC (logFC). The Benjamini–Hochberg method was used to correct the P value. We considered differentially expressed immune genes as |logFC| > 1 and adjusted P value (adj. P or P. adjust) < 0.01. Adj. P is also called the false discovery rate (FDR or fdr) value.
Analysis of Volcano Plots and Heatmaps
We used heatmaps and volcano plots to present the results of differentially expressed immune genes. The R package pheatmap was used to plot the heatmap.
Establishment of Immune Gene Prognostic Model based on Cox Proportional Hazards Regression Model
First, for clinical information, we removed the patients without survival information or with a survival time of less than 90 days. Next, perl scripts were used to merge the data of differentially expressed immune genes with the corresponding clinical information. Then, the R package survival was used to conduct univariate and multivariate Cox regression analyses. The results of the univariate regression analysis are displayed in the forest plot. The differentially expressed immune genes meeting the filtering criteria (P < 0.01) in univariate Cox regression analysis were further used to build the immune gene prognostic model by multivariate Cox regression analysis. Using the model, we calculated risk scores that equaled the sum of the products of gene expression levels and the corresponding coefficients (∑expression levels * coefficients). The median risk score as the cutoff value was used to divide patients into high- and low-risk groups.
Evaluation of Prognostic Model Based on Survival Curve, ROC Curve, and Independent Prognostic Factor Analysis
R package survival and survminer were used to plot survival curves. R package survivalROC was applied to plot the ROC curve. Univariate and multivariate Cox regression analyses were used to determine independent prognostic factors for lung cancer patients, and the factors meeting P values of less than 0.05 in both univariate and multivariate analyses were considered as independent prognostic factors.
Mutation Burden and Neoantigen Analyses
Mutation data processed by the workflow called VarScan2 Variant Aggregation and Masking were downloaded from the TCGA database. The mutation burden was evaluated by the mutation count excluding synonymous mutations per million bases. We obtained neoantigen data based on the TCGA database from a published study.14
GEO and Kaplan–Meier Plotter Database
GSE3141 was used to validate the prognostic ability of models by survival curve analysis. R package survival and survminer were used to plot survival curves. We obtained survival curves of the single immune gene using the Kaplan–Meier plotter database (https://kmplot.com). We considered that an immune gene was related to survival rate when all probe sets per gene met the criterion of P < 0.05.
Statistical Analysis
For the statistical analysis of the difference in mutation burden and neoantigen levels between the high- and low-risk groups, the nonparametric test (Mann-Whitney U test) was used. The Kaplan–Meier method was used to generate survival curves, and the log-rank test was used to determine statistical differences. P < 0.05 (2-tailed) was considered statistically significant.
Results
Screening of Differentially Expressed Immune Genes and Presentation of Volcano Plots and Heatmaps
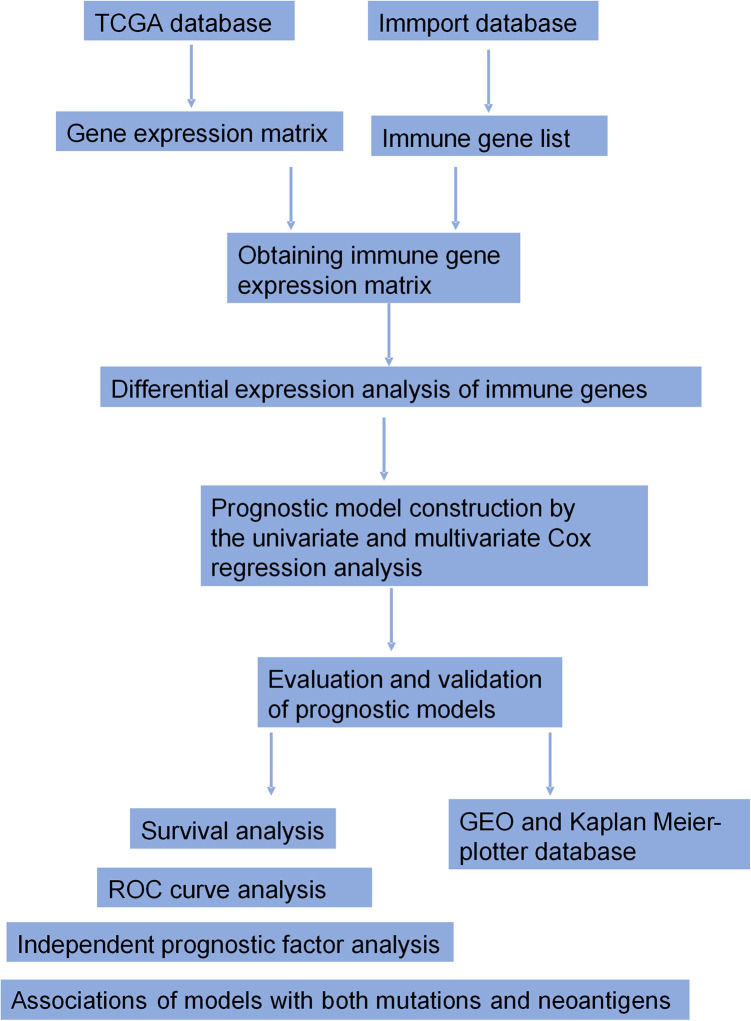
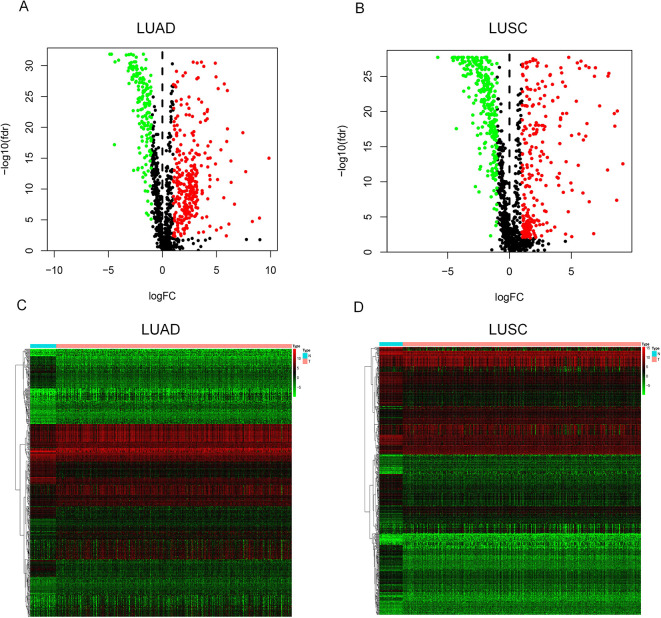
Figure 1 shows the workflow of the construction and validation of the prognostic models. A total of 474 differentially expressed immune genes were selected for LUAD (Table SI), including 312 up-regulated genes and 162 down-regulated genes, and 565 genes were selected for LUSC (Table SII), including 279 up-regulated genes and 286 down-regulated genes. We then displayed the gene expression difference of these immune genes in volcano plots (Figure 2A for LUAD and Figure 2B for LUSC) and heatmaps (Figure 2C for LUAD and Figure 2D for LUSC).
Figure 1.
The workflow of the construction and validation of the prognostic models.
Figure 2.
The volcano plot and heatmap of differentially expressed immune genes. In the volcano plot, red points represent up-regulated genes (logFC > 1 and adj. P < 0.01) and green points represent down-regulated genes (logFC < -1 and adj. P < 0.01), while black points indicate genes without significant differential expression (|logFC| < 1 or adj. P > 0.01). In the heatmap, genes with higher expression are shown in red and genes with lower expression are shown in green, while genes with the same expression level are in black. (A) Volcano plot for LUAD; (B) Volcano plot for LUSC; (C) Heatmap for LUAD; (D) Heatmap for LUSC.
Construction of an Immune Gene Prognostic Model
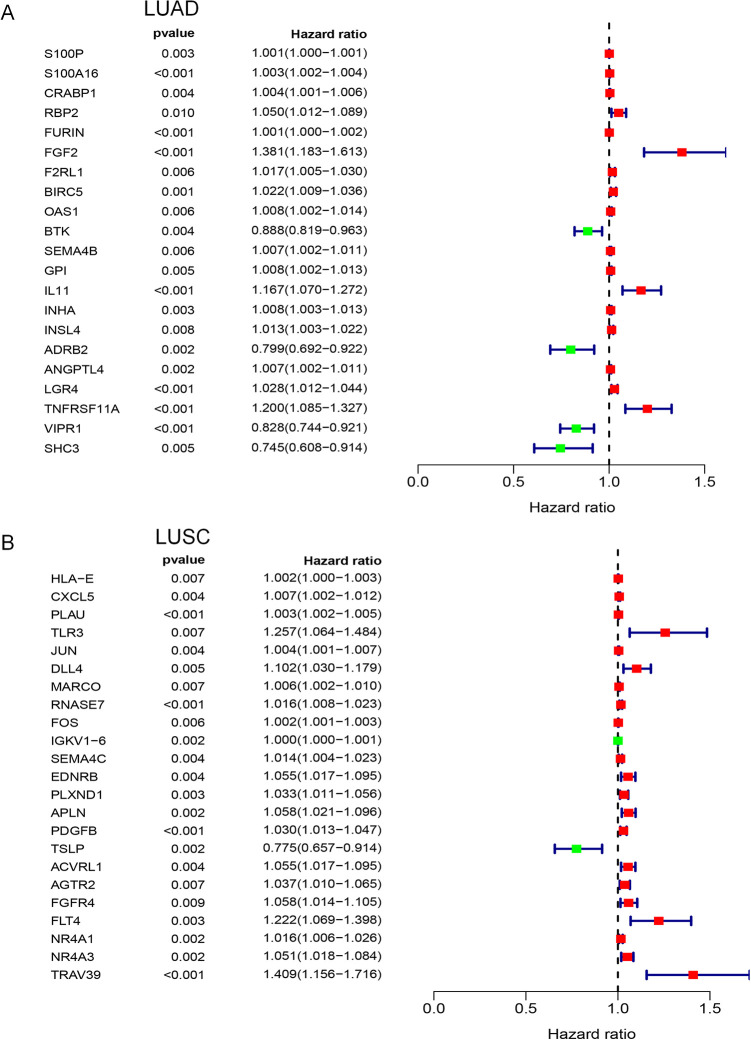
A total of 21 genes were identified in the univariate Cox regression analysis in LUAD (Figure 3A, P < 0.01) and 23 genes in LUSC (Figure 3B, P < 0.01). There were no common genes between LUAD and LUSC. Based on these possible prognostic genes, we built immune gene prognostic models by multivariate Cox regression analysis, as detailed in Table 2 for LUAD and Table 3 for LUSC. Although some genes did not meet the criterion of P < 0.01, it was significant to include these genes in this model when 2 types of genes (P < 0.01 and P >= 0.01) as a whole were statistically related to the prognosis. The genes meeting P < 0.01 in both univariate and multivariate Cox regression analyses were considered as independent prognostic factors.
Figure 3.
Forest plots of univariate Cox regression analysis. In forest plots, the vertical dotted line represents hazard ratio (HR) = 1; the green box represents HR < 1.0, which indicated that the immune gene was a favorable prognostic biomarker; Conversely, red box represents HR > 1.0, which identified the immune gene as a poor prognostic indicator. The length of the horizontal line represents the 95% confidence interval for each immune gene. (A) Forest plot for LUAD; (B) Forest plot for LUSC.
Table 2.
Immune Gene Prognostic Model of LUAD.
| Symbol | Coefficient | HR | HR.95L1 | HR.95H1 | P value |
|---|---|---|---|---|---|
| S100A16* | 0.001608 | 1.00161 | 1.000242 | 1.002979 | 0.021052 |
| CRABP1 | 0.004246 | 1.004255 | 1.001423 | 1.007095 | 0.003214 |
| RBP2 | 0.063071 | 1.065102 | 1.030106 | 1.101287 | 0.000215 |
| FGF2 | 0.294875 | 1.342959 | 1.141534 | 1.579924 | 0.000376 |
| BTK* | -0.06332 | 0.93864 | 0.858823 | 1.025875 | 0.162546 |
| SEMA4B* | 0.005656 | 1.005672 | 1.000444 | 1.010928 | 0.033433 |
| IL11* | 0.12218 | 1.129957 | 1.010837 | 1.263115 | 0.031587 |
| INHA* | 0.006085 | 1.006104 | 1.000331 | 1.01191 | 0.038193 |
| ANGPTL4* | 0.004722 | 1.004733 | 1.000056 | 1.009432 | 0.04731 |
| LGR4* | 0.013986 | 1.014084 | 0.99732 | 1.03113 | 0.10009 |
| TNFRSF11A | 0.215939 | 1.241026 | 1.116963 | 1.37887 | 5.86E-05 |
| VIPR1* | -0.10309 | 0.902048 | 0.812785 | 1.001113 | 0.052497 |
| SHC3* | -0.15857 | 0.853363 | 0.701788 | 1.037676 | 0.111995 |
1HR95 L and HR95 H indicated the lower and upper limits of the 95% confidence interval; * These genes had P values that did not meet the standard P < 0.01 in the multivariate Cox regression analysis.
Table 3.
Immune Gene Prognostic Model of LUSC.
| Symbol | Coefficient | HR | HR.95L1 | HR.95H1 | P value |
|---|---|---|---|---|---|
| CXCL5* | 0.007292 | 1.007319 | 1.001712 | 1.012957 | 0.010455 |
| PLAU | 0.002959 | 1.002963 | 1.001316 | 1.004612 | 0.000417 |
| RNASE7* | 0.011302 | 1.011366 | 1.002049 | 1.02077 | 0.01669 |
| IGKV1-6 | 0.000471 | 1.000471 | 1.000227 | 1.000715 | 0.000153 |
| SEMA4C | 0.013973 | 1.014071 | 1.00448 | 1.023753 | 0.003953 |
| APLN* | 0.042824 | 1.043754 | 1.002141 | 1.087095 | 0.039111 |
| TSLP* | -0.20922 | 0.811214 | 0.686553 | 0.958509 | 0.013981 |
| FGFR4* | 0.042192 | 1.043095 | 1.003405 | 1.084354 | 0.03303 |
| TRAV39 | 0.344197 | 1.410856 | 1.13394 | 1.755397 | 0.002019 |
| JUN* | 0.002498 | 1.002501 | 0.999229 | 1.005785 | 0.134278 |
1HR95 L and HR95 H indicated the lower and upper limits of the 95% confidence interval; * These genes had P values that did not meet the standard P < 0.01 in the multivariate Cox regression analysis.
Clinical Significance of the Immune Gene Prognostic Model
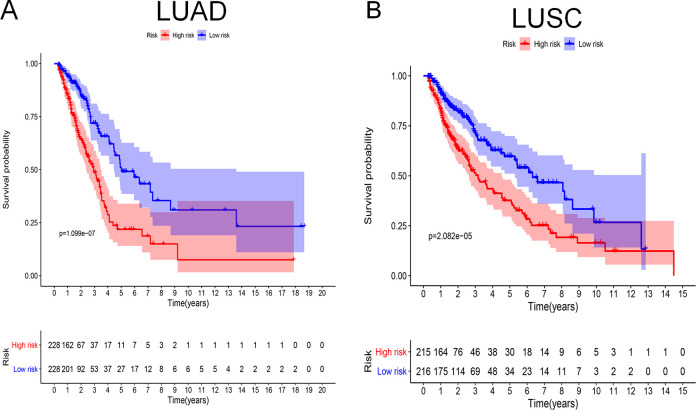
According to the prognostic model, we calculated the risk scores for patients. Based on median risk scores, 456 patients with LUAD and 431 patients with LUSC were divided into high- and low-risk groups. To evaluate the prognostic model, the Kaplan–Meier method was used to generate survival curves and the log-rank test was used to determine the statistical difference (Figure 4A for LUAD and Figure 4B for LUSC). The results showed that the survival rate was significantly different between the high- and low-risk groups of LUAD and LUSC (P = 1.099e-07 and P = 2.082e-05, respecitvely). For LUAD, the 5-year survival rate in the low-risk group was 50% and 20% in the high-risk group. The 5-year survival rate of patients with LUSC in the low-risk group was 60% and that in the high-risk group was 36%.
Figure 4.
Survival curves analysis. At the bottom of survival curves, 2 lines of figures represent the number of survivors in high- and low-risk groups, which decreases gradually with follow-up time. (A) Survival curve for LUAD; (B) Survival curve for LUSC.
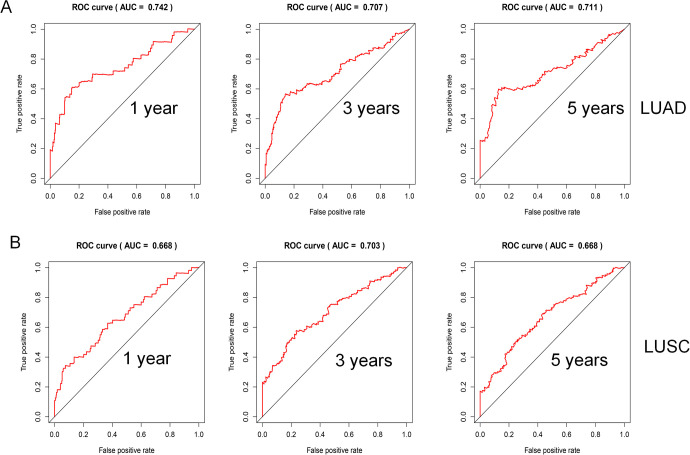
The area under the curve (AUC) of the ROC analysis was used to reflect the prediction accuracy of the prognostic model. When the predicted survival time was 1 year, 3 years, and 5 years, the corresponding AUCs were 0.742, 0.707, and 0.711 for LUAD (Figure 5A), and 0.668, 0.703, and 0.668 for LUSC, respectively (Figure 5B).
Figure 5.
ROC curves analysis. (A) ROC curve for LUAD; (B) ROC curve for LUSC.
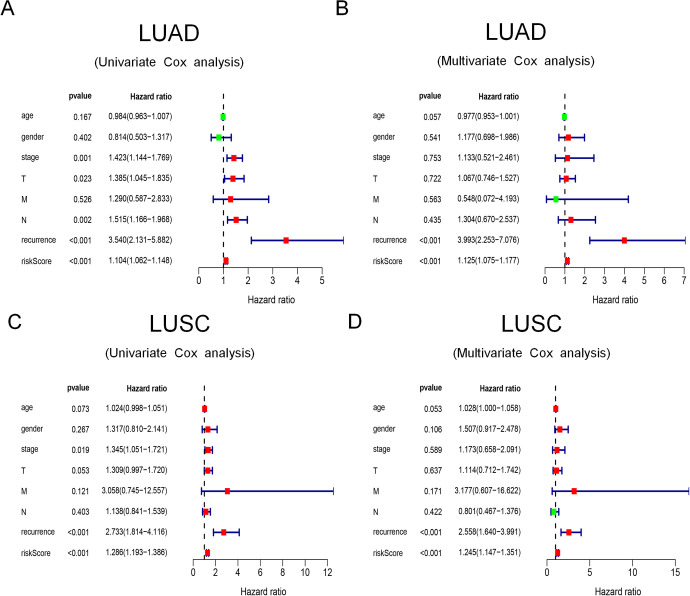
In univariate and multivariate Cox regression analyses of LUAD (Figure 6A of univariate analysis and Figure 6B of multivariate analysis), the results showed that recurrence and risk scores were considered as independent prognostic factors (P < 0.05). Likewise, for LUSC (Figure 6C of univariate analysis and Figure 6D of multivariate analysis), recurrence and risk scores were also considered as independent prognostic factors (P < 0.05).
Figure 6.
The univariate and multivariate Cox regression analyses. (A) The univariate Cox regression analysis of LUAD; (B) The multivariate Cox regression analysis of LUSC; (C) The univariate Cox regression analysis of LUSC; (D) The multivariate Cox regression analysis of LUSC.
Associations of Prognostic Models With Non-Synonymous Mutations and Neoantigens
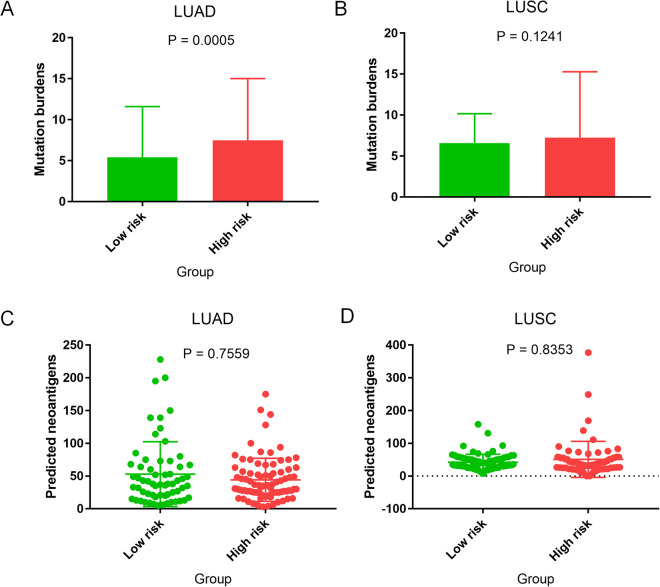
Somatic mutations and neoantigen production are associated with cancer immunity and immunotherapy.15 In our study, we analyzed the difference in non-synonymous mutation burden between the low- and high-risk groups, based on prognostic models, as well as the difference in predicted neoantigens between the 2 groups. In LUAD, patients in the high-risk group had higher mutation burdens than patients in the low-risk group (Figure 7A, P = 0.0005). However, regarding LUSC, the difference in mutation burdens between the 2 groups was not statistically significant (Figure 7B, P = 0.1241). In LUAD and LUSC, there was no statistical difference in the predicted antigens between the 2 groups (Figure 7C, LUAD, P = 0.7559; Figure 7D, LUSC, P = 0.8353).
Figure 7.
Mutation burden and neoantigen analyses. (A) Mutation burden analysis for LUAD; (B) Mutation burden analysis for LUSC; (C) Neoantigen analysis for LUAD; (D) Neoantigen analysis for LUSC.
Validation by GEO and Kaplan–Meier Plotter Databases
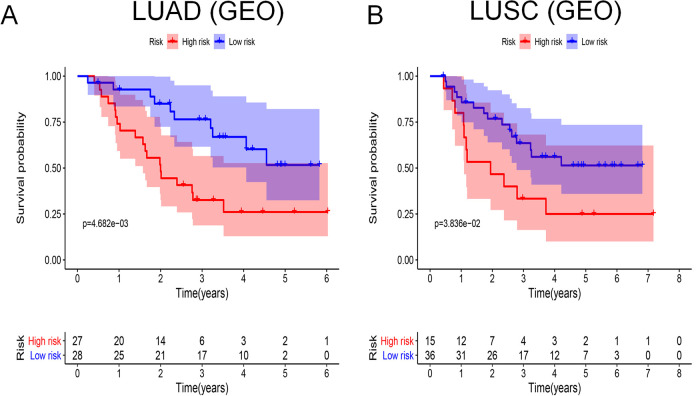
We used GSE3141 from the GEO database to validate the prognostic ability of the models. For both LUAD and LUSC, there were significant differences in survival rates between the high- and low-risk groups (Figure 8A, LUAD, P = 4.682e-03; Figure 8B, LUSC, P = 3.836e-02). In addition, to analyze the prognostic effect of the single immune gene included in prognostic models, we used the Kaplan–Meier plotter database, which included lung cancer data mainly from the GEO database. Figures S1 and S2 show the survival curves of all probe sets per immune gene. We found that for LUAD (Figure S1A-1, S1A-2, S1B-1 and S1B-2), S100A16 (probe set, 227998_at; HR = 2.25; P = 1.4e-10), CRABP1 (probe set, 205350_at; HR = 1.61; P = 6.8e-05), BTK (probe set, 205504_at; HR = 0.7; P = 0.0028), SEMA4B (probe set, 234725_s_at; HR = 1.45; P = 0.0025), INHA (probe set, 210141_s_at; HR = 2, P = 7.2e-09), ANGPTL4 (probe set, 223333_s_at; HR = 1.69; P = 2.6e-05), and ANGPTL4 (probe set, 221009_s_at; HR = 1.63; P = 3.7e-05) were closely related to prognosis, which reflected the effectiveness of the model indirectly. However, in LUSC (Figure S2A-1, S2A-2, S2B-1 and S2B-2), the single immune gene in the model had no significant connection with prognosis.
Figure 8.
Survival curves analysis based on GEO database. At the bottom of survival curves, 2 lines of figures represent the number of survivors in high- and low-risk groups, which decreases gradually with follow-up time. (A) Survival curve for LUAD based on GEO database; (B) Survival curve for LUSC based on GEO database.
Discussion
In this study, immune genes S100A16, CRABP1, RBP2, FGF2, BTK, SEMA4B, IL11, INHA, ANGPTL4, LGR4, TNFRSF11A, VIPR1, and SHC3 were included in the prognostic model of LUAD, while CXCL5, PLAU, RNASE7, IGKV1-6, SEMA4C, APLN, TSLP, FGFR4, TRAV39, and JUN were included in the model of LUSC.
S100A16, which is associated with poorer survival, is considered to be a prognostic marker for platinum-based adjuvant chemotherapy in LUAD after resection.16 CRABP1, which is associated with antimicrobial immunity according to the immune gene classification from the Immport database, is closely related to immune cell proliferation and apoptosis via the ERK signaling pathway. A study showed that mRNA and protein levels of CRABP1 were increased in 42% and 50% of NSCLC patients, respectively.17 To date, no studies have described in detail the action mechanisms of CRABP1 in lung cancer. RBP2 was found to increase the expression of IFN-γ in NK cells by interacting with the P50 and Socs1 promoters as well as to cause the demethylation of H3K4me3 in the Socs1 promoter, further upregulating IFN-γ levels.18 Moreover, RBP2 decreased the expression of E-cadherin by binding to its promoter, which was induced by TGF-β1, and promoted epithelial-to-mesenchymal transition (EMT) in gastric cancer.19 An in-depth exploration of RBP2 function in lung cancer is warranted, as RBP2 is involved in cancer progression by not only influencing cancer-related pathways but also by regulating the innate immune response. Serum FGF2 levels are related to poor prognosis in advanced NSCLC patients by promoting angiogenesis.20 It was well-proven that BTK, as a crucial effector to promote B cell development, played an oncogenic role in B cell malignancies21; however, recent studies have shown that BTK enhances the functions of tumor suppressors, including p53 and p73, in LUAD (H1299) and colon cancer (HCT116) cell lines.22 It has been reported that SEMA4B inhibits tumor cell growth and metastasis in NSCLC by suppressing the PI3K-Akt signaling pathway.23 The function of IL-11 in lung cancer has not been extensively studied. Only 1 article has shown that IL-11 promotes tumor cell growth, invasion, and metastasis in LUAD.24 Singh et al. demonstrated that INK, as a good diagnostic and prognostic marker of ovarian cancers, also plays a role in promoting tumor metastasis and angiogenesis in other cancers, which may offer new vascular targets for cancer therapy.25 ANGPTL4 has an effect on enhancing lung cancer cell invasion and migration partially through the ERK signaling pathway.26 LGR4 belongs to a G-protein coupled receptor and is involved in activating the Wnt signaling pathway to influence tumor progression.27-29 The NCBI gene database (https://www.ncbi.nlm.nih.gov/gene/) shows that TNFRSF11A regulates the interaction between dendritic cells and T cells to change adaptive immune responses, and activates the NF-kappa B and MAPK8/JNK signaling pathways. Despite its possible immense impact on anti-tumor immune responses and cancer development, there are no studies related to TNFRSF11A in LUAD. It has been experimentally shown in a recent study that VIPR1 serves as a tumor suppressor in LUAD, which is consistent with our results.30 Our results showed that SHC3 served as a possible favorable factor for patients with LUAD. The Immport database revealed that SHC3 is associated with the function of NK cells. Meanwhile, the NCBI gene database also showed that SHC3 is present at relatively high levels in normal lung tissue. However, studies on SHC3 in lung cancer are lacking.
Although the single immune gene in the LUSC model had no significant association with prognosis, by retrieving literature in PubMed, we found that CXCL5 could promote tumor progression in colorectal cancer,31 prostate cancer,32 osteosarcoma,33 papillary thyroid carcinoma.34 As a chemokine, CXCL5 recruits neutrophils and promotes angiogenesis. PLAU, which converts plasminogen to plasmin and increases the migration ability of tumor cells, was found to be a positive regulatory factor of colorectal cancer.35 RNASE7 is a possible tumor suppressor in cutaneous squamous cell carcinoma.36 SEMA4C, as the target of cancer-related miRNAs, is down-regulated, which reverses EMT, in lung cancer.37,38 Serum APLN levels increased significantly in LUSC compared to those in other lung cancer types or control groups.39 The expression of TSLP in breast cancer tissue was higher than that in normal tissues and benign tumors.40 JUN is considered an immune-related biomarker in hepatocellular carcinoma, which influences the active states of B cells and T cells.41 The NCBI gene database shows that IGKV1-6 and TRAV39 are related to the functions of B cells and T cells, respectively. However, at present, a search on the corresponding studies of the 2 genes does not display information in PubMed. Compared to FGF2 with high expression levels in LUAD, FGFR4 was more highly expressed in LUSC. Moreover, the NCBI gene database shows that FGFR4 is the gene with the highest expression in normal lung tissue compared to other tissues. At present, considerable research has been focusing on the development of FGFR inhibitors for cancer treatment.42
The significant expression difference in our results and important roles in other cancers encouraged us to investigate the possible impact of these immune genes on lung cancer, although some genes have not been explored in such studies. In LUSC, the inconsistent results are due to the difference in data sources, as prognostic models were constructed using TCGA data, while survival curves of per immune gene were mainly plotted on the basis of the GEO data. The 2 databases contain different patient populations and use distinct detection methods, which led to validation differences. Moreover, whether distinct immune genes in prognostic models of LUAD and LUSC are differentially expressed in the 2 pathological types remains to be verified.
There have been some studies on the construction of prognostic models for lung cancer. However, these studies used different methodologies. Li et al. constructed an 8-gene prognostic signature for NSCLC. In their study, they selected genes that were not limited to immune genes by univariate Cox regression analysis based on TCGA and GEO databases.43 In another study, the prognostic model was constructed by selecting differentially expressed genes based on the ESTIMATE algorithm-derived immune scores.44 Although we used the same database compared with these studies, different analysis methods have generated different models, which will require further experimental validation. Recently, Shi et al. completed a similar study that used the lasso algorithm and multivariate Cox regression analysis to construct a prognostic model of immune genes in LUAD. Their results also demonstrated that ANGPTL4 is a promising immune gene for LUAD prognosis.45 Although there was a relatively large number of immune genes in our models, we suggest that it is appropriate to retain these genes in the models as they play an important role in the immune system and cancer progression. Above all, we also note that the genes in the prognostic models regulate innate and adaptive immune responses in various ways, which inspires us to uncover the interaction between these immune genes and tumor-related immune responses. These prognostic models will be better applied in the clinic to evaluate patient prognosis and guide immunotherapy. Kunimasa et al. systematically summarized the lung cancer-related immune responses. The interaction of the immune system and tumor cells can be divided into 3 stages: the elimination, equilibrium, and escape phases.46 Thus, we may change tumor progression by interfering with related immune cells and molecules in these stages.
Conclusion
We obtained immune gene prognostic models for LUAD and LUSC based on the TCGA database. Using the GEO and Kaplan–Meier plotter databases, we evaluated the validity of the prognostic models. The risk score based on prognostic models of LUAD and LUSC can serve as an independent prognostic factor, and in LUAD, the risk score was related to the mutation burden. Finally, further investigation of these genes can provide novel insights into the potential association between the immune system and lung cancer.
Supplemental Material
Supplemental Material, Figure_S1A-1 for The Combined Detection of Immune Genes for Predicting the Prognosis of Patients With Non-Small Cell Lung Cancer by Wen-Juan Tian, Shan-Shan Liu and Bu-Rong Li in Technology in Cancer Research & Treatment
Supplemental Material, Figure_S1A-2 for The Combined Detection of Immune Genes for Predicting the Prognosis of Patients With Non-Small Cell Lung Cancer by Wen-Juan Tian, Shan-Shan Liu and Bu-Rong Li in Technology in Cancer Research & Treatment
Supplemental Material, Figure_S1B-1 for The Combined Detection of Immune Genes for Predicting the Prognosis of Patients With Non-Small Cell Lung Cancer by Wen-Juan Tian, Shan-Shan Liu and Bu-Rong Li in Technology in Cancer Research & Treatment
Supplemental Material, Figure_S1B-2 for The Combined Detection of Immune Genes for Predicting the Prognosis of Patients With Non-Small Cell Lung Cancer by Wen-Juan Tian, Shan-Shan Liu and Bu-Rong Li in Technology in Cancer Research & Treatment
Supplemental Material, Figure_S2A-1 for The Combined Detection of Immune Genes for Predicting the Prognosis of Patients With Non-Small Cell Lung Cancer by Wen-Juan Tian, Shan-Shan Liu and Bu-Rong Li in Technology in Cancer Research & Treatment
Supplemental Material, Figure_S2A-2 for The Combined Detection of Immune Genes for Predicting the Prognosis of Patients With Non-Small Cell Lung Cancer by Wen-Juan Tian, Shan-Shan Liu and Bu-Rong Li in Technology in Cancer Research & Treatment
Supplemental Material, Figure_S2B-1 for The Combined Detection of Immune Genes for Predicting the Prognosis of Patients With Non-Small Cell Lung Cancer by Wen-Juan Tian, Shan-Shan Liu and Bu-Rong Li in Technology in Cancer Research & Treatment
Supplemental Material, Figure_S2B-2 for The Combined Detection of Immune Genes for Predicting the Prognosis of Patients With Non-Small Cell Lung Cancer by Wen-Juan Tian, Shan-Shan Liu and Bu-Rong Li in Technology in Cancer Research & Treatment
Supplemental Material, Table_SI for The Combined Detection of Immune Genes for Predicting the Prognosis of Patients With Non-Small Cell Lung Cancer by Wen-Juan Tian, Shan-Shan Liu and Bu-Rong Li in Technology in Cancer Research & Treatment
Supplemental Material, Table_SII for The Combined Detection of Immune Genes for Predicting the Prognosis of Patients With Non-Small Cell Lung Cancer by Wen-Juan Tian, Shan-Shan Liu and Bu-Rong Li in Technology in Cancer Research & Treatment
Acknowledgments
We would like to thank Editage (www.editage.cn) for English language editing.
Abbreviations
- adj. P or P. adjust
adjusted P value
- AUC
Area under the curve
- logFC
Base-2 logarithm of fold change
- BP
Biological process
- CC
Cell component
- EMT
Epithelial-to-mesenchymal transition
- FDR or fdr
False discovery rate
- FC
Fold change
- GEO
Gene Expression Omnibus
- GO
Gene ontology
- HR
Hazard ratio
- KEGG
Kyoto Encyclopedia of Genes and Genome
- LUAD
Lung adenocarcinoma
- LUSC
Lung squamous cell carcinoma
- MF
Molecular function
- NK cell
Natural killer cell
- NSCLC
Non-small cell lung cancer
- ROC curve
Receiver operating characteristic curve
- TCGA
The Cancer Genome Atlas
Authors’ Note: TWJ and LSS downloaded and analyzed the data. TWJ wrote the manuscript. TWJ, LSS and LBR read and approved the final manuscript. The datasets used and/or analyzed during the current study are available from the corresponding author on reasonable request.
Authors’ Note: Wen-Juan Tian is also affiliated with Internal Medicine Laboratory, Second Hospital, Shanxi Medical University, Taiyuan, Shanxi, People's Republic of China.
Declaration of Conflicting Interests: The author(s) declared no potential conflicts of interest with respect to the research, authorship, and/or publication of this article.
Funding: The author(s) disclosed receipt of the following financial support for the research, authorship, and/or publication of this article: This study was funded by the Provincial Key Scientific and Technological Project (grant. no. 2014K11-01-01-20) and the Scientific Research Fund From the Second Affiliated Hospital, Xi’an Jiaotong University (2020YJ(ZYTS)526).
ORCID iDs: Shan-Shan Liu  https://orcid.org/0000-0002-4195-210X
Bu-Rong Li  https://orcid.org/0000-0002-4193-4876
Supplemental Material: Supplemental material for this article is available online.
References
- 1. Siegel RL, Miller KD, Jemal A. Cancer statistics, 2020. CA Cancer J Clin. 2020;70(1):7–30. doi:10.3322/caac.21590 [DOI] [PubMed] [Google Scholar]
- 2. Revelo AE, Martin A, Velasquez R, et al. Liquid biopsy for lung cancers: an update on recent developments. Ann Transl Med. 2019;7(15):349 doi:10.21037/atm.2019.03.28 [DOI] [PMC free article] [PubMed] [Google Scholar]
- 3. Hirsch FR, Scagliotti GV, Mulshine JL, et al. Lung cancer: current therapies and new targeted treatments. Lancet. 2017;389(10066):299–311. doi:10.1016/s0140-6736(16)30958-8 [DOI] [PubMed] [Google Scholar]
- 4. Wu T, Dai Y. Tumor microenvironment and therapeutic response. Cancer Lett. 2017;387:61–68. doi:10.1016/j.canlet.2016.01.043 [DOI] [PubMed] [Google Scholar]
- 5. Shao Y, Chen T, Zheng X, et al. Colorectal cancer-derived small extracellular vesicles establish an inflammatory premetastatic niche in liver metastasis. Carcinogenesis. 2018;39(11):1368–1379. doi:10.1093/carcin/bgy115 [DOI] [PubMed] [Google Scholar]
- 6. Jia S, Li W, Liu P, Xu LX. A role of eosinophils in mediating the anti-tumour effect of cryo-thermal treatment. Sci Rep. 2019;9(1):13214 doi:10.1038/s41598-019-49734-5 [DOI] [PMC free article] [PubMed] [Google Scholar]
- 7. Schmidt L, Eskiocak B, Kohn R, et al. Enhanced adaptive immune responses in lung adenocarcinoma through natural killer cell stimulation. Proc Natl Acad Sci USA. 2019;116(35):17460–17469. doi:10.1073/pnas.1904253116 [DOI] [PMC free article] [PubMed] [Google Scholar]
- 8. Hamy AS, Bonsang-Kitzis H, De Croze D, et al. Interaction between molecular subtypes, stromal immune infiltration before and after treatment in breast cancer patients treated with neoadjuvant chemotherapy. Clin Cancer Res. 2019;25(22):6731–6741. doi:10.1158/1078-0432.ccr-18-3017 [DOI] [PubMed] [Google Scholar]
- 9. Zeng D, Li M, Zhou R, et al. Tumor microenvironment characterization in gastric cancer identifies prognostic and immunotherapeutically relevant gene signatures. Cancer Immunol Res. 2019;7(5):737–750. doi:10.1158/2326-6066.cir-18-0436 [DOI] [PubMed] [Google Scholar]
- 10. Chen J, Cao Y, Markelc B, Kaeppler J, Vermeer JA, Muschel RJ. Type I IFN protects cancer cells from CD8+ T cell-mediated cytotoxicity after radiation. J Clin Invest. 2019;129(10). doi:10.1172/jci127458 [DOI] [PMC free article] [PubMed] [Google Scholar]
- 11. Inoue N, Li W, Fujimoto Y, et al. High serum levels of interleukin-18 are associated with worse outcomes in patients with breast cancer. Anticancer Res. 2019;39(9):5009–5018. doi:10.21873/anticanres.13691 [DOI] [PubMed] [Google Scholar]
- 12. Akinleye A, Rasool Z. Immune checkpoint inhibitors of PD-L1 as cancer therapeutics. J Hematol Oncol. 2019;12(1):92 doi:10.1186/s13045-019-0779-5 [DOI] [PMC free article] [PubMed] [Google Scholar]
- 13. Seo JS, Kim A, Shin JY, Kim YT. Comprehensive analysis of the tumor immune micro-environment in non-small cell lung cancer for efficacy of checkpoint inhibitor. Sci Rep. 2018;8(1):14576 doi:10.1038/s41598-018-32855-8 [DOI] [PMC free article] [PubMed] [Google Scholar]
- 14. Rooney MS, Shukla SA, Wu CJ, Getz G, Hacohen N. Molecular and genetic properties of tumors associated with local immune cytolytic activity. Cell. 2015;160(1-2):48–61. doi:10.1016/j.cell.2014.12.033 [DOI] [PMC free article] [PubMed] [Google Scholar]
- 15. Gibney GT, Weiner LM, Atkins MB. Predictive biomarkers for checkpoint inhibitor-based immunotherapy. Lancet Oncol. 2016;17(12): e542–e551. doi:10.1016/s1470-2045(16)30406-5 [DOI] [PMC free article] [PubMed] [Google Scholar]
- 16. Katono K, Sato Y, Kobayashi M, et al. S100A16, a promising candidate as a prognostic marker for platinum-based adjuvant chemotherapy in resected lung adenocarcinoma. OncoTargets Ther. 2017;10:5273–5279. doi:10.2147/ott.s145072 [DOI] [PMC free article] [PubMed] [Google Scholar]
- 17. Favorskaya I, Kainov Y, Chemeris G, Komelkov A, Zborovskaya I, Tchevkina E. Expression and clinical significance of CRABP1 and CRABP2 in non-small cell lung cancer. Tumour Bio. 2014;35(10):10295–10300. doi:10.1007/s13277-014-2348-4 [DOI] [PubMed] [Google Scholar]
- 18. Zhao D, Zhang Q, Liu Y, et al. H3K4me3 demethylase Kdm5a Is required for NK cell activation by associating with p50 to suppress SOCS1. Cell Rep. 2016;15(2):288–299. doi:10.1016/j.celrep.2016.03.035 [DOI] [PubMed] [Google Scholar]
- 19. Liang X, Zeng J, Wang L, et al. Histone demethylase RBP2 promotes malignant progression of gastric cancer through TGF-beta1-(p-Smad3)-RBP2-E-cadherin-Smad3 feedback circuit. Oncotarget. 2015;6(19):17661–17674. doi:10.18632/oncotarget.3756 [DOI] [PMC free article] [PubMed] [Google Scholar]
- 20. Naumnik W, Ossolinska M, Plonska I, Chyczewska E, Niklinski J. Circulating thrombospondin-2 and FGF-2 in patients with advanced non-small cell lung cancer: correlation with survival. Adv Exp Med Bio. 2015;833:9–14. doi:10.1007/5584_2014_78 [DOI] [PubMed] [Google Scholar]
- 21. Rada M, Barlev N, Macip S. BTK: a two-faced effector in cancer and tumour suppression. Cell Death Dis. 2018;9(11):1064 doi:10.1038/s41419-018-1122-8 [DOI] [PMC free article] [PubMed] [Google Scholar]
- 22. Rada M, Barlev N, Macip S. BTK modulates p73 activity to induce apoptosis independently of p53. Cell Death Discov. 2018;4(1):30 doi:10.1038/s41420-018-0097-7 [DOI] [PMC free article] [PubMed] [Google Scholar]
- 23. Jian H, Zhao Y, Liu B, Lu S. SEMA4B inhibits growth of non-small cell lung cancer in vitro and in vivo. Cell Signal. 2015;27(6):1208–1213. doi:10.1016/j.cellsig.2015.02.027 [DOI] [PubMed] [Google Scholar]
- 24. Zhao M, Liu Y, Liu R, et al. Upregulation of IL-11, an IL-6 family cytokine, promotes tumor progression and correlates with poor prognosis in non-small cell lung cancer. Cellular Physiol Biochem. 2018;45(6):2213–2224. doi:10.1159/000488166 [DOI] [PubMed] [Google Scholar]
- 25. Singh P, Jenkins LM, Horst B, et al. Inhibin is a novel paracrine factor for tumor angiogenesis and metastasis. Cancer Res. 2018;78(11):2978–2989. doi:10.1158/0008-5472.can-17-2316 [DOI] [PMC free article] [PubMed] [Google Scholar]
- 26. Zhu X, Guo X, Wu S, Wei L. ANGPTL4 correlates with NSCLC progression and regulates epithelial-mesenchymal transition via ERK pathway. Lung. 2016;194(4):637–646. doi:10.1007/s00408-016-9895-y [DOI] [PubMed] [Google Scholar]
- 27. Zhi X, Zhang J, Cheng Z, Bian L, Qin J. circLgr4 drives colorectal tumorigenesis and invasion through Lgr4-targeting peptide. Int J Cancer. 2019. doi:10.1002/ijc.32549 [DOI] [PubMed] [Google Scholar]
- 28. Yue Z, Yuan Z, Zeng L, et al. LGR4 modulates breast cancer initiation, metastasis, and cancer stem cells. FASEB J. 2018;32(5):2422–2437. doi:10.1096/fj.201700897 R [DOI] [PMC free article] [PubMed] [Google Scholar]
- 29. Yang D, Li JS, Xu QY, Xia T, Xia JH. Inhibitory effect of MiR-449b on cancer cell growth and invasion through LGR4 in non-small-cell lung carcinoma. Curr Med Sci. 2018;38(4):582–589. doi:10.1007/s11596-018-1917-y [DOI] [PubMed] [Google Scholar]
- 30. Zhao L, Yu Z, Zhao B. Mechanism of VIPR1 gene regulating human lung adenocarcinoma H1299 cells. Medical Oncol. 2019;36(11):91 doi:10.1007/s12032-019-1312-y [DOI] [PubMed] [Google Scholar]
- 31. Zhao J, Ou B, Han D, et al. Tumor-derived CXCL5 promotes human colorectal cancer metastasis through activation of the ERK/Elk-1/Snail and AKT/GSK3beta/beta-catenin pathways. Mol Cancer. 2017;16(1):70 doi:10.1186/s12943-017-0629-4 [DOI] [PMC free article] [PubMed] [Google Scholar]
- 32. Roca H, Jones JD, Purica MC, et al. Apoptosis-induced CXCL5 accelerates inflammation and growth of prostate tumor metastases in bone. J Clin Invest. 2018;128(1):248–266. doi:10.1172/jci92466 [DOI] [PMC free article] [PubMed] [Google Scholar]
- 33. Dang H, Wu W, Wang B, et al. CXCL5 Plays a promoting role in osteosarcoma cell migration and invasion in autocrine- and paracrine-dependent manners. Oncol Res. 2017;25(2):177–186. doi:10.3727/096504016x14732772150343 [DOI] [PMC free article] [PubMed] [Google Scholar]
- 34. Cui D, Zhao Y, Xu J. Activation of CXCL5-CXCR2 axis promotes proliferation and accelerates G1 to S phase transition of papillary thyroid carcinoma cells and activates JNK and p38 pathways. Cancer Bio Ther. 2019;20(5):608–616. doi:10.1080/15384047.2018.1539289 [DOI] [PMC free article] [PubMed] [Google Scholar]
- 35. Lin M, Zhang Z, Gao M, Yu H, Sheng H, Huang J. MicroRNA-193a-3p suppresses the colorectal cancer cell proliferation and progression through downregulating the PLAU expression. Cancer Manag Res. 2019;11:5353–5363. doi:10.2147/cmar.s208233 [DOI] [PMC free article] [PubMed] [Google Scholar]
- 36. Scola N, Gambichler T, Saklaoui H, et al. The expression of antimicrobial peptides is significantly altered in cutaneous squamous cell carcinoma and precursor lesions. Brit J Dermatol. 2012;167(3):591–597. doi:10.1111/j.1365-2133.2012.11110.x [DOI] [PubMed] [Google Scholar]
- 37. Li J, Wang Q, Wen R, et al. MiR-138 inhibits cell proliferation and reverses epithelial-mesenchymal transition in non-small cell lung cancer cells by targeting GIT1 and SEMA4C. J Cell Mol Med. 2015;19(12):2793–2805. doi:10.1111/jcmm.12666 [DOI] [PMC free article] [PubMed] [Google Scholar]
- 38. Zhang Y, Huang S. Up-regulation of miR-125b reverses epithelial-mesenchymal transition in paclitaxel-resistant lung cancer cells. Bio Chem. 2015. doi:10.1515/hsz-2015-0153 [DOI] [PubMed] [Google Scholar]
- 39. Gholamnejad M, Meghrazi K, Akhgar M, Shaianmehr M. The assessment of serum apelin-12 level in a variety of pulmonary malignancies in smokers. Addict Health. 2019;11(2):93–99. doi:10.22122/ahj.v11i2.228 [DOI] [PMC free article] [PubMed] [Google Scholar]
- 40. Semlali A, Almutairi M, Reddy Parine N, et al. Expression and allele frequencies of Thymic stromal lymphopoietin are a key factor of breast cancer risk. Mol Genet Genomic Med. 2019;7(8):e813 doi:10.1002/mgg3.813 [DOI] [PMC free article] [PubMed] [Google Scholar]
- 41. Li L, Zhao H, Chen B, et al. Noninvasive identification of immune-related biomarkers in hepatocellular carcinoma. J Oncol. 2019;2019:2531932 doi:10.1155/2019/2531932 [DOI] [PMC free article] [PubMed] [Google Scholar]
- 42. Liu FT, Li NG, Zhang YM, et al. Recent advance in the development of novel, selective and potent FGFR inhibitors. Eur J Med Chem. 2020;186:111884 doi:10.1016/j.ejmech.2019.111884 [DOI] [PubMed] [Google Scholar]
- 43. He R, Zuo S. A Robust 8-gene prognostic signature for early-stage non-small cell lung cancer. Front Oncol. 2019;9:693 doi:10.3389/fonc.2019.00693 [DOI] [PMC free article] [PubMed] [Google Scholar]
- 44. Li J, Li X, Zhang C, Zhang C, Wang H. A signature of tumor immune microenvironment genes associated with the prognosis of nonsmall cell lung cancer. Oncol Rep. 2020;43(3):795–806. doi:10.3892/or.2020.7464 [DOI] [PubMed] [Google Scholar]
- 45. Shi X, Li R, Dong X, et al. IRGS: an immune-related gene classifier for lung adenocarcinoma prognosis. J Transl Med. 2020;18(1):55 doi:10.1186/s12967-020-02233-y [DOI] [PMC free article] [PubMed] [Google Scholar]
- 46. Kunimasa K, Goto T. Immunosurveillance and immunoediting of lung cancer: current perspectives and challenges. Int J Mol Sci. 2020;21(2):597 doi:10.3390/ijms21020597 [DOI] [PMC free article] [PubMed] [Google Scholar]
Associated Data
This section collects any data citations, data availability statements, or supplementary materials included in this article.
Supplementary Materials
Supplemental Material, Figure_S1A-1 for The Combined Detection of Immune Genes for Predicting the Prognosis of Patients With Non-Small Cell Lung Cancer by Wen-Juan Tian, Shan-Shan Liu and Bu-Rong Li in Technology in Cancer Research & Treatment
Supplemental Material, Figure_S1A-2 for The Combined Detection of Immune Genes for Predicting the Prognosis of Patients With Non-Small Cell Lung Cancer by Wen-Juan Tian, Shan-Shan Liu and Bu-Rong Li in Technology in Cancer Research & Treatment
Supplemental Material, Figure_S1B-1 for The Combined Detection of Immune Genes for Predicting the Prognosis of Patients With Non-Small Cell Lung Cancer by Wen-Juan Tian, Shan-Shan Liu and Bu-Rong Li in Technology in Cancer Research & Treatment
Supplemental Material, Figure_S1B-2 for The Combined Detection of Immune Genes for Predicting the Prognosis of Patients With Non-Small Cell Lung Cancer by Wen-Juan Tian, Shan-Shan Liu and Bu-Rong Li in Technology in Cancer Research & Treatment
Supplemental Material, Figure_S2A-1 for The Combined Detection of Immune Genes for Predicting the Prognosis of Patients With Non-Small Cell Lung Cancer by Wen-Juan Tian, Shan-Shan Liu and Bu-Rong Li in Technology in Cancer Research & Treatment
Supplemental Material, Figure_S2A-2 for The Combined Detection of Immune Genes for Predicting the Prognosis of Patients With Non-Small Cell Lung Cancer by Wen-Juan Tian, Shan-Shan Liu and Bu-Rong Li in Technology in Cancer Research & Treatment
Supplemental Material, Figure_S2B-1 for The Combined Detection of Immune Genes for Predicting the Prognosis of Patients With Non-Small Cell Lung Cancer by Wen-Juan Tian, Shan-Shan Liu and Bu-Rong Li in Technology in Cancer Research & Treatment
Supplemental Material, Figure_S2B-2 for The Combined Detection of Immune Genes for Predicting the Prognosis of Patients With Non-Small Cell Lung Cancer by Wen-Juan Tian, Shan-Shan Liu and Bu-Rong Li in Technology in Cancer Research & Treatment
Supplemental Material, Table_SI for The Combined Detection of Immune Genes for Predicting the Prognosis of Patients With Non-Small Cell Lung Cancer by Wen-Juan Tian, Shan-Shan Liu and Bu-Rong Li in Technology in Cancer Research & Treatment
Supplemental Material, Table_SII for The Combined Detection of Immune Genes for Predicting the Prognosis of Patients With Non-Small Cell Lung Cancer by Wen-Juan Tian, Shan-Shan Liu and Bu-Rong Li in Technology in Cancer Research & Treatment


