

Summary
Multiple sclerosis (MS) is a demyelinating disease caused by an auto-reactive immune system. Recent studies also demonstrated synapse dysfunctions in MS patients and MS mouse models. We previously observed decreased synaptic vesicle exocytosis in photoreceptor synapses in the EAE mouse model of MS at an early, preclinical stage. In the present study, we analyzed whether synaptic defects are associated with altered presynaptic Ca2+ signaling. Using high-resolution immunolabeling, we found a reduced signal intensity of Cav-channels and RIM2 at active zones in early, preclinical EAE. In line with these morphological alterations, depolarization-evoked increases of presynaptic Ca2+ were significantly smaller. In contrast, basal presynaptic Ca2+ was elevated. We observed a decreased expression of Na+/K+-ATPase and plasma membrane Ca2+ ATPase 2 (PMCA2), but not PMCA1, in photoreceptor terminals of EAE mice that could contribute to elevated basal Ca2+. Thus, complex Ca2+ signaling alterations contribute to synaptic dysfunctions in photoreceptors in early EAE.
Subject Areas: Biological Sciences, Molecular Biology, Neuroscience, Molecular Neuroscience, Cellular Neuroscience, Cell Biology
Graphical Abstract
Highlights
-
•
Less Cav-channels and RIM2 at the active zones of EAE photoreceptor synapses
-
•
Decreased depolarization-evoked Ca2+-responses in EAE photoreceptor synapses
-
•
Elevated basal, resting Ca2+ levels in preclinical EAE photoreceptor terminals
-
•
Decreased expression of PMCA2 and Na+/K+-ATPase in EAE photoreceptor synapses
Biological Sciences; Molecular Biology; Neuroscience; Molecular Neuroscience; Cellular Neuroscience; Cell Biology
Introduction
Multiple sclerosis (MS) is a severe and frequent demyelinating disease of the central nervous system characterized by inflammation, demyelination, and axonal degeneration in the white matter (Lassmann et al., 2007; Dendrou et al., 2015; Faissner et al., 2019). Optic neuritis is a frequent and early event in MS. The pathogenesis of MS is not completely understood. Recent studies both in MS patients (Loewe et al., 2014; Haider et al., 2014; Jürgens et al., 2016) and mouse models of MS (Habbas et al., 2015; Stampanoni Bassi et al., 2017; Rizzo et al., 2018) revealed that not only the white matter but also the gray matter is affected by the disease. In the gray matter, neurodegeneration, neuronal cell death, and synapse dysfunctions were found (Mandolesi et al., 2015; Stampanoni-Bassi et al., 2017; Schattling et al., 2019). Interestingly, gray matter alterations occur early in the disease before obvious changes in the white matter, arguing against the possibility that these changes happen as a consequence of demyelination. Recently, Dembla et al. (2018) observed synaptic dysfunctions in the retina of the experimental auto-immune encephalomyelitis (EAE) mouse model of MS. The EAE mouse model is a prevalent, frequently used and well-validated model of MS (“gold-standard animal model for MS”; Constantinescu et al., 2011; Robinson et al., 2014; Ben-Nun et al., 2014). In the retina, photoreceptor synapses, an unmyelinated tissue, were particularly strongly affected in early, pre-clinical EAE. These synapses showed morphological and functional alterations, including decreased synaptic vesicle exocytosis and impaired visually guided behavior without gross morphological alterations in the optic nerve at the light and electron microscopic level (Dembla et al., 2018).
Photoreceptor synapses are continuously active ribbon synapses (Matthews and Fuchs, 2010; Lagnado and Schmitz, 2015; Moser et al., 2020). In photoreceptor synapses, synaptic vesicle fusion occurs predominantly at the active zones where L-type voltage-gated Ca2+ (Cav)-channels and RIM proteins, which control Cav-channel function, are enriched. To maintain continuous transmission over long periods of time, the active zones are associated with large presynaptic specializations, the synaptic ribbons that tether additional vesicles (Moser et al., 2020). The RIBEYE protein is the central building block of synaptic ribbons (Schmitz et al., 2000; Maxeiner et al., 2016). At their basal, membrane-proximal end, the ribbons are anchored to the active zones. At the photoreceptor active zone, the L-type Ca2+-channels, consisting of the Cav1.4 pore-forming α1-subunit and the auxiliary β2-and α2δ4 subunits, show little voltage- and Ca2+-dependent inactivation (Wahl-Schott et al., 2006; Joiner and Lee, 2015; Pangrsic et al., 2018), thus promoting continuous synaptic vesicle exocytosis. RIM2 is the major long RIM variant in rod photoreceptor synapses (Grabner et al., 2015; Löhner et al., 2017). CASPR1, an adhesion protein and a frequent auto-immune target (Stathopoulos et al., 2015), is also present at the synaptic ribbon complex (Dembla et al., 2018). The photoreceptor ribbon synapses were affected early on in the preclinical phase of EAE (Dembla et al., 2018). These early synaptic changes in EAE retinas are associated with a rapid and massive auto-immune response directed against retinal proteins, including auto-antibodies against CASPR1, that lead to an enhanced recruitment and activation of a local complement system at retinal synapses. This occurs in parallel with impaired synaptic vesicle exocytosis at photoreceptor synapses, altered synaptic ribbons, and altered visual behavior before the onset of optic nerve demyelination (Dembla et al., 2018).
In the present study, we analyzed molecular mechanisms that might be underlying the early synaptic alterations in photoreceptor synapses of EAE mice. We focused on presynaptic Ca2+ signaling because of its central role in synaptic transmission (Südhof, 2012b, 2014). Furthermore, some drugs used in MS therapy target Ca2+-dependent pathway and Ca2+-homeostasis (Schampel et al., 2017; Ingwersen et al., 2018; Hundehege et al., 2018; Criscuolo et al., 2019; Faissner et al., 2019), emphasizing an important role of Ca2+ in MS. Therefore, we analyzed whether key components of presynaptic Ca2+ signaling at the active zone of photoreceptor synapses might be morphologically altered in early preclinical EAE. Intracellular Ca2+ changes were measured to determine basal synaptic Ca2+ levels under resting conditions and depolarization-evoked Ca2+ responses during stimulation. Using these approaches we found morphological and functional evidence for altered Ca2+ signaling at photoreceptor synapses in early EAE.
Results
In the present study, we tested for possible alterations of Ca2+ homeostasis in the EAE mouse model of MS. In this prevalent, well-validated model (for review, see Constantinescu et al., 2011; Robinson et al., 2014; Ben-Nun et al., 2014), MS-like symptoms are induced by injection of encephalitogenic MOG35-55 peptide from myelin oligodendrocyte glycoprotein (MOG) emulsified with complete Freund's adjuvant (CFA) (and additional pertussis toxin (PTX) injection) (see also Transparent Methods). This MOG35-55-EAE C57BL/6 model is considered as a “gold-standard” animal model for MS (Ben-Nun et al., 2014).
Cav1.4 Is less Enriched at the Active Zone of Photoreceptor Synapses in EAE Mice
We first analyzed the distribution of voltage-gated Ca2+ (Cav) channels in rod photoreceptor synapses of MOG/CFA-injected mice in comparison to CFA-injected control mice (Figures 1, S1, and S2). Rod photoreceptor synapses are located in the outer plexiform layer (OPL) of the retina and can be clearly identified by the presence of a single large horseshoe-shaped synaptic ribbon (Schmitz et al., 2000; Moser et al., 2020). For immunolabeling of Cav-channels, we made use of three different, knockout-verified antibodies against Cav1.4 (Dembla et al., 2020) (Figures 1, S1, and S2). The morphological analyses were performed on retina sections obtained from mice 9 days after injection with MOG/CFA (experimental condition) or CFA alone (control condition). At this time point, the optic nerve appears morphologically unaffected and does not show obvious demyelination and signs of optic neuritis (Fairless et al., 2012; Dembla et al., 2018). This early preclinical time window was chosen to exclude changes in the retina that are secondary to demyelination and axon loss in the optic nerve.
Figure 1.

Cav1.4 Is Less Enriched at the Active Zone of Photoreceptor Synapses in EAE Mice
(A–F) Retina sections (0.5 μm in thickness) from CFA- and MOG/CFA-injected mice processed 9 days after injection. Confocal analyses of rod photoreceptor synapses in the OPL immunolabeled with rabbit polyclonal antibody against Cav1.4 (Cav1.4 Cterm) and mouse monoclonal antibody (2D9) against RIBEYE. The intensity of the Cav1.4 immunosignals is quantified as integrated density in (G and H). The number of Cav1.4 puncta is quantified in (I and J). Values are means ± S.E.M. (G and I). In the box-and-whiskers plots of the data in (H and J) mean values are labeled by blue horizontal bars and median values by green horizontal bars. Boxes represent 25th–75th percentiles of values, and whiskers are equal to 1.5 times of the interquartile range (IQR). Statistical significance was determined with Mann-Whitney U-test. Abbreviations: OPL, outer plexiform layer; S.E.M., standard error of the mean; N = number of mice; n = number of images analyzed from retinal sections. Scale bars: 2 μm.
The typical horseshoe-shaped pattern of immunolabeled synaptic ribbons and Cav1.4-labeled active zones were readily evident in the OPL of CFA-injected control retinas, as demonstrated by double-immunolabeling with Cav1.4- and RIBEYE antibodies (Figures 1, S1, and S2). Confocal microscopy of control retinas demonstrated that both proteins co-localized at the active zone of photoreceptor synapses (Figures 1A–1C, S1A–S1C, and S2A–S2C). All three Cav1.4 antibodies demonstrated that Cav1.4 was still present at the photoreceptor active zone of MOG/CFA-injected EAE mice (Figures 1D–1F, S1D–S1F, and S2D–S2F). But quantitative analyses of the intensity of Cav1.4 immunosignals revealed that the intensity was significantly reduced in photoreceptor active zones of MOG/CFA-injected EAE mice in comparison to CFA-injected control mice (Figures 1G, 1H, S1G, S1H, S2G, and S2H). This reduction in Cav1.4 immunolabeling intensity was consistently observed with all three different Cav1.4 antibodies (Figures 1, S1, and S2). Remarkably, the number of Cav1.4 puncta in the OPL was unchanged between CFA-injected control mice and MOG/CFA-injected EAE mice (Figures 1I, 1J, S1I, S1J, S2I, and S2J). This indicates that the number of photoreceptor synapses and active zones is identical in CFA control and MOG/CFA-injected mice 9 days after injection. These results were consistently observed with the three different Cav1.4 antibodies, Cav1.4 Cterm (Figure 1), Cav1.4 Nterm (Figure S1), and Cav1.4 [16D9] (Figure S2), raised against different regions of Cav1.4. Retinal sections were co-stained with anti-RIBEYE in these experiments to label synaptic ribbon as a reference (Figures 1B, 1E, S1B, S1E, S2B, and S2E). The fluorescence intensity of photoreceptor synaptic ribbons is also reduced in MOG/CFA-injected animals in comparison to CFA-injected control mice (Dembla et al., 2018).
Cav1.4 [16D9] and Cav1.4 Cterm have been previously verified on Cav1.4 knockout tissue (Dembla et al., 2020). The specificity of Cav1.4 Nterm for Cav1.4 is demonstrated in Figure S1K–S1P. The Cav1.4 Nterm generated a strong signal in the OPL of control retina (Figures S1K–S1P), similar to previously published data (Dembla et al., 2020). This Cav1.4 signal in the OPL was completely absent in the Cav1.4 knockout retina (Figure S1N), demonstrating the specificity of the antibody for Cav1.4. Retinal sections were also co-stained with anti-RIBEYE (Figures S1L and S1O). Synaptic ribbons in the OPL are altered in size and distribution in Cav1.4 knockout tissue, as was previously described (for review, see Joiner and Lee, 2015; Pangrsic et al., 2018). All Cav1.4 immunosignals were contained within the PSD95-immunolabeled photoreceptor presynaptic terminals (Figure S3). We did not observe any Cav1.4 immunosignal outside of the photoreceptor terminals (Figures S3N and S3P), similar to as previously described (Dembla et al., 2020).
The Length of Cav1.4 Protein Clusters at the Active Zone of Photoreceptor Synapses Is Decreased in EAE Mice
To better understand the underlying mechanism of the reduced Cav1.4 immunosignal strength in rod photoreceptor synapses of MOG/CFA-injected EAE mice in comparison to littermate control mice, we performed super-resolution structured-illumination-microscopy (SR-SIM) to analyze the size of the Cav1.4-immunolabeled active zone in greater detail. SR-SIM experiments demonstrated that the mean contour length of the Cav1.4 immunosignals in rod photoreceptor synapses of MOG/CFA-injected EAE mice was considerably shorter than in CFA-injected littermate control mice (Figure 2). Thus, the shorter contour length of the Cav1.4 immunosignals appears to be the main reason behind the observed reduced intensity of Cav1.4 immunosignals at rod photoreceptor synapses in EAE mice.
Figure 2.

The Length of Cav1.4 Protein Clusters at the Active Zone Of Photoreceptor Synapses Is Decreased in EAE Mice
3D SR-SIM analyses of individual active zones of rod photoreceptor synapses from CFA-injected control mice and MOG/CFA-injected experimental mice immunolabeled with polyclonal antibody against Cav1.4 Cterm.
(A–D) demonstrate how contour length of individual active zones was determined by 3D SR-SIM. (A) Individual z stack obtained with 3D SR-SIM; (B) the spatial 3D view; (C) the 2D projection of the 3D view with the active zone being rotated parallel to the X, Y-plane; (D) the measurement of the contour length of the presented active zone.
(E and F) Exemplary SR-SIM images from CFA-injected control mice (E) and MOG/CFA-injected EAE mice (F).
(G and H) Quantitative analyses of the active zone contour length (mean ± S.E.M.) (G) obtained from SR-SIM measurements. In the box-and-whiskers plots in (H), mean values are indicated by blue horizontal bars and median values by green horizontal bars. Boxes represent 25th–75th percentiles of values and whiskers are equal to 1.5 times of the IQR. Statistical significance was determined with Mann-Whitney U-test. Abbreviations: S.E.M., standard error of the mean; N = number of mice; n = number of analyzed immunolabelled active zones; OPL, outer plexiform layer. Scale bar: 0.5μm (A).
The Auxiliary β2-Subunit of Cav-Channels Is Also less Enriched at the Active Zone of Photoreceptor Synapses in EAE Mice
To further corroborate these findings, we also tested for the distribution of the auxiliary β2-subunit of the Cav-channels in rod photoreceptor synapses. For this purpose, we used two different, previously characterized antibodies against Cavβ2 (Meissner et al., 2011; Katiyar et al., 2015). Both Cavβ2 antibodies produced similar immunolabeling results (Figures 3A–3C, 3D–3F, S4A–S4C, and S4D–S4F), showing reduced Cavβ2 immunosignal strength in the OPL of MOG/CFA-injected mice in comparison to CFA-injected control mice (Figures 3G, 3H, S4G, and S4H). This reduction in the Cavβ2 immunosignal intensity was similar to the observed decreased intensity of the Cav1.4 α-subunit (Figures 1, S1, and S2). Again, similar to Cav1.4, the number of immunoreactive Cavβ2 puncta in the OPL remained unchanged (Figures 3I, 3J, S4I, and S4J). We also performed SR-SIM analyses with Cavβ2-immunolabeled retinas and found, similar to what we had previously observed for Cav1.4, a reduction in the contour length of the Cavβ2 immunosignals at rod photoreceptor synapses in the OPL of MOG/CFA-injected mice with respect to CFA-injected control littermate mice (Figure 4).
Figure 3.

The Auxiliary β2-Subunit of Cav Channels Is Also Less Enriched at the Active Zone of Photoreceptor Synapses in EAE Mice
(A–F) Retina sections (0.5 μm in thickness) from CFA- and MOG/CFA-injected mice processed 9 days after injection. Confocal analyses of rod photoreceptor synapses in the OPL immunolabeled with rabbit polyclonal antibody against Cavβ2 (ab#1) and mouse monoclonal antibody (2D9) against RIBEYE. The intensity of the Cavβ2 immunosignals is quantified as integrated density in (G and H). The number of Cavβ2 puncta is quantified in (I and J). Values are means ± S.E.M. (G and I). In the box-and-whiskers plots of the data in (H and J) mean values are labeled by blue horizontal bars and median values by green horizontal bars. Boxes represent 25th–75th percentiles of values and whiskers are equal to 1.5 times of the IQR. Statistical significance was determined with Mann-Whitney U-test. Abbreviations: OPL, outer plexiform layer; S.E.M., standard error of the mean; N = number of mice; n = number of images analyzed from retinal sections. Scale bars: 2 μm.
Figure 4.

The Length of Auxiliary Cav Channel β2-Subunit Protein Clusters at the Active Zone of Photoreceptor Synapses Is Decreased in EAE Mice
3D SR-SIM analyses of individual active zones of rod photoreceptor synapses from CFA-injected control mice and MOG-CFA-injected experimental mice immunolabeled with polyclonal antibody against Cavβ2 (ab #1), (A–D) Exemplary SR-SIM images from CFA-injected control mice (A) and MOG/CFA-injected EAE mice (B).
(C and D) quantitative analyses of the active zone contour length (mean ± S.E.M.) (C) obtained from SR-SIM measurements. In the box-and-whiskers plots of the data in (D), mean values are indicated by blue horizontal bars and median values by green horizontal bars. Boxes represent 25th–75th percentiles of values and whiskers are equal to 1.5 times of the IQR. Statistical significance was determined with Mann-Whitney U-test. Abbreviations: S.E.M., standard error of the mean; N = number of mice; n = number of analyzed immunolabeled active zones; OPL, outer plexiform layer.
Validation of RIM2 Antibodies
Next we checked for RIM proteins. RIM proteins are essential components of the active zone and important for controlling central aspects of Cav-channel function (Kaeser et al., 2011, Han et al., 2011; Deng et al., 2011; Eggermann et al., 2011; Südhof, 2012a, 2012b; Hallermann and Silver, 2013; Kim et al., 2013; Nanou and Catterall, 2018). At rod photoreceptor synapses RIM2 is the major long RIM isoform (Grabner et al., 2015; Löhner et al., 2017). Based on its central function for Ca2+ homeostasis, we analyzed the distribution of RIM2 in rod photoreceptor synapses using a mouse monoclonal antibody against RIM2, clone 4C6.
The specificity of the 4C6 monoclonal RIM antibody was verified on photoreceptor-specific RIM1/2 double knockout retina in comparison to control retinas (Figure S5). The RIM2 monoclonal antibody 4C6 generated a strong immunosignal in the OPL of wild-type retinas (Figures S5A–S5C) but not in the OPL of the photoreceptor-specific RIM1/2 double-knockout (DKO) retina (Figures S5D–S5F). In the OPL of photoreceptor-specific RIM1/2 DKO retinas, the RIM2 immunosignals were completely abolished, (Figure S5D) whereas RIBEYE immunosignals (Figure S5E) were qualitatively unaffected. These experiments show that the 4C6 monoclonal antibody specifically detects RIM2 in the murine retina. The specificity of the RIM2 monoclonal antibody 4C6 for the RIM2 peptide was also verified by pre-absorption experiments. The 4C6 monoclonal antibody was pre-absorbed either with the RIM2 peptide against which the antibody was raised (Figure S5J) or with an unrelated control peptide (Figure S5G). Pre-absorption with the RIM2 peptide completely abolished binding of the 4C6 RIM2 antibody to its target in the OPL (Figure S5J), whereas blocking with unrelated peptide had no effect (Figure S5G). Blocking with either peptide had no influence on RIBEYE labeling (Figures S5H, S5I, S5K, and S5L).
RIM2 Is Less Enriched at the Active Zones of Photoreceptor Synapses in EAE Mice
The immunolabeling results obtained with the monoclonal RIM2 antibody 4C6 demonstrated that the RIM2 immunosignals were severely reduced in the active zone of photoreceptor synapses from MOG/CFA-injected mice (Figure 5D) in comparison to CFA-injected control mice (Figure 5A) (for quantification of immunosignal strengths, see Figures 5G and 5H). Similar to Cav1.4 and Cavβ2, the number of immunoreactive RIM2 puncta in the OPL of MOG/CFA-injected mice were unchanged in comparison to CFA-injected littermate control mice (Figures 5I and 5J). Very similar immunolabeling and quantification results were obtained with another RIM2 monoclonal antibody (4F7 RIM2 monoclonal antibody; Figure S6). Fluorescence intensity measurements with the 4F7 RIM2 antibody were performed on CFA and MOG/CFA sections double-immunolabeled with PSD95 (Figures S6A–S6H). Counting of RIM2 puncta with the 4F7 RIM2 antibody was done on sections double-immunolabeled with anti-RIBEYE antibody (for better reference to the active zone [figure not shown]; for quantification see Figures S6I and S6J). We did not perform SR-SIM analyses with the 4C6 or 4F7 monoclonal RIM2 antibodies because the RIM2 immunosignals were too weak in the OPL of MOG/CFA-injected samples and thus difficult to discriminate from background signals after processing for SR-SIM.
Figure 5.

RIM2 Is Less Enriched at the Active Zones of Photoreceptor Synapses in EAE Mice
(A–F) Retinal sections (0.5 μm in thickness) from CFA- and MOG/CFA-injected mice processed 9 days after injection. Confocal analyses of rod photoreceptor synapses in the OPL immunolabeled with mouse monoclonal antibody against RIM2 (4C6) and rabbit polyclonal antibody against RIBEYE (U2656, Schmitz et al., 2000). The intensity of the RIM2 immunosignals were quantified as integrated density in (G and H). The number of RIM2 puncta are quantified in (I and J). Values are means ± S.E.M. (G and I). In the box-and-whiskers plots of the data in (H and J), mean values are indicated by blue horizontal bars and median values by green horizontal bars. Boxes represent 25th–75th percentiles of values and whiskers are equal to 1.5 times of the IQR. Statistical significance was determined with two-sample unpaired Student's t test. Abbreviations: OPL, outer plexiform layer; S.E.M., standard error of the mean; N = number of mice; n = number of images analyzed from the retinal sections. Scale bars: 2 μm.
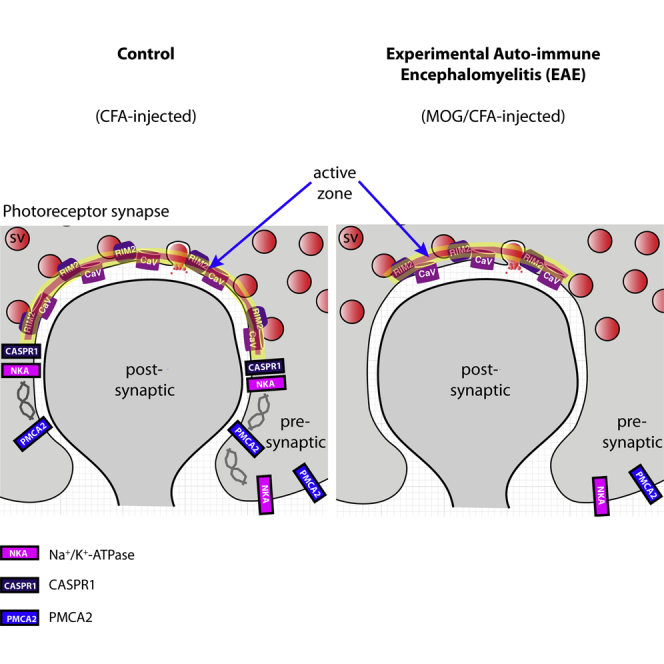
Thus, in conclusion two central components of the active zones (Cav1.4 channels and RIM2 proteins) were consistently less enriched at the active zone of rod photoreceptor synapses of MOG/CFA-injected EAE mice, whereas the number of active zones remained unchanged. This decreased protein enrichment in EAE photoreceptor synapses appeared to be selective for active zone proteins because other proteins of the presynaptic rod photoreceptor terminal, e.g. PSD-95, PMCA1 (the most abundant PMCA protein in the murine retina), were not altered in signal strength in EAE photoreceptor synapses (Figures 8H, 8K, 8M, 8N, 9D, 9G, 9H, S9D, S9G, and S9H) if compared against photoreceptor synapses of CFA-injected control mice (Figures 8B, 8E, 8M, 8N, 9A, 9G, 9H, S9A, S9G, and S9H).
Figure 8.

Decreased Expression of Na+/K+-ATPase in Photoreceptor Synapses of EAE Mice
Distribution of Na+/K+-ATPase in the OPL of CFA-injected control mice (A–F) and in MOG/CFA-injected EAE mice (G–L) processed 9 days after injection. Retinal sections (0.5 μm in thickness) were double-immunolabeled with a mouse monoclonal pan α-subunit Na+/K+-ATPase antibody and a rabbit polyclonal antibody against PSD95. PSD95 denotes the extension of presynaptic photoreceptor terminals. Quantification of immunolabeling signals is shown in (M–P). Statistical significance in (M–P) was determined with Mann-Whitney U-test. In (Q), Fura2 ratiometric signals of basal Ca2+ levels in the OPL of control retinal slices from wild-type mice and retinal slices treated with the Na+/K+-ATPase inhibitor ouabain were plotted (N = 3 mice; n = 43 slices [ouabain]; N = 3 mice; n = 43 slices [untreated controls]). Statistical significance in (Q) was performed with Student t test. Values are depicted as mean ± S.E.M. (M and O). In the box-and-whiskers plots of the individual data points (N, P, and Q), mean values are indicated by blue horizontal bars and median values by green horizontal bars. Boxes represent 25th–75th percentiles of values and whiskers are equal to 1.5 times of the IQR. Abbreviations: ONL, outer nuclear layer; OPL, outer plexiform layer; INL, inner nuclear layer; IPL, inner plexiform layer; bracket a, synaptic portion of the OPL; bracket b, extra-synaptic, neuropil portion of the OPL; S.E.M., standard error of the mean; N = number of mice; n = number of total images analyzed from retinal sections. Scale bars: 5 μm (A–L).
Figure 9.

Expression of Plasma Membrane Ca2+ ATPase 1 (PMCA1) Is Unchanged in Photoreceptor Synapses of EAE Mice
(A–F) Retina sections (0.5 μm in thickness) from CFA- and MOG/CFA-injected mice processed 9 days after injection. Confocal analyses of rod photoreceptor synapses in the OPL immunolabeled with rabbit polyclonal antibody against PMCA1 and rabbit polyclonal antibody against PSD95 using the Fab method. The intensity of the PMCA1 immunosignals is quantified as integrated density in (G and H). Values are means ± S.E.M. (G). In the box-and-whiskers plots of the data in (H), mean values are labeled by blue horizontal bars and median values by green horizontal bars. Boxes represent 25th–75th percentiles of values, and whiskers are equal to 1.5 times of the interquartile range (IQR). Statistical significance was determined with Mann-Whitney U-test. Abbreviations: ONL, outer nuclear layer; OPL, outer plexiform layer; INL, inner nuclear layer; IPL, inner plexiform layer; GCL, ganglion cell layer; bracket a, synaptic sub-layer of the OPL; bracket b, extra-synaptic, neuropil sub-layer of the OPL; S.E.M., standard error of the mean; N = number of mice; n = number of images analyzed from retinal sections. Scale bars: 5 μm.
Fura2 Ca2+ Imaging of Photoreceptor Synapses in the Outer Plexiform Layer of the Retina
Next, we asked whether the observed morphological changes of active zone proteins also lead to functional alterations. For this purpose, we performed Fura2 Ca2+ imaging and monitored high K+-depolarization-induced Ca2+ entry in the OPL of retinal slices of mice that were injected with either MOG/CFA (EAE experimental group) or with CFA (control group). Fura2 recordings were performed at 7 days (Figure 6A), 8 days (Figures 6B), and 9 days (Figure 6C) after injection. Regions of interest (ROIs) for analyses were placed at the OPL between the ONL and INL, as identified by phase contrast microscopy, F380 epifluorescence, and F340/F380 fluorescence signals. To further confirm proper localization of the ROIs, we also analyzed RIBEYE-FP-transgenic mice in which synaptic ribbons are fluorescently labeled (Okawa et al., 2019). These controls confirmed that the ROIs were properly placed and further suggested that the strongest K+-depolarization-evoked responses were observed at the presynaptic photoreceptor terminals in the OPL (Figure S7), in agreement with previous findings (for review, see Van Hook et al., 2019).
Figure 6.

Altered presynaptic Ca2+ signaling at photoreceptor synapses in EAE mice
(A–C) Mean Fura2 ratiometric Ca2+ signals (±S.E.M.) measured in the OPL of CFA-injected control mice and MOG/CFA-injected EAE mice. Intracellular Ca2+ signals were measured at the indicated days after injection (day 7, day 8, or day 9 after injection). After 1min incubation in RS to obtain stable baseline signals, slices were depolarized by the addition of a K+-rich depolarization solution, as indicated by the red bar. Mean calibrated Ca2+ concentration before and after addition of high potassium are indicated for each analyzed day after injection. In (D), the mean baseline Fura2 responses were plotted from MOG/CFA-injected EAE mice and CFA-injected control mice. Values are shown as means ± S.E.M. (D). In (E), the data summarized in (D) were plotted as box-and-whiskers plots to show their individual distribution. Mean values are indicated by blue horizontal bars and median values by green horizontal bars (E). Boxes represent 25th–75th percentiles of values and whiskers are equal to 1.5 times of the IQR. Statistical significance was determined with two-sample unpaired Student's t test (data of day 7, day 8) and with Mann-Whitney U-test (data of day 9). Using the calibration described in Materials and Methods, the following Ca2+ concentrations were determined for Fura2 baseline values at resting conditions on day 7: 173 nM Ca2+ (for CFA), 319 nM Ca2+ (for MOG/CFA); on day 8: 169 nM Ca2+ (for CFA), 284 nM Ca2+ (for MOG/CFA); and on day 9: 198 nM Ca2+ (for CFA), 295 nM Ca2+ (for MOG/CFA). For the high K+-depolarization-evoked responses, the following Ca2+ concentrations were determined for day 7: 300 nM Ca2+ (for CFA), 439 nM Ca2+ (for MOG/CFA); on day 8: 283 nM Ca2+ (for CFA), 381 nM Ca2+ (for MOG/CFA); and on day 9: 316 nM Ca2+ (for CFA), 386 nM Ca2+ (for MOG/CFA). Abbreviations: OPL, outer plexiform layer; S.E.M., standard error of the mean; N = number of mice; n = number of retinal slices.
Decreased High K+-Depolarization-Evoked Ca2+ Responses and Elevated Basal, Resting Ca2+ Levels in Photoreceptor Synapses of EAE Mice
With Fura2 Ca2+ imaging, we observed severe alterations in presynaptic Ca2+ in photoreceptor synapses of MOG/CFA-injected mice in comparison to CFA-injected control mice (Figures 6 and 7). The Ca2+ baseline levels were consistently higher (more than ≈100nM) in photoreceptor synapses of EAE mice in comparison to control synapses from CFA-injected mice (Figures 6A–6C; quantification in 6D, and 6E). In contrast, the high K+-depolarization-induced increases of presynaptic Ca2+ concentration were smaller in MOG/CFA-injected mice in comparison to CFA-injected control mice (Figures 6A–6C and 7). In order to better analyze the evoked Ca2+ responses independent of the different resting values, we normalized the evoked responses to identical baseline levels (Figures 7A–7F). Normalization to identical starting baseline levels clearly revealed the decrease in high K+-evoked Ca2+ responses in the MOG/CFA-injected animals in comparison to the littermate controls. K+-depolarization-induced responses were reduced on all days analyzed, as early as on day 7 after injection (Figures 7A and 7B). The high K+-depolarization-evoked Ca2+ responses could be best fitted by a single exponential curve (Figures 7B, 7D, and 7F). From the respective mono-exponential curve fits we extracted the response amplitudes (Figures 7G and 7H). In all cases, the amplitudes of depolarization-evoked responses were significantly smaller in EAE mice (Figures 7G and 7H). The decreased evoked responses are most likely caused by the alterations of the active zone described above. The high K+-depolarization-evoked Ca2+ responses in the OPL were due to Ca2+ influx through voltage-gated Ca2+ (Cav) channels as shown by control experiments with Co2+ (Figures S7J and S7K).
Figure 7.

Decreased High K+-Depolarization-Evoked Ca2+ Responses in Photoreceptor Synapses of EAE Mice
Analyses of depolarization-evoked Fura2 ratiometric Ca2+ signals at photoreceptor synapses of MOG/CFA-injected EAE mice and CFA-injected control mice at the indicated days after injection (day 7, day 8, and day 9 after injection). Curves shown in (A, C, E) represent the Fura2 F340/F380 ratiometric signals (from Figure 6), normalized to the resting Fura2 signals before high potassium application for better display of the Fura2 signals that result from depolarization-evoked increase of presynaptic Ca2+. In (B, D, F), only the normalized signals after high potassium application are depicted together with the respective curve fits. Statistical analyses of the normalized, high potassium-induced depolarization Fura2 signals are shown in (G, H). Values are shown as means ± S.E.M. (A–G). In the box-and-whiskers plot of the individual data points in (H), mean values are indicated by blue horizontal bars and median values by green horizontal bars. Boxes represent 25th–75th percentiles of values and whiskers are equal to 1.5 times of the IQR. Statistical significance was determined with Mann-Whitney U-test (data of day 7) and with two-sample unpaired Student's t test (data of day 8, day 9). Abbreviations: OPL, outer plexiform layer; S.E.M., standard error of the mean; N = number of mice; n = number of retinal slices.
As shown in Figure 6, presynaptic basal Ca2+ in MOG/CFA-injected EAE mice under resting conditions was higher in comparison to control mice. It is well known that cytoplasmic Ca2+ is increased by inhibition of the Na+/K+-ATPase (Schatzmann, 1953; Repke and Portius, 1963; Repke, 1964; Skou, 1998; Ravens and Himmel, 1999; Katz and Lorell, 2000; Aizman et al., 2001; Kaplan, 2002; Wasserstrom and Aistrup, 2005; Bay et al., 2013; Blaustein 2018; Blaustein and Hamlyn, 2020). Interestingly, Na+/K+-ATPase can interact with CASPR1 (Zhang et al., 2019). At photoreceptor synapses, CASPR1 is altered early on in preclinical EAE (Dembla et al., 2018). Therefore, we studied whether the phenotype of increased basal Ca2+ might be caused by a change of Na+/K+-ATPase expression levels in the retina of MOG/CFA-injected mice compared with CFA-injected controls.
Decreased Expression of Na+/K+-ATPase in Photoreceptor Synapses of EAE Mice
In CFA-injected control mice, we found a strong expression of the Na+/K+-ATPase in the synaptic layers of the retina, similar to what was previously described (McGrail and Sweadner, 1986; Wetzel et al., 1999). In the OPL, a large portion of the Na+/K+-ATPase was localized to photoreceptor synapses as demonstrated by co-labeling with anti-PSD95 (Figure 8). PSD95, a component of the presynaptic cytoskeleton of the plasma membrane in photoreceptor terminals, delineates the presynaptic terminals (Koulen et al., 1998). Part of the Na+/K+-ATPase immunosignals was also present in the extra-synaptic, neuropil sub-layer of the OPL (Figures 8F and 8L). In the OPL of MOG/CFA-injected mice the immunolabeling intensity of Na+/K+ATPase was strongly reduced, both in the synaptic as well as in the extra-synaptic sublayer of the OPL (Figures 8G and 8J; for quantification see Figures 8O and 8P). In contrast, the intensity of PSD95 immunosignals was unchanged in MOG/CFA-injected mice compared with CFA-injected control mice (Figures 8M and 8N). The decreased Na+/K+-ATPase expression in the OPL of MOG/CFA-injected mice in comparison to CFA-injected control mice went in parallel to a decreased expression of CASPR1 in the OPL (Figure S8), similar to as previously described (Dembla et al., 2018).
In order to estimate the relevance of the observed decreased levels of Na+/K+-ATPase for the elevated presynaptic basal Ca2+ levels in photoreceptor synapses of MOG/CFA-injected mice, we incubated acute retinal slices from untreated wildtype mice in the presence or absence of the cardiotonic steroid ouabain, a well-characterized inhibitor of the Na+/K+-ATPase pump (Schatzmann, 1953; Repke, 1964; Hansen, 1984). In agreement with previous findings (Repke, 1964; Blaustein 1993; Zucker, 1993; Amaral et al., 2009; Milla et al., 2011), we observed an increase in presynaptic Ca2+ after treatment with ouabain (Figure 8Q). This finding suggests that the decreased expression of Na+/K+-ATPase in photoreceptor synapses in early EAE observed in the present study can contribute to the elevated basal Ca2+ levels in photoreceptor synapses of MOG/CFA-injected mice.
Decreased Expression of Plasma Membrane Ca2+ ATPase 2 (PMCA2), but Not of PMCA1, in Photoreceptor Synapses of EAE Mice
PMCAs are major Ca2+ extruding proteins in the retina (Krizaj et al., 2002). Therefore, we also analyzed the plasma membrane calcium ATPase (PMCA) proteins for potential alterations. PMCAs are key proteins of Ca2+ extrusion at the plasma membrane that are also expressed in photoreceptor terminals (Brini and Carafoli, 2011; Križaj, 2012; Cali et al., 2017; Stafford et al., 2017). Furthermore, a proteome study has found a portion of PMCA to be part of an active zone - associated protein network (Müller et al., 2010).
Similar to Na+/K+-ATPase (Figure 8), PMCA immunosignals were found both in the extra-synaptic neuropil portion as well as in the synaptic portion of the OPL, with the latter being demarcated by PSD95 immunolabeling (Figures 9, 10, S9, and S10).
Figure 10.

Decreased Expression of Plasma Membrane Ca2+ ATPase 2 (PMCA2) in Photoreceptor Synapses of EAE Mice
(A–L) Retina sections (0.5 μm in thickness) from CFA- and MOG/CFA-injected mice processed 9 days after injection. Confocal analyses of rod photoreceptor synapses in the OPL immunolabeled with mouse monoclonal antibody against PMCA2/3 and rabbit polyclonal antibody against PSD95. The intensity of the PMCA2/3 immunosignals is quantified as integrated density in (M and N). Values are means ± S.E.M. (M). In the box-and-whiskers plots of the data in (N), mean values are labeled by blue horizontal bars and median values by green horizontal bars. Boxes represent 25th–75th percentiles of values and whiskers are equal to 1.5 times of the interquartile range (IQR). Statistical significance was determined with Mann-Whitney U-test. Abbreviations: ONL, outer nuclear layer; OPL, outer plexiform layer; INL, inner nuclear layer; IPL, inner plexiform layer; bracket a, synaptic sub-layer of the OPL; bracket b, extra-synaptic, neuropil sub-layer of the OPL; S.E.M., standard error of the mean; N = number of mice; n = number of images analyzed from retinal sections. Scale bars: 5 μm.
Antibodies against PMCA1, the most abundant PMCA isoform, revealed no change in expression at the OPL in early EAE, both in the synaptic as well as in the extra-synaptic sub-layer (Figures 9 and S9). PMCA1 expression in the IPL was also unaffected (Figures 9 and S9). In contrast, antibodies against PMCA2/3 revealed a significantly reduced signal intensity in the OPL of EAE mice in comparison to control mice, both in the synaptic as well as in the extra-synaptic sub-layer of the OPL (Figure 10). PMCA2/3 expression was also reduced in the IPL (Figure 10). A further independent antibody raised against PMCA2 also confirmed a strong reduction in signal intensity in the OPL of MOG/CFA-injected mice in comparison to CFA-injected control mice (Figure S10). These latter two antibodies propose that PMCA2 expression is reduced in the OPL of MOG/CFA-injected EAE mice in comparison to CFA-injected control mice. We did not further analyze PMCA3 because PMCA3 was previously reported to be not expressed in presynaptic photoreceptor terminals (Krizaj et al., 2002).
Western Blot Analyses
We also performed western blot analyses to check whether the global expression of the mentioned proteins was altered (Figure 11; for quantification, see Figures S11 and S12). From all the proteins only PMCA2/3 was found to be altered at a global level. Thus, decreased immunosignals of all the other proteins were based on de-enrichment/de-clustering but not due to a reduction in the global levels of protein expression.
Figure 11.

Western Blot Analyses
Western blot (WB) testing of global protein expression in retinal lysates obtained from MOG/CFA- and CFA-injected control retinas, isolated 9 days after injection. 40 μg of protein was loaded in each lane. In A, C, E, G, and I, the samples were probed with the indicated experimental antibodies. In B, D, F, H, and J, the same lanes were incubated with anti-actin antibody to verify equal protein loading of the MOG/CFA and CFA lanes. The boxed areas were quantified in Figures S11 and S12. Figure A–J show representative images from WB experiments repeated 7 times; for quantification of all WB results, see Figure S11 and S12.
Discussion
In the current study, we observed that the clustering of active zone proteins at photoreceptor synapses is altered in the EAE mouse model of MS very early on in a preclinical stage. We found that central protein components of the Ca2+-signaling machinery of photoreceptor active zones (Cav1.4, Cavβ2, and RIM2) were significantly less enriched at the active zone of photoreceptor synapse in MOG/CFA-injected mice in comparison to CFA-injected control mice. This was shown by immunolabeling of retinas obtained at the early, preclinical stage of EAE, at day 9 after injection. At this time point, no signs of demyelination were observed in the optic nerve (Dembla et al., 2018), arguing that these alterations are not secondary changes, e.g. due to optic nerve demyelination. Other proteins of the presynaptic terminal, such as PSD95 and PMCA1, were not affected, demonstrating that the changes at the active zone are specific and not resulting from global alterations of protein composition. The decreased enrichment of active zone proteins was not due to loss of synapses because the number of active zone puncta remained unchanged between EAE and control mice (Figures 1I, 1J, S1I, S1J, S2I, S2J, 3I, 3J, S4I, S4J; Figures 5I, 5J, S6I, and S6J). Instead, the length of the respective protein clusters at the active zone, as determined by SR-SIM measurements of immunolabeled active zone protein clusters (Cav1.4; Cavβ2), was found to be decreased (Figures 2 and 4). The decrease in the size of the Cav1.4/Cavβ2 protein clusters at the active zone was not due to a reduction of global expression of these proteins, as shown by western blot analyses (Figures 11A, 11C, 11E, and S11) but most likely result from an altered recruitment of these proteins to the active zone. Recently, it has been shown that the active zone of photoreceptor synapses can be modulated in size and that this dynamics occurs within a relatively short time frame (in ≈20 min; Dembla et al., 2020). A similar mechanism, i.e. loss of protein components from the active zone, could also be engaged in mediating the early synaptic changes in EAE.
In line with the morphological defects at the active zone, we also observed alterations of Ca2+ signaling in the presynaptic terminal. The amplitudes of high K+-depolarization-evoked Ca2+ responses were significantly decreased in MOG/CFA-injected mice in comparison to CFA-injected control mice (Figure 7). The Fura2 responses were recorded at the OPL of retinal slices. In the OPL, photoreceptor synapses are highly enriched in a very organized fashion (see also Figure S7A) and harbor all the Cav1.4 voltage-gated Cav-channels that are expressed (Figure S3; see also Dembla et al., 2020). The strongest Fura2 responses were observed in the sub-layer of the OPL in which the photoreceptor terminals are located, as also verified by co-recording in RIBEYE-FP mice (Figure S7). Therefore, we think that the recorded depolarization-evoked responses are largely occurring at photoreceptor synapses although we cannot exclude some contribution from horizontal cells (for review, see Van Hook et al., 2019). The smaller amplitudes of depolarization-evoked Ca2+ responses in EAE are in line with the observed decreased enrichment of Cav-channel components and RIM2 protein at the active zone of EAE mice. The decreased enrichment of these active zone proteins in photoreceptor synapses and the decreased depolarization-evoked Ca2+ responses could contribute also to the previously observed reduced synaptic vesicle exocytosis in early EAE (Dembla et al., 2018) because vesicle exocytosis depends on Ca2+. Recently, it has been proposed that the synaptic ribbon is involved in the delivery of active zone material to the active zone and for regulating the size of the active zone (Dembla et al., 2020). The synaptic ribbon complex itself is strongly affected in early EAE (Dembla et al., 2018), raising the possibility that disturbed trafficking at the ribbon complex might be involved in the decreased enrichment of active zone proteins at photoreceptor synapses in EAE. Clearly, further investigations will be required to reveal the molecular mechanisms. Additional proteins of the active zone (tom Dieck et al., 2012; Kiyonaka et al., 2012; Hagiwara et al., 2018) could also play an important role in the re-organization of the active zone in early, pre-clinical EAE. The reasons for the increased basal Ca2+ levels in photoreceptor synapses of EAE mice most likely involve additional pathways (see below).
Except for Cav1.4 α1 subunit, the analyzed proteins (RIM2, Cavβ2) are cytoplasmic proteins of the active zone. How could an auto-reactive immune system, activated in EAE, target the presynaptic active zone? The protein CASPR1 could play an important role. CASPR1 is an auto-antigen frequently targeted in MS (Stathopoulos et al., 2015). In the retina, CASPR1 is found in a protein complex with RIBEYE, the main component of synaptic ribbons (Dembla et al., 2018). In agreement with these biochemical data, ultrastructural analyses also show localization of CASPR1 in close proximity to the synaptic ribbon (Dembla et al., 2018). CASPR1 is also present at the paranodal region of the node of Ranvier (Gordon et al., 2014; Stathopoulos et al., 2015), on the luminal surface of brain microvascular endothelial cells (Zhang et al., 2019) as well as on dendritic processes of secondary neurons (Dembla et al., 2018). In the endothelium, CASPR1 can even serve as a receptor for pathogenic bacterial proteins that promote entry of the bacteria into the CNS (Zhao et al., 2018a, 2018b). CASPR1 also directly interacts with the β3-subunit of Na+/K+-ATPase in brain endothelial cells and this interaction is important for the activity, stabilization, and surface expression of Na+/K+-ATPase (Zhang et al., 2019). Interestingly, the β3-subunit of Na+/K+-ATPase is also present in photoreceptor synapses (McGrail and Sweadner, 1986; Blanco and Mercer, 1998; Wetzel et al., 1999) and thus available to form complexes with CASPR1. In early EAE, auto-antibodies against CASPR1 lead to a decrease of CASPR1 expression at photoreceptor synapses (Dembla et al., 2018). Because CASPR1 is known to stabilize Na+/K+-ATPase, the observed decreased expression of Na+/K+-ATPase (Figures 8 and S8) could result from the decreased expression of CASPR1 in photoreceptor synapses in early EAE as observed by Dembla et al. (2018). Na+/K+-ATPase is also reduced in the extra-synaptic portion of the OPL, which might be due to a reduction of CASPR1 also at extra-synaptic sites or by further, independent mechanisms.
Decreased expression of Na+/K+-ATPase in photoreceptor terminals will lead to a diminished extrusion of Na+ and an increase of intracellular Na+. This increase of intracellular Na+ could subsequently result in a secondary increase of intracellular Ca2+, in analogy to well-characterized processes in the heart. In the heart, inhibition of Na+/K+-ATPase (e.g. by ouabain or other foxglove glycosides) leads to an increase of intracellular Na+ that drives the Na+/Ca2+-exchanger (NCX) into the “reverse mode” with a concomitant increase of intracellular Ca2+ (e.g. Katz and Lorell, 2000; Hirota et al., 2007; Sibarov et al., 2012; Verkhratsky et al., 2018). Such a mechanism could principally also be responsible for the elevated resting cytosolic Ca2+ in retinal photoreceptor synapses, as it was also shown to be relevant in other synapses (e.g. Zucker, 1993). NCX is expressed in photoreceptor synapses although at low levels (Morgans et al., 1998) and predominantly in cone photoreceptor synapses that represent only a minor fraction of all photoreceptor synapses in the mouse retina (Johnson et al., 2007). Rod photoreceptors also possess a Na+/Ca2+K+-exchanger (NCKX) (Schnetkamp, 1986; Cook and Kaupp, 1988; Reiländer et al., 1992). But NCKX expression in photoreceptors is restricted to the plasma membrane of the outer segments (Reid et al., 1990; Schnetkamp, 2013; Vinberg et al., 2015; Hassan and Lytton, 2020; Jalloul et al., 2020). In some systems, inhibition of the Na+/K+-ATPase by ouabain leads to an increase of cytosolic Ca2+ that is in part also mediated by increased Ca2+ release from the endoplasmic reticulum (ER)(Amaral et al., 2009; Stafford et al., 2017). The decreased expression of Na+/K+-ATPase that we observed in early EAE could lead to elevated resting Ca2+ concentrations by a similar mechanism in photoreceptor synapses. Interestingly, recently it was shown that the β-subunit of Cav-channels inhibits Ca2+ release from the ER(Belkacemi et al., 2018). This was demonstrated for the β3-subunit of voltage-gated Cav channels (Belkacemi et al., 2018). Rod photoreceptor synapses, the predominant type of photoreceptor synapses in the mouse retina, express the Cavβ2-subunit instead (Ball et al., 2002; Katiyar et al., 2015). Possibly, the β2-subunit of Cav-channels at photoreceptor synapses might play a similar role in inhibiting Ca2+ release from the ER in photoreceptor synapses. These ER-related mechanisms could also be linked to the Na+/K+-ATPase. The Na+/K+-ATPase appears to represent a central signaling hub that regulates—beyond its pump activity—various events relevant for presynaptic Ca2+ including the control of intracellular Ca2+ stores (Yuan et al., 2005; Pierre and Xie, 2006; Aperia, 2007; Liang et al., 2007; Liu et al., 2007; Nguyen et al., 2011; Sibarov et al., 2012; Luan et al., 2014; Shi et al., 2019).
Besides Na+/K+-ATPase, decreased clearance of Ca2+ by plasma membrane Ca2+ ATPases (PMCAs) could also contribute to elevated basal Ca2+ in the OPL of early EAE mice. PMCAs are known to be strongly expressed in photoreceptor synapses and other parts of the retina (Morgans et al., 1998; Johnson et al., 2007; Stafford et al., 2017). Using a monoclonal antibody against PMCA2/3, we found PMCA2/3 to be less enriched at photoreceptor synapse in MOG/CFA-injected animals (in comparison to CFA-injected control animals, Figure 10). This effect was observed to be specific for PMCA2/3 because the major PMCA isoform, PMCA1, was found to be unaffected (Figures 9 and S9). Also, an antibody specific for PMCA2 showed a similar reduction in staining intensity (Figure S10), as the antibody against PMCA2/3. PMCA3 is not expressed in detectable amounts at photoreceptor terminals (Krizaj et al., 2002). Therefore, we also assume that the decreased immunosignal in the OPL of MOG/CFA-injected mice obtained with the anti-PMCA2/3 antibody is mainly caused by a decrease in the synaptic expression of PMCA2. Of particular interest, PMCA2 was previously found to be altered in the spinal cord in the EAE mouse model of MS and responsible for early neuronal dysfunction (Nicot et al., 2003, 2005; Kurnellas et al., 2007; Mirabelli et al., 2019). Furthermore, PMCA2/3 was the only protein that we found to be reduced in western blot analyses (Figures 11, S11, and S12), indicating that PMCA2 could play a prominent role in the synaptic pathology in early EAE.
Also further other mechanisms could contribute to the increased basal Ca2+, e.g. decreased Ca2+ clearance from the presynaptic terminals, e.g. via altered NCX/NCKX activity, mitochondrial Ca2+ clearance, SERCA pump activity, calcium-induced calcium release (CICR), or activities of plasma membrane ion channels as well as altered coupling between plasma membrane ion channels and calcium stores (Morgans et al., 1998; Zenisek and Matthews, 2000; Amaral et al., 2009; Szikra et al., 2009; Wan et al., 2012; Križaj, 2012; Sibarov et al., 2012; Feske et al., 2015; Stafford et al., 2017; Ben-Kasus-Nissim et al., 2017; Verkhratsky et al., 2018; Shi et al., 2019). CICR is a well-known phenomenon at photoreceptor synapses (Cadetti et al., 2006; Szikra et al., 2009; Babai et al., 2010; Chen et al., 2015). In photoreceptor synapses, mitochondria are placed close to the synaptic ribbons (Johnson et al., 2007; Stone et al., 2008; Linton et al., 2010; Perkins et al., 2012; Graffe et al., 2015; Li et al., 2016) and possess a strong impact on Ca2+ regulation in retinal ribbon synapses (Zenisek and Matthews, 2000; Wan et al., 2012; Wong et al., 2019). Also, the cation chloride co-transporter NKCC1 is enriched in photoreceptor synapses (Shen et al., 2013) that can affect presynaptic Ca2+ (Thoreson et al., 2000, 2002, 2003). Future studies have to clarify which of these pathways also contribute to the observed elevated resting cytosolic Ca2+ levels in photoreceptor synapses in early EAE.
Our study demonstrated that the situation of Ca2+ homeostasis is already complex on day 9 of early preclinical EAE. Two key components relevant for determining baseline Ca2+ levels in photoreceptor synapses, Na+/K+−ATPase and PMCA2, were already altered at day 9. Based on these results, future studies might target even earlier time points. Our Fura2 imaging revealed dysfunctions of Ca2+ homeostasis as early as on day 7 of preclinical EAE.
In conclusion, we showed that the active zone of photoreceptor synapses is strongly affected in the early stages of EAE. These alterations of the active zone can contribute to the recently described changes in synaptic vesicle exocytosis present in photoreceptor synapses of EAE mice (Dembla et al., 2018). Constantly elevated basal levels of Ca2+ could lead to synapse dysfunctions, neurodegeneration, and neuronal cell death (Sancho-Pelluz et al., 2008; Gadjanski et al., 2009; Fairless et al., 2014; Rodriguez-Muela et al., 2015; Schaefer et al., 2016; Wong et al., 2019). Finally, MS patients also show some alterations in ERG that are compatible with altered photoreceptor synapse function, e.g. increased peak delay time of the b-wave/b-wave implicit time and some alterations in b-wave amplitude (Forooghian et al., 2006; Gundogan et al., 2007; Saidha et al., 2011; You et al., 2018; Filgueiras et al., 2019).
Limitations of the Study
The present study was performed on the experimental auto-immune encephalomyelitis (EAE) mouse model of MS. The EAE model is a very well-validated and frequently used mouse model of MS. Future investigations on MS patients should also provide further insights into retinal synaptic pathology in humans.
Resource Availability
Lead Contact
Further information and requests for resources and reagents should be directed to and will be fulfilled by the Lead Contact, Frank Schmitz (frank.schmitz@uks.eu).
Materials Availability
Available from the corresponding authors upon request.
Data and Code Availability
All data are included in the published article and the Supplemental Information, and any additional information will be available from the corresponding authors upon request.
Methods
All methods can be found in the accompanying Transparent Methods supplemental file.
Acknowledgments
The excellent technical assistance of Gabi Kiefer, Sylvia Brundaler, and Sabine Schmidt is gratefully acknowledged. We thank PD Dr. Elmar Krause/Prof. Dr. Jens Rettig for access to the SR-SIM microscope; Prof. Dr. Thomas C. Südhof for the kind gift of the PSD95 antibody, and Prof. Dr. Martin Biel for Cav1.4 knockout tissue. Work of the authors was supported by research grants from the German Research Community/DFG (FOR2289) to VF, KS, and FS and by a research grant from the Dr. Rolf M. Schwiete Foundation and Saarländische Staatskanzlei to FS. We acknowledge the funding programme Open Access Publishing of the Saarland University.
Author Contributions
AM conducted embeddings, confocal and SR-SIM imaging experiments, Fura2 Ca2+ imaging, western blots, analyzed data, and developed the study together with FS. AM wrote the manuscript together with FS. RK contributed in establishing Fura2 Ca2+ imaging protocols along with AM. ED conducted embedding and imaging (Figures S1K–S1P). MD conducted embeddings and contributed materials (Figures S5A–S5F). PK generated fusion protein for generating Cav Nterm antibody. AB1 characterized Cavβ2 antibodies along with AM. MJ generated Cav Nterm, Cav Cterm antibodies, and synthesized peptides. AB2 provided guidance and insights into the Fura2 imaging experiments. VF initiated project parts and provided valuable materials and inputs at various stages of this work. KS wrote the relevant animal proposal, conducted mice injections and embeddings, and supported analyses. FS designed and supervised the study and wrote the article along with AM. All authors revised the manuscript.
Declaration of Interests
The authors declare no competing interests.
Published: December 18, 2020
Footnotes
Supplemental Information can be found online at https://doi.org/10.1016/j.isci.2020.101830.
Contributor Information
Amrita Mukherjee, Email: mukherjee.amrita85@gmail.com.
Frank Schmitz, Email: frank.schmitz@uks.eu.
Supplemental Information
References
- Aizman O., Uhlen P., Lal M., Brismar H., Aperia A. Ouabain, a steroid hormone that signals with slow calcium oscillations. Proc. Natl. Acad. Sci. U S A. 2001;98:13420–13424. doi: 10.1073/pnas.221315298. [DOI] [PMC free article] [PubMed] [Google Scholar]
- Amaral E., Leite L.F., Gomez M.V., Prado M.A.M., Guatimosim C. Ouabain evokes exocytosis dependent on ryanodine and mitochondrial calcium stores that is not followed by compensatory endocytosis at the neuromuscular junction. Neurochem. Int. 2009;55:406–413. doi: 10.1016/j.neuint.2009.04.009. [DOI] [PubMed] [Google Scholar]
- Aperia A. New roles for an old enzyme: Na,K-ATPase emerges as an interesting drug target. J. Intern. Med. 2007;261:44–52. doi: 10.1111/j.1365-2796.2006.01745.x. [DOI] [PubMed] [Google Scholar]
- Babai N., Morgans C.W., Thoreson W.B. Calcium-induced calcium release contributes to synaptic release from mouse rod photoreceptors. Neuroscience. 2010;165:1447–1456. doi: 10.1016/j.neuroscience.2009.11.032. [DOI] [PMC free article] [PubMed] [Google Scholar]
- Ball S.L., Powers P.A., Shin H.S., Morgans C.W., Peachey N.S., Gregg R.G. Role of the beta2 subunit of voltage-gated channels in the retinal outer plexiform layer. Invest. Ophthalmol. Vis. Sci. 2002;43:1595–1603. [PubMed] [Google Scholar]
- Bay Y., Morgan E.E., Giovannucci D.R., Pierre S.V., Philipson K.D., Askari A., Liu L. Different roles of the cardiac Na+/Ca2+-exchanger in ouabain-induced inotropy, cell signaling, and hypertrophy. Am. J. Physiol. Heart Circ. Physiol. 2013;304:H427–H435. doi: 10.1152/ajpheart.00462.2012. [DOI] [PMC free article] [PubMed] [Google Scholar]
- Belkacemi A., Hui X., Wardas B., Laschke M.W., Wissenbach U., Menger M.D., Lipp P., Beck A., Flockerzi V. IP3 receptor-dependent cytoplasmic Ca2+ signals are tightly controlled by Cavβ3. Cell Rep. 2018;22:1339–1349. doi: 10.1016/j.celrep.2018.01.010. [DOI] [PubMed] [Google Scholar]
- Ben-Kasus Nissim T., Zhang X., Elazar A., Roy S., Stolwijk J.A., Zhou Y., Motiani R.K., Gueguinou M., Hempel N., Hershfinkel M. Mitochondria control store-operated Ca2+ entry through Na+ and redox signals. EMBO J. 2017;36:797–815. doi: 10.15252/embj.201592481. [DOI] [PMC free article] [PubMed] [Google Scholar]
- Ben-Nun A., Kaushansky N., Kawakami N., Krishnamoorthy G., Berer K., Liblau R., Hohlfeld R., Wekerle H. From classic to spontaneous and humanized models of multiple sclerosis: impact on understanding pathogenesis and drug development. J. Autoimmun. 2014;54:33–50. doi: 10.1016/j.jaut.2014.06.004. [DOI] [PubMed] [Google Scholar]
- Blanco G., Mercer R.W. Isozymes of the Na-K-ATPase: heterogeneity in structure, diversity in function. Am. J. Physiol. 1998;275:633–650. doi: 10.1152/ajprenal.1998.275.5.F633. [DOI] [PubMed] [Google Scholar]
- Blaustein M.P. Physiological effects of endogenous ouabain: control of intracellular stores and cell responses. Am. J. Physiol. Cell Physiol. 1993;264:C1367–C1387. doi: 10.1152/ajpcell.1993.264.6.C1367. [DOI] [PubMed] [Google Scholar]
- Blaustein M.P. The pump, the exchanger, and the holy spirit: origins and 40-year evolution of ideas about the ouabain-Na+ pump endocrine system. Am. J. Physiol. Cell Physiol. 2018;314:C3–C26. doi: 10.1152/ajpcell.00196.2017. [DOI] [PMC free article] [PubMed] [Google Scholar]
- Blaustein M.P., Hamlyn J.M. Ouabain, endogenous ouabain and ouabain-like factors: the Na+ pump, ouabain receptor, its linkage to NCX and its myriad functions. Cell Calcium. 2020;86:102159. doi: 10.1016/j.ceca.2020.102159. [DOI] [PubMed] [Google Scholar]
- Brini M., Carafoli E. The plasma membrane Ca2+ ATPase and the plasma membrane sodium calcium exchanger cooperate in the regulation of cell calcium. Cold Spring Harb. Perspect. Biol. 2011;3:a004168. doi: 10.1101/cshperspect.a004168. [DOI] [PMC free article] [PubMed] [Google Scholar]
- Cadetti L., Bryson E.J., Ciccone C.A., Rabl K., Thoreson W.B. Calcium-induced calcium release in rod photoreceptor terminals boosts synaptic transmission during maintained depolarization. Eur. J. Neurosci. 2006;23:2983–3990. doi: 10.1111/j.1460-9568.2006.04845.x. [DOI] [PMC free article] [PubMed] [Google Scholar]
- Cali T., Brini M., Carafoli E. Regulation of cell calcium and role of plasma membrane calcium ATPases. Int. Rev. Cell Mol. Biol. 2017;332:259–296. doi: 10.1016/bs.ircmb.2017.01.002. [DOI] [PubMed] [Google Scholar]
- Chen M., van Hook M.J., Thoreson W.B. Ca2+ diffusion through endoplasmic reticulum supports elevated intraterminal Ca2+ levels needed to sustain synaptic release from rods in darkness. J. Neurosci. 2015;35:11364–11373. doi: 10.1523/JNEUROSCI.0754-15.2015. [DOI] [PMC free article] [PubMed] [Google Scholar]
- Constantinescu C.S., Farooqi N., O’Brien K., Gran B. Experimental autoimmune encephalomyelitis (EAE) as a model system for multiple sclerosis (MS) Br. J. Pharmacol. 2011;164:1079–1106. doi: 10.1111/j.1476-5381.2011.01302.x. [DOI] [PMC free article] [PubMed] [Google Scholar]
- Cook N.J., Kaupp U.B. Solubilization, purification, and reconstitution of the sodium-calcium exchanger from bovine retinal rod outer segments. J. Biol. Chem. 1988;263:11382–11388. [PubMed] [Google Scholar]
- Criscuolo C., Cianflone A., Lanzillo R., Carrella A., Napolitano F., de Cegli R., de Candia P., La Rocca C., Petrozziello T., Matarese G. Glatiramer acetate modulates ion channel expression and calcium homeostasis in B cells of patients with relapsing-remitting multiple sclerosis. Sci. Rep. 2019;9:4208. doi: 10.1038/s41598-018-38152-8. [DOI] [PMC free article] [PubMed] [Google Scholar]
- Dembla E., Dembla M., Maxeiner S., Schmitz F. Synaptic ribbons foster active zone stability and illumination-dependent active zone enrichment of RIM2 and Cav1.4 in photoreceptor synapses. Sci. Rep. 2020;10:5957. doi: 10.1038/s41598-020-62734-0. [DOI] [PMC free article] [PubMed] [Google Scholar]
- Dembla M., Kesharwani A., Natarajan S., Fecher-Trost C., Fairless R., Williams S.K., Flockerzi V., Diem R., Schwarz K., Schmitz F. Early auto-immune targeting of photoreceptor ribbon synapses in mouse models of multiple sclerosis. EMBO Mol. Med. 2018;10:e8926. doi: 10.15252/emmm.201808926. [DOI] [PMC free article] [PubMed] [Google Scholar]
- Dendrou C.A., Fugger L., Friese M.A. Immunopathology of multiple sclerosis. Nat. Rev. Immunol. 2015;15:545–558. doi: 10.1038/nri3871. [DOI] [PubMed] [Google Scholar]
- Deng L., Kaeser P.S., Xu W., Südhof T.C. RIM proteins activate vesicle priming by reversing homodimerization of Munc13. Neuron. 2011;69:317–331. doi: 10.1016/j.neuron.2011.01.005. [DOI] [PMC free article] [PubMed] [Google Scholar]
- Eggermann E., Bucurenciu I., Goswami S.P., Jonas P. Nanodomain coupling between Ca2+ channels and sensors of exocytosis at fast mammalian synapses. Nat. Rev. Neurosci. 2011;13:7–21. doi: 10.1038/nrn3125. [DOI] [PMC free article] [PubMed] [Google Scholar]
- Fairless R., Williams S.K., Hoffmann D.B., Stojic A., Hochmeister S., Schmitz F., Storch M.K., Diem R. Preclinical neurodegeneration in a mouse model of multiple sclerosis. J. Neurosci. 2012;32:5585–5597. doi: 10.1523/JNEUROSCI.5705-11.2012. [DOI] [PMC free article] [PubMed] [Google Scholar]
- Fairless R., Williams S.K., Diem R. Dysfunction of neuronal calcium signaling in neuroinflammation and neurodegeneration. Cell Tiss. Res. 2014;357:455–462. doi: 10.1007/s00441-013-1758-8. [DOI] [PubMed] [Google Scholar]
- Faissner S., Plemel J.R., Gold R., Yong W. Progressive multiple sclerosis: from pathophysiology to therapeutic strategies. Nat. Rev. Drug Discov. 2019;18:905–922. doi: 10.1038/s41573-019-0035-2. [DOI] [PubMed] [Google Scholar]
- Feske S., Wulff H., Skolnik E.Y. Ion channels in innate and adaptive immunity. Annu. Rev. Immunol. 2015;33:291–353. doi: 10.1146/annurev-immunol-032414-112212. [DOI] [PMC free article] [PubMed] [Google Scholar]
- Filgueiras T.G., Oyamada M.K., Preti R.C., Apostolos-Pereira S., Callegaro D., Monteiro M.L.R. Outer retinal dysfunction on multifocal electroretinography may help differentiating multiple sclerosis from neuromyelitis optica spectrum disorders. Front. Neurol. 2019;10:928. doi: 10.3389/fneur.2019.00928. [DOI] [PMC free article] [PubMed] [Google Scholar]
- Forooghian F., Sproule M., Westall C., Gordon L., Jirawuthiworavong G., Shimazaki K., O’Connor P. Electroretinographic abnormalities in multiple sclerosis: possible role for retinal autoantibodies. Doc. Ophthalmol. 2006;113:123–132. doi: 10.1007/s10633-006-9022-0. [DOI] [PubMed] [Google Scholar]
- Gadjanski I., Boretius S., Williams S.K., Lingor P., Knöfele J., Sättler M.B., Fairless R., Hochmeister S., Sühs K.W., Michaelis T. Role of N-type voltage-dependent calcium channels in autoimmune optic neuritis. Ann. Neurol. 2009;66:81–93. doi: 10.1002/ana.21668. [DOI] [PubMed] [Google Scholar]
- Gordon A., Adamsky K., Vainshtein A., Frechter S., Dupree J.L., Rosenbluth J., Peles E. Caspr and Caspr2 are required for both radial and longitudinal organization of myelinated axons. J. Neurosci. 2014;34:14820–14826. doi: 10.1523/JNEUROSCI.3369-14.2014. [DOI] [PMC free article] [PubMed] [Google Scholar]
- Grabner C.P., Gandini M.A., Rehak R., Le Y., Zamponi G.W., Schmitz F. RIM1/2-mediated facilitation of Cav1.4 channel opening is required for Ca2+-stimulated release in mouse photoreceptors. J. Neurosci. 2015;35:13133–13147. doi: 10.1523/JNEUROSCI.0658-15.2015. [DOI] [PMC free article] [PubMed] [Google Scholar]
- Graffe M., Zenisek D., Taraska J.W. A marginal band of microtubules transports and organizes mitochondria in retinal bipolar synaptic terminals. J. Gen. Physiol. 2015;146:109–117. doi: 10.1085/jgp.201511396. [DOI] [PMC free article] [PubMed] [Google Scholar]
- Gundogan F.C., Demirkaya S., Sobaci G. Is optical coherence tomography really a new biomarker candidate in multiple sclerosis ? – a new structural and functional evaluation. Invest. Ophthalmol. Vis. Sci. 2007;48:5773–5781. doi: 10.1167/iovs.07-0834. [DOI] [PubMed] [Google Scholar]
- Habbas S., Santello M., Becker D., Stubbe H., Zappia G., Liaudet N., Klaus F.R., Kollias G., Fontana A., Pryce C.R. Neuroinflammatory TNFα impairs memory via astrocyte signaling. Cell. 2015;163:1730–1741. doi: 10.1016/j.cell.2015.11.023. [DOI] [PubMed] [Google Scholar]
- Hagiwara A., Kitahara Y., Grabner C.P., Vogl C., Abe M., Kitta R., Ohta K., Nakamura K., Sakimura K., Moser T. Cytomatrix proteins CAST and ELKS regulate retinal photoreceptor development and maintenance. J. Cell Biol. 2018;217:3993–4006. doi: 10.1083/jcb.201704076. [DOI] [PMC free article] [PubMed] [Google Scholar]
- Haider L., Simeonidou C., Steinberger G., Harmetner S., Grigoiadis N., Deretzki G., Kovacs C.G., Kitzelnigg A., Lassmann H., Frischer J.M. Multiple sclerosis deep grey matter: the relation between demyelination, neurodegeneration, inflammation and iron. J. Neurol. Neurosurg. Psychol. 2014;85:1386–1399. doi: 10.1136/jnnp-2014-307712. [DOI] [PMC free article] [PubMed] [Google Scholar]
- Hallermann S., Silver R.A. Sustained rapid vesicular release at active zones: potential roles for vesicle tethering. Trends Neurosci. 2013;36:185–194. doi: 10.1016/j.tins.2012.10.001. [DOI] [PMC free article] [PubMed] [Google Scholar]
- Han Y., Kaeser P.S., Südhof T.C., Schneggenburger R. RIM determines Ca2+-channel density and vesicle docking at the presynaptic active zone. Neuron. 2011;69:304–310. doi: 10.1016/j.neuron.2010.12.014. [DOI] [PMC free article] [PubMed] [Google Scholar]
- Hansen O. Interaction of cardiac glycosides with Na+K+-activated ATPase. A biochemical link to digitalis-induced inotropy. Pharmacol. Rev. 1984;36:143–163. [PubMed] [Google Scholar]
- Hassan M.T., Lytton J. Potassium-dependent sodium-calcium exchanger (NCKX) isoforms and neuronal function. Cell Calcium. 2020;86:102135. doi: 10.1016/j.ceca.2019.102135. [DOI] [PubMed] [Google Scholar]
- Hirota S., Pertens E., Janssen L.J. A reverse mode of the Na+/Ca2+ exchanger provides a source of Ca2+ for store refilling following agonist-induced Ca2+ mobilization. Am. J. Physiol. Lung Cell Mol. Physiol. 2007;292:L438–L447. doi: 10.1152/ajplung.00222.2006. [DOI] [PubMed] [Google Scholar]
- Hundehege P., Fernandez-Orth J., Römer P., Ruck T., Müntefering T., Eichler S., Cerina M., Epping L., Albrecht S., Mehke A.F. Targeting voltage-dependent calcium channels with prepabaline exerts a direct neuroprotective effect in an animal model of multiple sclerosis. Neurosignals. 2018;26:77–93. doi: 10.1159/000495425. [DOI] [PubMed] [Google Scholar]
- Ingwersen J., De Santi L., Wingerath B., Graf J., Koop B., Schneider R., Hecker C., Schröter F., Bayer M., Engelke A.D. Nimodipine confers clinical improvement in two models of experimental autoimmune encephalomyelitis. J. Neurochem. 2018 doi: 10.1111/jnc.14324. [DOI] [PubMed] [Google Scholar]
- Jalloul A.H., Szerencsei R.T., Rogasevskaia T.P., Schnetkamp P.P.M. Structure-function relationships of K+-dependent Na+/Ca2+ exchangers (NCKX) Cell Calcium. 2020;86:102153. doi: 10.1016/j.ceca.2019.102153. [DOI] [PubMed] [Google Scholar]
- Johnson J.E., Jr., Perkins G.A., Giddabasappa A., Chaney S., Xiao W., White A.D., Brown J.M., Waggoner J., Ellisman M.H., Fox D.A. Spatiotemporal regulation of ATP and Ca2+ dynamics in vertebrate rod and cone ribbon synapses. Mol. Vis. 2007;13:887–919. [PMC free article] [PubMed] [Google Scholar]
- Joiner M.L., Lee A. Voltage-gated Cav1 channels in disorders of vision and hearing. Curr. Mol. Pharmacol. 2015;8:143–148. doi: 10.2174/1874467208666150507104937. [DOI] [PMC free article] [PubMed] [Google Scholar]
- Jürgens T., Jafari M., Kreutzfeld M., Bahn E., Brück W., Kerschensteiner M., Merkler D. Reconstruction of single cortical projection neurons reveals primary spine loss in multiple sclerosis. Brain. 2016;139:39–46. doi: 10.1093/brain/awv353. [DOI] [PubMed] [Google Scholar]
- Kaeser P.S., Deng L., Wang Y., Dulubova I., Liu X., Rizo J., Südhof T.C. RIM proteins tether Ca2+-channels to presynaptic active zones via a direct PDZ-domain interaction. Cell. 2011;144:282–295. doi: 10.1016/j.cell.2010.12.029. [DOI] [PMC free article] [PubMed] [Google Scholar]
- Kaplan J.K. Biochemistry of Na,K-ATPase. Annu. Rev. Biochem. 2002;71:511–535. doi: 10.1146/annurev.biochem.71.102201.141218. [DOI] [PubMed] [Google Scholar]
- Katiyar R., Weissgerber P., Roth E., Dörr J., Sothilingam V., Garcia Garrido M., Beck S.C., Seeliger M., Beck A., Schmitz F., Flockerzi V. Influence of the β2-subunit of L-type voltage-gated Cav channels on the structural and functional development of photoreceptor ribbon synapses. Invest. Ophthalmol. Vis. Sci. 2015;56:2312–2324. doi: 10.1167/iovs.15-16654. [DOI] [PubMed] [Google Scholar]
- Katz A.M., Lorell B.H. Regulation of cardiac contraction and relaxation. Circulation. 2000;102:74. doi: 10.1161/01.cir.102.suppl_4.iv-69. [DOI] [PubMed] [Google Scholar]
- Kim M.H., Li G.L., von Gersdorff H. Single Ca2+ channels and exocytosis at sensory synapses. J. Physiol. 2013;13:3167–3178. doi: 10.1113/jphysiol.2012.249482. [DOI] [PMC free article] [PubMed] [Google Scholar]
- Kiyonaka S., Nakajima H., Takada Y., Hida Y., Yoshioka T., Hagiwara A., Kitajima I., Mori Y., Ohtsuka T. Physical and functional interaction of the active zone protein CAST/ARC2 and the β-subunit of the voltage-dependent Ca2+-channel. J. Biochem. 2012;152:149–159. doi: 10.1093/jb/mvs054. [DOI] [PubMed] [Google Scholar]
- Koulen P., Fletcher E.L., Craven S.E., Bredt D.S., Wässle H. Immunocytochemical localization of the postsynaptic density protein PSD-95 in the mammalian retina. J. Neurosci. 1998;18:10136–10149. doi: 10.1523/JNEUROSCI.18-23-10136.1998. [DOI] [PMC free article] [PubMed] [Google Scholar]
- Krizaj D., Demarco S.J., Johnson J., Strehler E.E., Copenhagen D.R. Cell-specific expression of plasma membrane calcium ATPase isoforms in retinal neurons. J. Comp. Neurol. 2002;451:1–21. doi: 10.1002/cne.10281. [DOI] [PMC free article] [PubMed] [Google Scholar]
- Križaj D. Calcium stores in vertebrate photoreceptors. Adv. Exp. Med. Biol. 2012;740:873–889. doi: 10.1007/978-94-007-2888-2_39. [DOI] [PMC free article] [PubMed] [Google Scholar]
- Kurnellas M.P., Donahue K.C., Elkabes S. Mechanisms of neuronal damage in multiple sclerosis and its animal models: role of calcium pumps and exchangers. Biochem. Soc. Trans. 2007;35:923–926. doi: 10.1042/BST0350923. [DOI] [PMC free article] [PubMed] [Google Scholar]
- Lagnado L., Schmitz F. Ribbon synapses and visual processing in the retina. Annu. Rev. Vis. Sci. 2015;1:235–262. doi: 10.1146/annurev-vision-082114-035709. [DOI] [PubMed] [Google Scholar]
- Lassmann H., Bruck W., Lucchinetti C.F. The immunopathology of multiple sclerosis: an overview. Brain Pathol. 2007;17:210–218. doi: 10.1111/j.1750-3639.2007.00064.x. [DOI] [PMC free article] [PubMed] [Google Scholar]
- Li S., Mitchell J., Briggs D.J., Young J.K., Long S.S., Fuerst P.G. Morphological diversity of the rod spherule: a study of serially reconstructed electron micrographs. PLoS One. 2016;11:e0150024. doi: 10.1371/journal.pone.0150024. [DOI] [PMC free article] [PubMed] [Google Scholar]
- Liang M., Tian J., Liu L., Pierre S., Liu J., Shapiro J., Xie Z.J. Identification of a pool of non-pumping Na/K-ATPase. J. Biol. Chem. 2007;282:10585–10593. doi: 10.1074/jbc.M609181200. [DOI] [PubMed] [Google Scholar]
- Linton J.D., Holzhausen L.C., Babai N., Song H., Miyagishima K.J., Stearns G.W., Lindsay K., Wei J., Chertov A.O., Peters T.A. Flow of energy in the outer retina in darkness and in light. Proc. Natl. Acad. Sci. U S A. 2010;107:8599–8604. doi: 10.1073/pnas.1002471107. [DOI] [PMC free article] [PubMed] [Google Scholar]
- Liu L., Zhao X., Pierre S.V., Askari A. Association of PI3K-Akt signaling pathwy with digitalisinduced hypertrophy of cardiac myocytes. Am. J. Physiol. Cell Physiol. 2007;293:C1489–C1497. doi: 10.1152/ajpcell.00158.2007. [DOI] [PubMed] [Google Scholar]
- Loewe M.J., Koenig K.A., Beall E.B., Sakaie K.A., Stone L., Bermel R., Phillips M.D. Anatomic connectivity assessed using pathway radial diffusivity is related to functional connectivity in monosynaptic pathways. Brain Connect. 2014;4:558–565. doi: 10.1089/brain.2014.0265. [DOI] [PubMed] [Google Scholar]
- Löhner M., Babai N., Müller T., Gierke K., Atorf J., Joachimsthaler A., Peukert A., Martens H., Feigenspan A., Kremers J. Analysis of RIM expression and function at mouse photoreceptor ribbon synapses. J. Neurosci. 2017;37:7848–7863. doi: 10.1523/JNEUROSCI.2795-16.2017. [DOI] [PMC free article] [PubMed] [Google Scholar]
- Luan Z., Reddig K., Li H.S. Loss of Na+/K+-ATPase in Drosophila photoreceptors leads to blindness and age-dependent neurodegeneration. Exp. Neurol. 2014;261:791–801. doi: 10.1016/j.expneurol.2014.08.025. [DOI] [PMC free article] [PubMed] [Google Scholar]
- Mandolesi G., Gentile A., Musella A., Fresegna D., De Vito F., Bullitta S., Sepman H., Marfia G.A., Centonze D. Synaptopathy connects inflammation and neurodegeneration in multiple sclerosis. Nat. Rev. Neurol. 2015;11:711–724. doi: 10.1038/nrneurol.2015.222. [DOI] [PubMed] [Google Scholar]
- Matthews G., Fuchs P. The diverse roles of ribbon synapses in sensory neurotransmission. Nat. Rev. Neurosci. 2010;11:812–822. doi: 10.1038/nrn2924. [DOI] [PMC free article] [PubMed] [Google Scholar]
- Maxeiner S., Luo F., Tan A., Schmitz F., Südhof T.C. How to make a synaptic ribbon: RIBEYE deletion abolishes ribbons in retinal synapses and disrupts neurotransmitter release. EMBO J. 2016;35:1098–1114. doi: 10.15252/embj.201592701. [DOI] [PMC free article] [PubMed] [Google Scholar]
- McGrail K.M., Sweadner K.J. Immunofluorescent localization of two different Na,K-ATPase in the rat retina and in identified dissociated retinal cells. J. Neurosci. 1986;6:1272–1283. doi: 10.1523/JNEUROSCI.06-05-01272.1986. [DOI] [PMC free article] [PubMed] [Google Scholar]
- Meissner M., Weissgerber P., Londono J.E., Prenen J., Link S., Ruppenthal S., Molkentin J.D., Lipp P., Nilius B., Freichel M., Flockerzi V. Moderate calcium channel dysfunction in adult mice with inducible cardiomyocyte-specific excision of the cacnb2 gene. J. Biol. Chem. 2011;286:15875–15882. doi: 10.1074/jbc.M111.227819. [DOI] [PMC free article] [PubMed] [Google Scholar]
- Milla J., Montesinos M.S., Machado J.D., Borges R., Alonso E., Moreno-Ortega A.J., Cano-Abad M.F., Garcia A.G., Ruiz-Nuno A. Ouabain enhances exocytosis through the regulation of calcium handling by the endoplasmic reticulum of chromaffin cells. Cell Calcium. 2011;50:332–342. doi: 10.1016/j.ceca.2011.06.002. [DOI] [PubMed] [Google Scholar]
- Mirabelli E., Ni L., Li L., Acioglu C., Heary R.F., Elkabes S. Pathological pain processing in mouse models of multiple sclerosis and spinal cord injury: contribution of plasma membrane calcium ATPase 2 (PMCA2) J. Neuroinflammation. 2019;16:207. doi: 10.1186/s12974-019-1585-2. [DOI] [PMC free article] [PubMed] [Google Scholar]
- Morgans C.W., El Far O., Berntson A., Wässle H., Taylor W.R. Calcium extrusion from mammalian photoreceptor terminals. J. Neurosci. 1998;18:2467–2474. doi: 10.1523/JNEUROSCI.18-07-02467.1998. [DOI] [PMC free article] [PubMed] [Google Scholar]
- Moser T., Grabner C.P., Schmitz F. Sensory processing at ribbon synapses in the retina and cochlea. Physiol. Rev. 2020;100:103–144. doi: 10.1152/physrev.00026.2018. [DOI] [PubMed] [Google Scholar]
- Müller C.S., Haupt A., Bildl W., Schindler J., Knaus H.G., Meissner M., Ramner B., Striessnig J., Flockerzi V., Fakler B., Schulte U. Quantitative proteomics of the Cav2 channel nano-environments in the mammalian brain. Proc. Natl. Acad. Sci. U S A. 2010;107:14950–14957. doi: 10.1073/pnas.1005940107. [DOI] [PMC free article] [PubMed] [Google Scholar]
- Nanou E., Catterall W.A. Calcium channels, synaptic plasticity and neuropsychiatric disease. Neuron. 2018;98:466–481. doi: 10.1016/j.neuron.2018.03.017. [DOI] [PubMed] [Google Scholar]
- Nicot A., Ratnakar P.V., Ron Y., Chen C.C., Elkabes S. Regulation of gene expression in experimental autoimmune encephalomyelitis indicates early neuronal dysfunction. Brain. 2003;126:398–412. doi: 10.1093/brain/awg041. [DOI] [PubMed] [Google Scholar]
- Nicot A., Kurnellas M., Elkabes S. Temporal pattern of plasma membrane calcium ATpase 2 expression in the spinal cord correlates with the course of clinical symptoms in two rodent models of autoimmune encephalomyelitis. Eur. J. Neurosci. 2005;21:2660–2670. doi: 10.1111/j.1460-9568.2005.04086.x. [DOI] [PMC free article] [PubMed] [Google Scholar]
- Nguyen A.N.T., Jansson K., Sanchez G., Sharma M., Reif G.A., Wallace D.P., Blanco G. Ouabain activates the Na-K-ATPase signalosome to induce autosomal dominant polycystic kidney disease cell proliferation. Am. J. Physiol. Ren. Physiol. 2011;301:F897–F906. doi: 10.1152/ajprenal.00095.2011. [DOI] [PMC free article] [PubMed] [Google Scholar]
- Okawa H., Yu W.Q., Matti U., Schwarz K., Odermatt B., Zhong H., Tsukamoto Y., Lagnado L., Rieke F., Schmitz F., Wong R.O. Dynamic assembly of ribbon synapses and circuit maintenance in a vertebrate sensory system. Nat. Commun. 2019;10:2167. doi: 10.1038/s41467-019-10123-1. [DOI] [PMC free article] [PubMed] [Google Scholar]
- Pangrsic T., Singer J.H., Koschak A. Voltage-gated calcium channels: key players in sensory coding in the retina and inner ear. Physiol. Rev. 2018;98:2063–2096. doi: 10.1152/physrev.00030.2017. [DOI] [PMC free article] [PubMed] [Google Scholar]
- Perkins G.A., Scott R., Perez A., Ellisman M.H., Johnson J.E., Fox D.A. Bcl-xL-mediated remodeling of rod and cone synaptic mitochondria adter postnatal lead exposure: electron microscop, tomography and oxygen consumption. Mol. Vis. 2012;18:3029–3048. [PMC free article] [PubMed] [Google Scholar]
- Pierre S.V., Xie Z. The Na,K-ATPase receptor complex: its organization and membership. Cell Biochem. Biophys. 2006;46:303–316. doi: 10.1385/cbb:46:3:303. [DOI] [PubMed] [Google Scholar]
- Ravens U., Himmel H.M. Drugs preventing Na+ and Ca2+ overload. Pharmacol. Res. 1999;39:167–174. doi: 10.1006/phrs.1998.0416. [DOI] [PubMed] [Google Scholar]
- Reid D.M., Friedel U., Molday R.S., Cook N.J. Identification of the sodium-calcium exchanger as the major ricin-binding glycoprotein of bovine rod outer segments and its localization to the plasma membrane. Biochemistry. 1990;29:1601–1607. doi: 10.1021/bi00458a035. [DOI] [PubMed] [Google Scholar]
- Reiländer H., Achilles A., Friedel U., Maul G., Lottspeich F., Cook N.J. Primary structure and funtional expression of the Na/Ca, K-exchanger from bovine rod photoreceptors. EMBO J. 1992;11:1689–1695. doi: 10.1002/j.1460-2075.1992.tb05219.x. [DOI] [PMC free article] [PubMed] [Google Scholar]
- Repke K., Portius H.J. On the identity of the ion-pumping ATPase in the cell membrane of the myocardium with a digitalis receptor enzyme. Experientia. 1963;19:452–458. doi: 10.1007/BF02150643. [DOI] [PubMed] [Google Scholar]
- Repke K. Über den biochemischen Wirkungsmechanismus von Digitalis. Klin. Wochenschr. 1964;42:157–165. doi: 10.1007/BF01482616. [DOI] [PubMed] [Google Scholar]
- Rizzo F.R., Musella A., De Vito F., Fresegna D., Bullita S., Vanni V., Guadalupi L., Stampanoni Bassi M., Buttari F., Mandolesi G. Tumor necrosis factor and interleukin-1β modulate synaptic plasticity during neuroinflammation. Neural Plast. 2018;2018:8430123. doi: 10.1155/2018/8430123. [DOI] [PMC free article] [PubMed] [Google Scholar]
- Robinson A.P., Harp C.T., Noronha A., Miller S.D. The experimental autoimmune encephalomyelitis (EAE) model of MS: utility for understanding disease pathophysiology and treatment. Handb. Clin. Neurol. 2014;122:173–189. doi: 10.1016/B978-0-444-52001-2.00008-X. [DOI] [PMC free article] [PubMed] [Google Scholar]
- Rodriguez-Muela N., Hernandez-Pinto A.M., Serrano-Puebla A., Garcia-Ledo L., Latorre S.H., de la Rosa E.J., Boya P. Lysosomal membrane permeabilization and autophagy blockade contribute to photoreceptor cell death in a mouse model of retinitis pigmentosa. Cell Death Differ. 2015;22:476–487. doi: 10.1038/cdd.2014.203. [DOI] [PMC free article] [PubMed] [Google Scholar]
- Saidha S., Syc S.B., Ibrahim M.A., Eckstein C., Warner C.V., Farrell S.K., Oakley J.D., Durbin M.K., Meyer S.A., Balcer L.J. Primary retinal pathology in multiple sclerosis as detected by optical coherence tomography. Brain. 2011;134:518–533. doi: 10.1093/brain/awq346. [DOI] [PubMed] [Google Scholar]
- Sancho-Pelluz J., Arango-Gonzalez B., Kustermann S., Romero F.J., Van Veen T., Zrenner E., Ekström P., Paquet-Durand F. Photoreceptor cell death mechanisms in inherited retinal degeneration. Mol. Neurobiol. 2008;38:253–269. doi: 10.1007/s12035-008-8045-9. [DOI] [PubMed] [Google Scholar]
- Schaefer K.A., Toral M.A., Velez G., Cox A.J., Baker S.A., Borcherding N.C., Colgan D.F., Bondada V., Mashburn C.B., Yu C.G. Calpain-5 expression in the retina localizes to photoreceptor synapses. Invest. Ophthalmol. Vis. Sci. 2016;57:2509–2521. doi: 10.1167/iovs.15-18680. [DOI] [PMC free article] [PubMed] [Google Scholar]
- Schampel A., Volovitch O., Koeniger T., Scholz C.J., Jörg S., Linker R.A., Wischmeyer E., Wunsch M., Hell J.W., Ergün S., Kuerten S. Nimodipine fosters remyelination in a mouse model of multiple sclerosis and induces microglia-specific apoptosis. Proc. Natl. Acad. Sci. U S A. 2017;114:E3295–E3304. doi: 10.1073/pnas.1620052114. [DOI] [PMC free article] [PubMed] [Google Scholar]
- Schattling B., Engler J.B., Volkmann C., Rothammer N., Woo M.S., Petersen M., Winkler I., Kaufmann M., Rosenkranz S.C., Fejtova A. Bassoon proteinopathy drives neurodegeneration in multiple sclerosis. Nat. Neurosci. 2019;22:887–896. doi: 10.1038/s41593-019-0385-4. [DOI] [PubMed] [Google Scholar]
- Schatzmann H.J. Cardiac glycosides as inhibitors of active potassium and sodium transport by erythrocyte membrane. Helv. Physiol. Pharmacol. Acta. 1953;11:346–354. [PubMed] [Google Scholar]
- Schmitz F., Königstorfer A., Südhof T.C. RIBEYE, a component of synaptic ribbons: a protein’s journey through evolution provides insight into synaptic ribbon function. Neuron. 2000;28:857–872. doi: 10.1016/s0896-6273(00)00159-8. [DOI] [PubMed] [Google Scholar]
- Schnetkamp P.P. Sodium-calcium exchange in the outer segments of bovine rod photoreceptors. J. Physiol. 1986;373:25–45. doi: 10.1113/jphysiol.1986.sp016033. [DOI] [PMC free article] [PubMed] [Google Scholar]
- Schnetkamp P.P.M. The Slc24 gene family of Na+/Ca2+-K+-exchangers: from sight and smell to memory consolidation and skin pigmentation. Mol. Asp. Med. 2013;34:455–464. doi: 10.1016/j.mam.2012.07.008. [DOI] [PubMed] [Google Scholar]
- Shen W., Purpura L.A., Li B., Nan C., Chang I.J., Ripps H. Regulation of synaptic transmission at the photoreceptor terminal: a novel role for the cation-chloride co-transporter NKCC1. J. Physiol. 2013;591:133–147. doi: 10.1113/jphysiol.2012.241042. [DOI] [PMC free article] [PubMed] [Google Scholar]
- Shi M., Cao L., Cao X., Zhu M., Zhang X., Wu Z., Xiong S., Xie Z., Yang Y., Chen J. DR-region of Na+/K+ ATPase is a target to treat excitotoxicity and strok. Cell Death Dis. 2019;10:6. doi: 10.1038/s41419-018-1230-5. [DOI] [PMC free article] [PubMed] [Google Scholar]
- Sibarov D.A., Bolshakov A.E., Abushik P.A., Krivoi I.I., Antonov S. Na+,K+-ATPase functionally interacts with the plasma membrane Na+, Ca2+-exchanger to prevent Ca2+ overload and neuronal apoptosis in excitotoxic stress. J. Pharmacol. Exp. Ther. 2012;343:596–607. doi: 10.1124/jpet.112.198341. [DOI] [PubMed] [Google Scholar]
- Skou J.C. Nobel Lecture. The identification of the sodium pump. Biosci. Rep. 1998;18:155–169. doi: 10.1023/a:1020196612909. [DOI] [PubMed] [Google Scholar]
- Stafford N., Wilson C., Oceandy D., Neyses L., Cartwright E.J. The plasma membrane calcium ATPases and their role as major new players in human disease. Physiol. Rev. 2017;97:1089–1125. doi: 10.1152/physrev.00028.2016. [DOI] [PubMed] [Google Scholar]
- Stampanoni Bassi M., Mori F., Buttari F., Marfia G.A., Sancesario A., Centonze D., Iezzi E. Neurophysiology of synaptic functioning in multiple sclerosis. Clin. Neurophysiol. 2017;128:1148–1157. doi: 10.1016/j.clinph.2017.04.006. [DOI] [PubMed] [Google Scholar]
- Stathopoulos P., Alexopoulos H., Dalakas M.C. Autoimmune antigenic targets at the node of Ranvier in demyelinating disorders. Nat. Rev. Neurol. 2015;11:143–156. doi: 10.1038/nrneurol.2014.260. [DOI] [PubMed] [Google Scholar]
- Stone J., van Driel D., Valter K., Rees S., Provis J. The location of mitochondria in mammalian photoreceptors: relation to retinal vasculature. Brain Res. 2008;1189:58–69. doi: 10.1016/j.brainres.2007.10.083. [DOI] [PubMed] [Google Scholar]
- Südhof T.C. The presynaptic active zone. Neuron. 2012;75:11–25. doi: 10.1016/j.neuron.2012.06.012. [DOI] [PMC free article] [PubMed] [Google Scholar]
- Südhof T.C. Calcium control of neurotransmitter release. Cold Spring Harb. Perspect. Biol. 2012;4:a011353. doi: 10.1101/cshperspect.a011353. [DOI] [PMC free article] [PubMed] [Google Scholar]
- Südhof T.C. The molecular machinery of neurotransmitter release (Nobel lecture) Angew. Chem. Int. Ed. 2014;53:12696–12717. doi: 10.1002/anie.201406359. [DOI] [PubMed] [Google Scholar]
- Szikra T., Barabas P., Bartoletti T.M., Huang W., Akopian A., Thoreson W.B., Krizaj D. Calcium homeostasis and cone signaling are regulated by interactions between calcium stores and plasma membrane ion channels. PLoS One. 2009;4:e6723. doi: 10.1371/journal.pone.0006723. [DOI] [PMC free article] [PubMed] [Google Scholar]
- Thoreson W.B., Nitzan R., Miller R.F. Chloride efflux inhibits single calcium channel open probability in vertebrate photoreceptors: chloride imaging and cell-attached patch-clamp recordings. Vis. Neurosci. 2000;17:197–206. doi: 10.1017/s0952523800172025. [DOI] [PubMed] [Google Scholar]
- Thoreson W.B., Stella S.L., Jr., Bryson E.J., Clements J., Witkovsky P. D2-like dopamine receptors promote interactions between calcium and chloride channels that diminish rod synaptic transfer in the salamander retina. Vis. Neurosci. 2002;19:235–247. doi: 10.1017/s0952523802192017. [DOI] [PMC free article] [PubMed] [Google Scholar]
- Thoreson W.B., Bryson E.J., Rabl K. Reciprocal interactions between calcium and chloride in rod photoreceptors. J. Neurophysiol. 2003;90:1747–1753. doi: 10.1152/jn.00932.2002. [DOI] [PubMed] [Google Scholar]
- tom Dieck S., Specht D., Strenzke N., Hida Y., Krishnamoorthy V., Schmidt K.F., Inoue E., Ishizaki H., Tanaka-Okamoto M., Miyoshi J. Deletion of the presynaptic scaffold CAST reduces active zone size in photoreceptors and impairs visual processing. J. Neurosci. 2012;32:12192–12203. doi: 10.1523/JNEUROSCI.0752-12.2012. [DOI] [PMC free article] [PubMed] [Google Scholar]
- Van Hook M., Nawy S., Thoreson W.B. Voltage- and calcium-gated ion channels of neurons in the vertebrate retina. Prog. Ret. Eye Res. 2019;72:100760. doi: 10.1016/j.preteyeres.2019.05.001. [DOI] [PMC free article] [PubMed] [Google Scholar]
- Verkhratsky A., Trebak M., Perocchi F., Khananshvili D., Sekler I. Crosslink between calcium and sodium signalling. Exp. Physiol. 2018;103:157–169. doi: 10.1113/EP086534. [DOI] [PMC free article] [PubMed] [Google Scholar]
- Vinberg F., Wang T., Molday R.S., Chen J., Kefalov V.J. A new mouse model for stationary night blindness with mutant slc24a1 explains the pathophysiology of the associated human disease. Hum. Mol. Genet. 2015;24:5915–5929. doi: 10.1093/hmg/ddv319. [DOI] [PMC free article] [PubMed] [Google Scholar]
- Wahl-Schott C., Baumann L., Cuny H., Eckert C., Griessmeier C., Biel M. Switching off calcium-dependent inactivation in L-type calcium channels by an autoinhibitory domain. Proc. Natl. Acad. Sci. U S A. 2006;103:15657–15662. doi: 10.1073/pnas.0604621103. [DOI] [PMC free article] [PubMed] [Google Scholar]
- Wan Q.F., Nixon E., Heidelberger R. Regulation of presynaptic calcium in a mammalian synaptic terminal. J. Neurophysiol. 2012;108:3059–3067. doi: 10.1152/jn.00213.2012. [DOI] [PMC free article] [PubMed] [Google Scholar]
- Wasserstrom J.A., Aistrup G.L. Digitalis: new actions for an old drug. Am. J. Physiol. Heart Circ. Physiol. 2005;289:H1781–H1793. doi: 10.1152/ajpheart.00707.2004. [DOI] [PubMed] [Google Scholar]
- Wetzel R.K., Arystarkhova E., Sweadner K.J. Cellular and subcellular specification of Na,K-ATPase alpha and beta isoforms in the postnatal development of mouse retina. J. Neurosci. 1999;19:9878–9889. doi: 10.1523/JNEUROSCI.19-22-09878.1999. [DOI] [PMC free article] [PubMed] [Google Scholar]
- Wong H.C., Zhang Q., Beirl A.J., Petralia R.S., Wang Y.X., Kindt K. Synaptic mitochondria regulate hair-cell synapse size and function. Elife. 2019;14:8. doi: 10.7554/eLife48914. [DOI] [PMC free article] [PubMed] [Google Scholar]
- You Y., Graham E.C., Shen T., Yiannikas C., Parratt J., Gupta V., Barton J., Dwyer M., Barnett M.H., Fraser C.L., Klistorner A. Progressive inner nuclear layer dysfunction in non-optic neuritis eyes in MS. Neurol. Neuroimmunol. Neuroinflamm. 2018;5:e427. doi: 10.1212/NXI.0000000000000427. [DOI] [PMC free article] [PubMed] [Google Scholar]
- Yuan Z., Cai T., Tian J., Ivanov A.V., Giovannucci D.R., Xie Z. Na/K-ATPase tethers phospholipase C and IP3 receptor into a calcium-regulatory complex. Mol. Biol. Cell. 2005;16:4034–4045. doi: 10.1091/mbc.E05-04-0295. [DOI] [PMC free article] [PubMed] [Google Scholar]
- Zenisek D., Matthews G. The role of mitochondria in presynaptic calcium handling at a ribbon synapse. Neuron. 2000;25:229–237. doi: 10.1016/s0896-6273(00)80885-5. [DOI] [PubMed] [Google Scholar]
- Zhang S.H., Liu D.X., Wang L., Li Y.H., Wang Y.H., Zhang H., Su Z.K., Fang W.G., Qin X.X., Shang D.S. A CASPR1-ATP1B3 protein interaction modulates plasma membrane localization of Na+/K+-ATPase in brain microvascular endothelial cells. J. Biol. Chem. 2019;294:6375–6386. doi: 10.1074/jbc.RA118.006263. [DOI] [PMC free article] [PubMed] [Google Scholar]
- Zhao W.D., Liu D.X., Wei J.Y., Miao Z.W., Zhang K., Su Z.K., Zhang X.W., Li Q., Fang W.G., Qin X.X. Caspr1 is a host receptor for meningitis-causing Escherichia coli. Nat. Commun. 2018;9:2296. doi: 10.1038/s41467-018-04637-3. [DOI] [PMC free article] [PubMed] [Google Scholar]
- Zhao W.D., Liu D.X., Chen Y.H. Escherichia coli hijack Caspr1 receptor to invade cerebral vascular and neuronal hosts. Microb. Cell. 2018;5:418–420. doi: 10.15698/mic2018.09.647. [DOI] [PMC free article] [PubMed] [Google Scholar]
- Zucker R.S. Calcium and transmitter release. J. Physiol. 1993;87:25–36. doi: 10.1016/0928-4257(93)90021-k. [DOI] [PubMed] [Google Scholar]
Associated Data
This section collects any data citations, data availability statements, or supplementary materials included in this article.
Supplementary Materials
Data Availability Statement
All data are included in the published article and the Supplemental Information, and any additional information will be available from the corresponding authors upon request.