Abstract
In this work, the green synthesis of highly fluorescent carbon quantum dots (CQDs) with an efficient quantum yield of 17.98% using sugarcane bagasse pulp as the precursor was conducted by a hydrothermal technique. The high-resolution transmission electron microscopy analysis revealed that the CQDs were competently monodispersed with the particle size ranging between 0.75 and 2.75 nm. The structural properties of CQDs were investigated using X-ray diffraction, Fourier transform infrared, and X-ray photoelectron spectroscopy analyses. The UV–visible spectrum showed two absorption peaks due to the aromatic C=C transitions of π–π* and C=O transitions of n−π*. The fluorescence spectrum of CQDs displayed a strong blue emission. However, the first-ever of its kind, sugarcane industrial solid waste carbon quantum dots caused significant orders to obey the enhancement of the third-order nonlinearity (χ(3)) when compared with other carbon dots (CDs). The calculated nonlinear optical (NLO) parameters such as n2, β, and χ(3) were 1.012 × 10⁻⁸ cm2/W, 2.513 × 10⁻⁴, and 3.939 × 10⁻⁷ esu, respectively. The figures of merit were evaluated to be W = 6.6661 and T = 0.0132, which greatly fulfilled the optical switching conditions. Besides, the antibacterial activities of CQDs were screened against aquatic Gram-positive (Benthesicymus cereus and Staphylococcus aureus) and Gram-negative (Pseudomonas aeruginosa, Vibrio cholerae, and Escherichia coli) microbial organisms. Our findings, however, indicate that synergistic sugarcane industrial waste CQDs are promising materials for the functioning of NLO devices, bioimaging, and pharmaceutical applications.
1. Introduction
Over the past decade, developing countries have consistently encountered the problem of pollution of soil and earth as a major issue, as dumping sugarcane bagasse waste creates a major challenge for yielding numerous million tons of sugarcane molasses every year.1,2 Inexpensive and environmentally friendly green chemistry ideas have now led researchers to synthesize CDs from natural solid waste resources, such as tamarind,3 pomelo peel,4 watermelon peel,5 pineapple peel,6 lemon peel,7 orange peel,8 papaya juice,9 banana juice,10 soy milk,11 potato,12 coffee grounds,13 and cabbage,14 which are used as strong acid precursors. In this perspective, the practice of waste materials for the production of fluorescent CDs would be immense in absorbing, as it emanates from waste management above all, it considers as the production of carbon-based materials.15 However, it is vital to encourage the assessment of sugarcane treacle as an original and fresh raw material for the preparation of CDs.16 A number of researchers have reported very recently that sugarcane bagasse pulp and juice can be used as carbon precursors to synthesize quantum dots.17 However, in this report, we have tried to explain the biofluorescent properties of QDs to enhance the third-order differential nonlinear properties, which may attract significant attention because of their host applications in energy storage,18 conversion of energy, optical telecommunication, and bioscanning index.19 The foremost, prior demonstration of all optical transformation was forced by the performance of materials in the relation between the “prime factors” which describe (i) the nonlinear phase to be shift achievable over a single photon, which is W > 1 or a multi-photon is T < 1; (ii) however, the absorption coefficient is an essential requirement, which is to be satisfied for the primary application of optical switching.20
Recently, infectious diseases triggered by microorganisms, such as viruses, fungi, parasites, or others, have impacted public health in many countries and are a leading cause of death globally. Travlou et al.21 stated that nitrogen-containing carbon promotes the creation of active oxygen species, which is correlated with their electron-donating properties. The antimicrobial capacity of CQDs, therefore, has only recently been discovered.22−24 CQDs directed against Gram +ve and Gram −ve microbes have been reported, in which bacterial targeting was established by electrostatic interaction between the anionic microbial membrane and cationic residues on the surface of the C-dots.25,26 CQDs may be used as an important substitute for conventional antibiotic drugs in antibacterial testing.
However, in the present report, we have explored the nonlinear optical properties of CQDs using industrial waste (sugarcane bagasse pulp) as a carbon source synthesized by a hydrothermal method. The synthesized carbon quantum dots were investigated using different techniques, such as X-ray diffraction (XRD), Fourier transform infrared (FTIR) spectroscopy, X-ray photoelectron spectroscopy (XPS), high-resolution transmission electron microscopy (HRTEM), UV–visible absorption, and fluorescence quantum yield measurements. The NLO behavior was characterized by the Z-scan technique using a continuous-wave laser (532 nm, 100 mW). Also, antimicrobial activities were tested against selected microorganisms.
2. Experimental Procedures
2.1. Materials and Methods
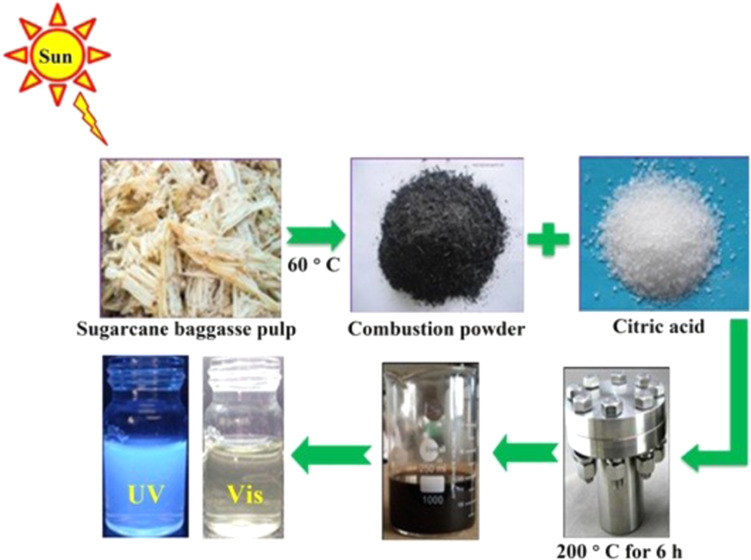
Newly harvested sugarcane bagasse pulp was collected from sugarcane industrial waste and cleansed with deionized water. The pulp was dehydrated in sunlight for 3 days before being ignited at 70 °C in the air atmosphere to form a carbon matrix. Citric acid (CA) [C6H8O7] and aqueous ammonia were bought from E-Merck (99.99%), and all of the chemicals were of systematic grade.
Industrial waste (sugarcane bagasse pulp) CQDs were prepared using a hydrothermal approach. Briefly, 2 g of yielded carbon (sugarcane bagasse pulp) and 2 g of CA were homogeneously mixed with 25 mL of double-distilled water, and aqueous ammonia was added to the precursor to set the pH to 7. The isolated precursor was completely shifted to the autoclave at a stable temperature of 200 °C for 6 h. The reactive mixture solution was ultrasonicated for 1 h and centrifuged for 60 min at 5000 rpm to remove superior undissolved particles. Eventually, the black solid precipitate was removed and the supernatant liquid was stored for further characterization and use.
2.2. Characterization of CQDs
Powder XRD measurements of the CQDs using Cu Kα radiation (1.5404 Å) were conducted on a Bruker AXS D8 Advance diffractometer at a scanning speed of 0.1 min–1 with 2θ ranging from 10 to 80°. HRTEM images were collected using a JEOL/JEM2100 microscope (operated at 200 kV). The FTIR spectrum was recorded with an FTIR spectrometer (PerkinElmer spectrometer) in the spectral range of 4000–400 cm–1 at ambient temperature. A linear optical absorption spectrum of CQDs was recorded using a Shimadzu spectrophotometer (UV-1800), and the sample was immersed in water. Fluorescence studies were carried out with a single-beam PerkinElmer fluorescence spectrometer (model LS45) at ambient temperature (RT). Third-order nonlinearity of CQDs was scrutinized using the Z-scan method (Holmarc Z-scan, model HO-ED-LOE-03).
2.3. Z-scan Analysis
The higher-order NLO parameters were examined by the Z-scan method. In this technique, the sample was focused using the focal length of a convex lens of 103 mm, the optical path length of 675 mm, the aperture radius (ra) of 1.25 mm, and the beam radius (ωa) of 3.5 mm. Initially, the prepared material was dispersed in deionized water. The scattered particles were separated in a 1 mm cuvette and placed on a conversion point, which was moved from the positive to the negative direction in the Z-axis along the propagation route of the laser beam. For the accuracy of each movement, the translation of the sample holder can be monitored by a computer. The associated transmitted intensity of the sample was recorded by a detector.
2.4. Antimicrobial Activity
The antibacterial activities of the synthesized fluorescence CQDs against Staphylococcus aureus, Bacillus cereus, Escherichia coli, Vibrio cholera, and Pseudomonas aeruginosa were evaluated using the well diffusion process. A The petri dish and the sample were sterilized at 120°C for 30 minutes prior to the antibacterial testing. The newly prepared bacterial inoculums were swabbed throughout the surface of the nutrient agar medium (growth medium) using a sterilized cotton swab to maintain uniform distribution of the bacteria across the plate surface. First, the stock solution of CQDs was mixed with sterile distilled water. Then, 0.01 mg/mL carbon quantum dots were loaded into the well and incubated for 24 h at 37 °C. Successively, the inhibition zone (mm) formed in the Petri dish was observed.
3. Results and Discussion
3.1. HRTEM Analyses
Figure 1a demonstrates that the ultrafine particles are more uniform, which are spherical quantum dots with a mean particle size of 1.7 ± 0.2 nm. The success rate of the green synthesis hydrothermal approach in producing carbon dots was confirmed by the HRTEM images, which are displayed in Figure 1b. The lattice fringes of CQDs with an interplanar distance d of ∼0.323 nm are associated with graphitic carbon.27 In addition, the fragment size distributions of CQDs were analyzed to obtain the stabilized particle size and are depicted in Figure 1c. It was found from the CQD distribution curve that particles are distributed randomly with an average particle size varying from 0.75 to 2.27 nm and that the mean CQDs were of 1.7 ± 0.2 nm. The XRD pattern of synthesized CQDs is displayed in Figure 1d, which shows a broad peak position at 2θ = 21–28°. This broad peak is associated with the (0 0 2) plane and suggests the disordered pattern of carbon dots, due to the addition of N- and O-containing groups.28,29 These observations are in good agreement with those previously reported for CQDs.30−33
Figure 1.
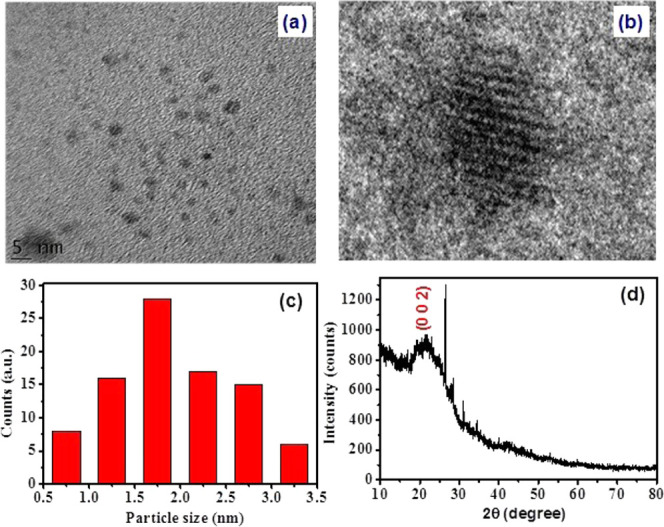
(a, b) HRTEM image with different magnifications, (c) size distribution chart for CQDs, and (d) XRD pattern of CQDs.
3.2. FTIR Analysis
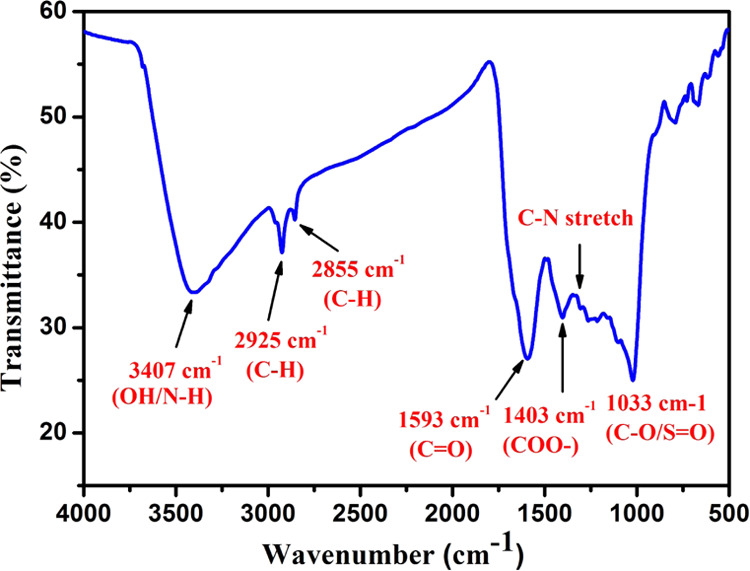
Figure 2 indicates the FTIR spectrum of the as-prepared CQDs. The absorption peak at 3407 cm–1 is related to O–H/N–H and a sharp peak at 2925 cm–1 corresponds to the methyl or methylene (C–H) groups.34 The peaks at 1593 and 1403 cm–1 correspond to the distinctive absorption peaks of C=O and COO– functional groups of CQDs, respectively.35 The peaks in the region 1260–1240 cm–1 are attributed to the C–N stretching, and the peak at 1033 cm–1 is allocated to the C–O/S=O stretching vibration.36 The presence of the hydroxyl group (O–H) plays a vital role in strengthening the antibacterial effect of the as-prepared CQDs.37−39
Figure 2.
FTIR spectrum of synthesized CQDs.
3.3. X-ray Photoelectron Spectroscopic (XPS) Measurement
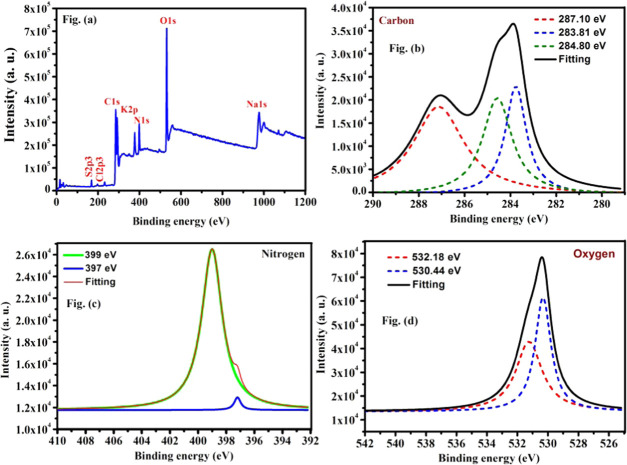
XPS is used to examine the components of surface groups and the structure of as-prepared CQDs. Moreover, the three major points at 284.63, 398.85, and 530.07 eV, as shown in Figure 3a, can be ascribed to C 1s, N 1s, and O 1s, respectively, suggesting the efficient formation of CQDs. The C 1s spectra in Figure 3b show three peaks at 284.80, 283.8, and 287.10 eV, which are assigned to C–C/C=C, C–OH/C–O–C, and C=O/C=N, respectively. As shown in Figure 3c, XPS spectra of N 1s exhibit two peaks at 399 and 397 eV corresponding to C–N–C and C–N groups, respectively. The distribution of O 1s in Figure 3d indicating two peaks at 532.18 and 530.44 eV attributed to the presence of C–OH/C–O–C and C=O bonds, respectively, and the graphite structure of the prepared CQDs corresponding to the peak at 284.63 eV referring obviously to C 1s are consistent with those from FTIR analysis.40 XPS demonstrated that the surface of nitrogen-containing functionalized CQDs is properly connected with hydroxyl and carbonyl functional groups.41,42
Figure 3.
Survey XPS spectra of CQDs (A) and high-resolution XPS data of (B) C 1s, (C) N 1s, and (D) O 1s.
3.4. Optical Studies
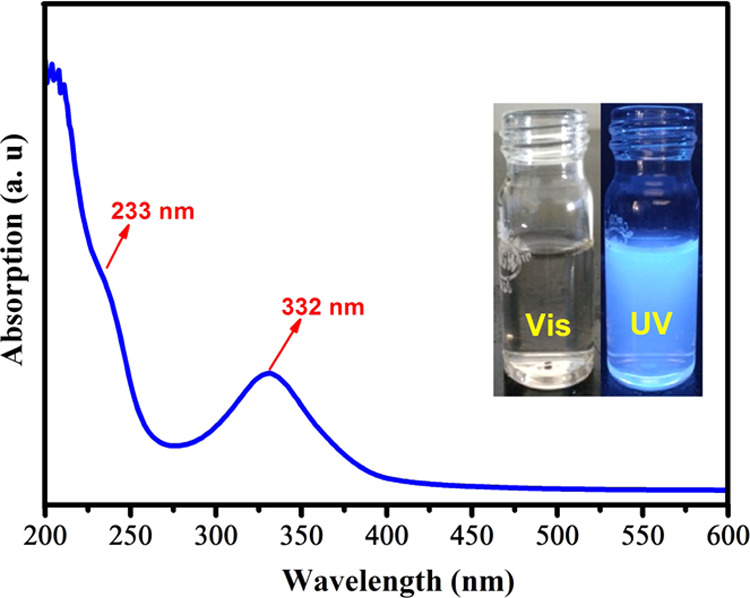
The UV–visible spectrum of as-prepared CQDs in aqueous solution is given in Figure 4. The spectrum displays two corresponding peaks at 233 and 332 nm in a supernatant solution of carbon dots. The absorption peak centered at 233 nm can be ascribed to the π–π* transitions of the aromatic C=C and the peak at 332 nm is involved in the n−π* transition of C=O or the C–OH bond of the CQDs.43−45 The diluted CQDs show an intense sky blue color upon illumination by a UV-light source (365 nm), which is shown in the inset of Figure 4. The following equation is used to determine the linear optical absorption coefficient (α)
| 1 |
where A is the absorption and t is the sample thickness. The transmittance (T) is given by
| 2 |
The reflectance (R) and linear refractive index (n0) in terms of the absorption coefficient (α) can be determined using the following equation46
| 3 |
The values of transmittance and R can be used to measure the n0 of prepared carbon quantum dots from the following equation47
| 4 |
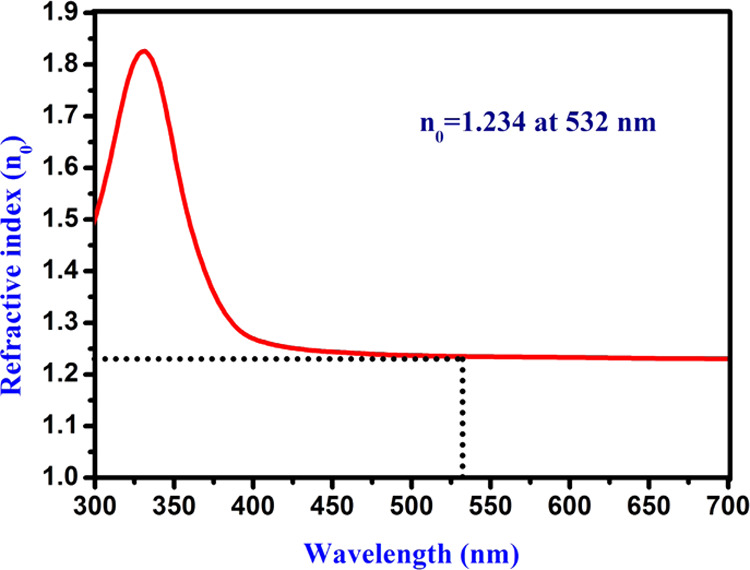
From the recorded absorption spectrum, n0 was calculated, and a graph is drawn between n0 and λ, as presented in Figure 5. The calculated linear refractive index (n0) of the prepared fluorescent CQDs was found to be 1.234 at a wavelength of 532 nm, and it is used to evaluate the higher-order NLO susceptibility (χ(3)) of the carbon quantum dots (CQDs).
Figure 4.
UV–visible absorption spectrum of CQDs.
Figure 5.
Linear refractive index of carbon quantum dots.
3.5. Fluorescence Analysis
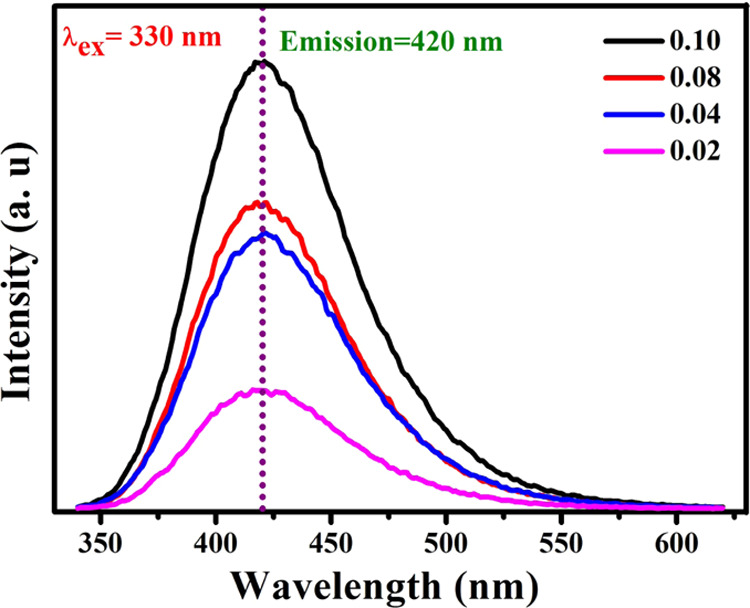
The fluorescence spectra are reported for the diluted sample at the wavelength of excitation (λex = 330 nm). Peng et al.48 suggested that a higher quantum yield was obtained by surface states of carbon quantum dots separated by an organic solvent. The luminescence spectrum affirms the blue-fluorescence character of the carbon quantum dots due to their quantum effect, larger surface area, and emissive traps.49,50 The citric acid solvent plays a significant role when it is added to the CDs, and it improves their fluorescence nature. The findings are more similar to the results obtained with the polystyrene foam leftover soot CQDs.51 In this article, fluorescence spectra of CQDs for different concentrations (0.02–1 mL) have been investigated and are exhibited in Figure 6. This fluorescence emission intensity gradually enhances as the concentration of the solution increases, which is further evidence for the enhancement of emission properties. The CQDs exhibited a sky blue color using a long-wave UV-light source at 365 nm, as displayed in Figure 4. We found this diverse range of fluorescence emissions to be immensely beneficial and efficient compared with green fluorescence CQDs.52 The result shows that the carbon quantum dots could be a better replacement for conventional coloring applications for fluorescent labeling.53
Figure 6.
Fluorescence emission spectrum of CQDs at different concentrations.
3.6. Quantum Yield (QY) Measurement
The QY of the as-prepared CQDs was measured by diluting the sample in deionized water. The solution was taken from a 10 mm quartz cuvette to measure UV-Vis and fluorescence spectra. Quinine sulfate of 0.1 M [H2SO4] was used as a standard reference, for which the QY is 0.54.54 The following equation was used to evaluate the QY
| 5 |
where QYref is the QY of the reference material (0.54 for quinine sulfate), η is the refractive index of the solvent, ηref is the refractive index of quinine sulfate, A is the absorption at the given wavelength, and I is the integrated fluorescence emission intensity. The fluorescence QY of the carbon quantum dots at λex = 330 nm was calculated to be 17.98%, and the integrated luminescence intensity of carbon quantum dots was compared to that of standard quinine sulfate.55
3.7. Z-scan Analysis
The third-order nonlinear optical parameters of carbon quantum dots were examined using the Z-scan method.56 This technique has indeed been established for a diverse number of uses, such as optical switching, optical limiting, etc. The material is caused by the laser pulse when it either focuses or defocuses, which depends on the nonlinearity of the materials. Nonlinear absorption occurs in the ground state (S0) and then in the first and the next larger singlet state (S1 and S2). The T1 and T2 energy states describe the lowest and the highest triplet transformation based on the pulse size, wavelength, and pump intensity. The system (S1-S2and T1-T2) are classified as excited-state absorption (ESA), and is related to as reverse saturable absorption (RSA) because its cross-sections are greater than for the ground state.57−59 The measurement begins from −Z where the transmittance is relatively constant (T = 1). The normalized condition (T = 1) of Z-scan is exhibited in Figure 7a. The sample is shifted in the direction of emphasis (Z = 0) and then reaches +Z. If the sample has a positive nonlinearity (n2 > 0), then the transmittance graph has a valley first and then a peak, as seen in Figure 7b. For the sample with n2 < 0, the graph is precisely the opposite (a peak followed by a valley), as seen in Figure 8c. When self-focusing occurs in the sample, this tends to focus the beam and induces a beam-narrowing (beam converging) at the aperture, which increases the transmittance measured, and when self-defocusing occurs, this tends to expand the beam (beam diverging) at the aperture and leads to a reduction in transmittance. The scan is completed when the transmittance becomes linear again (T = 1). The CQDs exhibit strong RSA. The recorded closed and open aperture Z-scan patterns of carbon quantum dots are depicted in Figures 8a and 9, respectively. From the open aperture mode, the maximum lies near the focus (Z = 0). If the intensity of the transmission peak is high, it indicates saturable absorption (SA), and, on the other hand, if the intensity of the transmission is less (valley), it is called reverse saturation absorption (RSA). To obtain the NLR index of the carbon quantum dots, the disparity between the standardized transmission intensity peak and valley (ΔTp-v) in the curve of ratio of closed and open aperture standardized Z-scan patterns is calculated, as displayed in Figure 8b. The nonlinear optical parameters are determined by standard relations.60−62 The actual and imaginary parts of the NLO susceptibility (χ(3)) values of the CQDs are calculated using the following equations63,64
| 6 |
| 7 |
Here, ε0 is the permittivity of free space (8.854 × 10⁻¹² F/m), c is the velocity of light in vacuum, and n0 is the linear refractive index of the carbon quantum dots. The third-order nonlinear susceptibility (χ(3)) of the carbon quantum dots could be evaluated by the equation
| 8 |
The values calculated for the NLO parameters n2, β, and χ(3) are summarized in Table 1. The NLO susceptibility is found to be higher than those of several other nonlinear optical materials, as seen in Table 2.65−69 Therefore, synthetic carbon dots are a good fit for optical switches if the conditions W > 1 and T < 1 are fulfilled.70
| 9 |
| 10 |
where I is the irradiance of the laser beam. The figures of merit were evaluated to be W = 6.6661 and T = 0.0132, which significantly fulfilled the condition. Hence, the synthesized sugarcane industrial waste CQDs are suitable for all optical switching and power conversion device applications.
Figure 7.
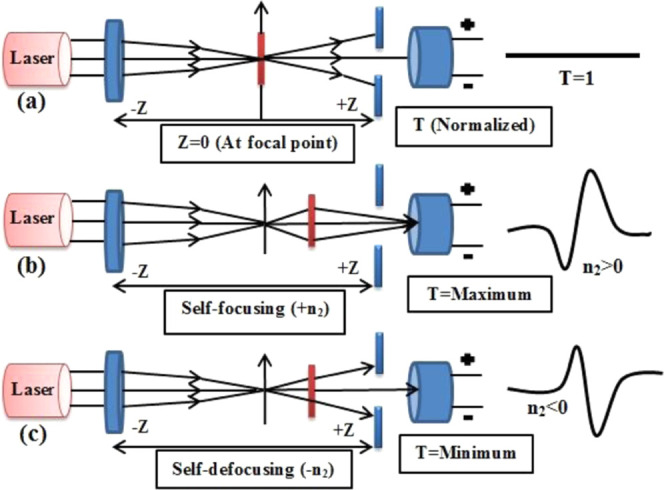
(a) Sample at the focal point (Z = 0), (b) sample self-focusing (+n2), and (c) sample self-defocusing (−n2).
Figure 8.
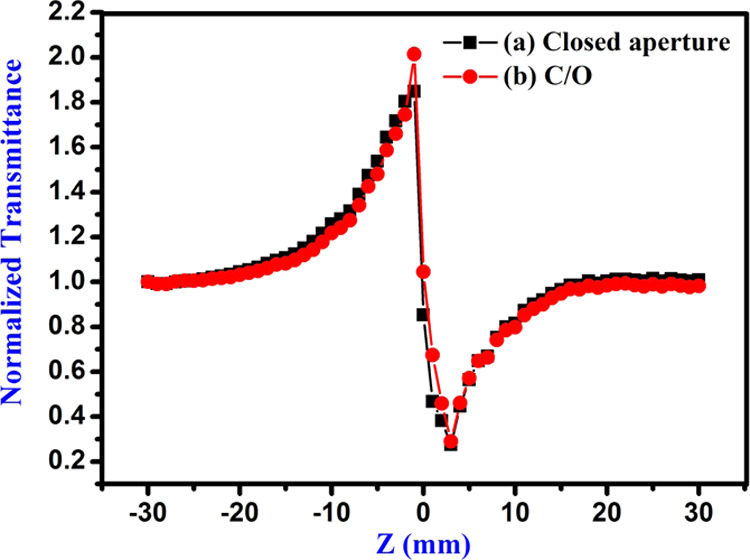
(a) Closed and (b) ratio of closed and open aperture Z-scan patterns of as-prepared CQDs.
Figure 9.
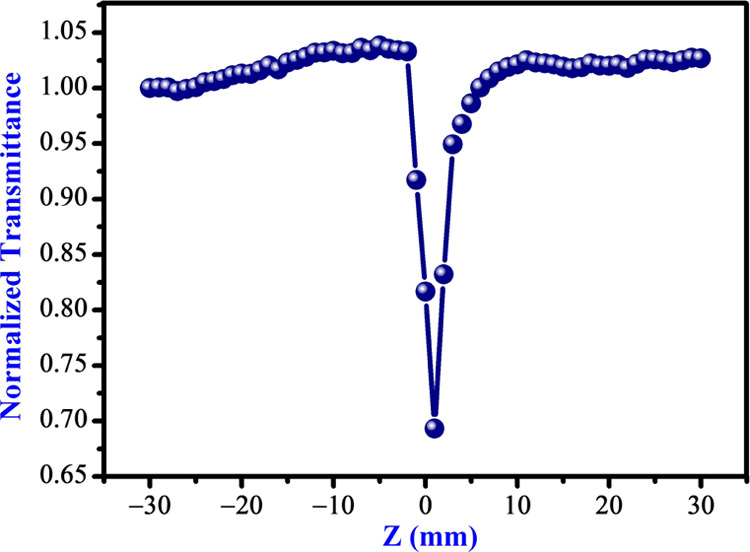
Open aperture Z-scan pattern of as-prepared CQDs.
Table 1. Third-Order NLO Measurement Values of Prepared CQDs.
| third-order NLO parameters | values |
|---|---|
| laser beam wavelength (λ) | 532 nm |
| linear absorption coefficient (α) | 9.902 |
| linear refractive index (n0) | 1.2348 |
| nonlinear absorption coefficient (β) | 2.513 × 10⁻⁴ cm/W |
| nonlinear refractive index (n2) | 1.012 × 10⁻⁸ cm2/W |
| real part of the third-order susceptibility [Re(χ)(3)] | 3.917 × 10⁻⁷ esu |
| imaginary part of the third-order susceptibility [Im(χ)3] | 4.120 × 10⁻⁸ esu |
| third-order nonlinear optical susceptibility [χ(3)] | 3.939 × 10⁻⁷ esu |
Table 2. Comparison of Third-Order NLO Susceptibility (χ(3)) Values for Other Nonlinear Optical Materials and CQDs.
| materials | method | (χ(3)) (esu) | ref |
|---|---|---|---|
| sugarcane waste CQDs | hydrothermal | 3.939 × 10⁻⁷ | present work |
| orange waste CQDs | hydrothermal | 2.774 × 10⁻⁷ | (65) |
| N-CDs | one-step wet chemical | 12.5 × 10⁻¹² | (66) |
| boron-doped C-dots | microwave heating | 5.0 × 10⁻¹⁵ | (67) |
| carbon dots (CDs) | pyrolysis | 11.3 × 10⁻¹³ | (68) |
| CDs | ultrasonication | 4.6 × 10⁻¹³ | (69) |
3.8. Antibacterial Activity
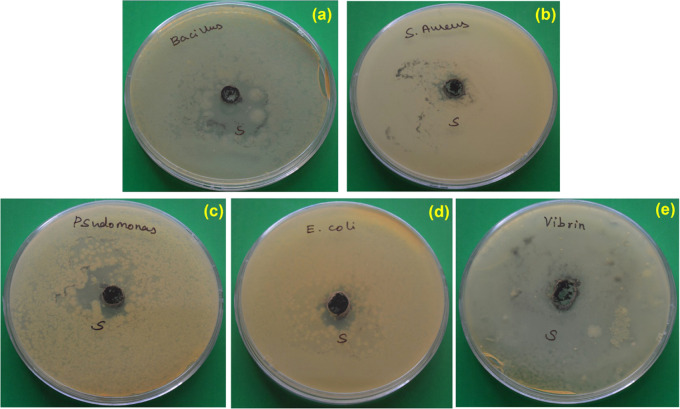
The antibacterial assays of CQDs against Gram +ve and Gram −ve bacteria were evaluated. CQDs have been used to suppress the growth of bacteria (Figure 10). The ZOIs obtained for the microorganisms are presented in Table 3. The antibacterial function of CQDs is demonstrated in Figure 11. The antibacterial behavior may be attributed to various functional groups present in CQDs that could interfere with cellular enzyme functions and inhibit cellular proliferation. The large π-conjugated carbon quantum dot system easily attached through electron transfer to the bacterial cell wall.71,72 The antibacterial mechanism of the CQDs has been widely speculated, as per the literature, to be based on electrostatic interactions, ROS, or light irradiation. ROS generation has essentially important antibacterial activity.73−77 The hydroxyl radicals and nitrogen groups are confirmed from FTIR and XPS studies. CQDs include nitrogen elements that possess positive charges that link them with negatively charged microbes, and CQDs penetrate into the cell membrane and ultimately result in the death of microorganisms. Several studies have reported nitrogen-containing CQDs with assured antimicrobial activity against Gram +ve and Gram −ve microorganisms. Yadav et al.78 have reported CNQDs that could effectively produce superoxide and hydroxyl radicals and interact with Staphylococcus aureus and E. coli pathogens. Travlou et al.21 have developed N-doped CQDs with specific antimicrobial activity against E. coli and B. subtilis. Interestingly, in the present study, the CQDs show more inhibition toward Bacillus cereus, Staphylococcus aureus, Pseudomonas aeruginosa, Vibrio cholera, and Escherichia coli, and their antibacterial activity is compared with those of other CQDs (Table 4).79−86 Therefore, the synthesized CQDs can be used for pharmaceutical applications.
Figure 10.
Antibacterial activities of as-prepared CQDs against (a) Bacillus cereus, (b) Staphylococcus aureus, (c) Pseudomonas aeruginosa, (d) Escherichia coli, and (e) Vibrio cholerae bacterial pathogens.
Table 3. Antibacterial Activity of Carbon Quantum Dots against Bacterial Pathogenic Organisms.
| tested organism | Gram reaction | zone of inhibition (mm) |
|---|---|---|
| Bacillus cereus | +ve | 30 |
| Staphylococcus aureus | +ve | 22 |
| Pseudomonas aeruginosa | –ve | 24 |
| Vibrio cholera | –ve | 25 |
| Escherichia coli | –ve | 14 |
Figure 11.
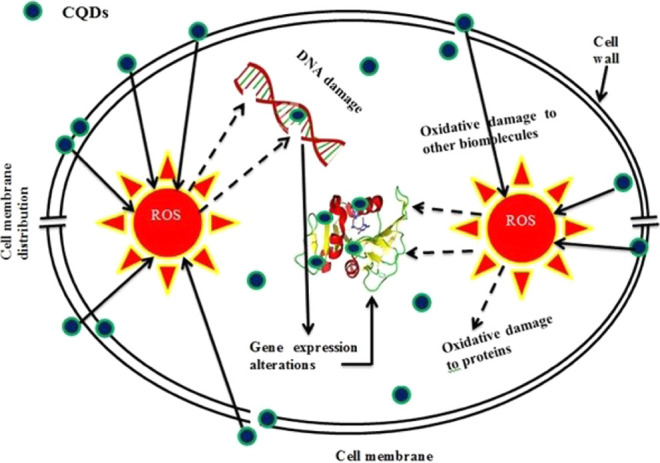
Schematic diagram of the antimicrobial activity mechanism.
Table 4. Comparison of Antibacterial Activity Obtained in the Present Work with That of Some Other Quantum Dots.
| bacterial species | samples | zone of inhibition (mm) | ref |
|---|---|---|---|
| Benthesicymus cereus | ZnS QDs | 3.1 | (79) |
| sugarcane CQDs | 30 | present work | |
| S. aureus | curcumin QDs | 14.1 ± 0.6 | (80) |
| henna CDs | 17 | (81) | |
| nonylphenol CQDs | 13 | (82) | |
| Lys-CQDs | 16 | (83) | |
| sugarcane CQDs | 22 | present work | |
| P. aeruginosa | curcumin quantum dots | 13.8 ± 1.1 | (80) |
| nonylphenol CQDs | 11 | (82) | |
| Ag2S–N–CQD | 11.9 | (84) | |
| sugarcane CQDs | 24 | present work | |
| V. cholera | ZCA | 23 | (85) |
| sugarcane CQDs | 25 | present work | |
| E. coli | henna CDs | 12 | (81) |
| Ag2S–N–CQD | 11.7 | (83) | |
| Cu QDs | 11 | (86) | |
| sugarcane CQDs | 14 | present work |
4. Conclusions
Industrial waste (sugarcane bagasse pulp) CQDs were synthesized by the hydrothermal method with a 17.98% quantum yield. The average particle size of the CQDs was 1.7 ± 0.2 nm with a spherical shape, which was determined by HRTEM analysis. The XRD analysis confirmed that the CQDs possess an amorphous graphitic carbon-like structure. XPS, UV–visible, and FTIR spectra revealed that the presence of hydrophilic groups (-OH, -COOH, and −NH2) led to superior water solubility. The biofluorescence nature of CQDs with different bandwidths suggests that it is an exquisite alternative for the traditional dyes that are used for biosensing applications. The calculated values in the Z-scan analysis clearly demonstrate a high nonlinear absorption (β), nonlinear refraction (n2), and third-order NLO susceptibility (χ(3)), which well satisfy the optical switching condition, proving that CQDs can be a good material for optical switching applications. The CQDs exhibited good antibacterial activities against tested bacterial strains. The above results suggest that biocompatible and quickly prepared CQDs are a suitable material for photonic devices, bioimaging, and biomedical applications.
Acknowledgments
P.S is thankful to UGC-NFHE (F1-17.1/2015-16/NFST-2015-17-ST-TAM-1335) and A. L. thanks UGC-RGNF (F1-17.1/2016-17/RGNF-2015-17-SC-TAM-21802) New Delhi, India, for the fellowship.
Author Contributions
⊥ S.P. and L.A. equally contributed as first authors. S.P.: investigation, writing: original draft, and data curation. L.A.: investigation, writing: original draft, and data curation. S.P.S.: investigation, methodology, resources, and software. R.P.: supervision, validation, and writing: review and editing. P.S.: conceptualization, validation, writing: original draft, review, and editing. K.K.: writing: review and editing, investigation, and visualization. G.P.: conceptualization, data curation, formal analysis, and project administration. T.A.H.: formal analysis, software, and writing: review and editing. G.V.: writing: review and editing.
The authors declare no competing financial interest.
References
- Thambiraj S.; Shankaran D. R. Green Synthesis of Highly Fluorescent Carbon Quantum Dots from Sugarcane Bagasse Pulp. Appl. Surf. Sci. 2016, 390, 435–443. 10.1016/j.apsusc.2016.08.106. [DOI] [Google Scholar]
- Zhuo C.; Alves J. O.; Tenorio J. A. S.; Levendis Y. A. Synthesis of Carbon Nanomaterials through Up-Cycling Agricultural and Municipal Solid Wastes. Ind. Eng. Chem. Res. 2012, 51, 2922–2930. 10.1021/ie202711h. [DOI] [Google Scholar]
- Asha Jhonsi M.; Thulasi S. A Novel Fluorescent Carbon Dots Derived from Tamarind. Chem. Phys. Lett. 2016, 661, 179–184. 10.1016/j.cplett.2016.08.081. [DOI] [Google Scholar]
- Lu W.; Qin X.; Liu S.; Chang G.; Zhang Y.; Luo Y.; Asiri A. M.; Al-Youbi A. O.; Sun X. Economical, Green Synthesis of Fluorescent Carbon Nanoparticles and Their Use as Probes for Sensitive and Selective Detection of Mercury (II) Ions. Anal. Chem. 2012, 84, 5351–5357. 10.1021/ac3007939. [DOI] [PubMed] [Google Scholar]
- Leontiadis G. I.; Sharma V. K.; Howden C. W. Proton Pump Inhibitor Therapy for Peptic Ulcer Bleeding: Cochrane Collaboration Meta-Analysis of Randomized Controlled Trials. Mayo Clin. Proc. 2007, 82, 286–296. 10.1016/S0025-6196(11)61024-0. [DOI] [PubMed] [Google Scholar]
- Sharma S.; Umar A.; Mehta S. K.; Kansal S. K. Fluorescent Spongy Carbon Nanoglobules Derived from Pineapple Juice: A Potential Sensing Probe for Specific and Selective Detection of Chromium (VI) Ions. Ceram. Int. 2017, 43, 7011–7019. 10.1016/j.ceramint.2017.02.127. [DOI] [Google Scholar]
- Tyagi A.; Tripathi K. M.; Singh N.; Choudhary S.; Gupta R. K. Green Synthesis of Carbon Quantum Dots from Lemon Peel Waste: Applications in Sensing and Photocatalysis. RSC Adv. 2016, 6, 72423–72432. 10.1039/C6RA10488F. [DOI] [Google Scholar]
- Chatzimitakos T.; Kasouni A.; Sygellou L.; Avgeropoulos A.; Troganis A.; Stalikas C. Two of a Kind but Different: Luminescent Carbon Quantum Dots from Citrus Peels for Iron and Tartrazine Sensing and Cell Imaging. Talanta 2017, 175, 305–312. 10.1016/j.talanta.2017.07.053. [DOI] [PubMed] [Google Scholar]
- Kasibabu B. S. B.; D’souza S. L.; Jha S.; Kailasa S. K. Imaging of Bacterial and Fungal Cells Using Fluorescent Carbon Dots Prepared from Carica Papaya Juice. J. Fluoresc. 2015, 25, 803–810. 10.1007/s10895-015-1595-0. [DOI] [PubMed] [Google Scholar]
- De B.; Karak N. A Green and Facile Approach for the Synthesis of Water Soluble Fluorescent Carbon Dots from Banana Juice. RSC Adv. 2013, 3, 8286. 10.1039/c3ra00088e. [DOI] [Google Scholar]
- Zhu C.; Zhai J.; Dong S. Bifunctional Fluorescent Carbon Nanodots: Green Synthesis via Soy Milk and Application as Metal-Free Electrocatalysts for Oxygen Reduction. Chem. Commun. 2012, 48, 9367–9369. 10.1039/c2cc33844k. [DOI] [PubMed] [Google Scholar]
- Sun Y. X.; He Z. W.; Sun X. B.; Zhao Z. D. Synthesis of Water-Soluble Fluorescent Carbon Dots from a One-Step Hydrothermal Method with Potato. Adv. Mater. Res. 2013, 873, 770–776. 10.4028/www.scientific.net/AMR.873.770. [DOI] [Google Scholar]
- Xu H.; Xie L.; Hakkarainen M. Coffee-Ground-Derived Quantum Dots for Aqueous Processable Nanoporous Graphene Membranes. ACS Sustainable Chem. Eng. 2017, 5, 5360–5367. 10.1021/acssuschemeng.7b00663. [DOI] [Google Scholar]
- Alam A.-M.; Park B.-Y.; Ghouri Z. K.; Park M.; Kim H.-Y. Synthesis of Carbon Quantum Dots from Cabbage with down- and up-Conversion Photoluminescence Properties: Excellent Imaging Agent for Biomedical Applications. Green Chem. 2015, 17, 3791–3797. 10.1039/C5GC00686D. [DOI] [Google Scholar]
- Huang G.; Chen X.; Wang C.; Zheng H.; Huang Z.; Chen D.; Xie H. Photoluminescent Carbon Dots Derived from Sugarcane Molasses: Synthesis, Properties, and Applications. RSC Adv. 2017, 7, 47840–47847. 10.1039/C7RA09002A. [DOI] [Google Scholar]
- Zandersons J.; Gravitis J.; Zhurinsh A.; Kokorevics A.; Kallavus U.; Suzuki C. K. Carbon Materials Obtained from Self-Binding Sugar Cane Bagasse and Deciduous Wood Residues Plastics. Biomass Bioenergy 2004, 26, 345–360. 10.1016/S0961-9534(03)00126-0. [DOI] [Google Scholar]
- Mehta V. N.; Jha S.; Kailasa S. K. One-Pot Green Synthesis of Carbon Dots by Using Saccharum Officinarum Juice for Fluorescent Imaging of Bacteria (Escherichia coli) and Yeast (Saccharomyces cerevisiae) Cells. Mater. Sci. Eng. C 2014, 38, 20–27. 10.1016/j.msec.2014.01.038. [DOI] [PubMed] [Google Scholar]
- Xu-Cheng F.; Xuan-Hua L.; Jin J.; Zhang J.; Wei G. Facile Synthesis of Bagasse Waste Derived Carbon Dots for Trace Mercury Detection. Mater. Res. Express 2018, 5, 065044 10.1088/2053-1591/aaccb7. [DOI] [Google Scholar]
- Du F.; Zhang M.; Li X.; Li J.; Jiang X.; Li Z.; Hua Y.; Shao G.; Jin J.; Shao Q.; Zhou M.; Gong A. Economical and Green Synthesis of Bagasse-Derived Fluorescent Carbon Dots for Biomedical Applications. Nanotechnology 2014, 25, 315702 10.1088/0957-4484/25/31/315702. [DOI] [PubMed] [Google Scholar]
- Huang T.; Hao Z.; Gong H.; Liu Z.; Xiao S.; Li S.; Zhai Y.; You S.; Wang Q.; Qin J. Third-Order Nonlinear Optical Properties of a New Copper Coordination Compound: A Promising Candidate for All-Optical Switching. Chem. Phys. Lett. 2008, 451, 213–217. 10.1016/j.cplett.2007.12.001. [DOI] [Google Scholar]
- Travlou N. A.; Giannakoudakis D. A.; Algarra M.; Labella A. M.; Rodríguez-Castellón E.; Bandosz T. J. S- and N-Doped Carbon Quantum Dots: Surface Chemistry Dependent Antibacterial Activity. Carbon 2018, 135, 104–111. 10.1016/j.carbon.2018.04.018. [DOI] [PubMed] [Google Scholar]
- Dong X.; Liang W.; Meziani M. J.; Sun Y.-P.; Yang L. Carbon Dots as Potent Antimicrobial Agents. Theranostics 2020, 10, 671–686. 10.7150/thno.39863. [DOI] [PMC free article] [PubMed] [Google Scholar]
- Moradlou O.; Rabiei Z.; Delavari N. Antibacterial Effects of Carbon Quantum Dots@hematite Nanostructures Deposited on Titanium against Gram-Positive and Gram-Negative Bacteria. J. Photochem. Photobiol., A 2019, 379, 144–149. 10.1016/j.jphotochem.2019.04.047. [DOI] [Google Scholar]
- Yang J.; Gao G.; Zhang X.; Ma Y.-H.; Chen X.; Wu F.-G. One-Step Synthesis of Carbon Dots with Bacterial Contact-Enhanced Fluorescence Emission: Fast Gram-Type Identification and Selective Gram-Positive Bacterial Inactivation. Carbon 2019, 146, 827–839. 10.1016/j.carbon.2019.02.040. [DOI] [Google Scholar]
- Otis G.; Bhattacharya S.; Malka O.; Kolusheva S.; Bolel P.; Porgador A.; Jelinek R. Selective Labeling and Growth Inhibition of Pseudomonas aeruginosa by Aminoguanidine Carbon Dots. ACS Infect. Dis. 2019, 5, 292–302. 10.1021/acsinfecdis.8b00270. [DOI] [PubMed] [Google Scholar]
- Strelko V. V.; Kartel N. T.; Dukhno I. N.; Kuts V. S.; Clarkson R. B.; Odintsov B. M. Mechanism of Reductive Oxygen Adsorption on Active Carbons with Various Surface Chemistry. Surf. Sci. 2004, 548, 281–290. 10.1016/j.susc.2003.11.012. [DOI] [Google Scholar]
- Kumar N.; Srivastava V. C. Simple Synthesis of Large Graphene Oxide Sheets via Electrochemical Method Coupled with Oxidation Process. ACS Omega 2018, 3, 10233–10242. 10.1021/acsomega.8b01283. [DOI] [PMC free article] [PubMed] [Google Scholar]
- Hsu P. C.; Chang H. T. Synthesis of High-Quality Carbon Nanodots from Hydrophilic Compounds: Role of Functional Groups. Chem. Commun. 2012, 48, 3984–3986. 10.1039/c2cc30188a. [DOI] [PubMed] [Google Scholar]
- Liang Q.; Ma W.; Shi Y.; Li Z.; Yang X. Easy Synthesis of Highly Fluorescent Carbon Quantum Dots from Gelatin and Their Luminescent Properties and Applications. Carbon 2013, 60, 421–428. 10.1016/j.carbon.2013.04.055. [DOI] [Google Scholar]
- Ansi V.; Renuka N. Table Sugar Derived Carbon Dot – a Naked Eye Sensor for Toxic Pb2+ Ions. Sens. Actuators, B 2018, 264, 67–75. 10.1016/j.snb.2018.02.167. [DOI] [Google Scholar]
- Chakraborty D.; Sarkar S.; Das P. K. Blood Dots: Hemoglobin-Derived Carbon Dots as Hydrogen Peroxide Sensors and Pro-Drug Activators. ACS Sustainable Chem. Eng. 2018, 6, 4661–4670. 10.1021/acssuschemeng.7b03691. [DOI] [Google Scholar]
- Eskalen H.; Uruş S.; Cömertpay S.; Kurt A. H.; Özgan Ş. Microwave-Assisted Ultra-Fast Synthesis of Carbon Quantum Dots from Linter: Fluorescence Cancer Imaging and Human Cell Growth Inhibition Properties. Ind. Crops Prod. 2020, 147, 112209 10.1016/j.indcrop.2020.112209. [DOI] [Google Scholar]
- Zhai H.; Zheng B.; Yang F.; Wang M.; Xiao D. Synthesis of Water-Soluble Fluorescent Carbon Dots from Setcreasea Purpurea Boom and Its Application for Br2 Detection. Anal. Methods 2018, 10, 151–157. 10.1039/C7AY02631E. [DOI] [Google Scholar]
- El Sharkawy H. M.; Dhmees A. S.; Tamman A. R.; El Sabagh S. M.; Aboushahba R. M.; Allam N. K. N-Doped Carbon Quantum Dots Boost the Electrochemical Supercapacitive Performance and Cyclic Stability of MoS2. J. Energy Storage 2020, 27, 101078 10.1016/j.est.2019.101078. [DOI] [Google Scholar]
- Wang C.; Shi H.; Yang M.; Yan Y.; Liu E.; Ji Z.; Fan J. Facile Synthesis of Novel Carbon Quantum Dots from Biomass Waste for Highly Sensitive Detection of Iron Ions. Mater. Res. Bull. 2020, 124, 110730 10.1016/j.materresbull.2019.110730. [DOI] [Google Scholar]
- Chaudhary N.; Gupta P. K.; Eremin S.; Solanki P. R. One-Step Green Approach to Synthesize Highly Fluorescent Carbon Quantum Dots from Banana Juice for Selective Detection of Copper Ions. J. Environ. Chem. Eng. 2020, 8, 103720 10.1016/j.jece.2020.103720. [DOI] [Google Scholar]
- Yang J.; Zhang X.; Ma Y.-H.; Gao G.; Chen X.; Jia H.-R.; Li Y.-H.; Chen Z.; Wu F.-G. Carbon Dot-Based Platform for Simultaneous Bacterial Distinguishment and Antibacterial Applications. ACS Appl. Mater. Interfaces 2016, 8, 32170–32181. 10.1021/acsami.6b10398. [DOI] [PubMed] [Google Scholar]
- Karthik K.; Dhanuskodi S.; Gobinath C.; Prabukumar S.; Sivaramakrishnan S. Nanostructured CdO-NiO Composite for Multifunctional Applications. J. Phys. Chem. Solids 2018, 112, 106–118. 10.1016/j.jpcs.2017.09.016. [DOI] [Google Scholar]
- Karthik K.; Dhanuskodi S.; Gobinath C.; Prabukumar S.; Sivaramakrishnan S. Fabrication of MgO Nanostructures and Its Efficient Photocatalytic, Antibacterial and Anticancer Performance. J. Photochem. Photobiol., B 2019, 190, 8–20. 10.1016/j.jphotobiol.2018.11.001. [DOI] [PubMed] [Google Scholar]
- Prasannan A.; Imae T. One-Pot Synthesis of Fluorescent Carbon Dots from Orange Waste Peels. Ind. Eng. Chem. Res. 2013, 52, 15673–15678. 10.1021/ie402421s. [DOI] [Google Scholar]
- Hoon Park J.; Kumar N.; Hoon Park D.; Yusupov M.; Neyts E. C.; Verlackt C. C. W.; Bogaerts A.; Ho Kang M.; Sup Uhm H.; Ha Choi E.; Attri P. A Comparative Study for the Inactivation of Multidrug Resistance Bacteria Using Dielectric Barrier Discharge and Nano-Second Pulsed Plasma. Sci. Rep. 2015, 5, 13849 10.1038/srep13849. [DOI] [PMC free article] [PubMed] [Google Scholar]
- van Putten R.-J.; van der Waal J. C.; de Jong E.; Rasrendra C. B.; Heeres H. J.; de Vries J. G. Hydroxymethylfurfural, A Versatile Platform Chemical Made from Renewable Resources. Chem. Rev. 2013, 113, 1499–1597. 10.1021/cr300182k. [DOI] [PubMed] [Google Scholar]
- Zhang Y.; Wang Y.; Feng X.; Zhang F.; Yang Y.; Liu X. Effect of Reaction Temperature on Structure and Fluorescence Properties of Nitrogen-Doped Carbon Dots. Appl. Surf. Sci. 2016, 387, 1236–1246. 10.1016/j.apsusc.2016.07.048. [DOI] [Google Scholar]
- Gao F.; Ma S.; Li J.; Dai K.; Xiao X.; Zhao D.; Gong W. Rational Design of High Quality Citric Acid-Derived Carbon Dots by Selecting Efficient Chemical Structure Motifs. Carbon 2017, 112, 131–141. 10.1016/j.carbon.2016.10.089. [DOI] [Google Scholar]
- Zhang W.; Shi L.; Liu Y.; Meng X.; Xu H.; Xu Y.; Liu B.; Fang X.; Li H.-B.; Ding T. Supramolecular Interactions via Hydrogen Bonding Contributing to Citric-Acid Derived Carbon Dots with High Quantum Yield and Sensitive Photoluminescence. RSC Adv. 2017, 7, 20345–20353. 10.1039/C7RA02160G. [DOI] [Google Scholar]
- Karuppasamy P.; Sivasubramani V.; Senthil Pandian M.; Ramasamy P. Growth and characterization of semi-organic third order nonlinear optical (NLO) Potassium 3,5-Dinitrobenzoate (KDNB) single crystal. RSC Adv. 2016, 6, 109105–10923. 10.1039/C6RA21590D. [DOI] [Google Scholar]
- Senthil K.; Kalainathan S.; Kumar A. R.; Aravindan P. G. Investigation of Synthesis, Crystal Structure and Third-Order NLO Properties of a New Stilbazolium Derivative Crystal: A Promising Material for Nonlinear Optical Devices. RSC Adv. 2014, 4, 56112–56127. 10.1039/C4RA09112D. [DOI] [Google Scholar]
- Peng H.; Travas-Sejdic J. Simple Aqueous Solution Route to Luminescent Carbogenic Dots from Carbohydrates. Chem. Mater. 2009, 21, 5563–5565. 10.1021/cm901593y. [DOI] [Google Scholar]
- Baker S. N.; Baker G. A. Luminescent Carbon Nanodots: Emergent Nanolights. Angew. Chem., Int. Ed. 2010, 49, 6726–6744. 10.1002/anie.200906623. [DOI] [PubMed] [Google Scholar]
- Sun Y.-P.; Zhou B.; Lin Y.; Wang W.; Fernando K. a. S.; Pathak P.; Meziani M. J.; Harruff B. a.; Wang X.; Wang H.; Luo P. G.; Yang H.; Kose M. E.; Chen B.; Veca L. M.; Xie S.-Y. Quantum-Sized Carbon Dots for Bright and Colorful Photoluminescence. J. Am. Chem. Soc. 2006, 128, 7756–7757. 10.1021/ja062677d. [DOI] [PubMed] [Google Scholar]
- Weng C.-I.; Chang H.-T.; Lin C.-H.; Shen Y.-W.; Unnikrishnan B.; Li Y.-J.; Huang C.-C. One-Step Synthesis of Biofunctional Carbon Quantum Dots for Bacterial Labeling. Biosens. Bioelectron. 2015, 68, 1–6. 10.1016/j.bios.2014.12.028. [DOI] [PubMed] [Google Scholar]
- Mewada A.; Pandey S.; Shinde S.; Mishra N.; Oza G.; Thakur M.; Sharon M.; Sharon M. Green Synthesis of Biocompatible Carbon Dots Using Aqueous Extract of Trapa Bispinosa Peel. Mater. Sci. Eng. C 2013, 33, 2914–2917. 10.1016/j.msec.2013.03.018. [DOI] [PubMed] [Google Scholar]
- Ding H.; Cheng L.-W.; Ma Y.-Y.; Kong J.-L.; Xiong H.-M. Luminescent Carbon Quantum Dots and Their Application in Cell Imaging. New J. Chem. 2013, 37, 2515–2520. 10.1039/c3nj00366c. [DOI] [Google Scholar]
- Hu Y.; Yang J.; Tian J.; Jia L.; Yu J.-S. Waste Frying Oil as a Precursor for One-Step Synthesis of Sulfur-Doped Carbon Dots with pH-Sensitive Photoluminescence. Carbon 2014, 77, 775–782. 10.1016/j.carbon.2014.05.081. [DOI] [Google Scholar]
- Li J. Y.; Liu Y.; Shu Q. W.; Liang J. M.; Zhang F.; Chen X. P.; Deng X. Y.; Swihart M. T.; Tan K. J. One-Pot Hydrothermal Synthesis of Carbon Dots with Efficient up- and down-Converted Photoluminescence for the Sensitive Detection of Morin in a Dual-Readout Assay. Langmuir 2017, 33, 1043–1050. 10.1021/acs.langmuir.6b04225. [DOI] [PubMed] [Google Scholar]
- Sheik-bahae M.; Said A. A.; Van Stryland E. W. High-Sensitivity, Single-Beam n2 Measurements. Opt. Lett. 1989, 14, 955–957. 10.1364/OL.14.000955. [DOI] [PubMed] [Google Scholar]
- Abed S.; Bouchouit K.; Aida M. S.; Taboukhat S.; Sofiani Z.; Kulyk B.; Figa V. Nonlinear Optical Properties of Zinc Oxide Doped Bismuth Thin Films Using Z-Scan Technique. Opt. Mater. 2016, 56, 40–44. 10.1016/j.optmat.2015.12.014. [DOI] [Google Scholar]
- Rao S. V.; Srinivas N. K. M. N.; Rao D. N.; Giribabu L.; Maiya B. G.; Philip R.; Kumar G. R. Studies of Third-Order Optical Nonlinearity and Nonlinear Absorption in Tetra Tolyl Porphyrins Using Degenerate Four Wave Mixing and Z-Scan. Opt. Commun. 2000, 182, 255–264. 10.1016/S0030-4018(00)00808-7. [DOI] [Google Scholar]
- Lakshmanan A.; Surendran P.; Sakthy Priya S.; Balakrishnan K.; Geetha P.; Rameshkumar P.; Tejaswi Ashok H.; Vinitha G.; Karthik K. Investigations on structural, optical, dielectric, electronic polarizability, Z-scan and antibacterial properties of Ni/Zn/Fe2O4 nanoparticles fabricated by microwave-assisted combustion method. J. Photochem. Photobiol., A 2020, 402, 112794–112803. 10.1016/j.jphotochem.2020.112794. [DOI] [Google Scholar]
- Yuvaraj S.; Manikandan N.; Vinitha G. Influence of Copper Ions on Structural and Non-Linear Optical Properties in Manganese Ferrite Nanomaterials. Opt. Mater. 2017, 73, 428–436. 10.1016/j.optmat.2017.08.027. [DOI] [Google Scholar]
- Sakthy Priya S.; Alexandar A.; Surendran P.; Lakshmanan A.; Rameshkumar P.; Sagayaraj P. Investigations on Nucleation, HRXRD, Optical, Piezoelectric, Polarizability and Z-Scan Analysis of L −arginine Maleate Dihydrate Single Crystals. Opt. Mater. 2017, 66, 434–441. 10.1016/j.optmat.2017.02.041. [DOI] [Google Scholar]
- Lakshmanan A.; Surendran P.; SakthyPriya S.; Balakrishnan K.; Hegde T. A.; Vinitha G.; Ramalingam G.; Ravindran B.; Chang S. W.; Elshikh M. S.; Mahmoud A. H.; Al Farraj D. A.; Rameshkumar P. Effect of Fuel Content on Nonlinear Optical and Antibacterial Activities of Zn/Cu/Al2O4 Nanoparticles Prepared by Microwave-Assisted Combustion Method. J. King Saud Univ. - Sci. 2020, 32, 1382–1389. 10.1016/j.jksus.2019.11.031. [DOI] [Google Scholar]
- R. W., BoydNonlinear Optics; Academic Press: New York, 1992. [Google Scholar]
- Cassano T.; Tommasi R.; Ferrara M.; Babudri F.; Farinola G. M.; Naso F. Substituent-dependence of the optical nonlinearities in poly (2,5-diakoxy-p-phenylenevinylene) polymers investigated by the Z-scan technique. Chem. Phys. 2001, 272, 111–118. 10.1016/S0301-0104(01)00453-0. [DOI] [Google Scholar]
- Surendran P.; Lakshmanan A.; Vinitha G.; Ramalingam G.; Rameshkumar P. Facile Preparation of High Fluorescent Carbon Quantum Dots from Orange Waste Peels for Nonlinear Optical Applications. Luminescence 2020, 35, 196–202. 10.1002/bio.3713. [DOI] [PubMed] [Google Scholar]
- Bai L.; Qiao S.; Li H.; Fang Y.; Yang Y.; Huang H.; Liu Y.; Song Y.; Kang Z. N-Doped Carbon Dot with Surface Dominant Non-Linear Optical Properties. RSC Adv. 2016, 6, 95476–95482. 10.1039/C6RA18837K. [DOI] [Google Scholar]
- Bourlinos A. B.; Trivizas G.; Karakassides M. A.; Baikousi M.; Kouloumpis A.; Gournis D.; Bakandritsos A.; Hola K.; Kozak O.; Zboril R.; Papagiannouli I.; Aloukos P.; Couris S. Green and Simple Route toward Boron Doped Carbon Dots with Significantly Enhanced Non-Linear Optical Properties. Carbon 2015, 83, 173–179. 10.1016/j.carbon.2014.11.032. [DOI] [Google Scholar]
- Ma L.; Xiang W.; Gao H.; Wang J.; Ni Y.; Liang X. Facile Synthesis of Tunable Fluorescent Carbon Dots and Their Third-Order Nonlinear Optical Properties. Dye. Pigment. 2016, 128, 1–7. 10.1016/j.dyepig.2016.01.005. [DOI] [Google Scholar]
- Papagiannouli I.; Bourlinos A. B.; Bakandritsos A.; Couris S. Nonlinear Optical Properties of Colloidal Carbon Nanoparticles: Nanodiamonds and Carbon Dots. RSC Adv. 2014, 4, 40152–40160. 10.1039/C4RA04714A. [DOI] [Google Scholar]
- Surendran P.; Lakshmanan A.; Priya S. S.; Balakrishnan K.; Rameshkumar P.; Hegde T. A.; Vinitha G.; Ramalingam G.; Raj A. A. Investigations on Solid-State Parameters of Third-Order Nonlinear Optical Ni1–xZnxFe2O4 Nanoparticles Synthesized by Microwave-Assisted Combustion Method. Appl. Phys. A 2020, 126, 257. 10.1007/s00339-020-3435-6. [DOI] [Google Scholar]
- Rajendiran K.; Zhao Z.; Pei D.-S.; Fu A. Antimicrobial Activity and Mechanism of Functionalized Quantum Dots. Polymers 2019, 11, 1670. 10.3390/polym11101670. [DOI] [PMC free article] [PubMed] [Google Scholar]
- Thakur M.; Pandey S.; Mewada A.; Patil V.; Khade M.; Goshi E.; Sharon M. Antibiotic Conjugated Fluorescent Carbon Dots as a Theranostic Agent for Controlled Drug Release, Bioimaging, and Enhanced Antimicrobial Activity. J. Drug Delivery 2014, 2014, 1–9. 10.1155/2014/282193. [DOI] [PMC free article] [PubMed] [Google Scholar]
- Lakshmanan A.; Surendran P.; Manivannan N.; Sathish M.; Balalakshmi C.; Suganthy N.; Rameshkumar P.; Kaviyarasu K.; Ramalingam G. Superficial Preparation of Biocompatible Carbon Quantum Dots for Antimicrobial Applications. Mater. Today: Proc. 2020, 2018–2021. 10.1016/j.matpr.2020.02.694. [DOI] [Google Scholar]
- Karthik K.; Dhanuskodi S.; Prabu Kumar S.; Sivaramakrishnan S. Structural and biological properties with enhanced photocatalytic beahviour of CdO-MgO nanocomposite by microwave-assisted method. Optik 2020, 204, 164221. [Google Scholar]
- Revathi V.; Karthik K. Physico-chemical properties and antibacterial activity of Hexakis (Thiocarbamide) Nickel(II) nitrate single crystal. Chem. Data Collect. 2019, 21, 100229 10.1016/j.cdc.2019.100229. [DOI] [Google Scholar]
- Aswini R.; Murugesan S.; Karthik K. Bio-engineered TiO2 nanoparticles using Ledebouria revoluta extract: Larvicidal, histopathological, antibacterial and anticancer activity. Int. J. Environ. Anal. Chem. 2020, 10.1080/03067319.2020.1718668. [DOI] [Google Scholar]
- Karthik K.; Radhika D.; Sadasivuni K. K.; Reddy K. R.; Raghu A. V. Nanostructured metal oxides and its hybrids for photocatalytic and biomedical applications. Adv. Colloid Interface Sci. 2020, 281, 102178 10.1016/j.cis.2020.102178. [DOI] [PubMed] [Google Scholar]
- Yadav P.; Nishanthi S. T.; Purohit B.; Shanavas A.; Kailasam K. Metal-Free Visible Light Photocatalytic Carbon Nitride Quantum Dots as Efficient Antibacterial Agents: An Insight Study. Carbon 2019, 152, 587–597. 10.1016/j.carbon.2019.06.045. [DOI] [Google Scholar]
- Baruah J. M.; Kalita S.; Narayan J. Green Chemistry Synthesis of Biocompatible ZnS Quantum Dots (QDs): Their Application as Potential Thin Films and Antibacterial Agent. Int. Nano Lett. 2019, 9, 149–159. 10.1007/s40089-019-0270-x. [DOI] [Google Scholar]
- De B.; Karak N. A. Green and Facile Approach for the Synthesis of Water Soluble Fluorescent Carbon Dots from Banana Juice. RSC Adv. 2013, 3, 8286–8290. 10.1039/c3ra00088e. [DOI] [Google Scholar]
- Shahshahanipour M.; Rezaei B.; Ensafi A. A.; Etemadifar Z. An Ancient Plant for the Synthesis of a Novel Carbon Dot and Its Applications as an Antibacterial Agent and Probe for Sensing of an Anti-Cancer Drug. Mater. Sci. Eng. C 2019, 98, 826–833. 10.1016/j.msec.2019.01.041. [DOI] [PubMed] [Google Scholar]
- Singh S.; Nigam P.; Pednekar A.; Mukherjee S.; Mishra A. Carbon Quantum Dots Functionalized Agarose Gel Matrix for in Solution Detection of Nonylphenol. Environ. Technol. 2020, 41, 322–328. 10.1080/09593330.2018.1498133. [DOI] [PubMed] [Google Scholar]
- Wang K.; Liang L.; Xu J.; Li H.; Du M.; Zhao X.; Zhang D.; Feng H.; Fan H. Synthesis and Bacterial Inhibition of Novel Ag2S–N–CQD Composite Material. Chem. Pap. 2020, 74, 1517–1524. 10.1007/s11696-019-01006-2. [DOI] [Google Scholar]
- Li P.; Han F.; Cao W.; Zhang G.; Li J.; Zhou J.; Gong X.; Turnbull G.; Shu W.; Xia L.; Fang B.; Xing X.; Li B. Carbon Quantum Dots Derived from Lysine and Arginine Simultaneously Scavenge Bacteria and Promote Tissue Repair. Appl. Mater. Today 2020, 19, 100601 10.1016/j.apmt.2020.100601. [DOI] [Google Scholar]
- Mariselvam R.; Ranjitsingh A. J. A.; Padmalatha C.; Selvakumar P. M. Green Synthesis of Copper Quantum Dots Using Rubia Cardifolia Plant Root Extracts and Its Antibacterial Properties. J. Acad. Ind. Res. 2014, 3, 191–194. [Google Scholar]
- Sheik Mydeen S.; Raj Kumar R.; Kottaisamy M.; Vasantha V. S. Biosynthesis of ZnO Nanoparticles through Extract from Prosopis juliflora Plant Leaf: Antibacterial Activities and a New Approach by Rust-Induced Photocatalysis. J. Saudi Chem. Soc. 2020, 24, 393–406. 10.1016/j.jscs.2020.03.003. [DOI] [Google Scholar]


