

Abstract
The hypoxic microenvironment inside solid tumors, including hepatocellular carcinoma (HCC), is a major cause of tumor resistance to chemotherapy. The recently identified hypoxia‐inducible factor (HIF)‐2 executes the hypoxia response. Its expression feature and transcriptional targets indicate a possible dominance of HIF‐2 in regulating genes in HCC. The aim of the present study was to determine whether transfection of siRNA targeting HIF‐2α could enhance the efficacy of doxorubicin, the most commonly used drug in the treatment of HCC. Transfection of HIF‐2 siRNA into human HCC cells downregulated the expression of HIF‐2α, vascular endothelial growth factor (VEGF), transforming growth factor (TGF)‐α, and cyclin D1, but had little effect on the expression of HIF‐1α, fms‐related tyrosine kinase‐1 (Flt‐1), the glucose transporter (GLUT)‐1, and lactate dehydrogenase A (LDHA). Doxorubicin itself only downregulated VEGF expression. Furthermore, HIF‐2 siRNA inhibited proliferation, induced cell cycle arrest at the G0/G1 phase, and acted synergistically with doxorubicin to inhibit the growth of human HCC cells in vitro. Transfection of HIF‐2 siRNA also downregulated tumoral expression of HIF‐2α, VEGF, TGF‐α, and cyclin D1 in vivo, and acted synergistically with doxorubicin to suppress the growth of HepG2 tumors established in immunodeficient mice by inhibiting cell proliferation, tumor angiogenesis and microvessel perfusion. The results of the present study suggest that targeting HIF‐2α with siRNA warrants investigation as a potential strategy to enhance the efficacy of doxorubicin in the treatment of HCC. (Cancer Sci 2012; 103: 528–534)
Liver cancer is the second most frequent cause of cancer deaths in men worldwide, with hepatocellular carcinoma (HCC) accounting for 70–85% of the total liver cancer burden.( 1 ) A recent investigation has shown that none of the currently available adjuvant therapies is particularly effective in treating HCC after surgery,( 2 ) indicating that current modalities are largely inadequate. Sorafenib is a unique first‐line drug recommended for HCC patients who are resistant to other therapies,( 3 ) but it has not been widely accepted because its cost is prohibitive, particularly in Asia and sub‐Saharan Africa, which have the highest incidence of HCC.( 1 ) Doxorubicin is the most commonly used traditional chemotherapeutic drug for the treatment of HCC, especially via transcatheter arterial chemoembolization (TACE).( 3 ) Unfortunately, in a clinical trial in a large number of HCC patients, systemic administration of doxorubicin resulted in a very low response rate (4%).( 4 ) Therefore, new strategies to enhance the efficacy of doxorubicin for the treatment of HCC are required.
The frequently observed hypoxic microenvironment inside solid tumors orchestrates a wide spectrum of molecular pathways that frustrate therapy, and is a major cause of tumor resistance to radiotherapy and chemotherapy.( 5 ) The hypoxic response is governed by hypoxia‐inducible factors (HIFs), each of which is a heterodimer composed of an α‐ and β‐subunit.( 6 ) The first of these factors identified, namely HIF‐1, controls the expression of hundreds of genes,( 5 , 7 ) including vascular endothelial growth factor (VEGF),( 8 ) glycolytic enzymes, and glucose transporters (GLUTs).( 9 ) It has been shown that HIF‐1‐deficient hepatoma cells( 10 ) are more susceptible to radiotherapy and that inhibition of HIF‐1α reduces the migration and invasion of HCC Hep3B cells.( 11 ) In addition, antisense HIF‐1α therapy enhances the efficacy of doxorubicin in the treatment of HCC.( 12 )
A new, recently identified member of the HIF family is HIF‐2, which has been implicated in executing the hypoxia response.( 13 , 14 ) Both HIF‐1α and HIF‐2α are able to complex with HIF‐1β to form a heterodimer and are degraded in an oxygen‐dependent manner through the von Hippel‐Lindau protein (pVHL) pathway.( 15 ) Like HIF‐1, HIF‐2 is a transcription factor that binds hypoxia‐response elements (HREs) in the promoters of targeted genes.( 15 ) Although HIF‐1α is expressed ubiquitously, HIF‐2α is only expressed by certain types of cells, including hepatocytes( 16 , 17 , 18 ) and certain tumors.( 19 ) Although HIF‐1 and HIF‐2 share several common targets, such as VEGF, they regulate distinct transcriptional targets. For example, HIF‐1, but not HIF‐2, is responsible for the regulation of genes encoding glycolytic enzymes,( 20 ) whereas the erythropoietin in livers is preferentially regulated by HIF‐2.( 21 ) The expression of angiogenic genes in hepatocytes is predominantly regulated by HIF‐2,( 22 ) suggesting possible HIF‐2 dominance in regulating angiogenesis in HCC. Indeed, inactivation of HIF‐2α suppressed the development of von Hippel‐Lindau (VHL)‐associated liver hemangiomas( 22 ) and downregulating HIF‐2 improved tumor response to sunitinib in colon cancer.( 23 ) Together, these results indicate that HIF‐2α may be a potential target in the treatment of HCC. Therefore, the aim of the present study was to investigate whether downregulating HIF‐2α by siRNA could enhance the efficacy of doxorubicin to combat HCC.
Materials and Methods
Mice, cell line and antibodies. Male nude BALB/c mice (H‐2b), 6–8 weeks old, were obtained from the Animal Research Center, The First Affiliated Hospital of Harbin Medical University, Harbin, China. Human HCC HepG2 and Hep3B cells were obtained from the American Type Culture Collection (Rockville, MD, USA). Cells were cultured at 37°C in DMEM (Gibco BRL, Grand Island, NY, USA) supplemented with 10% FCS. The Abs used in the present study were: anti‐HIF‐1α and anti‐HIF‐2α (Boster Biological Technology, Wuhan, China); anti‐VEGF (Lab Vision, Fremont, CA, USA); anti‐fms‐related tyrosine kinase‐1 (Flt‐1) and anti‐CD31 (Pharmingen, San Diego, CA, USA); and anti‐Ki‐67, anti‐GLUT1, anti‐lactate dehydrogenase A (LDHA), anti‐cyclin D1 and anti‐transforming growth factor (TGF)‐α (Santa Cruz Biotechnology, Santa Cruz, CA, USA). Doxorubicin was purchased from Pharmacia (Milan, Italy).
Transfection of siRNAs. A double‐stranded siRNA (HIF‐2 siRNA; sense 5′‐GGUUUUGUUGCUAGCCCUU‐3′ and antisense 5′‐AAGGGCUAGCAACAAAACC‐3′; nucleotides [nt] 4246–4264 of HIF‐2α [NM_001430.4]) with two introduced thymidine residues at the 3′ end was designed.( 24 ) In addition, double‐stranded RNAs for TGF‐α (sense 5′‐CAUUUUAAUGACUGCCCAGA‐3′ and antisense 5′‐UCUGGGCAGUCAUUAAAAUG‐3′; nt 375–394 of cyclin D1 [NM_003236]) and cyclin D1 (sense 5′‐CAAGCUCAAGUGGAACCUG‐3′ and antisense 5′‐CAGGUUCCACUUGAGCUUG‐3′; nt 791–809 of cyclin D1 [NM053056.1]) were designed.( 25 , 26 ) A non‐specific siRNA (sense 5′‐UUCUCCGAACGUGUCACGU‐3′ and antisense 5′‐ACGUGACACGUUCGGAGAA‐3′) served as the control. The siRNAs were produced by GenePharma (Shanghai, China). Cells were grown to 60–70% confluence and incubated with siRNAs (final concentration 0.1 μM) using Lipofectamine 2000 (Invitrogen, Beijing, China) in a serum‐free medium without antibiotic supplements for 24 h before being subjected to the assays detailed below.
Quantitative RT‐PCR analysis. Total RNA was extracted from cells and cDNA was synthesized by RT‐PCR using a cDNA synthesis kit (Invitrogen). The reaction mixtures for quantitative RT‐PCR were prepared according to the manual supplied by Shanghai GenePharma and were analyzed using an MX3000P real‐time PCR system (Stratagene, La Jolla, CA, USA). Experiments were performed in triplicate and the results were calculated using the ΔΔC t method. The primers used for PCR are given in Table 1.
Table 1.
Genes examined, primers used for RT‐PCR, and PCR products
| Gene | GenBank accession no. | Primers | PCR products |
|---|---|---|---|
| HIF‐1α | NM_181054.2 | Forward: ATCCATGTGACCATGAGGAAATG | 126 bp (nt 814–939) |
| Reverse: CTCGGCTAGTTAGGGTACACTT | |||
| HIF‐2α | NM_001430.4 | Forward: GTGCCATGACAAACATCTTCCAG | 107 bp (nt 2204–2310) |
| Reverse: CTCGGGCTCTGTCTTCTTGCT | |||
| VEGF | AF022375 | Forward: GTCCCAGGCTGCACCCATG | 158 bp (nt 522–679) |
| Reverse: AGGAAGCTCATCTCTCCTA | |||
| Flt‐1 | NM_001160031 | Forward: GTGCGCGCTGCTCAGCTG | 160 bp (nt 318–477) |
| Reverse: AGGCAAAGACCATTTATG | |||
| GLUT1 | K03195 | Forward: GAGTTCTACAACCAGACATGG | 167 bp (nt 302–468) |
| Reverse: GCATTGAATTCCGCCGGCCA | |||
| LDHA | X02152 | Forward: GCTGGTCATTATCACGGCTG | 128 bp (nt 361–488) |
| Reverse: AGCAACTTGCAGTTCGGGCTG | |||
| Cyclin D1 | NM_053056 | Forward: GCGCGCCCTCGGTGTCCTA | 159 bp (nt 322–480) |
| Reverse: GCGACAGGAAGCGGTCCAGG | |||
| TGF‐α | NM_003236 | Forward: GCTGCGTGCCAGGCCTTGGAG | 163 bp (nt 257–419) |
| Reverse: ACATGCTGGCTTGTCCTCCTG |
In vitro cell proliferation and cell cycle assays. Cell viability was measured with a CCK‐8 kit (Dojindo Laboratories, Kumanoto, Japan), whereas the percentage of cells at the G0/G1, S, and G2/M phases was determined using a cell cycle detection kit (BD Biosciences, Beijing, China), as described previously.( 27 ) Experiments were repeated three times.
Animal experimental protocols. All surgical procedures and care administered to the animals were in accordance with institutional ethics guidelines. The subcutaneous HepG2 tumor model has been described previously.( 12 , 27 ) Briefly, when tumors reached approximately 100 mm3, mice were assigned to one of groups (10 mice in each group): a control group, a doxorubicin‐treated group, a group treated with HIF‐2 siRNA, and a group treated with HIF‐2 siRNA + doxorubicin. Mice in each group received twice weekly intratumoral and i.p. injections of agents. Doxorubicin was dissolved in 200 μL PBS and was injected at a dose of 12.5 mg/kg, i.p.( 12 , 27 ) Equal volumes of 20 nM siRNA and Lipofectamine 2000 were mixed, and this solution was further mixed with an equal volume of serum‐free medium, with 50 μL of the siRNA transfection solution containing 250 pmol siRNA injected into tumors.( 28 ) Mice in the control group were injected with PBS and control siRNA; mice in the doxorubicin group were injected with doxorubicin and control siRNA; mice in the HIF‐2 siRNA group were injected with PBS and HIF‐2 siRNA; and mice in the HIF‐2 siRNA + doxorubicin group were injected with doxorubicin and HIF‐2 siRNA. Two mice from each group were selected at random and killed 4 days after treatment started. The tumors in these mice were excised for analysis. The remaining eight mice in each group were monitored for a further 17 days and then killed. Three mice per group were used for to analyze tumor microvessel perfusion, whereas tumors from the remaining five mice were used to assess cell proliferation and tumor vascularity.
Immunohistochemistry, assessment of tumor vascularity, quantification of Ki‐67 proliferation index and western blot analysis. All these methods have been described in detail elsewhere.( 12 , 27 , 28 )
Tumor microvessel perfusion. Mice bearing tumors were injected with 40 mg/kg, i.v., Hoechst 33342 (Sigma‐Aldrich, Beijing, China) 2 min before they were killed. The tumors were excised, five frozen sections (10 μm) from each tumor were prepared, and five randomly selected fields from each section were examined under a fluorescence microscope (thus 20 fields were examined in total for each tumor). Images were capture and quantified using Adobe Photoshop CS4 (Adobe, San José, CA, USA). The relative perfusion area (%) was calculated as follows:
Relative perfusion area (%) = (Sum of perfusion areas/20 field areas) × 100.
Statistical analysis. Data are expressed as the mean ± SD. Comparisons were made using one‐way analysis of variance (anova) followed by Dunnet’s t‐test. P < 0.05 was considered significant.
Results
Regulation by HIF‐2 siRNA of the expression of genes involved in angiogenesis and cell growth. Incubation of HepG2 cells with CoCl2 (200 μM) for 24 h resulted in significantly higher levels of HIF‐2α and HIF‐1α (by 15‐ and 50‐fold, respectively) compared with control (Fig. 1A). This is explained by the rapid degradation of HIF‐α subunits under conditions of normoxia.( 15 ) In addition, siRNA‐transfected HepG2 cells were cultured in fresh medium containing 200 μM CoCl2 for 24 h. Transfection of HIF‐2 siRNA downregulated the mRNA expression of HIF‐2α, VEGF, TGF‐α, and cyclin D1, but had little effect on the expression of HIF‐1α, Flt‐1, GLUT1 and LDHA mRNA (Fig. 1B). Protein expression patterns, as determined using western blot analysis, were similar to the mRNA expression patterns (Fig. 1C,D).
Figure 1.
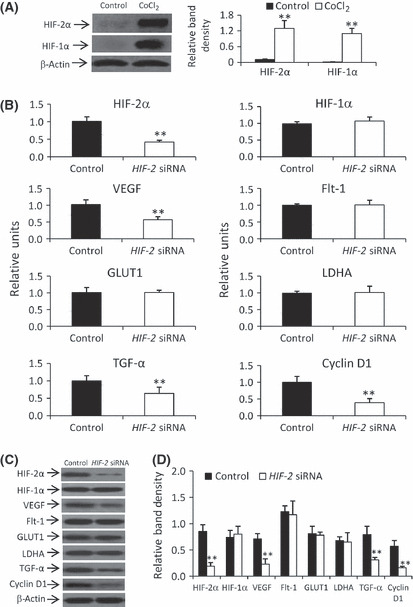
Downregulating gene expression by HIF‐2 siRNA in HepG2 cells in vitro. (A) Cells were incubated in the presence or absence of CoCl2 for 24 h and the expression of hypoxia‐inducible factor (HIF)‐1α and HIF‐2α was determined by western blot analysis and normalized against that of β‐actin. (B–D) Control or HIF‐2 siRNA‐transfected cells were incubated for 24 h in the presence of CoCl2 and harvested for mRNA analysis by quantitative RT‐PCR (B) or protein expression by western blot analysis (C). (D) The density of each band in (C) was measured and normalized against that of β‐actin. Data are the mean ± SD. **P < 0.001 compared with control. VEGF, vascular endothelial growth factor; Flt‐1, fms‐related tyrosine kinase‐1; GLUT1, glucose transporter 1; LDHA, lactate dehydrogenase A; TGF‐α, transforming growth factor‐α.
Synergistic effect of HIF‐2 siRNA and doxorubicin to inhibit HCC cell growth in vitro. There were no significant differences in the proliferation index of HepG2 cells transfected with either HIF‐2 or control siRNA when cells were cultured under normoxic conditions (Fig. 2A). However, under hypoxic conditions induced by CoCl2, HIF‐2 siRNA‐transfected cells grew significantly more slowly than those transfected with control siRNA (Fig. 2A). Therefore, subsequent in vitro experiments were performed under hypoxic conditions. Under hypoxia, doxorubicin inhibited cell proliferation in a dose‐dependent manner and significantly reduced the proliferation index of HIF‐2 siRNA‐transfected cells compared with control siRNA‐transfected or untransfected cells (Fig. 2B). To investigate whether the effects of HIF‐2 siRNA and doxorubicin were synergistic, we calculated values for the coefficient of drug interaction (CDI).( 29 , 30 ) All CDI values for various concentrations of doxorubicin were <1 (Fig. 2B), indicating a synergistic effect between HIF‐2 siRNA and doxorubicin in inhibiting cell proliferation. The optimal synergistic concentration of doxorubicin was 80 ng/mL, which resulted in a CDI value of 0.72. This concentration of doxorubicin was used in subsequent experiments with HepG2 cells. The effects of HIF‐2 siRNA and doxorubicin were also evaluated in Hep3B cells, which exhibited a similar pattern of protein expression after HIF‐2 siRNA transfection (data not shown) as did HepG2 cells. Although Hep3B cells were not as sensitive as HepG2 cells to doxorubicin, the effects of HIF‐2 siRNA plus doxorubicin on cell proliferation (Fig. 2C) were similar in Hep3B cells as seen in HepG2 cells. There were no significant differences in the proliferation index between control siRNA‐transfected and untransfected cells treated with doxorubicin; thus, data for the treatment of cells with control siRNA transfection + doxorubicin are not described below.
Figure 2.
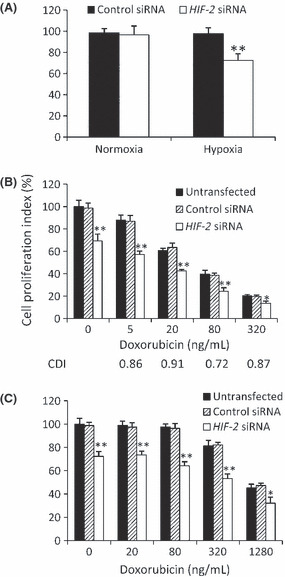
Cell proliferation in vitro. (A) HepG2 cells transfected with control or HIF‐2 siRNA were cultured in the absence (normoxia) or presence (hypoxia) of CoCl2 for 48 h. (B,C) Untransfected HepG2 (B) or Hep3B (C) cells or cells transfected with control or HIF‐2 siRNA were incubated with doxorubicin in the presence of CoCl2 for 48 h. Data are the mean ± SD. *P < 0.05, **P < 0.001 compared with control siRNA.
Following HIF‐2 siRNA transfection, there was a significant increase in the percentage of HepG2 cells arrested at the G0/G1 phase compared with transfection of control siRNA (Fig. 3A). Doxorubicin significantly increased the percentage of HepG2 cells arrested at G2/M phase (Fig. 3B). However, the combination of HIF‐2 siRNA plus doxorubicin increased the percentage of HepG2 cells arrested at both the G0/G1 and G2/M phases compared with that of untreated cells (Fig. 3B). The effects of HIF‐2 siRNA and doxorubicin on cell cycle arrest were similar in Hep3B cells (Fig. 3C).
Figure 3.
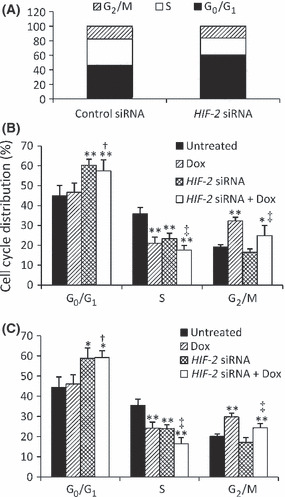
Cell cycle arrest in vitro. (A) Control or HIF‐2 siRNA‐transfected HepG2 cells were cultured in the presence of CoCl2 for 48 h. (B,C) Untransfected HepG2 (B) or Hep3B (C) cells or cells transfected with control or HIF‐2 siRNA were incubated with 80 or 500 ng/mL doxorubicin (Dox), respectively, in the presence of CoCl2 for 48 h. Data are the mean ± SD. *P < 0.05, **P < 0.001 compared with untreated cells; †P < 0.05 compared with Dox‐treated cells; ‡P < 0.05 compared with HIF‐2 siRNA‐treated cells.
Regulation of gene expression by HIF‐2 siRNA and doxorubicin. Transfection of HIF‐2 siRNA significantly reduced the expression of HIF‐2α, TGF‐α and cyclin D1 in HepG2 cells, whereas doxorubicin had little effect (Fig. 4A,B). Both HIF‐2 siRNA and doxorubicin significantly downregulated the expression of VEGF, and their combination further reduced its expression (Fig. 4A,B). Furthermore, transfection of TGF‐α and cyclin D1 siRNAs significantly downregulated the expression of their respective genes (Fig. 4C) and inhibited cell proliferation (Fig. 4D). Transfection of TGF‐α siRNA decreased the percentage of cells in the S phase, whereas cyclin D1 siRNA induced cell arrest at the G0/G1 phase (Fig. 4E).
Figure 4.
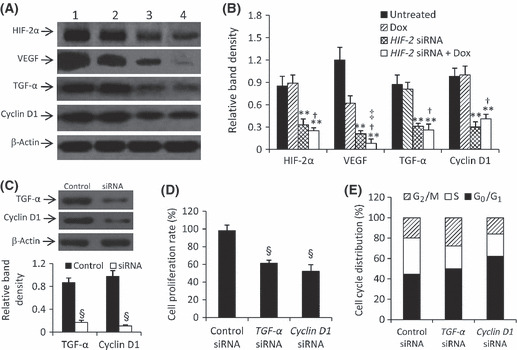
Gene expression and effects of downregulating downstream genes. (A) Untreated HepG2 cells (lane 1) or cells treated with doxorubicin (Dox; lane 2), HIF‐2 siRNA (lane 3) or HIF‐2 siRNA + Dox (lane 4; from Fig. 3B) were subjected to western blot analysis. (B) The density of each band in (A) was measured and normalized against that of β‐actin. Data are the mean ± SD. *P < 0.05, **P < 0.001 compared with untreated cells; †P < 0.05 compared with Dox‐treated cells; ‡P < 0.05 compared with HIF‐2 siRNA‐treated cells. (C–E) Control siRNA, transforming growth factor (TGF)‐α siRNA or Cyclin D1 siRNA‐transfected HepG2 cells were cultured in the presence of CoCl2 for 48 h; the expression of TGF‐α and Cyclin D1 was determined by western blot analysis (C), with band density normalized against that of β‐actin, and cell proliferation (D) and cell cycle distribution (E) were measured. Data are the mean ± SD. §P < 0.001 compared with control.
Inhibition of tumor growth by downregulation of gene expression in vivo. As shown in Figure 5(A), tumors in the control group grew remarkably fast, reaching 2247.8 ± 158.7 mm3 in only 3 weeks. In contrast, tumors treated with HIF‐2 siRNA and doxorubicin were significantly smaller than the tumors in the control group, reaching only 1648.8 ± 139.1 and 1059.9 ± 153.5 mm3, respectively (both P < 0.01). The combination of HIF‐2 siRNA and doxorubicin further suppressed tumor growth such that tumors in these mice reached only 659.8 ± 167.8 mm3, significantly smaller than tumors in both the control group (P < 0.001) and in the groups treated with HIF‐2 siRNA or doxorubicin alone (both P < 0.05). The CDI was 0.81, indicating that HIF‐2 siRNA and doxorubicin had significant synergistic effects in suppressing tumor growth.
Figure 5.
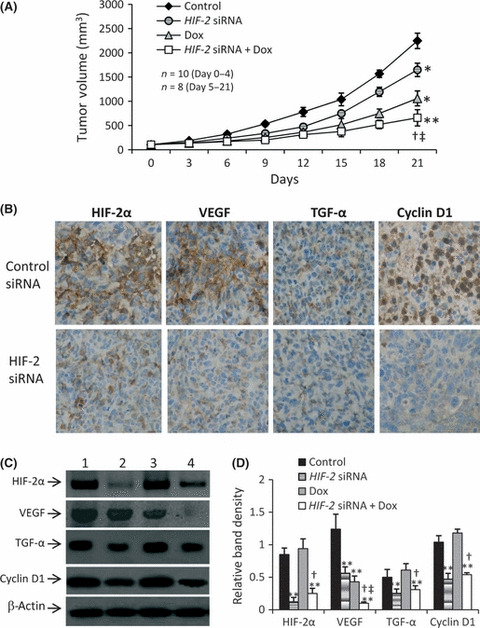
Tumor growth and gene expression in vivo. (A) Tumor size in the control, doxorubicin‐ (Dox), HIF‐2 siRNA‐ and HIF‐2 siRNA + Dox‐treated groups for n mice in each group at the different time points. (B) Representative sections of tumors injected with control siRNA or HIF‐2 siRNA and stained brown with Abs against hypoxia‐inducible factor (HIF)‐2α, vascular endothelial growth factor (VEGF), transforming growth factor (TGF)‐α, or cyclin D1 (original magnification ×400). (C) Tumor homogenates from the control (lane 1), HIF‐2 siRNA (lane 2), doxorubicin (lane 3) and HIF‐2 siRNA + doxorubicin (lane 4) groups were subjected to western blot analysis to determine the expression of HIF‐2α, VEGF, TGF‐α and cyclin D1. (D) The density of each band was normalized against that of β‐actin. Data are the mean ± SD. *P < 0.05, **P < 0.001 compared with untreated cells; †P < 0.05 compared with Dox‐treated cells; ‡P < 0.05 compared with HIF‐2 siRNA‐treated cells.
Consistent with the results obtained in vitro, injection of HIF‐2 siRNA significantly downregulated the expression of HIF‐2α, VEGF, TGF‐α and cyclin D1, whereas doxorubicin only downregulated the expression of VEGF (Fig. 5B–D). Combination treatment with HIF‐2 siRNA plus doxorubicin further downregulated the expression of VEGF, resulting in significantly lower levels of VEGF expression than seen following treatment with HIF‐2 siRNA or doxorubicin alone (Fig. 5C,D).
Inhibition of cell proliferation in situ. Both HIF‐2 siRNA‐ and doxorubicin‐treated tumors had fewer Ki‐67‐positive cells than did the controls, and HIF‐2 siRNA + doxorubicin‐treated tumors had even fewer Ki‐67‐positive cells than tumors treated with HIF‐2 siRNA or doxorubicin alone (Fig. 6A). Tumors treated with HIF‐2 siRNA or doxorubicin had a significantly lower proliferation index that the control group (by 23% and 42%, respectively; P < 0.05; Fig. 6B). Tumors treated with HIF‐2 siRNA + doxorubicin had a significantly lower proliferation index than the control group and than the groups treated with HIF‐2 siRNA or doxorubicin alone (by 71% [P < 0.001), 63% and 51% [both P < 0.01], respectively; Fig. 6B).
Figure 6.
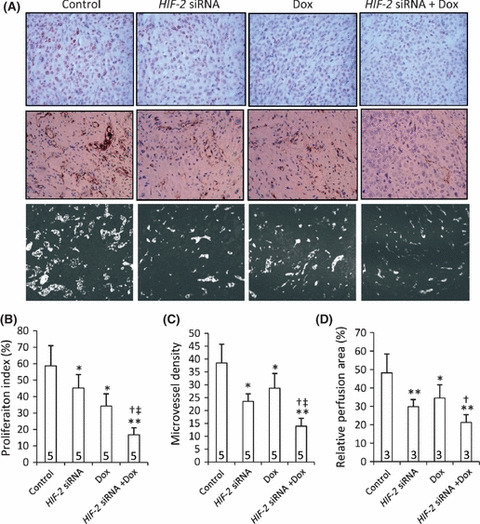
Tumoral cell proliferation, angiogenesis and microvessel perfusion. (A) Representative tumor sections prepared 3 weeks after treatment (from Fig. 5) and stained with an anti‐Ki‐67 Ab (upper panel) or an anti‐CD31 Ab (middle panel), or prepared from mice preinjected with Hoechst 33342 (represented by light‐colored regions). The proliferation index (B), microvessel density (C), and microvessel perfusion area (D) were determined for each group. Dox, doxorubicin. Data are the mean ± SD, with the number of samples indicated by the numbers at the bottom of each column. *P < 0.05, **P < 0.001 compared with untreated cells; †P < 0.05 compared with Dox‐treated cells; ‡P < 0.05 compared with HIF‐2 siRNA‐treated cells.
Inhibition of tumoral angiogenesis and microvessel perfusion. Both HIF‐2 siRNA‐ and doxorubicin‐treated tumors had fewer microvessels than did the control group, and HIF‐2 siRNA + doxorubicin‐treated tumors had even fewer microvessels than tumors treated with HIF‐2 siRNA or doxorubicin alone (Fig. 6A). Treatment with HIF‐2 siRNA or doxorubicin resulted in a significant reduction in microvessel density compared with the control group (by 39% [P < 0.01] and 25% [P < 0.05], respectively; Fig. 6C). Furthermore, tumors treated with HIF‐2 siRNA + doxorubicin exhibited a highly significant reduction in microvessel density compared with the control group (by 64%; P < 0.001), as well as a significant reduction in microvessel density compared with groups treated with HIF‐2 siRNA or doxorubicin alone (both P < 0.05; Fig. 6C).
Microvessel perfusion areas were evaluated in tumors stained with Hoechst 33342 (Fig. 6A,D). In tumors treated with HIF‐2 siRNA or doxorubicin, a significant reduction in microvessel perfusion areas was observed compared with the control group (by 38% and 28%, respectively; both P < 0.05). Combination treatment with HIF‐2 siRNA + doxorubicin resulted in significant reductions in the microvessel perfusion areas compared with both the control group (by 56%; P < 0.001) and the doxorubicin‐treated group (by 38%; P < 0.05). However, there was no significant difference in microvessel perfusion areas between the HIF‐2 siRNA + doxorubicin‐ and HIF‐2 siRNA‐treated groups (Fig. 6D).
Discussion
The hypoxic microenvironment inside solid tumors is a major cause of tumor resistance to chemotherapy.( 5 ) Because it regulates a wide range of hypoxia‐related molecules, HIF‐1 has been regarded as central to the hypoxia response.( 7 ) The recently identified HIF‐2 has emerged as another attractive target for combating the resistance of HCC to chemotherapy because it is specifically expressed in certain cell types, including hepatocytes, and has distinct transcriptional targets in certain organs, including the liver.( 21 , 22 ) It has been shown that HIF‐2 is commonly overexpressed in human HCC specimens,( 19 , 31 ) and that its expression is correlated with clinicopathological features and poor clinical outcome.( 5 , 19 , 31 ) In the present study, we have demonstrated that HIF‐2 siRNA exerts its antitumor effect by downregulating the expression of HIF‐2α, VEGF, TGF‐α, and cyclin D1, resulting in inhibition of cell proliferation, tumor angiogenesis, and microvessel perfusion. These effects work synergistically with those of doxorubicin to suppress tumor growth. Doxorubicin also downregulated expression of VEGF, but had negligible effects on the expression of HIF‐2α, TGF‐α, and cyclin D1. The anti‐angiogenic activity of HIF‐2 siRNA is supported by a study showing that HIF‐2α promotes vascular function and angiogenesis.( 32 )
It is well documented that doxorubicin exerts its antitumor activity by inhibiting the proliferation of HCC cells.( 33 , 34 ) In the present study we showed that HIF‐2 siRNA synergizes with doxorubicin to inhibit the proliferation of HCC cells. One of the mechanisms that may account for this is the ability of HIF‐2 siRNA to downregulate the expression of TGF‐α, which is among one of the predominant targets of HIF‐2α.( 14 , 35 ) Overexpression of TGF‐α is especially common in human liver cancer( 36 , 37 ) and activation of the TGF‐α pathway promotes HCC formation.( 38 ) Furthermore, TGF‐α treatment increases the proliferation of HepG2 cells in vitro.( 39 ) In accord, the present study has shown that downregulating TGF‐α by siRNA inhibits the proliferation of HepG2 cells.
Cyclin D1 plays an important role during the G1 phase of the cell cycle and is essential for the G1/S transition.( 40 ) Cyclin D1 is overexpressed in HCC tissues( 41 ) and is specifically regulated by HIF‐2α.( 14 ) In the present study we have shown that downregulating cyclin D1 by targeting its upstream regulator HIF‐2α or directly with an siRNA induces the arrest of HCC cells at the G0/G1 phase. Conversely, doxorubicin‐induced DNA damage is predominantly cell cycle dependent and results in G2/M phase arrest.( 42 , 43 ) In accordance with our previous report,( 28 ) in the present study we showed that doxorubicin induced cell cycle arrest at the G2/M phase in HCC cells. Furthermore, combining HIF‐2 siRNA plus doxorubicin resulted in cell cycle arrest at both the G0/G1 and G2/M phases, contributing to the inhibition of cell proliferation.
Although not investigated herein, enhanced cell apoptosis may also contribute to the inhibition of tumor growth. Many studies have shown that doxorubicin induces the apoptosis of HCC cells, including our own study.( 12 ) By inhibiting tumoral angiogenesis, HIF‐2 siRNA and doxorubicin restrict the supply of tumor cell survival factors, including VEGF,( 44 ) and without persistent angiogenesis tumor cells will undergo apoptosis.( 45 ) Conversely, glycolysis contributes nearly half the ATP for cancer cells in the presence of oxygen( 46 ) and is the main energy‐providing form under conditions of hypoxia. It has been shown that HIF‐1 controls the expression of key glycolysis factors( 47 ) and HIF‐1‐regulated glucose metabolism is regarded as a key factor in apoptosis resistance.( 8 ) Disruption of HIF‐1α impaired aerobic glycolysis in human colon carcinoma HCT116 cells( 48 ) and downregulated the expression of GLUT1 and LDHA in HepG2 cells.( 12 ) However, HIF‐2 siRNA did not downregulate LDHA and GLUT1, indicating that HIF‐2 does not regulate these two factors in HCC cells. It has been reported that HIF‐1, but not HIF‐2, is responsible for the regulation of genes encoding glycolytic enzymes.( 20 ) Given the distinct transcriptional targets of HIF‐1 and HIF‐2, the results imply that downregulating both these HIFs may further block hypoxic pathways and result in better therapeutic outcomes when combined with doxorubicin. This hypothesis is supported by one report, in which simultaneous inhibition of HIF‐1 and HIF‐2 improved the response of colon cancer cells to sunitinib.( 23 )
Disclosure Statement
The authors have no conflict of interest.
Acknowledgment
This work was supported, in part, by grants from the National Natural Scientific Foundation of China (30872987, 30973474, and 30972938).
References
- 1. Jemal A, Bray F, Center MM, Ferlay J, Ward E, Forman D. Global cancer statistics. CA Cancer J Clin 2011; 61: 69–90. [DOI] [PubMed] [Google Scholar]
- 2. Samuel M, Chow PK, Chan Shih‐Yen E, Machin D, Soo KC. Neoadjuvant and adjuvant therapy for surgical resection of hepatocellular carcinoma. Cochrane Database Syst Rev 2009; 21: CD001199. [DOI] [PMC free article] [PubMed] [Google Scholar]
- 3. Bruix J, Sherman M. Management of hepatocellular carcinoma: an update. Hepatology 2011; 53: 1020–2. [DOI] [PMC free article] [PubMed] [Google Scholar]
- 4. Gish RG, Porta C, Lazar L et al. Phase III randomized controlled trial comparing the survival of patients with unresectable hepatocellular carcinoma treated with nolatrexed or doxorubicin. J Clin Oncol 2007; 25: 3069–75. [DOI] [PubMed] [Google Scholar]
- 5. Rankin EB, Giaccia AJ. The role of hypoxia‐inducible factors in tumorigenesis. Cell Death Differ 2008; 15: 678–85. [DOI] [PMC free article] [PubMed] [Google Scholar]
- 6. Yamashita T, Ohneda K, Nagano M et al. Hypoxia‐inducible transcription factor‐2α in endothelial cells regulates tumor neovascularization through activation of ephrin A1. J Biol Chem 2008; 283: 18926–36. [DOI] [PubMed] [Google Scholar]
- 7. Semenza GL. Life with oxygen. Science 2007; 318: 62–4. [DOI] [PubMed] [Google Scholar]
- 8. Fulda S, Debatin KM. HIF‐1‐regulated glucose metabolism: a key to apoptosis resistance? Cell Cycle 2007; 6: 790–2. [DOI] [PubMed] [Google Scholar]
- 9. Semenza GL, Jiang BH, Leung SW et al. Hypoxia response elements in the aldolase A, enolase 1, and lactate dehydrogenase A gene promoters contain essential binding sites for hypoxia‐inducible factor 1. J Biol Chem 1996; 271: 32529–37. [DOI] [PubMed] [Google Scholar]
- 10. Williams KJ, Telfer BA, Xenaki D et al. Enhanced response to radiotherapy in tumours deficient in the function of hypoxia‐inducible factor‐1. Radiother Oncol 2005; 75: 89–98. [DOI] [PubMed] [Google Scholar]
- 11. Shin DH, Kim JH, Jung YJ et al. Preclinical evaluation of YC‐1, a HIF inhibitor, for the prevention of tumor spreading. Cancer Lett 2007; 255: 107–16. [DOI] [PubMed] [Google Scholar]
- 12. Liu F, Wang P, Jiang X et al. Antisense hypoxia‐inducible factor 1α gene therapy enhances the therapeutic efficacy of doxorubicin to combat hepatocellular carcinomas. Cancer Sci 2008; 99: 2055–61. [DOI] [PMC free article] [PubMed] [Google Scholar]
- 13. Covello KL, Kehler J, Yu H et al. HIF‐2alpha regulates Oct‐4: effects of hypoxia on stem cell function, embryonic development, and tumor growth. Genes Dev 2006; 20: 557–70. [DOI] [PMC free article] [PubMed] [Google Scholar]
- 14. Raval RR, Lau KW, Tran MG et al. Contrasting properties of hypoxia‐inducible factor 1 (HIF‐1) and HIF‐2 in von Hippel‐Lindau‐associated renal cell carcinoma. Mol Cell Biol 2005; 25: 5675–86. [DOI] [PMC free article] [PubMed] [Google Scholar]
- 15. Loboda A, Jozkowicz A, Dulak J. HIF‐1 and HIF‐2 transcription factors: similar but not identical. Mol Cell 2010; 29: 435–42. [DOI] [PubMed] [Google Scholar]
- 16. Flamme I, Fröhlich T, von Reutern M, Kappel A, Damert A, Risau W. HRF, a putative basic helix‐loop‐helix‐PAS‐domain transcription factor is closely related to hypoxia‐inducible factor‐1 alpha and developmentally expressed in blood vessels. Mech Dev 1997; 63: 51–60. [DOI] [PubMed] [Google Scholar]
- 17. Wiesener MS, Jürgensen JS, Rosenberger C et al. Widespread hypoxia‐inducible expression of HIF‐2alpha in distinct cell populations of different organs. FASEB J 2003; 17: 271–3. [DOI] [PubMed] [Google Scholar]
- 18. Chavez JC, Baranova O, Lin J, Pichiule P. The transcriptional activator hypoxia inducible factor 2 (HIF‐2/EPAS‐1) regulates the oxygen‐dependent expression of erythropoietin in cortical astrocytes. J Neurosci 2006; 26: 9471–81. [DOI] [PMC free article] [PubMed] [Google Scholar]
- 19. Talks KL, Turley H, Gatter KC et al. The expression and distribution of the hypoxia‐inducible factors HIF‐1alpha and HIF‐2alpha in normal human tissues, cancers, and tumor‐associated macrophages. Am J Pathol 2000; 157: 411–21. [DOI] [PMC free article] [PubMed] [Google Scholar]
- 20. Hu CJ, Wang LY, Chodosh LA, Keith B, Simon MC. Differential roles of hypoxia‐inducible factor 1alpha (HIF‐1alpha) and HIF‐2alpha in hypoxic gene regulation. Mol Cell Biol 2003; 23: 9361–74. [DOI] [PMC free article] [PubMed] [Google Scholar]
- 21. Rankin EB, Biju MP, Liu Q et al. Hypoxia‐inducible factor‐2 (HIF‐2) regulates hepatic erythropoietin in vivo . J Clin Invest 2007; 117: 1068–77. [DOI] [PMC free article] [PubMed] [Google Scholar]
- 22. Rankin EB, Rha J, Unger TL et al. Hypoxia‐inducible factor‐2 regulates vascular tumorigenesis in mice. Oncogene 2008; 27: 5354–8. [DOI] [PMC free article] [PubMed] [Google Scholar]
- 23. Burkitt K, Chun SY, Dang DT, Dang LH. Targeting both HIF‐1 and HIF‐2 in human colon cancer cells improves tumor response to sunitinib treatment. Mol Cancer Ther 2009; 8: 1148–56. [DOI] [PubMed] [Google Scholar]
- 24. Franovic A, Gunaratnam L, Smith K, Robert I, Patten D, Lee S. Translational up‐regulation of the EGFR by tumor hypoxia provides a nonmutational explanation for its overexpression in human cancer. Proc Natl Acad Sci USA 2007; 104: 13092–7. [DOI] [PMC free article] [PubMed] [Google Scholar]
- 25. Ui‐Tei K, Naito Y, Takahashi F et al. Guidelines for the selection of highly effective siRNA sequences for mammalian chick RNA interference. Nucleic Acids Res 2004; 32: 936–48. [DOI] [PMC free article] [PubMed] [Google Scholar]
- 26. Ouyang W, Ma Q, Li J et al. Cyclin D1 induction through IkappaB kinase beta/nuclear factor‐kappaB pathway is responsible for arsenite‐induced increased cell cycle G1–S phase transition in human keratinocytes. Cancer Res 2005; 65: 9287–93. [DOI] [PubMed] [Google Scholar]
- 27. Wang J, Ma Y, Jiang H et al. Overexpression of von Hippel‐Lindau enhances the efficacy of doxorubicin to suppress hepatocellular carcinoma by downregulating HIFα and inhibiting NF‐κB activity in mice. J Hepatol 2011; 55: 359–68. [DOI] [PubMed] [Google Scholar]
- 28. Kong R, Sun B, Jiang H et al. Downregulation of nuclear factor‐κB P65 subunit by small interfering RNA synergizes with gemcitabine to treat pancreatic cancer. Cancer Lett 2010; 291: 90–8. [DOI] [PubMed] [Google Scholar]
- 29. Mai Z, Blackburn GL, Zhou JR. Soy phytochemicals synergistically enhance the preventive effect of tamoxifen on the growth of estrogen‐dependent human breast carcinoma in mice. Carcinogenesis 2007; 28: 1217–23. [DOI] [PMC free article] [PubMed] [Google Scholar]
- 30. Wang D, Wang Z, Tian B, Li X, Li S, Tian Y. Two hour exposure to sodium butyrate sensitizes bladder cancer to anticancer drugs. Int J Urol 2008; 15: 435–41. [DOI] [PubMed] [Google Scholar]
- 31. Bangoura G, Yang LY, Huang GW, Wang W. Expression of HIF‐2a/EPAS1 in hepatocellular carcinoma. World J Gastroenterol 2004; 10: 525–30. [DOI] [PMC free article] [PubMed] [Google Scholar]
- 32. Skuli N, Liu L, Runge A et al. Endothelial deletion of hypoxia‐inducible factor‐2alpha (HIF‐2alpha) alters vascular function and tumor angiogenesis. Blood 2009; 114: 469–77. [DOI] [PMC free article] [PubMed] [Google Scholar]
- 33. Chuu JJ, Liu JM, Tsou MH et al. Effects of paclitaxel and doxorubicin in histocultures of hepatocelular carcinomas. J Biomed Sci 2007; 14: 233–44. [DOI] [PubMed] [Google Scholar]
- 34. Sutter AP, Maaser K, Grabowski P et al. Peripheral benzodiazepine receptor ligands induce apoptosis and cell cycle arrest in human hepatocellular carcinoma cells and enhance chemosensitivity to paclitaxel, docetaxel, doxorubicin and the Bcl‐2 inhibitor HA14–1. J Hepatol 2004; 41: 799–807. [DOI] [PubMed] [Google Scholar]
- 35. Löfstedt T, Fredlund E, Holmquist‐Mengelbier L et al. Hypoxia inducible factor‐2alpha in cancer. Cell Cycle 2007; 6: 919–26. [DOI] [PubMed] [Google Scholar]
- 36. Breuhahn K, Longerich T, Schirmacher P. Dysregulation of growth factor signaling in human hepatocellular carcinoma. Oncogene 2006; 25: 3787–800. [DOI] [PubMed] [Google Scholar]
- 37. Calvisi DF, Ladu S, Gorden A et al. Ubiquitous activation of Ras and Jak/Stat pathways in human HCC. Gastroenterology 2006; 130: 1117–28. [DOI] [PubMed] [Google Scholar]
- 38. Jhappan C, Stahle C, Harkins RN, Fausto N, Smith GH, Merlino GT. TGF alpha overexpression in transgenic mice induces liver neoplasia and abnormal development of the mammary gland and pancreas. Cell 1990; 61: 1137–46. [DOI] [PubMed] [Google Scholar]
- 39. Baek JY, Morris SM, Campbell J, Fausto N, Yeh MM, Grady WM. TGF‐beta inactivation and TGF‐alpha overexpression cooperate in an in vivo mouse model to induce hepatocellular carcinoma that recapitulates molecular features of human liver cancer. Int J Cancer 2010; 127: 1060–71. [DOI] [PMC free article] [PubMed] [Google Scholar]
- 40. Malumbres M, Barbacid M. Cell cycle, CDKs and cancer: a changing paradigm. Nat Rev Cancer 2009; 9: 153–66. [DOI] [PubMed] [Google Scholar]
- 41. Parekh P, Rao KV. Overexpression of cyclin D1 is associated with elevated levels of MAP kinases, Akt and Pak1 during diethylnitrosamine‐induced progressive Liver carcinogenesis. Cell Biol Int 2007; 31: 35–43. [DOI] [PubMed] [Google Scholar]
- 42. Ling YH, el‐Naggar AK, Priebe W, Perez‐Soler R. Cell cycle dependent cytotoxicity,G2/M phase arrest,and disruption of p34cdc2/cyclin B1 activity induced by doxorubicin in synchronized p388 cells. Mol Pharmacol 1996; 49: 832–41. [PubMed] [Google Scholar]
- 43. Siu WY, Yam CH, Poon RY. G1 versus G2 cell cycle arrest after adriamycin‐induced damage in mouse Swiss 3T3 cells. FEBS Lett 1999; 461: 299–305. [DOI] [PubMed] [Google Scholar]
- 44. Byrne AM, Bouchier‐Hayes DJ, Harmey JH. Angiogenic and cell survival functions of vascular endothelial growth factor (VEGF). J Cell Mol Med 2005; 9: 777–94. [DOI] [PMC free article] [PubMed] [Google Scholar]
- 45. Qin J, Chen X, Xie X, Tsai MJ, Tsai SY. COUP‐TFII regulates tumor growth and metastasis by modulating tumor angiogenesis. Proc Natl Acad Sci USA 2010; 107: 3687–92. [DOI] [PMC free article] [PubMed] [Google Scholar]
- 46. Pedersen PL. The cancer cell’s “power plants” as promising therapeutic targets: an overview. J Bioenerg Biomembr 2007; 39: 1–12. [DOI] [PubMed] [Google Scholar]
- 47. Koukourakis MI, Giatromanolaki A, Harris AL, Sivridis E. Comparison of metabolic pathways between cancer cells and stromal cells in colorectal carcinomas: a metabolic survival role for tumor‐associated stroma. Cancer Res 2006; 66: 632–7. [DOI] [PubMed] [Google Scholar]
- 48. Dang DT, Chen F, Gardner LB et al. Hypoxia‐inducible factor‐1α promotes nonhypoxia‐mediated proliferation in colon cancer cells and xenografts. Cancer Res 2006; 66: 1684–936. [DOI] [PubMed] [Google Scholar]