Abstract
Multicellular tumor spheroids (MTS) are gaining increased recognition as valuable tools and key elements in anticancer drug discovery and tumor therapy test programs. However, the lack of reproducible and uniform MTS sizes is a major problem for pharmaceutical assays. Here, we show the usefulness of duplex microcapsules with a Ca‐alginate gel membrane as a platform for producing MTS with a highly homogeneous size distribution. HeLa cells were enclosed with 86.9% viability within the microcapsules. The enclosed cells grew and formed MTS with the same size as the cavity of the microcapsules by arresting their growth with the microcapsule membrane. The cells in the resultant MTS had a higher proportion in G0/G1 phase (71.2%) than 2‐D cultured cells in the stationary phase (64.3%) or those in MTS formed on a non‐adherent surface (65.3%) (P < 0.01). Furthermore, the cells in MTS formed within microcapsules showed higher tolerance to mitomycin C (1–1000 nM) and gemcitabine (4.5–4500 nM) than 2‐D cultured cells (P < 0.01). In addition, the expression of MDR1, MCT1, HIF‐1α, and GRP78 mRNA was 2.9‐, 3.2‐, 3.8‐, and 5.5‐fold higher, respectively, than those in 2‐D cultured cells (P < 0.04). Cryopreserved encapsulated cells in the microcapsules showed 80.5% viability and formed MTS with a comparable tolerance of 100 and 1000 nM mitomycin C to those that were not cryopreserved (P > 0.09). These findings suggest the duplex microcapsule may be a promising tool for producing MTS for pharmaceutical applications. (Cancer Sci 2012; 103: 549–554)
Three‐dimensional tumor cell constructs are increasingly recognized as valuable tools and key elements in anticancer drug discovery and tumor therapy test programs because their gene expression profiles reflect those of cancer cells in vivo more accurately than those of 2‐D cultured cells.( 1 , 2 , 3 ) The multicellular tumor spheroid (MTS) is a well‐known 3‐D tumor cell construct and various techniques have been reported for their preparation.( 3 ) One conventional technique uses cultivation on dishes with non‐adherent surfaces or hanging drop cultures.( 1 ) One of the critical obstacles, however, is difficulty in preparing MTS with a well‐defined size under conditions of sufficient medium renewals that are required for pharmaceutical assays with proper statistical analysis.( 3 ) One of the solutions to this problem is to culture tumor cells in homogeneous microcapsules.( 4 , 5 ) We recently reported an original duplex microcapsule suitable for mass production of spherical tissues with a narrow size distribution from a variety of cells.( 6 ) The duplex microcapsules were prepared from gelatin and sodium alginate using a flow‐focusing system.( 6 , 7 , 8 ) The spherical tissues formed in the microcapsule can be harvested easily and safely when necessary for subsequent applications by liquefying the microcapsule membrane.
The aim of this study was to evaluate the feasibility of duplex microcapsules as a platform for producing MTS for pharmaceutical assays. We used the HeLa human cervical cancer cell line and investigated the tolerance of the cells to anticancer drugs, mitomycin and gemcitabine, gene expressions of multi‐drug resistance protein 1 (MDR1), monocarboxylate transporter 1 (MCT1), hypoxia‐inducible factor 1α (HIF‐1α), and 78‐kDa glucose‐regulated protein (GRP78), and the cell‐cycle distribution in microcapsules. Gene expressions and the cell‐cycle phase of enclosed cells have not been reported in previous studies using microcapsules for preparing MTS, despite the importance of this information being well recognized for drug discovery programs.( 9 , 10 , 11 , 12 , 13 , 14 , 15 ) In addition, we investigated the possibility for cryopreservation of the tumor cell‐enclosing microcapsules. Cryopreservation of cell‐enclosing microcapsules would enable a reliable supply of uniform MTS for reproducible anticancer drug screening as needed because the microcapsules could be stocked in large quantities after a single mass production run.( 6 )
Materials and Methods
Materials. Gelatin (type B from porcine skin, 225 Bloom) was obtained from Sigma (St. Louis, MO, USA). I‐1G sodium alginate with a high content of guluronic acid, a molar ratio of mannuronic acid to guluronic acid content of 0.65, and a molecular weight of 70 000 Da was purchased from Kimica (Tokyo, Japan). Mitomycin C (mitomycin) and gemcitabine were obtained from Wako Pure Chemicals (Osaka, Japan) and Eli Lilly Japan (Hyogo, Japan), respectively. The HeLa human cervical cancer cell line was obtained from the Riken Cell Bank (Ibaragi, Japan). The cells were cultured in DMEM (Nissui Pharmaceutical, Tokyo, Japan) supplemented with 10% (v/v) FBS, 75 mg/L penicillin, and 50 μg/L streptomycin in a humidified atmosphere at 37°C in 5% CO2/95% air.
Cell encapsulation. Cell‐enclosing duplex microcapsules were prepared based on a previously reported method (Fig. 1).( 6 ) Briefly, cells were suspended in 7.5% (w/v) gelatin solution kept at 37°C at 2.5 × 10⁶ cells/mL. This solution was extruded from a 26‐gauge needle at 0.05 mL/min into a co‐flowing immiscible stream of liquid paraffin containing lecithin at 2% (w/w). An emulsion containing cell‐enclosing microdroplets of approximately 200 μm in diameter was prepared by controlling the flow rate of the liquid paraffin. After cooling the suspension in an ice bath for 6 min, PBS was added to the vessel containing the suspension then centrifuged to collect the resultant cell‐enclosing gelatin microparticles in the aqueous phase. The resultant gelatin microparticles were suspended in 1.5% (w/v) Na‐alginate aqueous solution and dropped into 100 mM CaCl2 solution using an electrostatic droplets generator to produce Ca‐alginate microparticles that contained the cell‐enclosing gelatin microparticles. After several washes using cell culture medium (DMEM with 10% FBS), the microparticles were incubated at 37°C in 5% CO2/95% air. The medium was changed every other day. A cavity structure in the microcapsules was developed by the incubation at 37°C due to the thermally induced gel‐to‐sol transition of the gelatin hydrogel. For subsequent assays, the cells in microcapsules were collected by soaking the microcapsules in 55 mM sodium citrate solution (pH 7.4).
Figure 1.
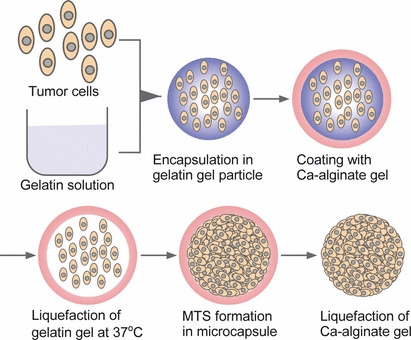
Schematic of tumor cell encapsulation and multicellular tumor spheroids (MTS) formation in a duplex microcapsule and subsequent harvesting of MTS.
Production of MTS on agarose gel. As a control for the cell‐cycle analysis of MTS formed in microcapsules, MTS were also prepared by incubating HeLa cells on agarose gel. A dish coated with agarose gel to provide a non‐adherent surface was obtained by pouring autoclaved agarose aqueous solution (1% (w/v)) into a 6‐well culture dish. A HeLa cell suspension in the medium was poured into each well at 1.0 × 10⁵ cells/well. The cells were then cultured under the same conditions as the encapsulated cell culture. The MTS obtained after 9 days of culture were used for subsequent analysis.
Drug treatment and growth inhibition measurement. Aliquots of cell‐enclosing microcapsules (300 μL) were collected after prescribed incubation times and poured into a 48‐well dish. Phosphate‐buffered saline containing mitomycin or gemcitabine (15 μL, pH 7.4) was added into each well to obtain desired concentrations. After 72 h of incubation under the conditions mentioned above, the medium was removed and the microcapsules were rinsed using PBS. The microcapsules were then suspended in 300 μL medium and poured into the 48‐well dish and 15 μL reagent in a Cell Counting Kit‐8 (Dojindo, Kumamoto, Japan) was added to each well to measure the mitochondrial activity of the cells. After 2 h of incubation at 37°C in a CO2 incubator, the absorbance of the supernatant was measured using a spectrophotometer. The number of cell‐enclosing microcapsule cavities in each well was counted using an optical microscope. The cytotoxicity was expressed as the relative viability using the following formula:
where A treated and A control are the average increases in absorbance compared to blank wells per cell‐enclosing microcapsule cavity in the wells treated with and without anticancer drugs, respectively.
RNA isolation, cDNA synthesis, and real‐time PCR. The cells in microcapsules were collected by dissolving the Ca‐alginate gel membrane by treatment with sodium citrate. The control cells on the culture dish were harvested by trypsinization. The cells were rinsed with PBS, then total RNA was extracted using an SV Total RNA Isolation Kit (Promega, Madison, WI, USA), according to the manufacturer’s instructions. Single‐stranded cDNA was generated from the extracted RNA using a GoTaq 2‐Step RT‐qPCR Kit (Promega). The target sequences from the resultant cDNA template were then amplified and quantified using a real‐time PCR with the following specific primers. MCT1: forward, 5′‐TGGCTGTCATGTATGGTGGA‐3′, reverse, 5′‐AGCTGCAATCAAGCCACAG‐3′; MDR1: forward, 5′‐TGTTGTCTGGACAAGCACTGA‐3′, reverse, 5′‐AAGAAACAACGGTTCGGAAG‐3′; HIF‐1α: forward, 5’‐CAGTCGACACAGCCTGGATA‐3’, reverse, 5’‐GCGGCCTAAAAGTTCTTCTG‐3′; GRP78: forward, 5′‐CACAGTGGTGCCTACCAAGA‐3′, reverse, 5′‐CTTTTGTCAGGGGTCTTTCA‐3′; glucuronidase beta: forward, 5′‐TGCGTCCCACCTAGAATCTG‐3′, reverse, 5′‐TTGCTCACAAAGGTCACAGG‐3′. The PCR reaction was then carried out under the following conditions: polymerase activation at 95°C for 2 min, then 40 amplification cycles with denaturation at 95°C for 15 s, followed by annealing and extension at 60°C for 1 min. Glucuronidase beta was used as an internal reference gene. Data were analyzed with the Opticon Monitor 3 software (Bio‐Rad Laboratories, Hercules, CA, USA). Experiments were carried out in triplicate and data are presented as the mean of relative quantities of mRNA.
Cell‐cycle analysis. After the indicated period of time, the cells on the cell culture dish, harvested from microcapsules, or on the dish coated with agarose gels, were trypsinized for dispersing. After rinsing with Ca and Mg‐free PBS, the cells were fixed with 70% ice‐cold ethanol and stored at 4°C for 12 h. The cells were stained with propidium iodide (0.5% v/v) after incubation with RNase (4000 U/mL) for 15 min at room temperature. The DNA content of at least 10 000 cells was measured using a flow cytometer (Attune Acoustic; Life Technologies, Tokyo, Japan) equipped with a red pass filter at 575 nm, and data were analyzed using Attune Cytometric 1.2 software (Life Technologies, Tokyo, Japan).
Cryopreservation. After 24 h of culture following encapsulation, the microcapsules were soaked in a medium containing 10% (v/v) dimethyl sulfoxide. The suspension was then poured into a cryotube. After 12 h of storage at −80°C, the cryotube was transferred into liquid nitrogen. After 45–75 days of cryopreservation in liquid nitrogen, the microcapsules were put into normal cell culture medium and incubated at 37°C to evaluate the growth profiles of the cryopreserved cells in microcapsules, as described above.
Statistical analysis. Quantitative data are expressed as the mean ± SD. Comparisons between two datasets were made using an unpaired Student’s t‐test. Comparisons among three datasets were made using one‐way anova with Tukey’s post‐hoc analysis.
Results
Growth of enclosed cells. We first studied the growth profiles of enclosed HeLa cells to understand the relation between the growth phase and culture period. The diameter of the cavity enclosing cells templated by gelation microparticles was 185 ± 13 μm. The viability of the cells immediately after encapsulation was 86.9 ± 2.3% (n = 4). Immediately after encapsulation, the cells existed individually (Fig. 2a). During several days of culturing, the cells formed clusters within the cavities (Fig. 2b), then multiplied and the diameter of the clusters increased with increasing culture period (Fig. 2c). The cavities were almost completely occupied by the cells at day 14 (Fig. 2d). A cross‐section of the clusters in the microcapsules stained by H&E shows the existence of living cells in the central part of the microcapsules (Fig. 2e). The growth of enclosed cells was also observed by an increase in mitochondrial activity, corresponding to an increased number of living cells per cavity. The plateau mitochondrial activity per cavity, indicating the stationary phase, was detected after 14 days of encapsulation (Fig. 3). Those MTS with a highly uniform size were collected within 1 min from the cell‐enclosing microcapsules through chelation of the calcium ions cross‐linking the alginate molecules by soaking them in sodium citrate solution (Fig. 2f). In contrast, MTS prepared on agarose gel were heterogeneous in size (Fig. 2g).
Figure 2.
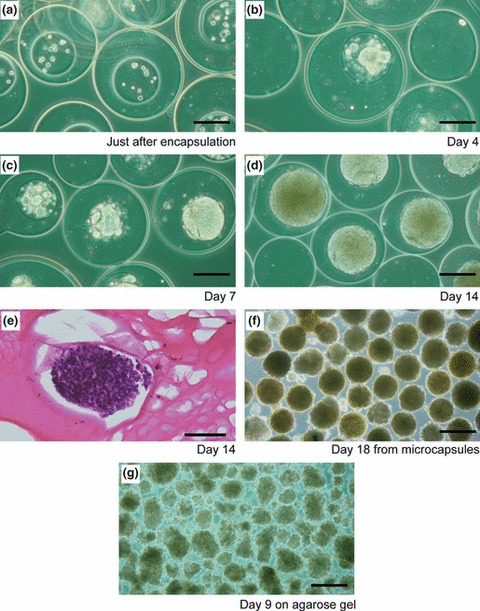
(a–d) Transition of morphologies of HeLa cells after encapsulation in duplex microcapsules. (e) Cross‐section of multicellular tumor spheroids (MTS) in a duplex microcapsule stained with H&E after 14 days of cultivation. (f) MTS harvested from microcapsules after 18 days of cultivation. (g) MTS formed on agarose gel after 9 days of cultivation. Bar = 150 μm (a–d); 200 μm (e); 300 μm (f,g).
Figure 3.
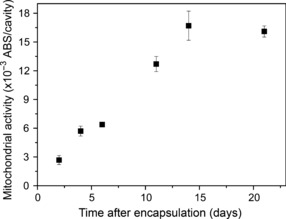
Transition of mitochondrial activity of HeLa cells enclosed in duplex microcapsules. Bar = SD (n = 3).
Tolerance to anticancer drugs. We used two widely used anticancer drugs, mitomycin and gemcitabine, to evaluate the chemosensitivity of MTS formed in duplex microcapsules. Figure 4 shows the relative viabilities of 2‐D cultured cells and those cultured in the microcapsules for 1 or 19 days after being exposed to 1–1000 nM mitomycin or 4.5–4500 nM gemcitabine for 72 h. The cells after 19 days of encapsulation showed significantly higher tolerance to the anticancer drugs in the dose ranges examined in this study than the 2‐D cultured cells (P < 0.01). In contrast, the cells cultured in the microcapsules showed almost the same sensitivities to both drugs the day after encapsulation as those of 2‐D cultured cells.
Figure 4.
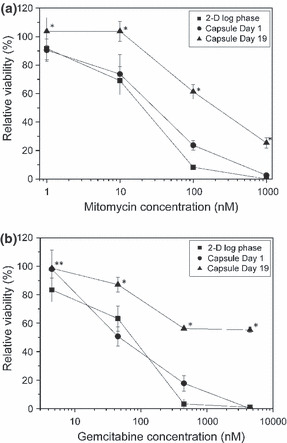
Dose–response curves of mitomycin (a) and gemcitabine (b) for HeLa cells cultured on a 2‐D culture dish (■) at log phase, and in microcapsules at day 1 (•) and 19 (▲). Bar = SD (n = 3). *P < 0.01 vs 2‐D and Capsule Day 1; **P < 0.01 vs 2‐D, analyzed by one‐way anova with Tukey’s post‐hoc analysis.
Expression of MDR1, MCT1, HIF‐1α, and GRP78. We then determined the mRNA expression for MDR1, MCT1, HIF‐1α, and GRP78 in the cells in MTS formed within cavities of Ca‐alginate gel microcapsules. As shown in Fig. 5, the MDR1, MCT1, HIF‐1α, and GRP78 mRNA expression in MTS after 19–21 days of encapsulation were 2.9‐, 3.2‐, 3.8‐, and 5.5‐fold higher, respectively, than those in 2‐D cultured cells on the tissue culture dish (P < 0.04).
Figure 5.
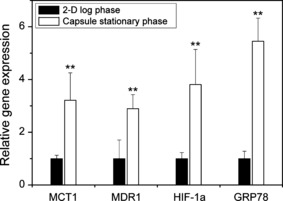
mRNA expression in HeLa cells cultured on a culture dish at log phase (2‐D) and in microcapsules at stationary phase on Day 18–21 (Capsule). Each value was normalized by the means of data in the 2‐D culture. Bar = SD (n = 4). **P < 0.04 vs 2‐D cultured cells analyzed by Student’s t‐test.
Cell‐cycle distributions. To investigate the cell‐cycle distribution of cells in MTS formed in microcapsules, flow cytometric analysis was carried out and the results were compared with those of 2‐D cultured cells on the tissue culture dish, as well as those in MTS obtained from culture on agarose gel. As shown in Table 1, MTS showed a higher proportion of cells in G0/G1 phase (P < 0.01) and a lower proportion in S phase (P < 0.01) after 18 days of encapsulation than after 6 days of encapsulation. The proportion in G0/G1 phase detected after 18 days of encapsulation decreased to the same level as after 6 days of encapsulation, after 3 days of culturing the MTS harvested from microcapsules on an agarose gel (P = 0.37). The cell cycle distribution of the cells in MTS after 6 days of encapsulation was almost the same as the 2‐D cultured cells in the stationary phase and those in MTS after 9 days of culture on agarose gel (P > 0.05).
Table 1.
Cell‐cycle distribution analysis of HeLa cells on a tissue culture dish, in microcapsules, and on agarose gel at indicated culture periods
| Culture condition | G0/G1 (%) | Synthetic (%) | G2/M (%) | |
|---|---|---|---|---|
| 2‐D | Log phase | 56.3 ± 1.4 | 18.4 ± 0.9 | 25.1 ± 0.5 |
| Stationary phase | 64.3 ± 1.9 | 19.2 ± 1.3 | 16.4 ± 2.7 | |
| Capsule | Day 6 | 63.4 ± 2.0 | 21.2 ± 0.2 | 15.4 ± 1.8 |
| Day 18 | 71.2 ± 0.9 | 15.5 ± 0.9 | 13.3 ± 1.7 | |
| Day 18 → Agarose Day 3† | 65.0 ± 0.9 | 23.9 ± 1.4 | 11.1 ± 0.9 | |
| Agarose | Day 9 | 65.3 ± 0.5 | 20.8 ± 1.0 | 13.9 ± 0.7 |
†After 18 days of culture in microcapsules, the spheres of cells were harvested and cultured on agarose gel for 3 days. Data are expressed as the mean ± SD (n = 3). 2‐D, cultured on a tissue culture dish; Agarose, cultured on agarose gel; Capsule, cultured in microcapsule.
Cryopreservation. The possibility of cryopreservation of the cell‐enclosing microcapsules was investigated by evaluating the growth and chemosensitivity of the cells cryopreserved in liquid nitrogen after 1 day of encapsulation. The viability of the cells after thawing was 80.5 ± 6.5% (n = 4; P = 0.13 vs before encapsulation) (Fig. 6a). The cells grew and filled the cavities of the microcapsules (Fig. 6b,c) the same as those that had not been exposed to the cryopreservation process (Fig. 2a–d). The relative viabilities of the cells in MTS obtained through the cryopreservation process after exposure to 100 and 1000 nM mitomycin were 51.2 ± 6.1% and 21.6 ± 0.6% (n = 3), respectively. Insignificant differences were detected for the values compared with those detected for the cells that had not been exposed to the cryopreservation process (P > 0.09).
Figure 6.
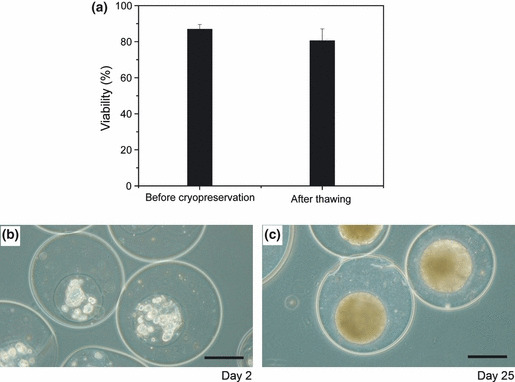
(a) Viabilities of HeLa cells in duplex microcapsules before cryopreservation, immediately after encapsulation, and after thawing. Bar = SD (n = 4). Morphologies of HeLa cells at 2 days (b) and 25 days (c) of culture in duplex microcapsules after 45 days of cryopreservation in liquid nitrogen. Bar = 150 μm.
Discussion
It is recognized that MTS better reflect pathophysiological phenomena in tumor tissues that critically affect therapeutic efficacy.( 1 , 2 , 3 ) Therefore, MTS have frequently been applied to antitumor drug screening since the early 1970s.( 3 ) The present study reports the production of MTS of HeLa cells using duplex microcapsules with a Ca‐alginate gel membrane and the characteristics of the resultant MTS. Use of the duplex microcapsulation approach enables the preparation of MTS with a well‐defined size and a narrow size distribution (Fig. 2f) in large quantities compared with other, conventional methods. The narrow size distribution can be mainly attributed to the narrow size distribution of the gelatin microparticles used as a template for the cavities prepared by a droplet breakup process in a water‐immiscible fluid flow.( 6 ) A Ca‐alginate gel membrane strong enough to arrest the excess growth of the enclosed cells would also play a vital role in the formation of homogeneous MTS, as indicated by the plateau in mitochondrial activity per cavity evident after 14 and 21 days of encapsulation (Fig. 2).
In chemosensitivity analyses, MTS obtained from HeLa cells after 19 days of encapsulation showed a higher viability than 2‐D cultured cells, after exposure to mitomycin and gemcitabine (Fig. 3). It may be considered that the hindrance of diffusion/adsorption of the chemicals through/to the microcapsule gel membrane resulted in this difference. However, the results obtained for the cells after 1 day of encapsulation contradict this: the trends in relative viabilities after exposure to mitomycin and gemcitabine were similar to those detected for 2‐D cultured cells. The higher tolerance to anticancer drugs of the cells in MTS formed in microcapsules, compared to 2‐D cultured cells, is consistent with those prepared by the conventional MTS preparation methods( 3 ) such as the hanging‐drop method( 16 ) and a method using a non‐adherent surface.( 17 )
The results of the chemosensitivity analysis motivated us to investigate gene expressions and cell‐cycle distributions of the cells in MTS formed in microcapsules because the correlation between chemosensitivity of tumor cells in vivo, gene expression, and cell‐cycle phase is widely recognized.( 9 , 10 , 11 , 12 , 13 , 14 , 15 ) The expressions of MDR1 and MCT1 mRNA in the cells of MTS after 19–21 days of encapsulation were approximately three times higher than those in 2‐D cultured cells (Fig. 4). The enhancement of MDR1 mRNA expression in the cells of MTS formed in microcapsules is consistent with those reported for cells in MTS obtained by other methods without the use of microcapsules.( 11 , 18 , 19 ) Considering previous reports describing the upregulation of MDR1 expression by hypoxia,( 11 , 19 ) and the fourfold expression of HIF‐1α mRNA in the cells of MTS compared to those in 2‐D cultured cells (Fig. 4), the increase of MDR1 expression in the cells in MTS formed in microcapsules is intuitively consistent.
As far as we are aware, this is the first report describing the upregulation of MCT1 expression in MTS. Sonveaux et al. ( 20 ) reported that human cancer cells converted glucose to lactate under hypoxic conditions and excreted it, whereas aerobic cancer cells took up lactate through MCT1 and used it for oxidative phosphorylation. They showed localization of MCT1 at the vascularized tumor periphery and around blood vessels.( 20 ) In contrast, Ullah et al. ( 21 ) reported that MCT1 was not upregulated by hypoxia induced by culturing under hypoxic gas. These conflicting results indicate that oxygenated and hypoxic regions are necessary for the upregulation of MCT1, similar to tumors in vivo. This means that MTS formed in microcapsules, at least those in this study, replicate the heterogeneous population of tumors in vivo. MDR1 is a major cause of multi‐drug resistance of cancer cells to chemotherapy( 22 ) and MCT1 is a confounding factor when the transport of small anionic drugs is investigated.( 23 ) The gene expressions of MDR1 and MCT1 have been reported to be upregulated in a variety of cancers in vivo.( 9 , 10 , 11 , 12 ) In addition, it has been reported that cancer cells develop drug resistance through the upregulation of stress‐induced molecules such as HIF‐1α( 24 ) and GRP78.( 25 ) Therefore, the results indicating the upregulation of MDR1, MCT1, HIF‐1α, and GRP78 in the cells of MTS formed in duplex microcapsules with a Ca‐alginate gel membrane indicate the suitability of MTS for drug discovery programs.
In the cell‐cycle distribution analysis, the proportion of cells in G0/G1 phase in MTS formed in microcapsules increased from 63.4 to 71.2% with increasing incubation period from 6 to 18 days (P < 0.01) but decreased to 65.0% after 3 days of releasing the MTS from the microcapsules (P < 0.01, Table 1). This result, together with the result indicating unchanged mitochondrial activity of enclosed cells after 14 days of encapsulation (shown in Fig. 2), clearly shows that the microcapsule membrane physically arrested the growth of enclosed cells. It is known that proliferating cells are abundant near the surface of the MTS,( 1 , 26 ) that is, the proportion in G0/G1 phase increases with increasing MTS size. Considering this, it is possible to obtain an abundance of cells in G0/G1 phase without preparing large MTS by using microcapsules as the platform for production. This would be useful for non‐destructive observation of MTS using a confocal fluorescence microscope in drug discovery programs because the sharpness of the images is strongly influenced by the thickness of the observed objects.
Comprehensively considering the results indicating the existence of hypoxic cells in MTS formed in duplex microcapsules, high chemoresistance, and enriched distribution of G0/G1 cells in MTS, it appears that duplex microcapsules could be useful for cancer stem cell studies. Cancer stem cells are defined as those cells within a tumor that can self‐renew and drive tumorigenesis. Cancer stem cells have the properties of drug efflux ability and resistance to hypoxia and chemoradiation.( 27 ) Recent studies suggest that sphere formation might be essential to the cancer‐initiating ability of cancer stem cells.( 28 , 29 ) In addition, there are reports indicating the importance of hypoxia as a regulator of cancer stem cell differentiation.( 30 , 31 ) Kamohara et al. ( 32 ) showed that G0 cells in hepatocellular carcinoma were promising candidates as cancer stem cells. Studies of cancer stem cells using MTS formed in duplex microcapsules are under investigation in our laboratory.
Finally, we investigated the possibility of cryopreservation of the cell‐enclosing microcapsules by evaluating the growth of cryopreserved cells in the microcapsules and chemosensitivity of the resultant MTS. No significant decrease in viability of the thawed cells compared to those immediately after encapsulation (Fig. 6a) indicates that the existing microcapsule membrane had no adverse effect on the viability of encapsulated cells. Furthermore, the comparable growth and chemosensitivity of the cells in the resultant MTS with those in non‐cryopreserved microcapsules indicate that this microcapsulation approach should be a useful tool for supplying MTS that will provide reproducible results in anticancer drug screening programs when needed.
In conclusion, our results indicate the feasibility of duplex microcapsules with a Ca‐alginate gel membrane and a homogeneous spherical cavity templated by gelatin microparticles as a platform for obtaining MTS for pharmaceutical assays.
Disclosure Statement
The authors declare no conflicts of interest.
Acknowledgments
We are grateful to Dr. Hiroshi Umakoshi and Mr. Keita Hayashi, Osaka University (Toyonaka, Japan), for support with flow cytometry analysis. This work was supported by a Grant‐in‐Aid for Young Scientists (B), no. 22760610, from the Ministry of Education, Culture, Sports, Science and Technology of Japan.
References
- 1. Hirschhaeuser F, Menne H, Dittfeld C, West J, Mueller Klieser W, Kunz Schughart LA. Multicellular tumor spheroids: an underestimated tool is catching up again. J Biotechnol 2010; 148: 3–15. [DOI] [PubMed] [Google Scholar]
- 2. Gaedtke L, Thoenes L, Culmsee C, Mayer B, Wagner E. Proteomic analysis reveals differences in protein expression in spheroid versus monolayer cultures of low‐passage colon carcinoma cells. J Proteome Res 2007; 6: 4111–8. [DOI] [PubMed] [Google Scholar]
- 3. Friedrich J, Ebner R, Kunz Schughart LA. Experimental anti‐tumor therapy in 3‐D: spheroids – old hat or new challenge?. Int J Radiat Biol 2007; 83: 849–71. [DOI] [PubMed] [Google Scholar]
- 4. Zhang X, Wang W, Yu W et al. Development of an in vitro multicellular tumor spheroid model using microencapsulation and its application in anticancer drug screening and testing. Biotechnol Prog 2005; 21: 1289–96. [DOI] [PubMed] [Google Scholar]
- 5. Zaytseva Zotova DS, Udartseva OO, Andreeva ER et al. Polyelectrolyte microcapsules with entrapped multicellular tumor spheroids as a novel tool to study the effects of photodynamic therapy. J Biomed Mater Res B Appl Biomater 2011; 97: 255–62. [DOI] [PubMed] [Google Scholar]
- 6. Sakai S, Ito S, Kawakami K. Calcium alginate microcapsules with spherical liquid cores templated by gelatin microparticles for mass production of multicellular spheroids. Acta Biomater 2010; 6: 3132–7. [DOI] [PubMed] [Google Scholar]
- 7. Sakai S, Kawabata K, Ono T, Ijima H, Kawakami K. Preparation of mammalian cell‐enclosing subsieve‐sized capsules (<100 μm) in a coflowing stream. Biotechnol Bioeng 2004; 86: 168–73. [DOI] [PubMed] [Google Scholar]
- 8. Sakai S, Ito S, Inagaki H et al. Cell‐enclosing gelatin‐based microcapsule production for tissue engineering using a microfluidic flow‐focusing system. Biomicrofluidics 2011; 5: 13402. [DOI] [PMC free article] [PubMed] [Google Scholar]
- 9. Pinheiro C, Albergaria A, Paredes J et al. Monocarboxylate transporter 1 is up‐regulated in basal‐like breast carcinoma. Histopathology 2010; 56: 860–7. [DOI] [PubMed] [Google Scholar]
- 10. Schneiderhan W, Scheler M, Holzmann KH et al. CD147 silencing inhibits lactate transport and reduces malignant potential of pancreatic cancer cells in in vivo and in vitro models. Gut 2009; 58: 1391–8. [DOI] [PubMed] [Google Scholar]
- 11. Comerford KM, Wallace TJ, Karhausen J, Louis NA, Montalto MC, Colgan SP. Hypoxia‐inducible factor‐1‐dependent regulation of the multidrug resistance (MDR1) gene. Cancer Res 2002; 62: 3387–94. [PubMed] [Google Scholar]
- 12. van Brussel JP, Mickisch GH. Multidrug resistance in prostate cancer. Onkologie 2003; 26: 175–81. [DOI] [PubMed] [Google Scholar]
- 13. Collins K, Jacks T, Pavletich NP. The cell cycle and cancer. Proc Natl Acad Sci USA 1997; 94: 2776–8. [DOI] [PMC free article] [PubMed] [Google Scholar]
- 14. Dai Y, Grant S. Methods to study cancer therapeutic drugs that target cell cycle checkpoints. Methods Mol Biol 2011; 782: 257–304. [DOI] [PubMed] [Google Scholar]
- 15. Tung JN, Cheng YW, Hsu CH et al. Normoxically overexpressed hypoxia inducible factor 1‐alpha is involved in arsenic trioxide resistance acquisition in hepatocellular carcinoma. Ann Surg Oncol 2011; 18: 1492–500. [DOI] [PubMed] [Google Scholar]
- 16. Tung YC, Hsiao AY, Allen SG, Torisawa YS, Ho M, Takayama S. High‐throughput 3D spheroid culture and drug testing using a 384 hanging drop array. Analyst 2011; 136: 473–8. [DOI] [PMC free article] [PubMed] [Google Scholar]
- 17. Friedrich J, Eder W, Castaneda J et al. A reliable tool to determine cell viability in complex 3‐d culture: the acid phosphatase assay. J Biomol Screen 2007; 12: 925–37. [DOI] [PubMed] [Google Scholar]
- 18. Oshikata A, Matsushita T, Ueoka R. Enhancement of drug efflux activity via MDR1 protein by spheroid culture of human hepatic cancer cells. J Biosci Bioeng 2011; 111: 590–3. [DOI] [PubMed] [Google Scholar]
- 19. Xing H, Wang S, Hu K et al. Effect of the cyclin‐dependent kinases inhibitor p27 on resistance of ovarian cancer multicellular spheroids to anticancer chemotherapy. J Cancer Res Clin Oncol 2005; 131: 511–9. [DOI] [PMC free article] [PubMed] [Google Scholar]
- 20. Sonveaux P, Vegran F, Schroeder T et al. Targeting lactate‐fueled respiration selectively kills hypoxic tumor cells in mice. J Clin Invest 2008; 118: 3930–42. [DOI] [PMC free article] [PubMed] [Google Scholar]
- 21. Ullah MS, Davies AJ, Halestrap AP. The plasma membrane lactate transporter MCT4, but not MCT1, is up‐regulated by hypoxia through a HIF‐1alpha‐dependent mechanism. J Biol Chem 2006; 281: 9030–7. [DOI] [PubMed] [Google Scholar]
- 22. Muller M, Bakos E, Welker E et al. Altered drug‐stimulated ATPase activity in mutants of the human multidrug resistance protein. J Biol Chem 1996; 271: 1877–83. [DOI] [PubMed] [Google Scholar]
- 23. Ahlin G, Hilgendorf C, Karlsson J, Szigyarto CA, Uhlen M, Artursson P. Endogenous gene and protein expression of drug‐transporting proteins in cell lines routinely used in drug discovery programs. Drug Metab Dispos 2009; 37: 2275–83. [DOI] [PubMed] [Google Scholar]
- 24. Lin SC, Chien CW, Lee JC et al. Suppression of dual‐specificity phosphatase‐2 by hypoxia increases chemoresistance and malignancy in human cancer cells. J Clin Invest 2011; 121: 1905–16. [DOI] [PMC free article] [PubMed] [Google Scholar]
- 25. Lee AS. GRP78 induction in cancer: therapeutic and prognostic implications. Cancer Res 2007; 67: 3496–9. [DOI] [PubMed] [Google Scholar]
- 26. Lin RZ, Chang HY. Recent advances in three‐dimensional multicellular spheroid culture for biomedical research. Biotechnol J 2008; 3: 1172–84. [DOI] [PubMed] [Google Scholar]
- 27. Ishii H, Iwatsuki M, Ieta K et al. Cancer stem cells and chemoradiation resistance. Cancer Sci 2008; 99: 1871–7. [DOI] [PMC free article] [PubMed] [Google Scholar]
- 28. Uchida Y, Tanaka S, Aihara A et al. Analogy between sphere forming ability and stemness of human hepatoma cells. Oncol Rep 2010; 24: 1147–51. [DOI] [PubMed] [Google Scholar]
- 29. Cicalese A, Bonizzi G, Pasi CE et al. The tumor suppressor p53 regulates polarity of self‐renewing divisions in mammary stem cells. Cell 2009; 138: 1083–95. [DOI] [PubMed] [Google Scholar]
- 30. Yeung TM, Gandhi SC, Bodmer WF. Hypoxia and lineage specification of cell line‐derived colorectal cancer stem cells. Proc Natl Acad Sci USA 2011; 108: 4382–7. [DOI] [PMC free article] [PubMed] [Google Scholar]
- 31. Xing F, Okuda H, Watabe M et al. Hypoxia‐induced Jagged2 promotes breast cancer metastasis and self‐renewal of cancer stem‐like cells. Oncogene 2011; 30: 4075–86. [DOI] [PMC free article] [PubMed] [Google Scholar]
- 32. Kamohara Y, Haraguchi N, Mimori K et al. The search for cancer stem cells in hepatocellular carcinoma. Surgery 2008; 144: 119–24. [DOI] [PubMed] [Google Scholar]


