

Abstract
The purpose of the present study was to determine the genomic profile of renal cell carcinoma (RCC) in end‐stage renal disease (ESRD) by analyzing genomic copy number aberrations. Seventy‐nine tumor samples from 63 patients with RCC‐ESRD were analyzed by array comparative genomic hybridization using the Agilent Whole Human Genome 4 × 44K Oligo Micro Array (Agilent Technologies Inc., Palo Alto, CA, USA). Unsupervised hierarchical clustering analysis revealed that the 63 cases could be divided into two groups, Clusters A and B. Cluster A was comprised mainly of clear cell RCC (CCRCC), whereas Cluster B was comprised mainly of papillary RCC (PRCC), acquired cystic disease (ACD)‐associated RCC, and clear cell papillary RCC. Analysis of the averaged frequencies revealed that the genomic profiles of Clusters A and B resembled those of sporadic CCRCC and sporadic PRCC, respectively. Although it has been proposed on the basis of histopathology that ACD‐associated RCC, clear cell papillary RCC and PRCC‐ESRD are distinct subtypes, the present data reveal that the genomic profiles of these types, categorized as Cluster B, resemble one another. Furthermore, the genomic profiles of PRCC, ACD‐associated RCC and clear cell papillary RCC admixed in one tissue tended to resemble one another. On the basis of genomic profiling of RCC‐ESRD, we conclude that the molecular pathogenesis of CCRCC‐ESRD resembles that of sporadic CCRCC. Although various histologic subtypes of non‐clear cell RCC‐ESRD have been proposed, their genomic profiles resemble those of sporadic PRCC, suggesting that the molecular pathogenesis of non‐CCRCC‐ESRD may be related to that of sporadic PRCC. (Cancer Sci 2012; 103: 569–576)
Acquired cystic disease of the kidney (ACDK) is a common complication of end‐stage renal disease (ESRD), and the prevalence of ACDK increases progressively with the duration of dialysis.( 1 ) It is well documented that the risk of RCC is approximately 34‐ to 100‐fold greater in patients with ESRD than in the general population.( 2 , 3 )
It has been reported that RCC arising in ESRD patients (RCC‐ESRD) is distinct from sporadic RCC in several respects.( 4 ) First, the biological behavior of the former is generally less aggressive than that of the latter.( 5 , 6 ) Second, papillary RCC (PRCC) is the most common histological subtype of RCC‐ESRD (48.8–75%),( 7 , 8 ) whereas clear cell RCC (CCRCC) is the most common in sporadic RCC (75%). Third, in RCC‐ESRD, several histological subtypes are frequently admixed in a single tumor.( 9 ) In fact, Tickoo et al. have recently proposed a unique histological classification for RCC‐ESRD frequently accompanied by ACDK.( 9 ) Specifically, they have designated tumors showing a microcystic architecture and eosinophilic cytoplasm with Furmans’ Grade 3 nuclei that are frequently associated with intratumoral oxalate crystals as “acquired cystic disease (ACD)‐associated RCC”, whereas tumors exhibiting a papillary architecture and clear cytoplasm are designated “clear cell papillary RCC”.( 10 )
It has been reported that the various histological subtypes of sporadic RCC are associated with distinct genetic abnormalities. In CCRCC, gains of chromosomes 5q and 7q, and losses of chromosomes 3p and 14q, are frequently reported,( 11 , 12 , 13 , 14 ) whereas in PRCC gains of chromosomes 7pq and 17pq and a loss of chromosome Y are often observed.( 15 , 16 , 17 ) However, the genomic aberrations present in RCC‐ESRD are still largely unknown.( 18 ) Therefore, to identify the genomic profiles and to clarify the molecular mechanisms responsible for the pathogenesis of RCC‐ESRD, we analyzed DNA copy number alterations (CNAs) throughout the entire genome using array‐based comparative genomic hybridization (CGH).
Materials and Methods
Histology. In all, 63 patients with RCC‐ESRD were diagnosed histologically by a central pathologist (Y.N.) according to the World Health Organization (WHO) classification( 19 ) and the classification proposed by Tickoo et al. ( 9 ) To arrive at conclusive pathological diagnoses, we performed immunohistochemistry with antibodies directed against α‐methylacyl‐CoA racemase (DAKO, Carpinteria, CA, USA) and cytokeratin 7 (DAKO). The clinicopathologic findings are given in Table S1, available as Supporting Information to this publication. The 63 patients evaluated in the present study comprised 26 cases of CCRCC, four of PRCC, two of ACD‐associated RCC, three of clear cell papillary RCC, one of mucinous tubular and spindle cell carcinoma (MTSCC), one of tubulocystic carcinoma,( 20 ) one of unclassified RCC, and 25 cases that contained several different histologic elements (Table S1).
Extraction of genomic DNA. Histological sections were prepared from formalin‐fixed, paraffin‐embedded tissue samples and stained with Toluidine blue (Wako, Osaka, Japan). To collect tumor cells selectively from tissues, laser‐capture microdissection (LCM; Arcturus Engineering, Mountain View, CA, USA) was performed. Genomic DNA was extracted by the standard proteinase K digestion method, as described previously.( 21 ) As the source of control DNA, genomic DNA was extracted from tissues of normal renal cortex obtained from 12 patients with ureteral carcinoma or renal pelvic carcinoma, neither of which exhibited invasion or metastasis to renal cortex. The same amount of genomic DNA extracted from 12 patients was mixed and used as the control DNA. The tissue extraction of genomic DNA and its analysis by array CGH were approved by the Oita University Ethics Committee (Approval no. P‐05–05 and 439) according to the Ethical Guidelines for Clinical Research (Ministry of Health, Labour and Welfare, 2008, http://www.mhlw.go.jp/english/).
Array CGH and data analysis. For array CGH, 1.5 μg genomic DNA was used. High‐resolution array CGH was performed using the Agilent Whole Human Genome 4 × 44K Oligo Micro Array Kit (Agilent Technologies Inc.) in accordance with standard protocols. Microarray images were analyzed using FEATURE EXTRACTION v. 9.5.3.1 (Agilent Technologies Inc.) with linear normalization (protocol CGH‐v4_95_Feb07) and the resulting data were subsequently imported into the DNA Analytics v. 4.0.81 software package (Agilent Technologies). Following normalization of the raw data, the log2 ratio of Cy5 (tumor) to Cy3 (control) was calculated. Aberrant regions were determined by the Aberration Detection Method (ADM)‐2 algorithm at a threshold of 8.0 in DNA Analytics. To detect gains and losses of chromosome regions, we set the values of parameters for aberration filters as follows: minimum number of probes in region 2, minimum absolute average log2 ratio for region 0.15, maximum number of aberrant regions 10 000, and percentage penetrance per feature 0. The data obtained in the array CGH analysis are available at the GEO database (http://www.ncbi.nlm.nih.gov/geo/; accession numbers GSE28601 and GSE33117). The clustering of array CGH data was performed with Gene Cluster 3.0 software (Stanford University, Palo Alto, CA, USA) using unsupervised hierarchical clustering analysis based on Correlation (uncentered) for the 63 cases of RCC‐ESRD.
Statistical analysis. Comparisons between the genomic CNAs and histological subtypes were examined by Fisher’s exact test. Differences in dialysis duration and frequency of ACDK between Clusters A and B were examined by the Wilcoxon test. Statistical significance was set at P < 0.05.
Results
Subclassification of RCC‐ESRD into two groups using unsupervised hierarchical clustering. We analyzed the whole‐genome profiles for the 63 cases of RCC‐ESRD and the averaged frequencies of their CNAs are summarized in Figure 1. In the present study, the normal control consisted of kidney tissue from 12 patients with diseases other than RCC. Because we did not perform array CGH using paired (tumor/non‐tumor) samples, we cannot completely rule out the possibility that unidentified germline copy number variation (CNV)s may have affected our array CGH data. Among these CNAs, loss at 3p and gains at 5q and 16pq were detected in more than 30% of cases. Unsupervised hierarchical clustering of all 63 cases, based on array CGH data from autosomes, showed that the various histologic subtypes of RCC‐ESRD could be divided into two groups, namely Clusters A and B (Fig. 2), on the basis of genome profiling. The 27 cases categorized into Cluster A included 24 cases of CCRCC (88.9%), one case of ACD‐associated RCC (3.7%), one case of PRCC (3.7%), and one case of chromophobe RCC (3.7%), indicating that Cluster A was composed mainly of CCRCCs. Conversely, the 36 cases in Cluster B comprised 16 cases of ACD‐associated RCC (44.4%), eight cases of PRCC (22.2%), six cases of CCRCC (16.7%), three cases of clear cell papillary RCC (8.3%), one case of unclassified RCC (2.8%), one case of tubulocystic carcinoma (2.8%), and one case of MTSCC (2.8%), indicating that Cluster B was composed mainly of a variety of histologic subytpes other than CCRCC. Consistent with our data that ACDK was more common in Cluster B than in Cluster A (Table S2), all six cases of CCRCC in Cluster B were accompanied by ACDK (Table S3), compared with only 15 of 24 cases of CCRCC in Cluster A (62.5%). Although this observation appears to be interesting, the trend did not reach statistical significance, probably due to the limited number of cases.
Figure 1.
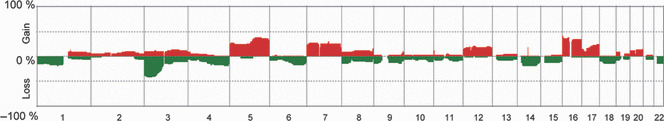
Genome‐wide averaged frequency of genomic imbalance in 63 cases of renal cell carcinoma (RCC) in end‐stage renal disease (ESRD). Oligonucleotide probes are shown in order from chromosome 1 to 22 within each chromosome. The frequency (%) of gains (positive values) and losses (negative values) is shown on the y‐axis for each probe in all cases of RCC‐ESRD analysed.
Figure 2.
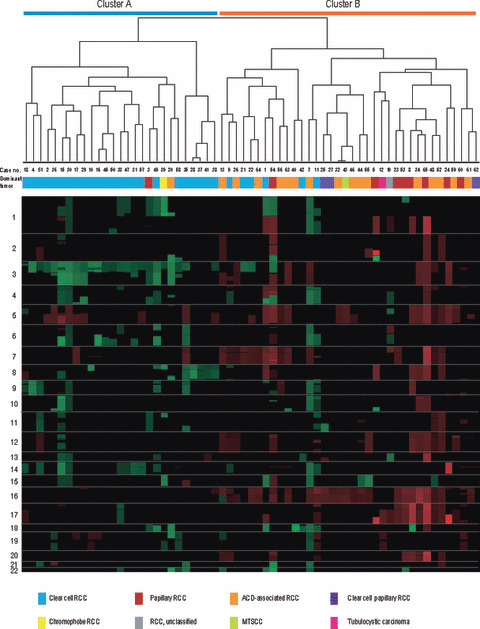
Unsupervised hierarchical clustering of autosomal DNA copy number aberrations in renal cell carcinoma (RCC) in end‐stage renal disease (ESRD). Unsupervised hierarchical clustering analysis of 63 RCC‐ESRD cases was performed on the basis of standardized copy number changes. The histologic diagnosis for each case is indicated. For cases with admixed multiple histologic subtypes, the dominant subtype is shown. ACD, acquired cystic disease; MTSCC, mucinous tubular and spindle cell carcinoma.
Identification of distinct differences in genomic profiles between Clusters A and B. We next compared the averaged frequencies of CNAs between Clusters A and B. As shown in Figure 3, distinct differences between their genomic profiles were found. Among the 27 cases categorized as belonging to Cluster A, losses at 3p and 14q and a gain at 5q were detected in 24 (88.9%), nine (33.3%) and nine (33.3%) cases, respectively. The presence of these CNAs has also been reported in sporadic CCRCC,( 14 ) indicating that the CNAs of Cluster A have similar patterns to those of sporadic CCRCC, although the frequency of the 7q gain was significantly lower in CCRCC‐ESRD of Cluster A (8.3%; 2/24) than in sporadic CCRCC (35%; 9/36; Table S4). In fact, among the 27 cases categorized into Cluster A, 24 (88.9%) were diagnosed histologically as CCRCC (Fig. 2), suggesting that CCRCC‐ESRD represented a distinct subtype of RCC‐ESRD on the basis of genomic profiling. Conversely, in more than 30% of the 36 cases categorized into Cluster B, the CNAs detected were gains at 5p (n = 13; 36.1%), 5q (n = 16; 44.4%), 7p (n = 16; 44.4%), 7q (n = 15; 44.4%), 12p (n = 11; 30.6%), 12q (n = 12; 33.3%), 16pq (n = 23; 63.9%), and 17q (n = 14; 38.9%; Fig. 3). We noticed that Cluster B had CNAs such as gains at 7pq, 12pq, 16pq, and 17q, which have frequently been observed in sporadic PRCC,( 16 ) suggesting that the genomic profiles of RCC‐ESRD categorized into Cluster B resemble those of sporadic PRCC.
Figure 3.
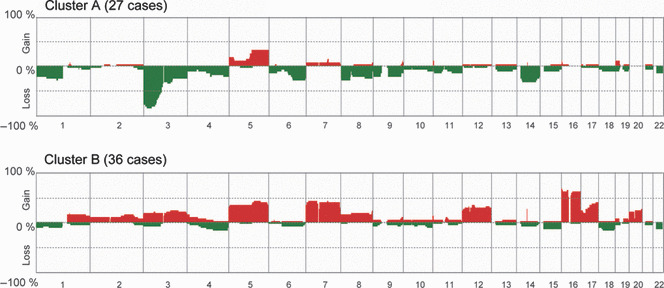
Distinct difference in genome‐wide averaged frequency of genomic imbalance between Clusters A and B. Oligonucleotide probes are shown in order from chromosome 1 to 22 within each chromosome. The frequency (%) of gains (positive values) and losses (negative values) is shown on the y‐axis for each probe in all cases of renal cell carcinoma (RCC) in end‐stage renal disease (ESRD) in Clusters A and Cluster B.
Interestingly, we noticed that the duration of dialysis in cases categorized into Cluster B was significantly longer than that of cases in Cluster A (P = 0.009; Fig. 4a) and that ACDK was evident more frequently in Cluster B than in Cluster A (P = 0.0213). Furthermore, we found that the pattern of averaged CNA frequencies in patients who had been receiving dialysis for <10 years was quite distinct from that in patients who had been receiving dialysis for >20 years (Fig. 4b,d). The former pattern resembled that of sporadic CCRCC, whereas the latter resembled that of sporadic PRCC. These findings suggest that the genotypes of RCC‐ESRD are associated with the duration of dialysis. In addition, patients who had been receiving dialysis for between >10 and <20 years showed a genotypic pattern intermediate between the former two (Fig. 4c).
Figure 4.
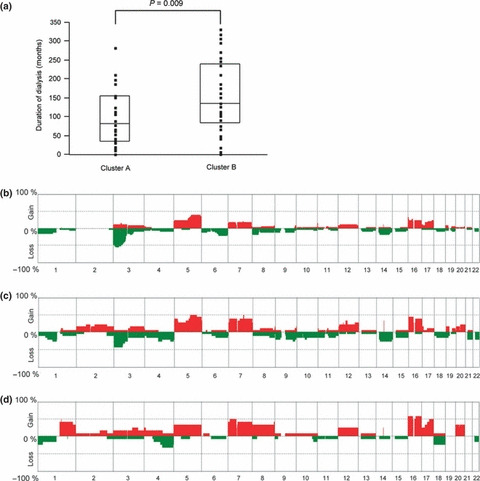
Association between the pattern of genome‐wide averaged frequency of genomic imbalance and the duration of dialysis. (a) The duration of dialysis compared between Clusters A and B. (b–d) Genome‐wide averaged frequency of genomic imbalance in patients receiving dialysis for <10 years (b), 10–20 years (c), and >20 years (d). The number of cases in each of the three groups was 33, 18 and 12, respectively.
Similarity of the genomic profile of PRCC‐ESRD with that of sporadic PRCC. Because histological patterns diagnosed as PRCC, ACD‐associated RCC, and clear cell papillary RCC tended to be admixed in one tissue, we differentially collected each of these elements alone using LCM and analyzed them as a distinct sample. Consequently, we obtained 38 samples from 27 patients, 16 with ACD‐associated RCC, eight with PRCC, and three with clear cell papillary RCC. We first analyzed the averaged frequencies for 12 samples of PRCC‐ESRD and compared their genomic profiles with those of sporadic PRCC that had already been reported. Gains at 5pq, 7pq, 8q, 12pq, 16pq, 17pq, and 20pq were detected in over 40% of all samples of PRCC‐ESRD (Fig. 5a). These aberrations, except for the 5q gain, have also been reported to be detected frequently in sporadic PRCC,( 16 ) suggesting that CNAs of PRCC‐ESRD resemble those of sporadic PRCC (Table S5).
Figure 5.
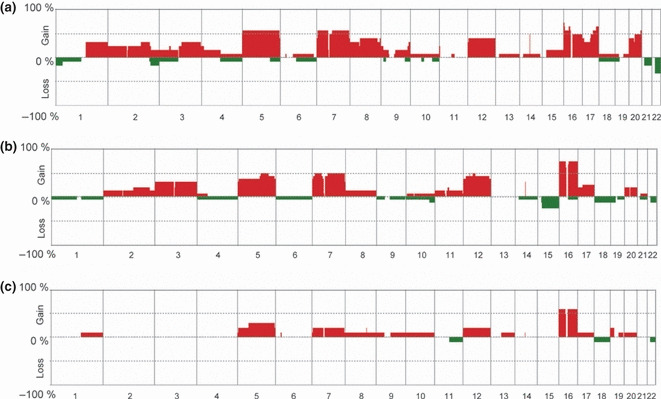
Genome‐wide averaged frequency of genomic imbalance in (a) papillary, (b) acquired cystic disease (ACD)‐associated, and (c) clear cell papillary renal cell carcinoma (RCC) in end‐stage renal disease (ESRD). Oligonucleotide probes are shown in order from chromosome 1 to 22 within each chromosome. The frequency (%) of gains (positive values) and losses (negative values) is shown on the y‐axis for each probe for 33 samples of papillary RCC‐ESRD (a), 16 samples of ACD‐associated (b), and 10 samples of clear cell papillary RCC‐ESRD (c).
Genomic profiles of ACD‐associated RCC and clear cell papillary RCC are similar to those of PRCC‐ESRD. Next, we compared the patterns of averaged frequency among 12 samples of PRCC‐ESRD, 16 samples of ACD‐associated RCC, and 10 samples of clear cell papillary RCC. In the 12 PRCC samples, gains at 5pq (n = 7; 58.3%), 7pq (n = 7; 58.3%), 8q (n = 5; 41.7%), 12pq (n = 5; 41.7%), 16p (n = 8; 66.7%), 16q (n = 6; 50%), 17p (n = 5; 41.7%), 17q (n = 8; 66.7%), 20p (n = 5; 41.7%), and 20q (n = 6; 50%) were detected (Fig. 5a). In the 16 ACD‐associated RCCs, gains at 5q (n = 8; 50%), 7pq (n = 8; 50%), 12pq (n = 7; 43.8%), and 16pq (n = 12; 75%) were detected (Fig. 5b). Furthermore, in the 10 clear cell papillary RCCs, gains at 5p (20%), 5q (30%), 7pq (20%), 12pq (20%), and 16pq (60%) were detected (Fig. 5c). The overlapping minimal common regions that were recurrently detected in more than 40% of cases of each histologic subtype are listed in Table S6. In particular, gains at 16p13.3, 16p11.2, and 17q24.3–25.3 were detected in 75%, 66.7% and 66.7% of PRCC, respectively. Furthermore, in 75% of ACD‐associated RCCs and clear cell papillary RCCs, a copy number gain was detected throughout the whole 16th chromosome. The frequencies of CNAs in each chromosome of PRCC‐ESRD were compared with those of ACD‐associated RCC and clear cell papillary RCC, but no significant differences were evident except for 1q and 17q, respectively (Tables S7 and S8). The frequency of gain at 17q in PRCC‐ESRD (58.3%) was significantly higher (P = 0.0115) than that in clear cell papillary RCC (10%; Table S5). Furthermore, the frequency of gain at 1q in PRCC‐ESRD (33.3%) was significantly higher (P = 0.02418) than that in ACD‐associated RCC (0%; Table S4). These findings suggest that the genomic profiles of PRCC‐ESRD, as a whole, resemble those of ACD‐associated RCC as well as clear cell papillary RCC. In addition, there were no differences in the frequencies of CNAs between ACD‐associated RCC and clear cell papillary RCC (Table S9).
Similarity of genomic alterations in the histologic subtypes of non‐clear cell RCC‐ESRD. We next analyzed the genomic profiles of 13 cases in which multiple histological components coexisted. Of these, we analyzed nine cases that shared distinct histologic components other than CCRCC. As shown in Figure 6, one case in which PRCC, ACD‐associated RCC, and tubulocystic carcinoma were admixed in one tissue exhibited gains at 1q, 5pq, 8pq, 9pq, 12pq, 16pq, 17pq, and 20pq, and a loss at 18pq in all three histologic components, indicating that all the histologic components had similar genomic profiles. Subsequently, we analyzed the remaining eight cases in a similar way. As shown in Figure S1, seven of the nine cases were found to share the same genomic aberrations in each histologic component. Four of those seven cases shared gains at 5q, 7pq, and 16p, three cases shared gains at 5p and 16q, and two cases shared gains at 1q, 12pq, 17q, and 20q. Conversely, in the remaining two of nine cases, no genomic aberrations were shared. Thus, the data suggest that the genomic profiles of PRCC, ACD‐associated RCC, and clear cell papillary RCC tend to resemble one another.
Figure 6.
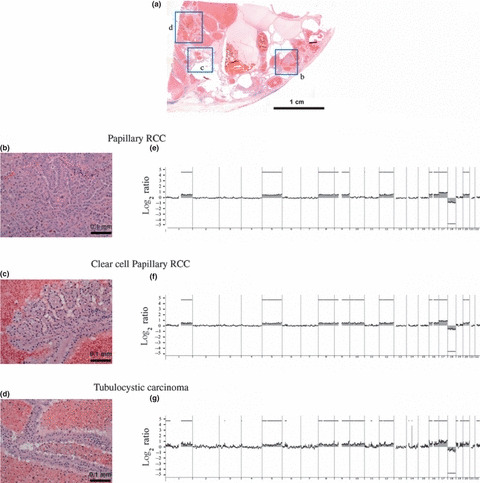
The pattern of copy number alterations (CNAs) in a case of renal cell carcinoma (RCC) in end‐stage renal disease (ESRD) containing several histologic components. (a) Histology (low‐power loupe view) of a case of RCC‐ESRD composed of papillary RCC‐ESRD (b), clear cell papillary RCC‐ESRD (c) and tubulocystic carcinoma (d). (b–d) Histology (high‐power view) of each component shown in (a). (e–g) Array comparative genomic hybridization (CGH) profiles of each histologic component. Whole‐genomic profiles of papillary RCC‐ESRD (e), clear cell papillary RCC‐ESRD (f) and tubulocystic carcinoma (g). Oligonucleotide probes are shown in order from chromosome 1 to 22 within each chromosome. The log2 ratio was plotted for all oligonucleotide probes based on their chromosome positions. The shaded areas and bold horizontal lines indicate regions of CNAs based on an ADM‐2 algorithm.
Gains at 7pq, 16pq and 20pq were also detectable in atypical cysts, but not in simple cysts. It is well known that cystic disease is a common complication of ESRD.( 22 , 23 , 24 ) Furthermore, it has been hypothesized that such acquired cystic lesions may be a precursor of RCC‐ESRD.( 23 , 24 ) Therefore, using array CGH, we analyzed the CNAs of 12 cases of simple cysts and seven cases of atypical cysts, both of which were found to be present in RCC‐ESRD tissue samples. In the seven atypical cysts, gains at 7pq (28.5%), 16pq (42.8%), 19p (28.5%), and 20q (28.5%) were evident, although CNAs were rarely detectable in simple cysts (Fig. 7). Because gains at 7pq, 16pq, and 20q were also detected in PRCC‐ESRD, ACD‐associated RCC, and clear cell papillary RCC, the observations suggest that CNAs characteristic of these tumors were already present in atypical cysts.
Figure 7.
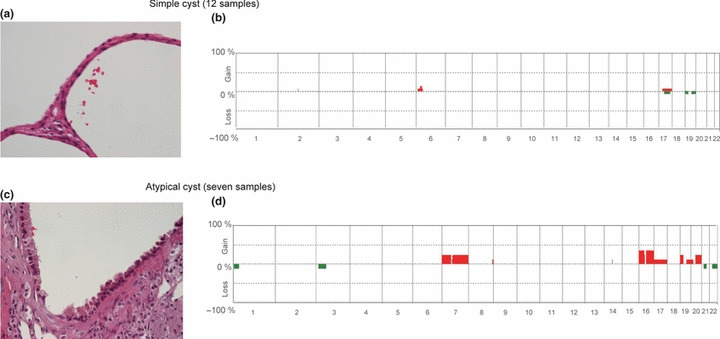
Genome‐wide averaged frequency of genomic imbalance in atypical and simple cysts in patients with renal cell carcinoma (RCC) in end‐stage renal disease (ESRD). (a,c) Histology of a simple (a) and atypical (c) cyst (high‐power view; original magnification ×400). (b,d) Oligonucleotide probes are shown in order from chromosome 1 to 22 within each chromosome for simple (b) and atypical (d) cysts. The frequency (%) of gains (positive values) and losses (negative values) is shown on the y‐axis for each probe.
Discussion
In the present study, we found that cases of RCC‐ESRD could be classified into two clusters, A and B, on the basis of their CNA patterns. This significant difference in the genomic profiles strongly suggests a distinct difference in molecular pathogenesis between the two clusters. Cluster A was comprised mainly of CCRCC‐ESRD. Because the genomic profile of CCRCC‐ESRD resembled that of sporadic CCRCC diagnosed on the basis of histopathology, the molecular mechanisms operating in CCRCC‐ESRD appear to be similar to those in sporadic CCRCC. Indeed, the CNA patterns revealed in the present study are quite similar to those of sporadic CCRCC demonstrated in our previous study.( 14 ) Furthermore, consistent with our proposal, it has already been reported that the karyotype pattern of CCRCC‐ESRD is similar to that of sporadic CCRCC, although the number of cases analyzed is admittedly limited,( 25 , 26 ) and that mutations of the VHL gene that are frequently detected in sporadic CCRCC are also common in CCRCC‐ESRD.( 27 , 28 ) Conversely, Cluster B was found to contain various histologic subtypes, based on the histopathologic classification criteria proposed by Tickoo et al. ( 9 ) We found that cases categorized into Cluster B had CNA patterns similar to those of sporadic PRCC, suggesting that, although Cluster B contains various histologic subtypes, its genomic profile has features in common with that of PRCC. To our knowledge, this is the first report to uncover the pattern of genomic CNAs of RCC‐ESRD using array CGH analysis of multiple samples, although array CGH data of a few cases have been reported previously.( 29 ) However, because only 63 cases were analyzed in the present study, we cannot rule out the possibility that clustering/classification may have an overfitting to the cohort used in the present study. To confirm our present proposal, further analyses using additional cases are needed.
Various histologic subtypes, including ACD‐associated RCC, clear cell papillary RCC, and PRCC, have been proposed by Tickoo et al. ( 9 ) However, in the present study we were unable to identify any subgroups in Cluster B. We also found that the genomic profiles of ACD‐associated RCC, clear cell papillary RCC and PRCC‐ESRD, as a whole, exhibited patterns similar to one another. Furthermore, these histologic subtypes categorized as Cluster B were frequently found to coexist in one tissue. Thus, although it has been proposed that these subtypes are distinct from one another on the basis of histology,( 9 , 30 ) the present genomic data enable us to speculate that they share similar molecular mechanisms. Interestingly, however, the frequencies of gains at 17q and 1q in PRCC‐ESRD were significantly higher than those in clear cell papillary RCC and ACD‐associated RCC, respectively, suggesting that addition of these gains may be involved in the pathogenesis of PRCC‐ESRD.
Ishikawa compared the clinical characteristics of RCC‐ESRD patients who had undergone dialysis for >20 years with those who had undergone dialysis for <10 years, and found that patients with a longer duration of dialysis were younger, more often had acquired cysts, and more often had PRCC.( 31 ) Furthermore, Nouh et al. have reported that CCRCC is more common in patients who have been on dialysis for ≤10 years, but, in those who have been on dialysis for >10 years, ACD‐associated RCC is more common.( 4 ) It has been hypothesized that ACDK is the precursor of a proportion of RCC‐ESRD, because a build‐up of uremic metabolites, oxidative stress, and growth factors may lead to impairment of DNA repair mechanisms and an increased frequency of hypermethylation of tumor suppressor genes, thus resulting in carcinogenesis.( 1 , 23 , 32 ) Therefore, our present findings, in addition to those of previous studies, enable us to speculate that dialysis for longer periods may be associated with specific genomic aberrations that may cause PRCC‐ESRD, ACD‐associated RCC, and clear cell papillary RCC. Furthermore, in the present study we found that CNAs in atypical cysts resemble those of PRCC‐ESRD, ACD‐associated RCC, and clear cell papillary RCC, leading us to hypothesize that atypical cysts are a precursor of these tumors.
Disclosure Statement
The authors have no conflict of interest to declare.
Supporting information
Supporting info item
Supporting info item
Supporting info item
Supporting info item
Supporting info item
Supporting info item
Supporting info item
Supporting info item
Supporting info item
Supporting info item
Acknowledgments
This research was supported, in part, by Grants‐in‐Aid for Scientific Research (to K.M.; no. 21590373) and Technology (to Y.N.; no. 20590368) from the Japanese Ministry of Education, Culture, Sports and Science.
References
- 1. Ishikawa I. Uremic acquired renal cystic disease. Natural history and complications. Nephron 1991; 58: 257–67. [DOI] [PubMed] [Google Scholar]
- 2. Doublet JD, Peraldi MN, Gattegno B, Thibault P, Sraer JD. Renal cell carcinoma of native kidneys: prospective study of 129 renal transplant patients. J Urol 1997; 158: 42–4. [DOI] [PubMed] [Google Scholar]
- 3. Terasawa Y, Suzuki Y, Morita M, Kato M, Suzuki K, Sekino H. Ultrasonic diagnosis of renal cell carcinoma in hemodialysis patients. J Urol 1994; 152: 846–51. [DOI] [PubMed] [Google Scholar]
- 4. Nouh MA, Kuroda N, Yamashita M et al. Renal cell carcinoma in patients with end‐stage renal disease: relationship between histological type and duration of dialysis. BJU Int 2010; 105: 620–7. [DOI] [PubMed] [Google Scholar]
- 5. Ianhez LE, Lucon M, Nahas WC et al. Renal cell carcinoma in renal transplant patients. Urology 2007; 69: 462–4. [DOI] [PubMed] [Google Scholar]
- 6. Moudouni SM, Lakmichi A, Tligui M et al. Renal cell carcinoma of native kidney in renal transplant recipients. BJU Int 2006; 98: 298–302. [DOI] [PubMed] [Google Scholar]
- 7. Denton MD, Magee CC, Ovuworie C et al. Prevalence of renal cell carcinoma in patients with ESRD pre‐transplantation: a pathologic analysis. Kidney Int 2002; 61: 2201–9. [DOI] [PubMed] [Google Scholar]
- 8. Ishikawa I, Kovacs G. High incidence of papillary renal cell tumours in patients on chronic haemodialysis. Histopathology 1993; 22: 135–9. [DOI] [PubMed] [Google Scholar]
- 9. Tickoo SK, dePeralta‐Venturina MN, Harik LR et al. Spectrum of epithelial neoplasms in end‐stage renal disease: an experience from 66 tumor‐bearing kidneys with emphasis on histologic patterns distinct from those in sporadic adult renal neoplasia. Am J Surg Pathol 2006; 30: 141–53. [DOI] [PubMed] [Google Scholar]
- 10. Gobbo S, Eble JN, Grignon DJ et al. Clear cell papillary renal cell carcinoma: a distinct histopathologic and molecular genetic entity. Am J Surg Pathol 2008; 32: 1239–45. [DOI] [PubMed] [Google Scholar]
- 11. Gunawan B, Huber W, Holtrup M et al. Prognostic impacts of cytogenetic findings in clear cell renal cell carcinoma: gain of 5q31‐qter predicts a distinct clinical phenotype with favorable prognosis. Cancer Res 2001; 61: 7731–8. [PubMed] [Google Scholar]
- 12. Klatte T, Rao PN, de Martino M et al. Cytogenetic profile predicts prognosis of patients with clear cell renal cell carcinoma. J Clin Oncol 2009; 27: 746–53. [DOI] [PubMed] [Google Scholar]
- 13. Toma MI, Grosser M, Herr A et al. Loss of heterozygosity and copy number abnormality in clear cell renal cell carcinoma discovered by high‐density Affymetrix 10K single nucleotide polymorphism mapping array. Neoplasia 2008; 10: 634–42. [DOI] [PMC free article] [PubMed] [Google Scholar]
- 14. Yoshimoto T, Matsuura K, Karnan S et al. High‐resolution analysis of DNA copy number alterations and gene expression in renal clear cell carcinoma. J Pathol 2007; 213: 392–401. [DOI] [PubMed] [Google Scholar]
- 15. Gunawan B, von Heydebreck A, Fritsch T et al. Cytogenetic and morphologic typing of 58 papillary renal cell carcinomas: evidence for a cytogenetic evolution of type 2 from type 1 tumors. Cancer Res 2003; 63: 6200–5. [PubMed] [Google Scholar]
- 16. Kim HJ, Shen SS, Ayala AG et al. Virtual‐karyotyping with SNP microarrays in morphologically challenging renal cell neoplasms: a practical and useful diagnostic modality. Am J Surg Pathol 2009; 33: 1276–86. [DOI] [PubMed] [Google Scholar]
- 17. Klatte T, Pantuck AJ, Said JW et al. Cytogenetic and molecular tumor profiling for type 1 and type 2 papillary renal cell carcinoma. Clin Cancer Res 2009; 15: 1162–9. [DOI] [PubMed] [Google Scholar]
- 18. Cossu‐Rocca P, Eble JN, Zhang S, Martignoni G, Brunelli M, Cheng L. Acquired cystic disease‐associated renal tumors: an immunohistochemical and fluorescence in situ hybridization study. Mod Pathol 2006; 19: 780–7. [DOI] [PubMed] [Google Scholar]
- 19. Eble JN. Tumors of the kidney In: Eble JN, Sauter G, Epstein JI. et al. eds. World Health Organization Classification of Tumours: Pathology and Genetics of Tumours of the Urinary System and Male Genital Organs. Lyon: IARC Press, 2004, 9–87. [Google Scholar]
- 20. Amin MB, MacLennan GT, Gupta R et al. Tubulocystic carcinoma of the kidney: clinicopathologic analysis of 31 cases of a distinctive rare subtype of renal cell carcinoma. Am J Surg Pathol 2009; 33: 384–92. [DOI] [PubMed] [Google Scholar]
- 21. Uchida M, Tsukamoto Y, Uchida T et al. Genomic profiling of gastric carcinoma in situ and adenomas by array‐based comparative genomic hybridization. J Pathol 2010; 221: 96–105. [DOI] [PubMed] [Google Scholar]
- 22. Choyke PL. Acquired cystic kidney disease. Eur Radiol 2000; 10: 1716–21. [DOI] [PubMed] [Google Scholar]
- 23. Ishikawa I. Acquired cystic disease of the kidney and renal cell carcinoma. Tokyo: Springer, 2007; 57–8. [Google Scholar]
- 24. Cheuk W, Lo ES, Chan AK, Chan JK. Atypical epithelial proliferations in acquired renal cystic disease harbor cytogenetic aberrations. Hum Pathol 2002; 33: 761–5. [DOI] [PubMed] [Google Scholar]
- 25. Chudek J, Herbers J, Wilhelm M et al. The genetics of renal tumors in end‐stage renal failure differs from those occurring in the general population. J Am Soc Nephrol 1998; 9: 1045–51. [DOI] [PubMed] [Google Scholar]
- 26. Gronwald J, Baur AS, Holtgreve‐Grez H et al. Chromosomal abnormalities in renal cell neoplasms associated with acquired renal cystic disease. A series studied by comparative genomic hybridization and fluorescence in situ hybridization. J Pathol 1999; 187: 308–12. [DOI] [PubMed] [Google Scholar]
- 27. Inoue H, Nonomura N, Kojima Y et al. Somatic mutations of the von Hippel–Lindau disease gene in renal carcinomas occurring in patients with long‐term dialysis. Nephrol Dial Transplant 2007; 22: 2052–5. [DOI] [PubMed] [Google Scholar]
- 28. Yoshida M, Yao M, Ishikawa I et al. Somatic von Hippel–Lindau disease gene mutation in clear‐cell renal carcinomas associated with end‐stage renal disease/acquired cystic disease of the kidney. Genes Chromosom Cancer 2002; 35: 359–64. [DOI] [PubMed] [Google Scholar]
- 29. Kuroda N, Shiotsu T, Hes O, Michal M, Shuin T, Lee GH. Acquired cystic disease‐associated renal cell carcinoma with gain of chromosomes 3, 7, and 16, gain of chromosome X, and loss of chromosome Y. Med Mol Morphol 2010; 43: 231–4. [DOI] [PubMed] [Google Scholar]
- 30. Sule N, Yakupoglu U, Shen SS et al. Calcium oxalate deposition in renal cell carcinoma associated with acquired cystic kidney disease: a comprehensive study. Am J Surg Pathol 2005; 29: 443–51. [DOI] [PubMed] [Google Scholar]
- 31. Ishikawa I. Present status of renal cell carcinoma in dialysis patients in Japan: questionnaire study in 2002. Nephron Clin Pract 2004; 97: c11–6. [DOI] [PubMed] [Google Scholar]
- 32. Hori Y, Oda Y, Kiyoshima K et al. Oxidative stress and DNA hypermethylation status in renal cell carcinoma arising in patients on dialysis. J Pathol 2007; 212: 218–26. [DOI] [PubMed] [Google Scholar]
Associated Data
This section collects any data citations, data availability statements, or supplementary materials included in this article.
Supplementary Materials
Supporting info item
Supporting info item
Supporting info item
Supporting info item
Supporting info item
Supporting info item
Supporting info item
Supporting info item
Supporting info item
Supporting info item