

Abstract
Visualizing biomolecular and cellular processes inside intact living organisms is a major goal of chemical biology. However, existing molecular biosensors, based primarily on fluorescent emission, have limited utility in this context due to the scattering of light by tissue. In contrast, ultrasound can easily image deep tissue with high spatiotemporal resolution, but lacks the biosensors needed to connect its contrast to the activity of specific biomolecules such as enzymes. To overcome this limitation, we introduce the first genetically encodable acoustic biosensors - molecules that ‘light up’ in ultrasound imaging in response to protease activity. These biosensors are based on a unique class of air-filled protein nanostructures called gas vesicles, which we engineered to produce non-linear ultrasound signals in response to the activity of three different protease enzymes. We demonstrate the ability of these biosensors to be imaged in vitro, inside engineered probiotic bacteria, and in vivo in the mouse gastrointestinal tract.
INTRODUCTION
Virtually every biological process in living organisms involves dynamic changes in the concentration or activity of specific molecules. Visualizing these changes within the context of intact living tissues is critical to expanding our understanding of biological function and developing next-generation medicines. A large repertoire of genetically encoded fluorescent sensors has been developed to image specific molecular and cellular events1–4. However, deploying such biosensors in living organisms is challenging due to the limited penetration of light in tissue5. In contrast, non-invasive techniques such as ultrasound are capable of imaging deep tissues with high spatial and temporal resolution (below 100 μm and 1 ms, respectively)6. However, ultrasound currently lacks the sensors needed to observe dynamic molecular activity.
Here, we introduce molecular biosensors for ultrasound based on gas vesicles (GVs), a unique class of air-filled protein nanostructures that were recently established as genetically encodable imaging agents for ultrasound7,8. GVs evolved in certain aquatic microbes as a means to regulate cellular buoyancy for optimal photosynthetic illumination9. GV nanostructures comprise a 2 nm-thick protein shell enclosing an air-filled compartment, with genetically determined widths between 45–250 nm and lengths of several hundred nm9,10. The low density and high compressibility of GVs relative to surrounding aqueous media allows these proteins to scatter sound waves and thereby produce ultrasound contrast when injected into the body or expressed heterologously in engineered cells7,8,11,12.
We hypothesized that we could engineer GV-based biosensors that dynamically change their ultrasound contrast in response to the activity of specific biomolecules. This possibility arises from the recent discovery that GVs’ acoustic properties can be modified at the level of their constituent proteins12. In particular, the scaffolding protein GvpC, which sits on the GV surface (Fig. 1a) and provides structural reinforcement13, can be modified at the level of its amino acid sequence to change GV mechanics. For example, shortening or removing GvpC makes GVs less rigid, allowing them to buckle more easily under acoustic pressure12,14. This reversible buckling produces nonlinear ultrasound contrast, which appropriate ultrasound pulse sequences readily distinguish from the linear signals produced by non-buckling GVs and background tissue14,15.
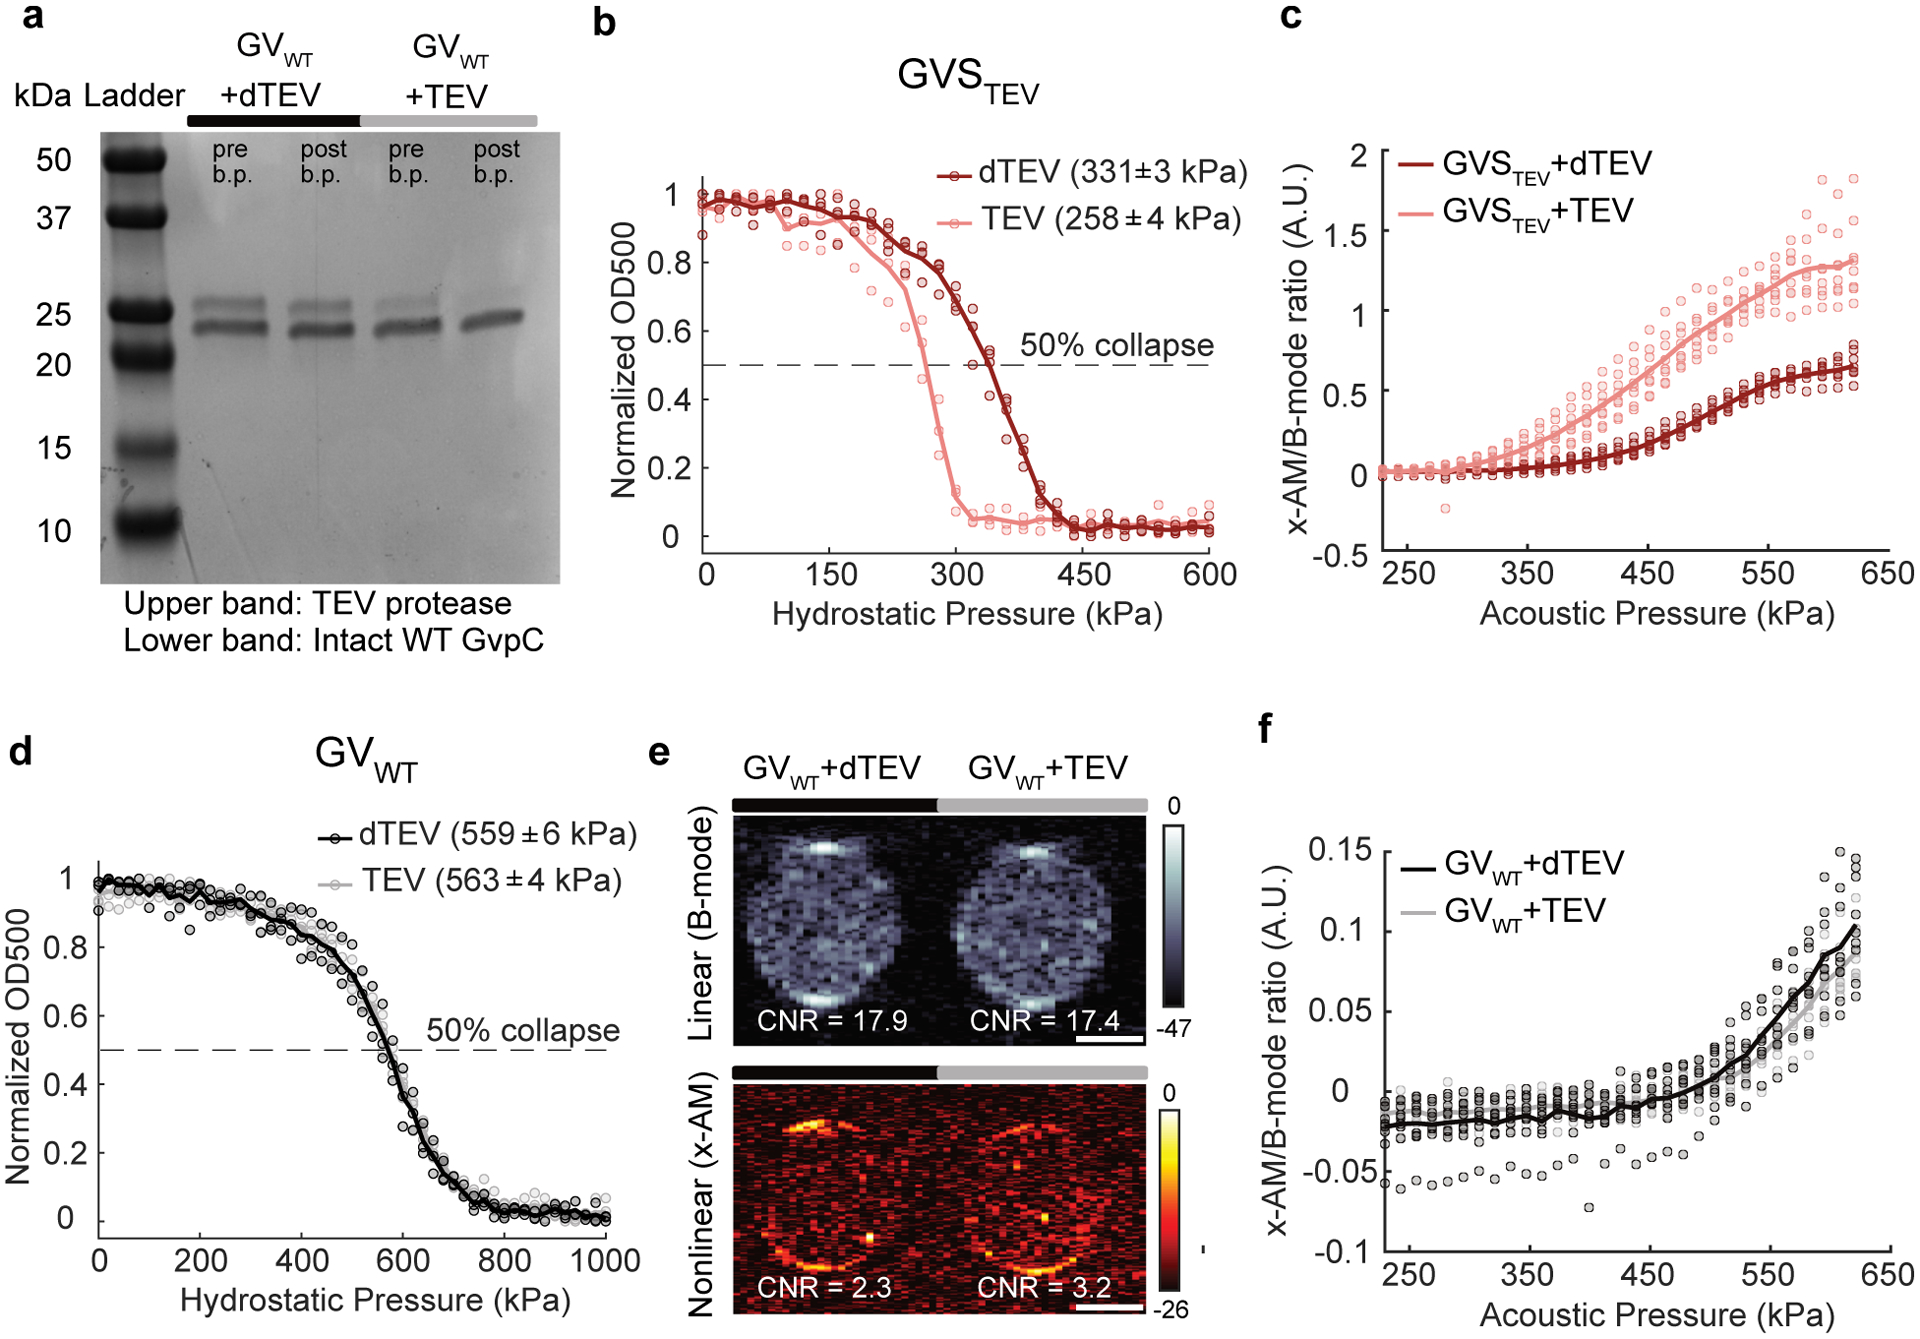
Figure 1: Acoustic biosensor of TEV endopeptidase.
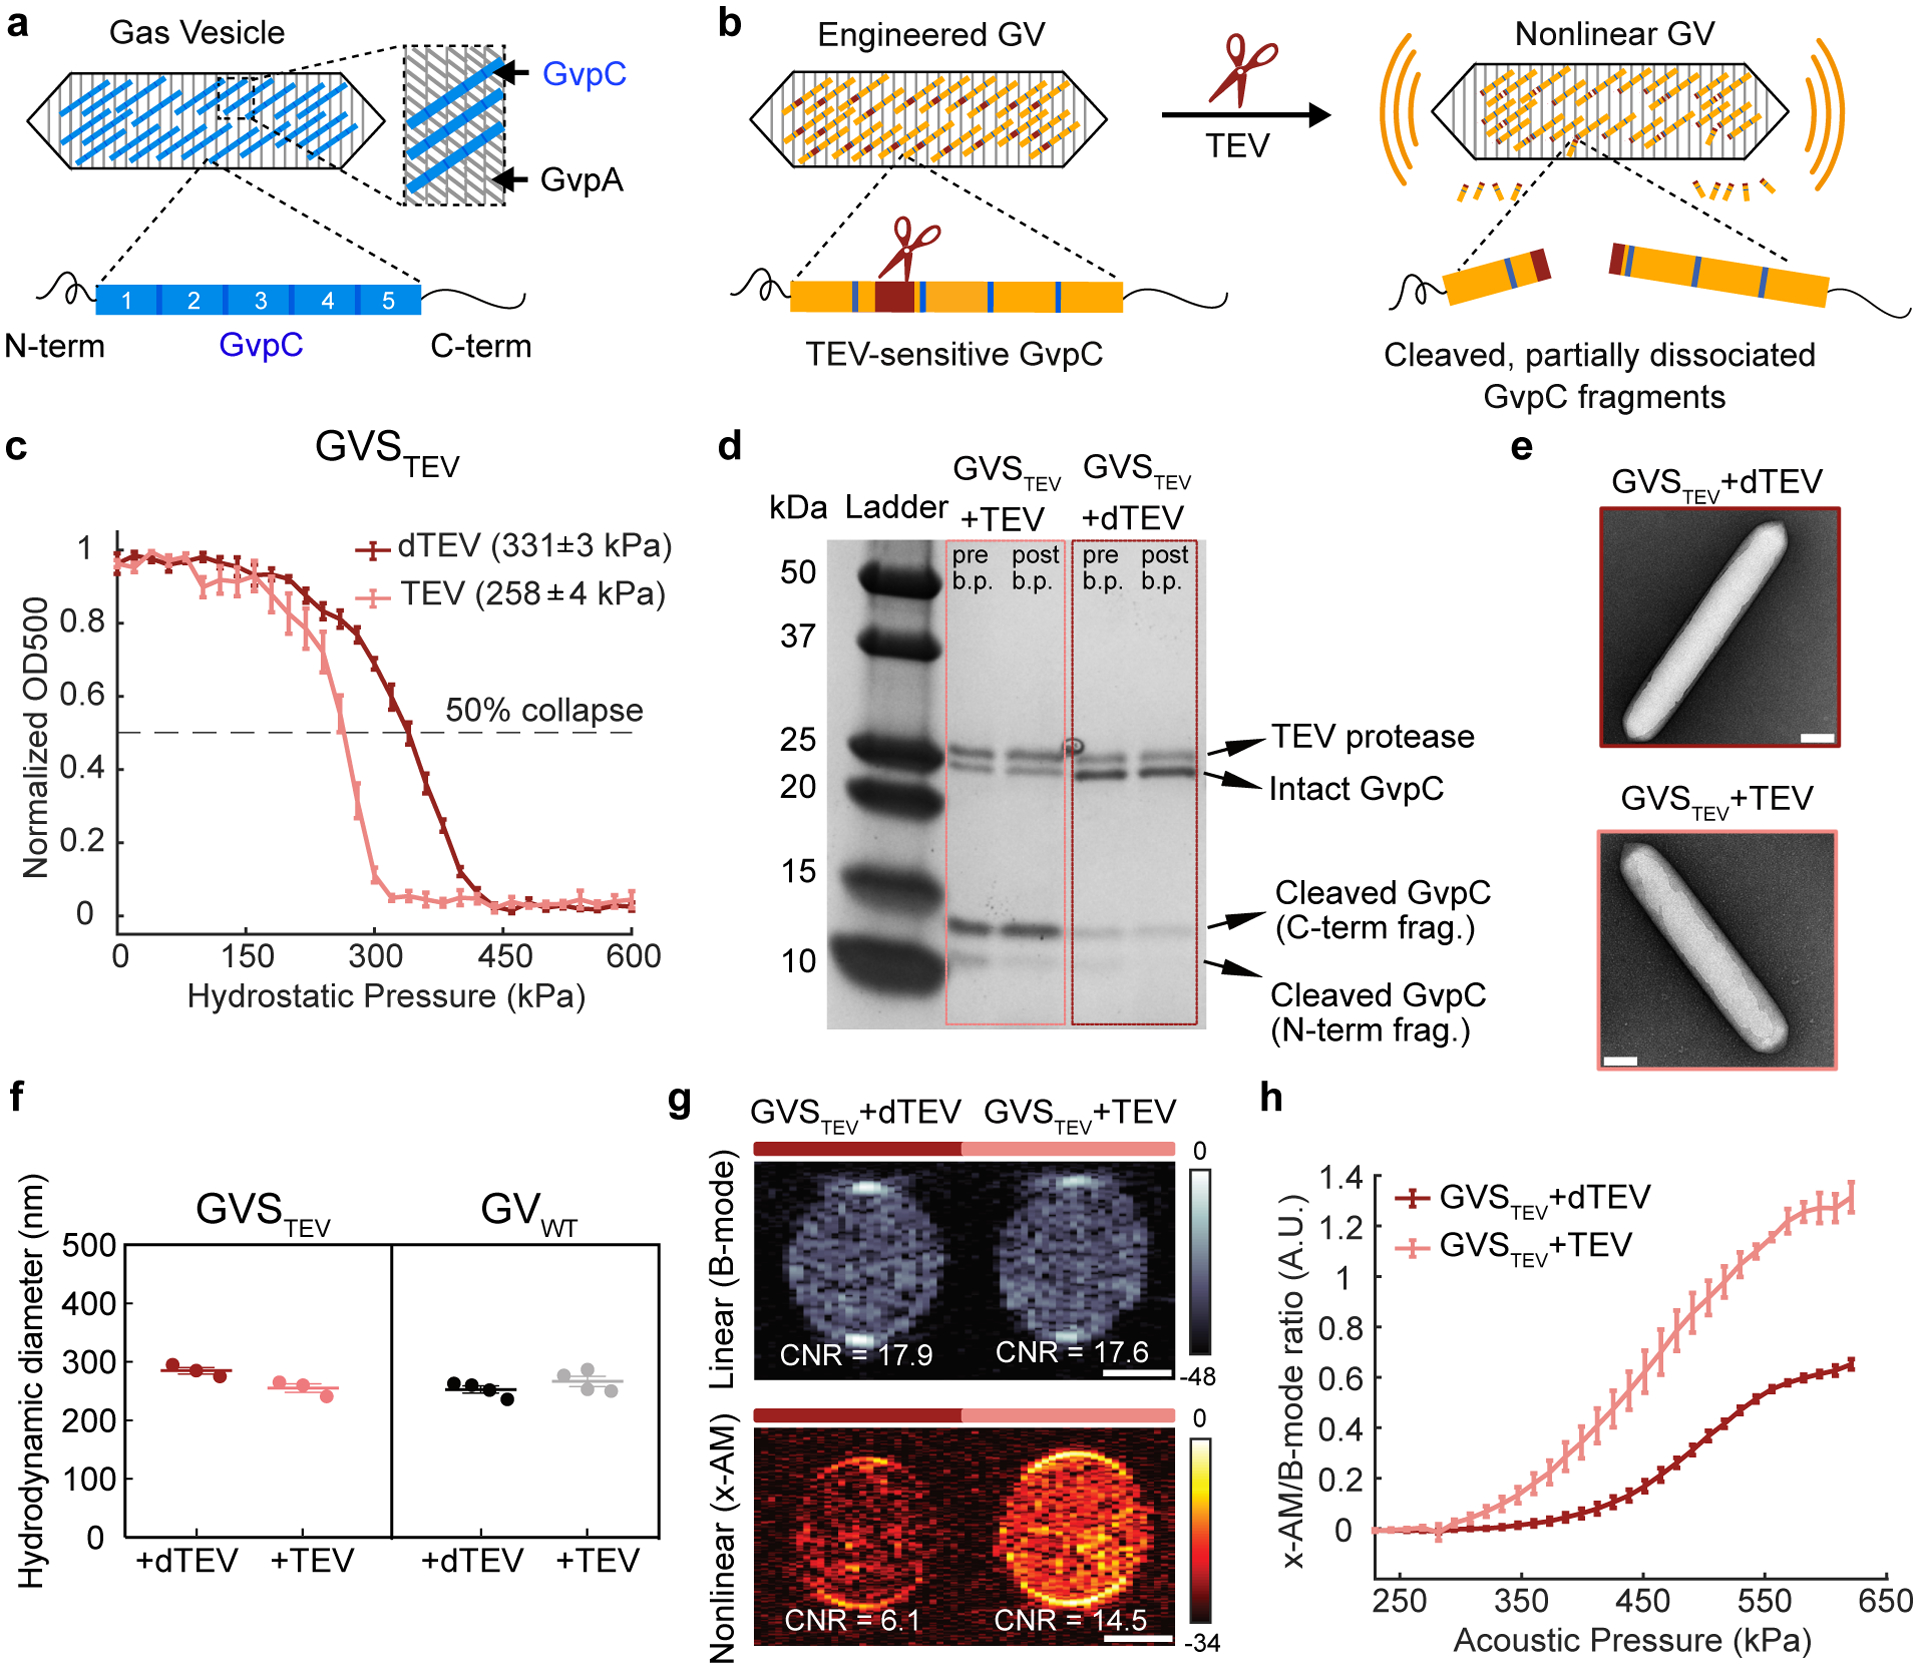
(a) Top: schematic of a gas vesicle (GV), including the primary shell protein GvpA (gray) and the reinforcing protein GvpC (blue). Bottom: schematic of GvpC structure, comprising five 33-amino acid repeats flanked by N-and C-terminal regions. (b) Schematic of GVSTEV. (c) Normalized OD500nm of GVSTEV as a function of hydrostatic pressure, after incubation with active TEV or heat-inactivated TEV (dTEV). The legend lists the midpoint collapse pressure for each condition (±95% confidence interval), determined from fitting a Boltzmann sigmoid function (N = 3 biological replicates for GVSTEV + TEV and 4 for GVSTEV + dTEV). (d) Coomassie-stained SDS-PAGE gel of OD500nm-matched samples of GVSTEV incubated with dTEV or active TEV protease, before and after buoyancy purification (labeled pre b.p. and post b.p., respectively). This experiment was repeated 3 times with similar results. (e) Representative TEM images of GVSTEV after incubation with dTEV or active TEV protease (N=3 biological replicates for GVSTEV + TEV and 2 for GVSTEV + dTEV; at least 100 GV particles were imaged for each condition). (f) DLS measurements of the average hydrodynamic diameter of GVSTEV and GVWT samples after protease incubation (N = 3 biological replicates for GVSTEV and 4 for GVWT; individual dots represent each N, and thick horizontal line indicates the mean). (g) Representative ultrasound images of agarose phantoms containing GVSTEV incubated with TEV or dTEV protease at OD500nm 2.2. The linear (B-mode) image was acquired at 132 kPa and the nonlinear (x-AM) image was acquired at 438 kPa. (h) Average ratio of x-AM to B-mode ultrasound signal as a function of applied acoustic pressure for GVSTEV, after incubation with TEV or dTEV protease. N=3 biological replicates, with each N consisting of 2–3 technical replicates for g and h. For ultrasound images in g, CNR stands for contrast-to-noise-ratio, and color bars represent relative ultrasound signal intensity on the dB scale. Solid curves represent the mean in c and h. Error bars in c, f and h indicate SEM and were calculated from independent biological replicates. Scale bars in e represent 100 nm. Scale bars in g represent 1 mm. Individual data points for panels c and h shown as scatter plots in Extended Data Figure 1.
As an initial target for acoustic biosensor development, we chose proteases - an important class of enzymes involved in many aspects of cellular signaling, homeostasis, disease, therapy and synthetic biology16–22. While these enzymes were the targets of some of the first fluorescent biosensors23,24, and continue to be a major focus of sensor engineering25, no acoustic biosensors of protease activity have been developed. We postulated that by engineering variants of GvpC incorporating amino acid sequences that are recognized and acted upon by specific proteases, we could generate GVs whose nonlinear ultrasound contrast becomes activated by protease activity. As representative targets, we selected the constitutively active tobacco etch virus (TEV) endopeptidase, the calcium-dependent mammalian protease calpain, and the processive bacterial protease ClpXP. We set out to test the ability of acoustic biosensors engineered to respond to each of these enzymes to reveal their activity under ultrasound, and to demonstrate biosensor imaging in vitro, in living engineered cells, and in vivo in the mouse gastrointestinal (GI) tract.
RESULTS
Engineering an acoustic sensor of TEV endopeptidase
We selected the TEV endopeptidase as our first sensing target because of its well-characterized recognition sequence and widespread use in biochemistry and synthetic biology26,27. To sense TEV activity, we engineered a GvpC variant containing the TEV recognition motif ENLYFQ’G (Fig. 1b), hypothesizing that the cleavage of GvpC into two smaller segments would cause the GV shell to become less stiff, thereby allowing it to undergo buckling and produce enhanced nonlinear ultrasound contrast. We implemented this design in vitro using GVs from Anabaena flos-aque (Ana), whose native GvpC can be removed after GV isolation, and replaced with new versions expressed heterologously in Escherichia coli12,28. Ana GvpC comprises five repeats of a predicted alpha-helical polypeptide (Fig. 1a), and we tested insertions of the TEV recognition sequence, with and without flexible linkers of different lengths, at several locations within this protein. After incubating the engineered GVs with active TEV protease or a heat-inactivated “dead” control (dTEV), we measured their hydrostatic collapse using pressurized absorbance spectroscopy. This technique measures the optical density of GVs (which scatter 500 nm light when intact) under increasing hydrostatic pressure, providing a quick assessment of GV shell mechanics: GVs that collapse at lower pressures also produce more nonlinear contrast7,8,12,28. Using this approach, we identified an engineered GV variant that showed ~ 70 kPa reduction in its collapse pressure midpoint upon incubation with the active TEV protease (Fig. 1c and Extended Data Fig. 1), and selected it for further characterization. This GV sensor for TEV, hereafter referred to as GVSTEV, has the TEV cleavage site on the second repeat of GvpC, flanked by flexible GSGSGSG linkers on both sides.
TEV cleavage of the GvpC on GVSTEV is expected to produce N- and C-terminal fragments with molecular weights of approximately 9 and 14 kDa, respectively. Indeed, gel electrophoresis of GVSTEV after exposure to active TEV resulted in the appearance of the two cleaved GvpC fragments and a significant reduction in the intact GvpC band intensity (Fig. 1d). In addition, removal from solution of unbound fragments via buoyancy purification of the GVs resulted in a reduced band intensity for the N-terminal cleavage fragment, indicating its partial dissociation after cleavage (Fig. 1d). No significant changes in the GvpC band intensity were observed after incubation with dTEV. Transmission electron microscopy (TEM) images showed intact GVs with similar appearance under both conditions, confirming that protease cleavage did not affect the structure of the underlying GV shell (Fig. 1e). Dynamic light scattering (DLS) showed no significant difference in the hydrodynamic diameter of the engineered GVs after incubation with dTEV and active TEV protease, confirming that the GVs remain dispersed in solution (Fig. 1f).
After confirming the desired mechanical and biochemical properties of GVSTEV, we imaged it by ultrasound. Nonlinear imaging was performed in hydrogel samples containing the biosensor, using a recently developed cross-amplitude modulation (x-AM) pulse sequence15. x-AM uses pairs of cross-propagating plane waves to elicit highly specific nonlinear scattering from buckling GVs at the wave intersection, while subtracting the linear signal generated by transmitting each wave on its own15. Linear images were acquired using a conventional B-mode sequence. As hypothesized, exposing the GVSTEV samples to TEV protease produced a strong nonlinear acoustic response, with a maximal contrast-to-noise ratio (CNR) enhancement of ~ 7 dB at an applied acoustic pressure of 438 kPa (Fig. 1g). Substantially less nonlinear contrast was observed in controls exposed to dTEV, while, as expected, both samples produced similar linear scattering. Consistent with the pressure-dependent mechanics of the GV shell, the differential nonlinear acoustic response of GVSTEV became evident at pressures above 295 kPa, and kept increasing until 556 kPa, at which point the GVs began to collapse (Fig. 1h and Extended Data Fig. 1). As an additional control, we found that GVs with the wild-type GvpC sequence (GVWT) showed no difference in their hydrostatic collapse pressure or nonlinear acoustic contrast in response to TEV protease (Extended Data Fig. 1), and no wild-type GvpC cleavage was seen upon gel electrophoresis (Extended Data Fig. 1). These results established GVSTEV as an acoustic biosensor of the TEV protease enzyme, and additionally provided an experimental template to develop additional sensors.
Engineering an acoustic sensor of calpain
After validating our basic acoustic biosensor design using the model TEV protease, we examined its generalizability to other endopeptidases. As our second target, we selected the calcium-dependent cysteine protease calpain, a mammalian enzyme with critical roles in a wide range of cell types29–31. The two most abundant isoforms of this protease, known as μ-calpain and m-calpain, are expressed in many tissues and involved in processes ranging from neuronal synaptic plasticity to cellular senescence29,30. We designed an acoustic biosensor of μ-calpain by inserting the α-spectrin-derived recognition sequence QQEVY’GMMPRD32 into Ana GvpC (Fig. 2a). We screened several versions of GvpC incorporating this cleavage sequence, flanked by GSG or GSGSG linkers, at different positions within the second helical repeat. Pressurized absorbance spectroscopy performed in buffers with and without calpain and Ca2+ allowed us to identify a GV sensor for calpain (GVScalp), showing an approximately 50 kPa decrease in hydrostatic collapse pressure in the presence of the enzyme and its ionic activator (Fig. 2b and Extended Data Fig. 2). Electrophoretic analysis confirmed cleavage and partial dissociation of the cleaved fragments from the GV surface (Extended Data Fig. 2), while TEM showed no change in GV morphology (Extended Data Fig. 2).
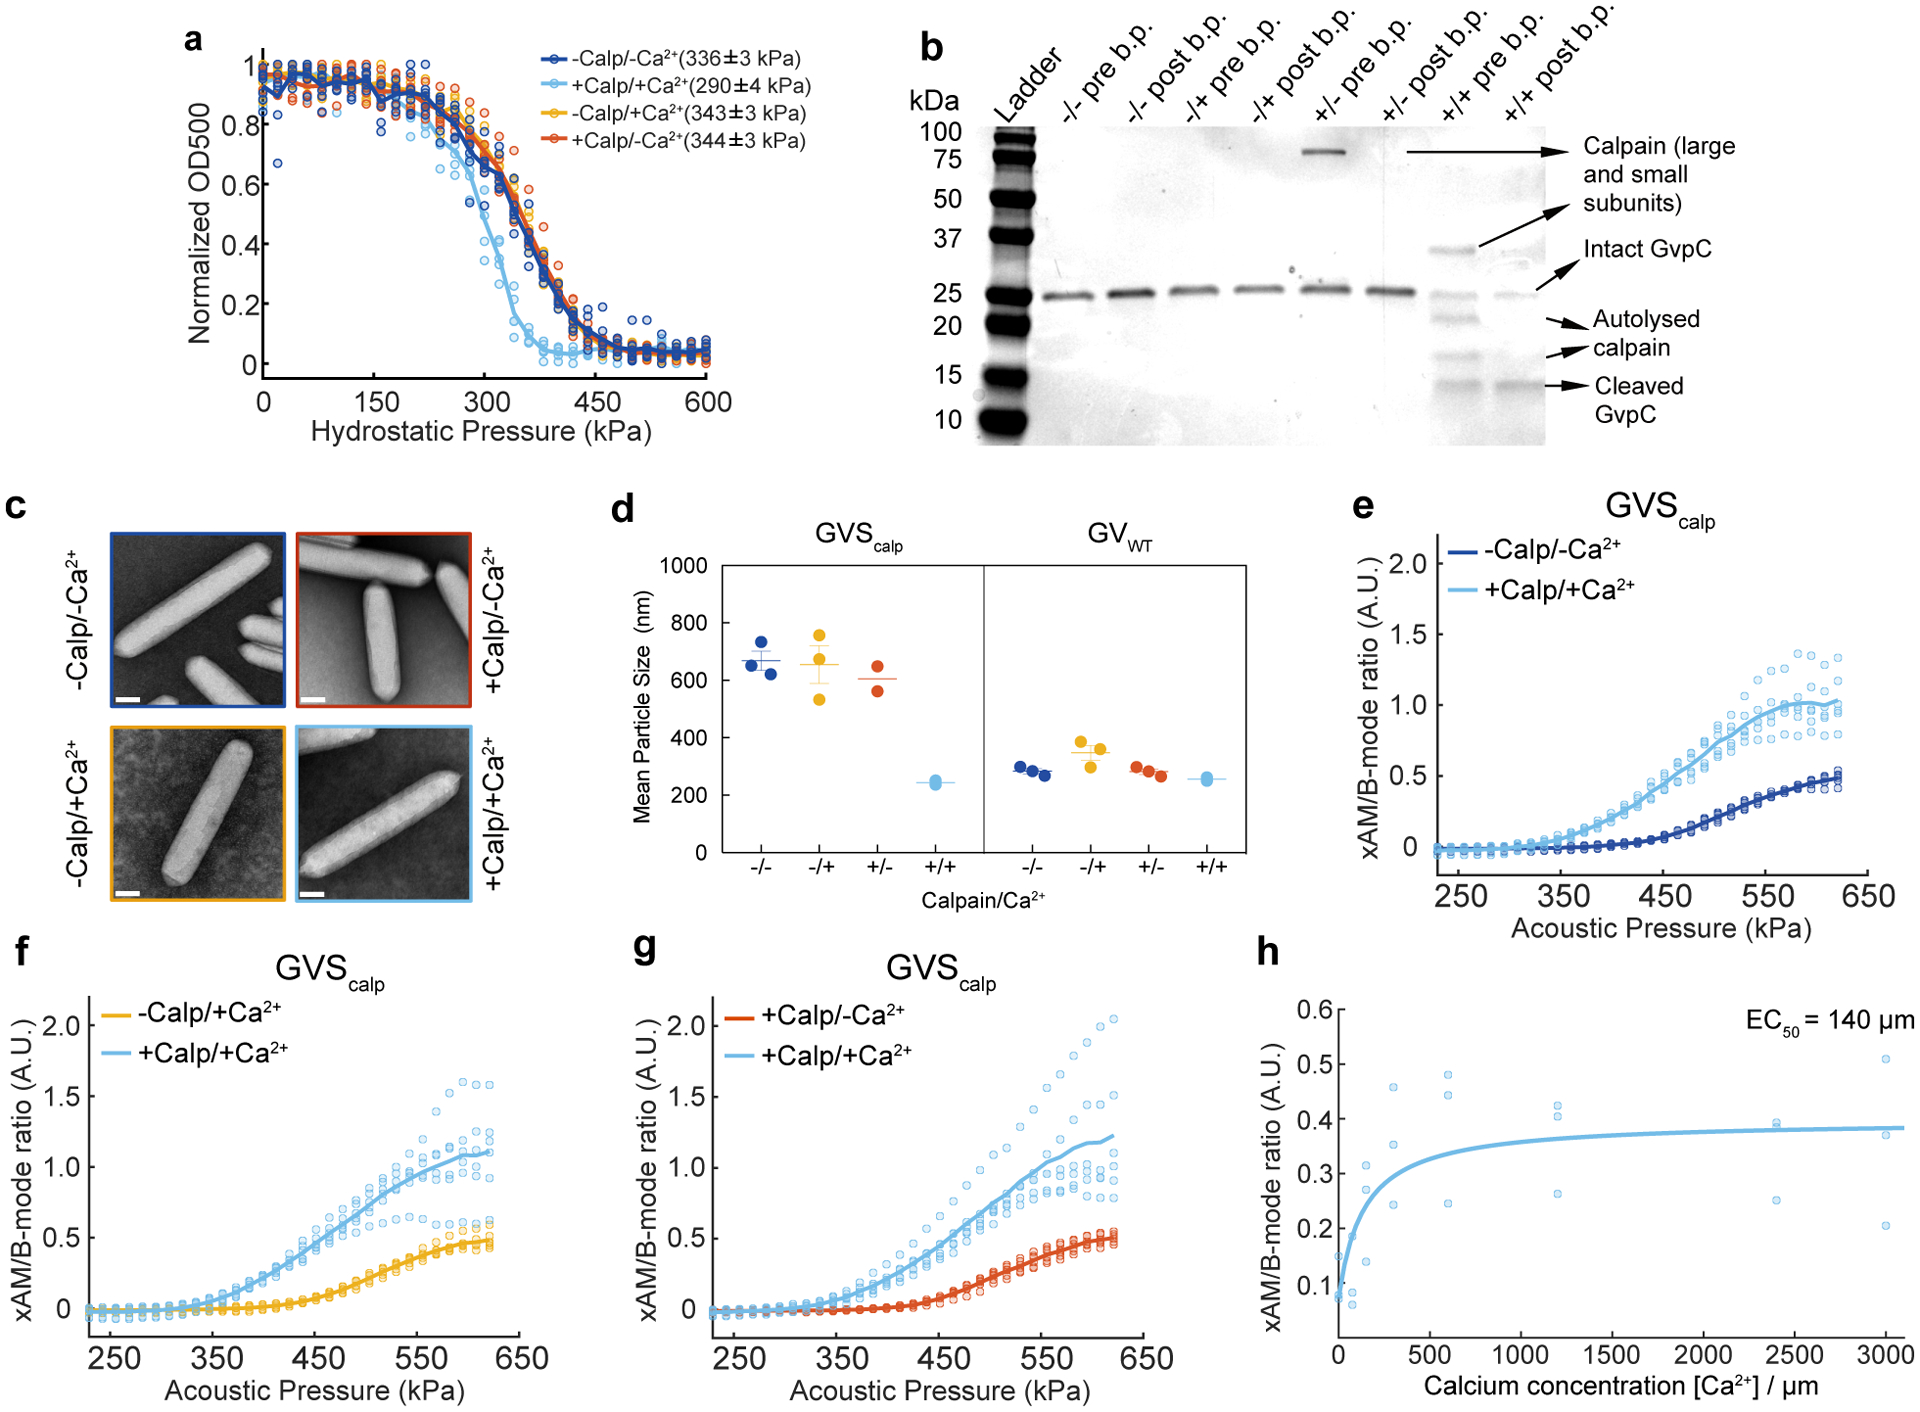
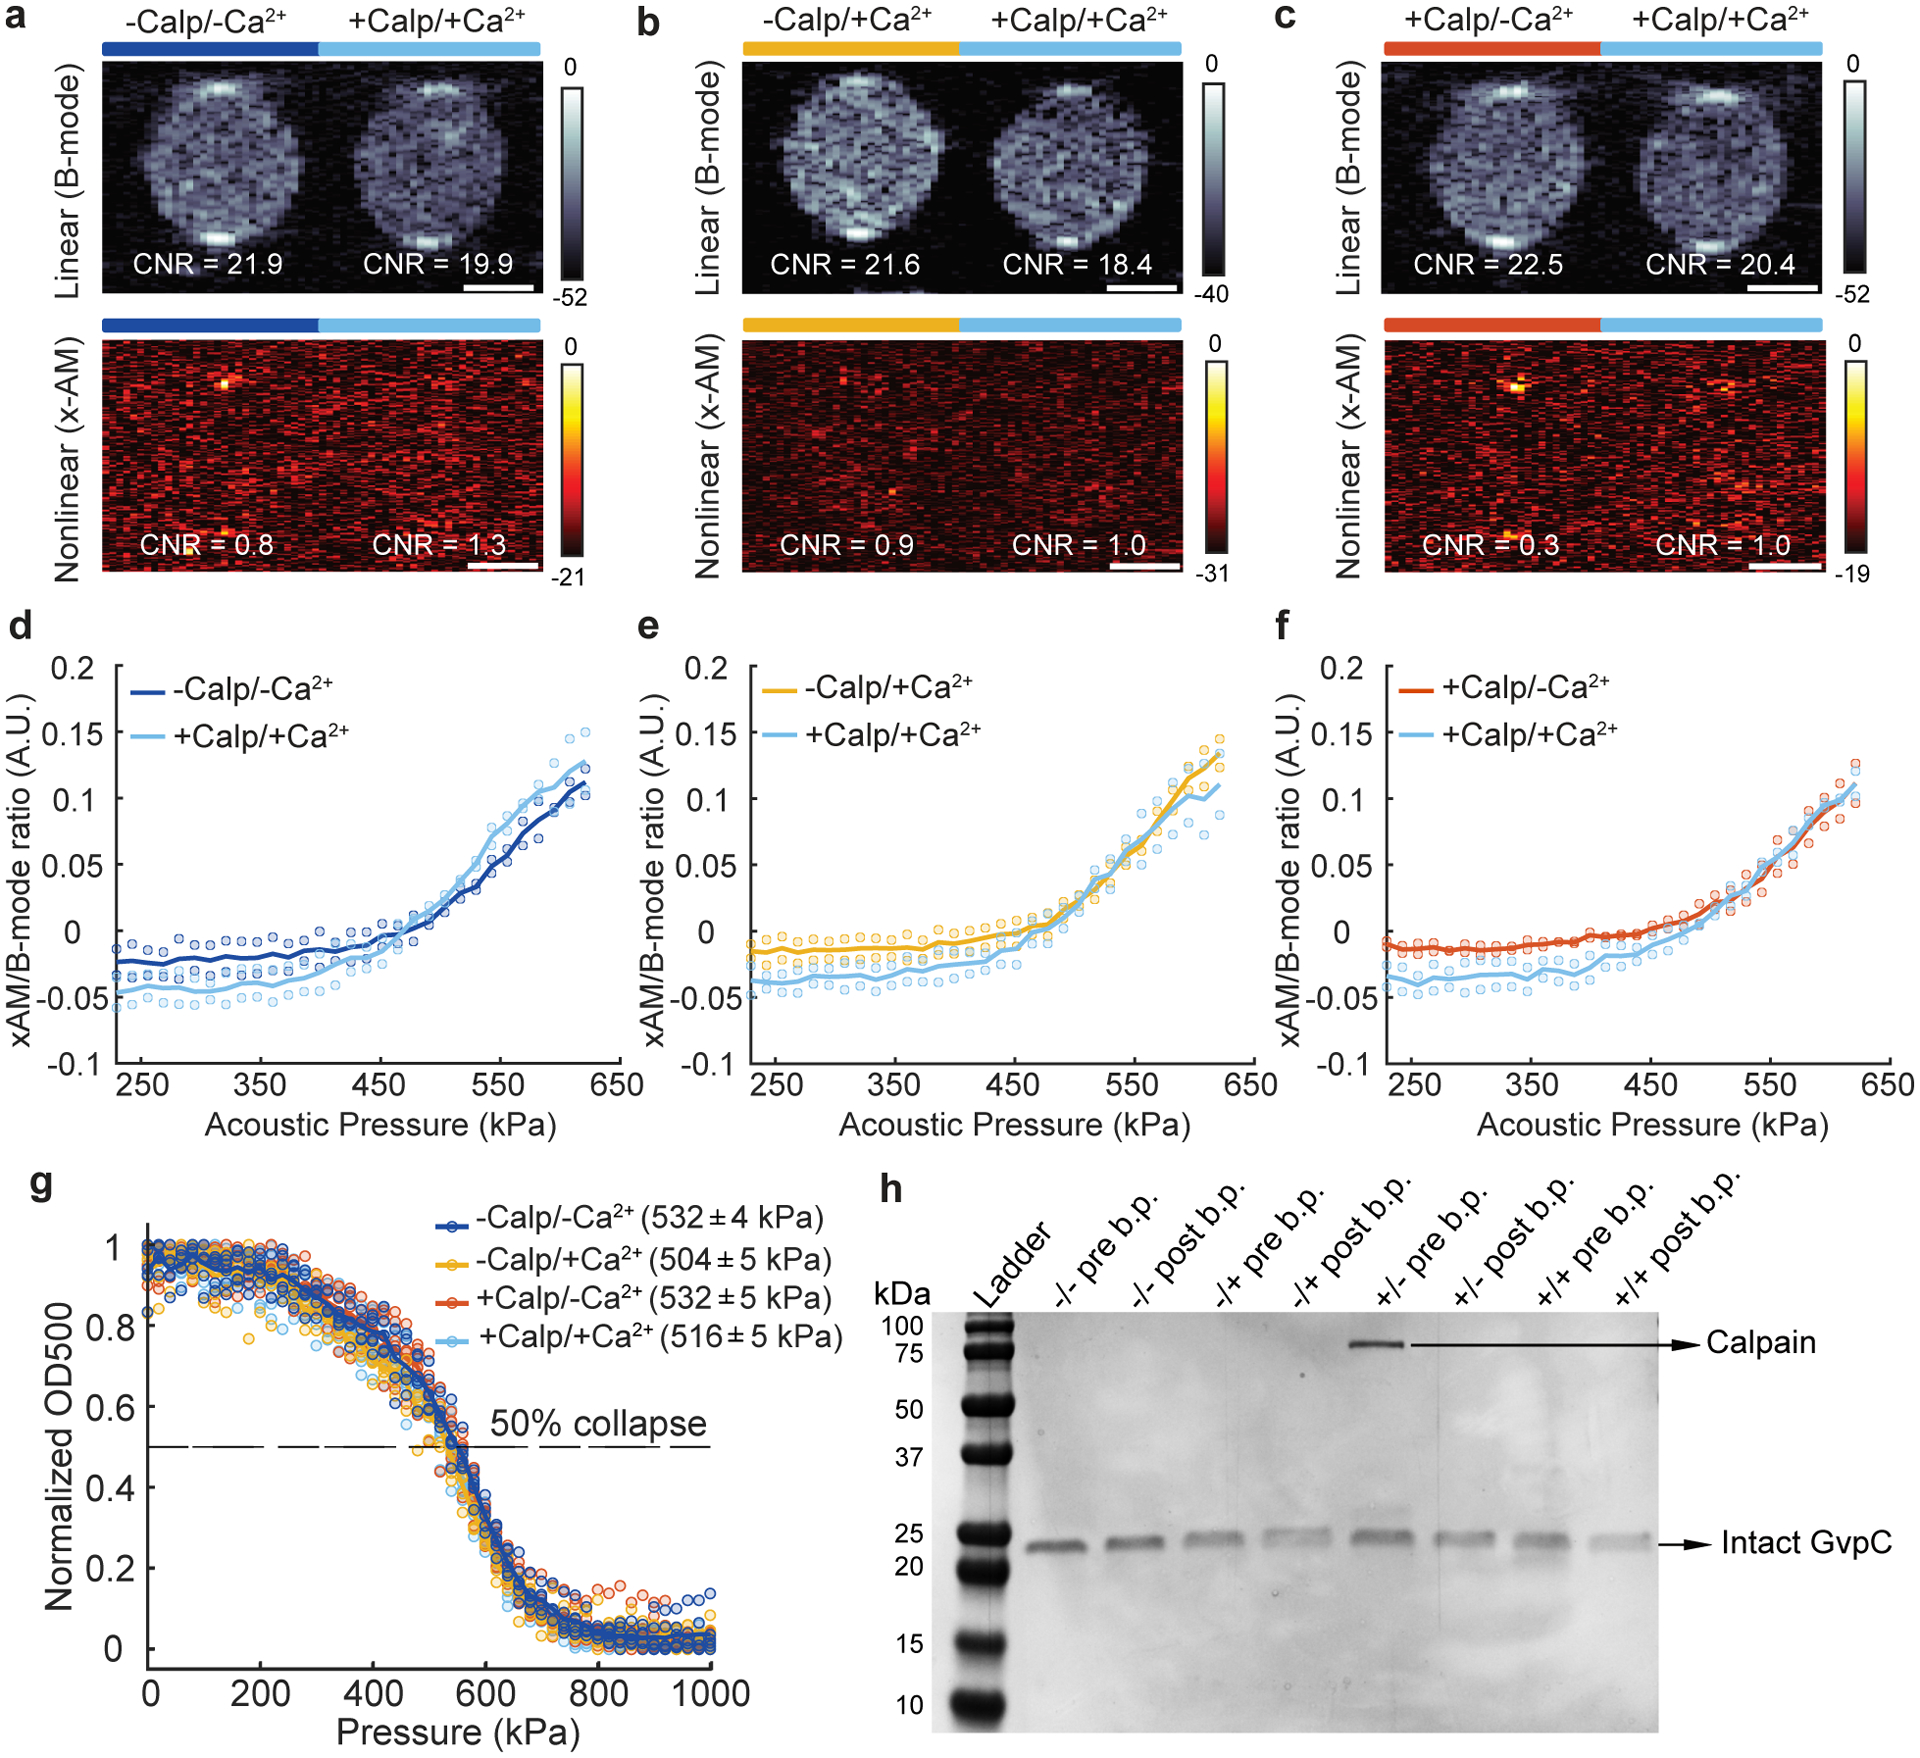
Figure 2: Acoustic biosensor of calcium-activated calpain protease.
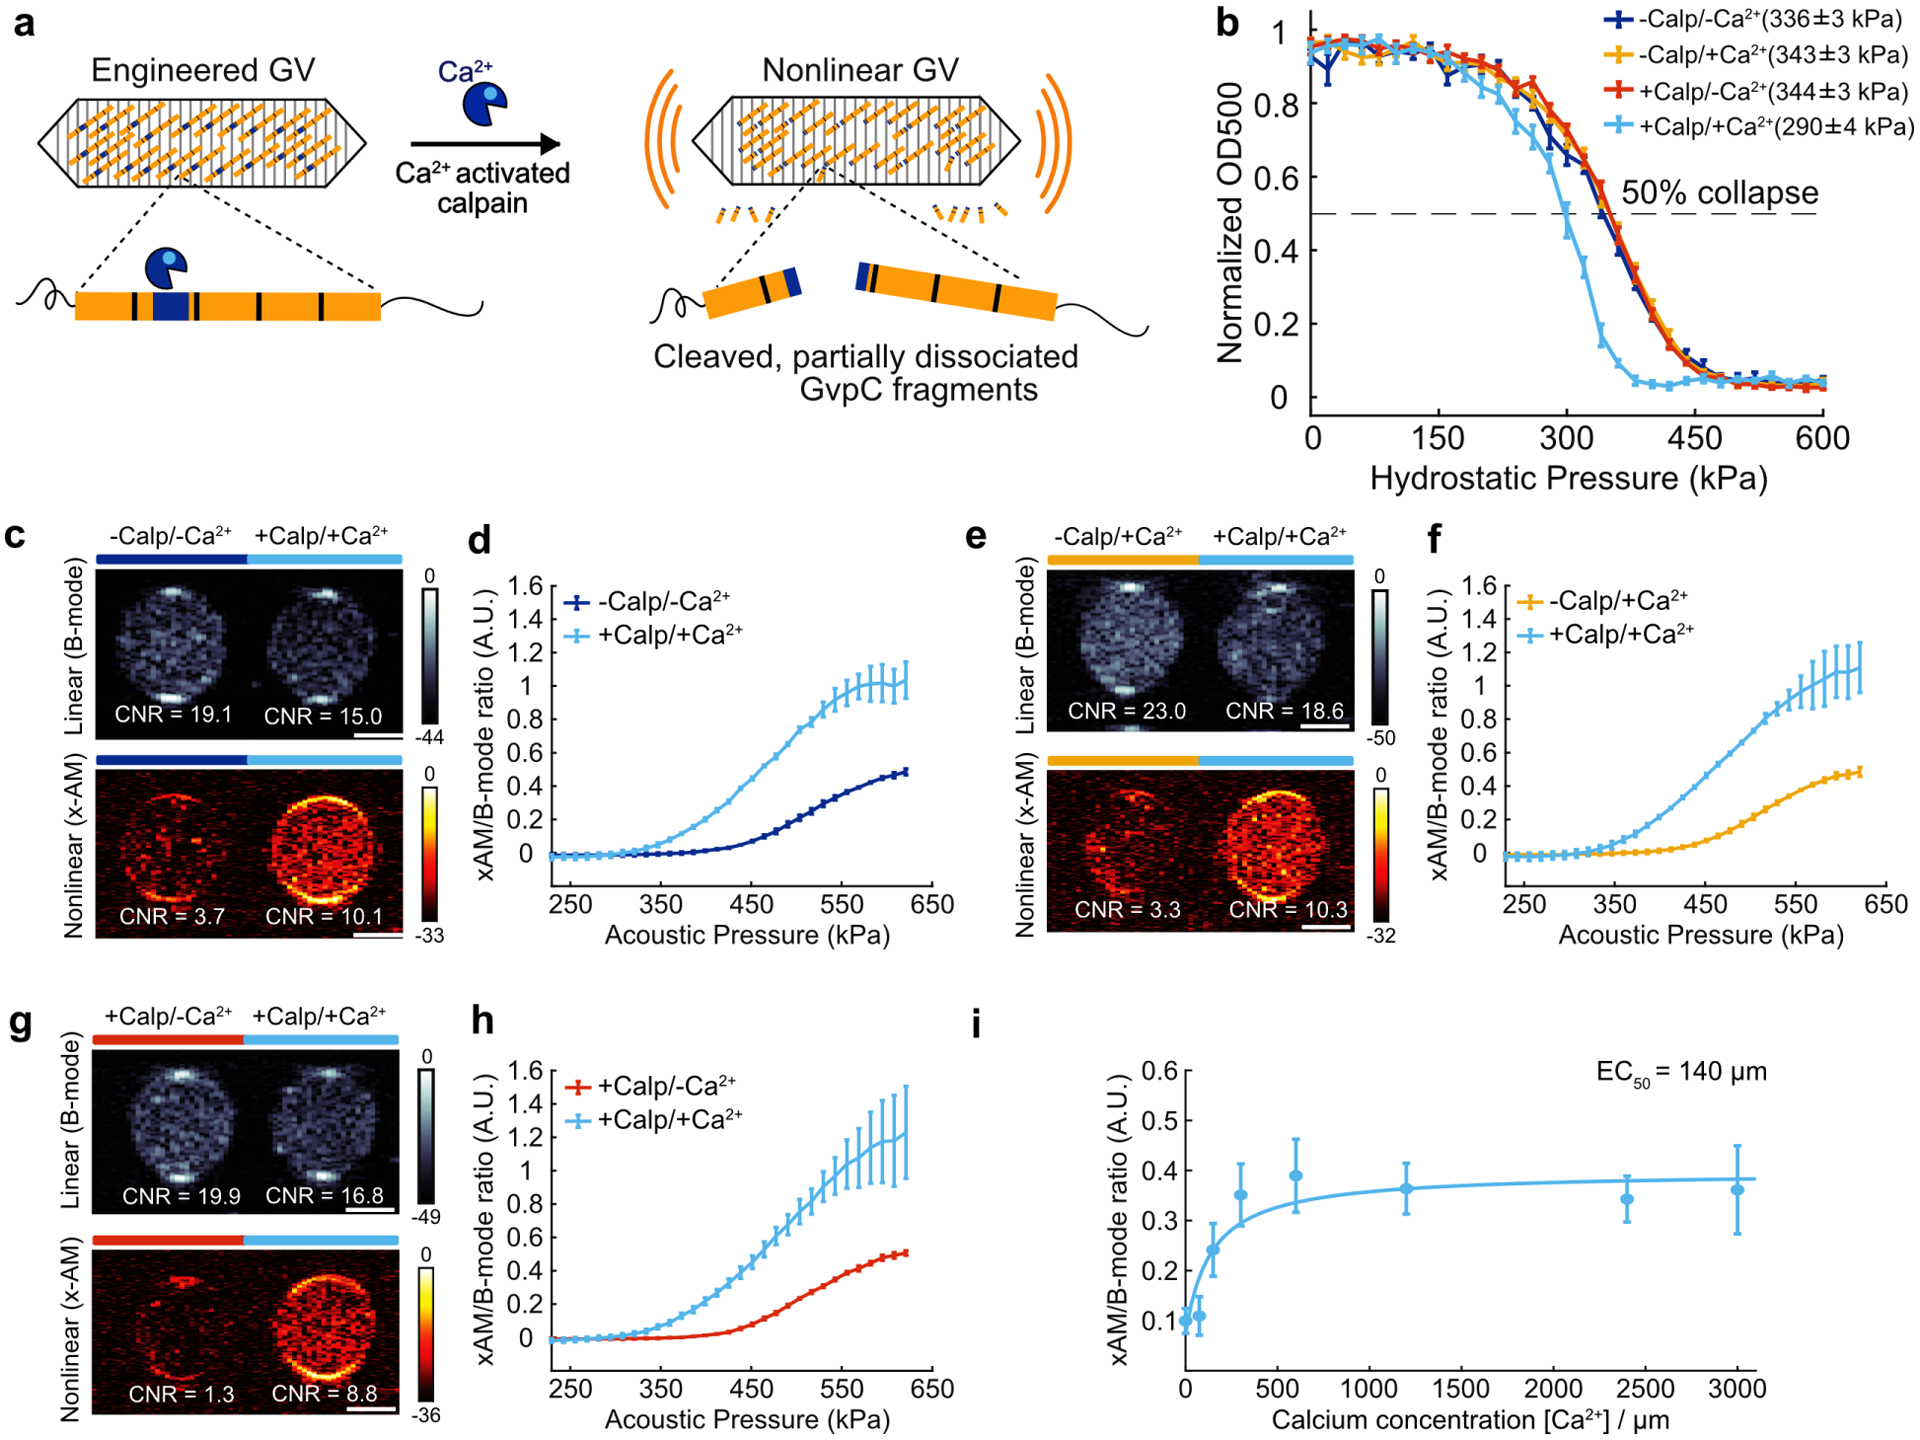
(a) Schematic illustration GVScalp. (b) Hydrostatic collapse curves of GVScalp after incubations in the presence or absence of calpain and calcium. The legend lists the midpoint collapse pressure for each condition (±95% confidence interval) determined from fitting a Boltzmann sigmoid function N = 5 biological replicates for +Calp/+Ca2+, 6 for −Calp/+Ca2+ and +Calp/−Ca2+, and 7 for −Calp/−Ca2+. (c, e, g) Representative ultrasound images of agarose phantoms containing GVScalp incubated with and without calpain and/or calcium at OD500nm 2.2. The B-mode images were taken at 132 kPa for c, e and g, and the x-AM images were taken at 438 kPa for c, e and at 425 kPa for g. CNR stands for contrast-to-noise-ratio, and color bars represent relative ultrasound signal intensity on the dB scale. Scale bars represent 1 mm. (d, f, h) Average ratio of x-AM to B-mode ultrasound signal as a function of applied acoustic pressure for GVScalp after incubation in the presence or absence of calpain and/or calcium. N=3 biological replicates, with each N consisting of 2 technical replicates for c–h. Solid curves represent the mean and error bars indicate SEM. Statistics were performed on independent biological replicates for b, d, f and h.(i) Calcium-response curve for GVScalp in the presence of μ-calpain, showing the ratio of x-AM to B-mode ultrasound signal at 425 kPa as a function of calcium concentration. The mean values are fitted to a Hill equation with a coefficient of 1, giving a half-maximum response concentration (EC50) of 140 μm (N = 3 biological replicates, individual dots represent the mean values with the solid blue line showing the fitted curve). Error bars indicate SEM. Individual scatter plots for d, f, h and i are shown in Extended Data Figure 2.
Ultrasound imaging of GVScalp revealed a robust nonlinear acoustic response when both calpain and calcium were present (Fig. 2, c, e, g), but not in negative controls lacking either or both of these analytes. A slight clustering tendency of GVScalp nanostructures, which was attenuated by incubation with activated calpain (Extended Data Fig. 2), resulted in a slightly higher B-mode signal for the negative controls. However, this did not significantly affect the maximal nonlinear sensor contrast of GVScalp of approximately 7dB (Fig. 2, c, e, g). This contrast increased steeply beyond an applied acoustic pressure of 320 kPa (Fig. 2, d, f, h and Extended Data Fig. 2). Using this biosensor, ultrasound imaging could be used to visualize the dynamic response of calpain to Ca2+, with a half-maximal response concentration of 140 μM (Fig. 2i and Extended Data Fig. 2). Additional control experiments performed on GVs with wild-type GvpC showed no proteolytic cleavage, change in GV collapse pressure or ultrasound response, after incubation with calcium-activated calpain (Extended Data Fig. 3). These results show that acoustic biosensor designs based on GvpC cleavage can be generalized to a mammalian protease and used to sense the dynamics of a conditionally active enzyme.
Building an acoustic sensor of the protease ClpXP
In addition to endopeptidases, another important class of enzymes involved in cellular protein signaling and homeostasis is processive proteases, which unfold and degrade full proteins starting from their termini33. To determine whether GV-based biosensors could be developed for this class of enzymes, we selected ClpXP, a processive proteolytic complex from E. Coli comprising the unfoldase ClpX and the peptidase ClpP34. ClpX recognizes and unfolds protein substrates containing specific terminal peptide sequences called degrons. The unfolded proteins are then fed into ClpP, which degrades them into small peptide fragments34. We hypothesized that the addition of a degron to the C-terminus of GvpC would enable ClpXP to recognize and degrade this protein, while leaving the underlying GvpA shell intact, resulting in GVs with greater mechanical flexibility and nonlinear ultrasound contrast (Fig. 3a).
Figure 3: Acoustic biosensor of ClpXP protease.
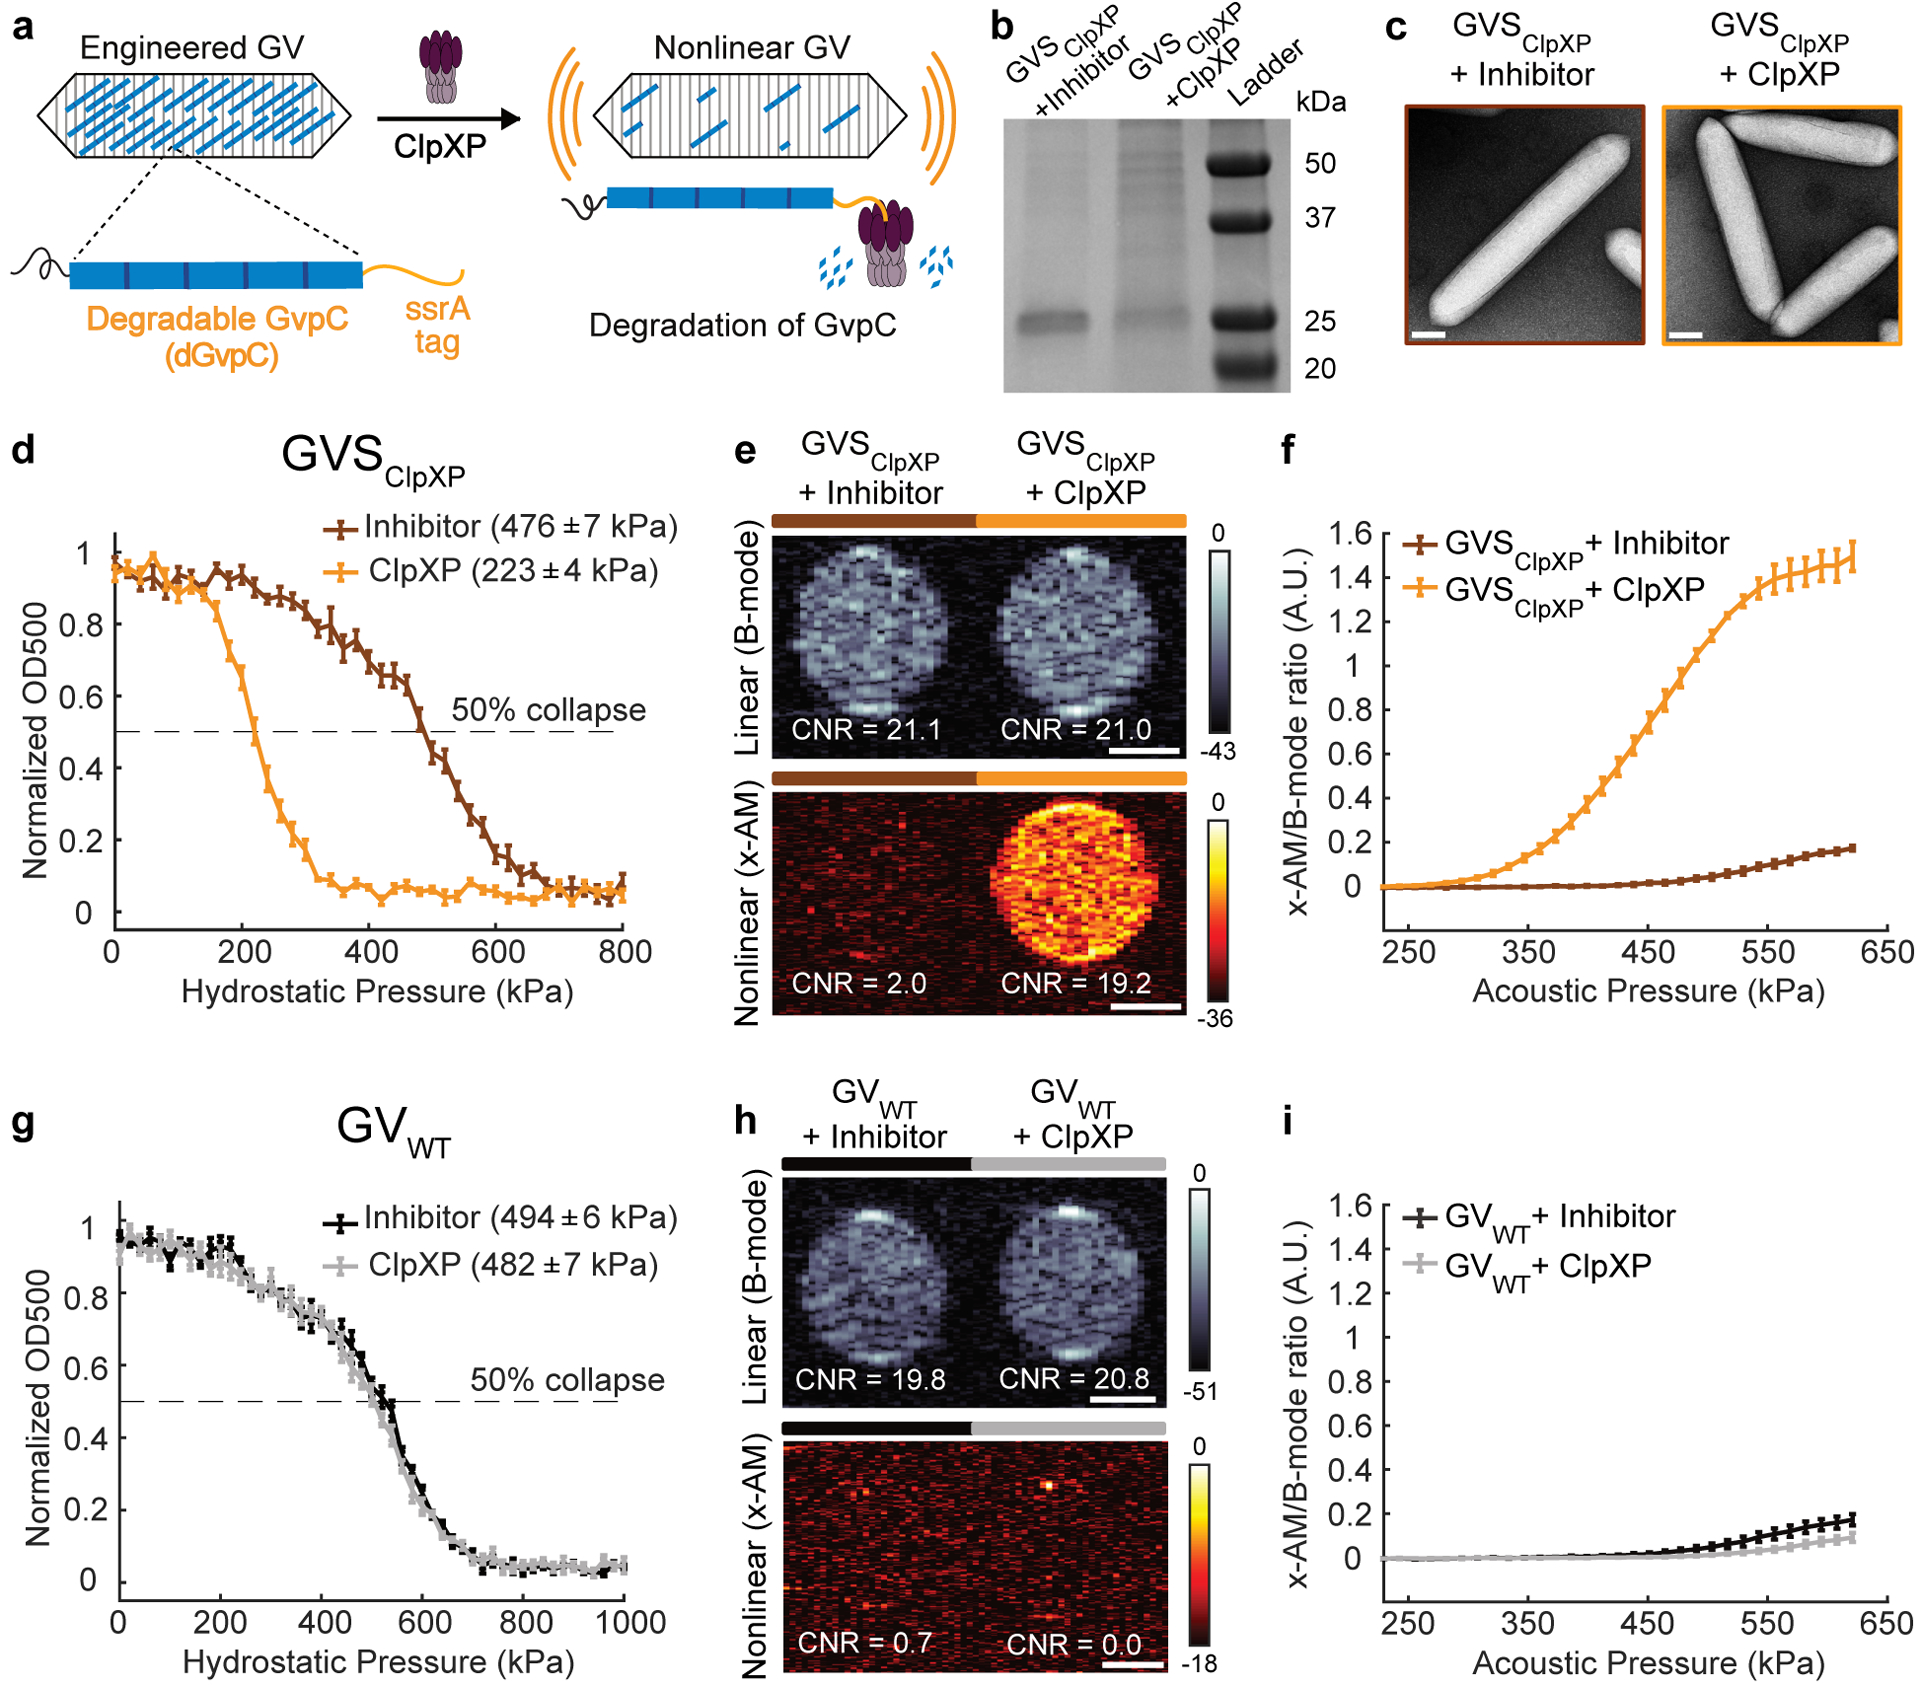
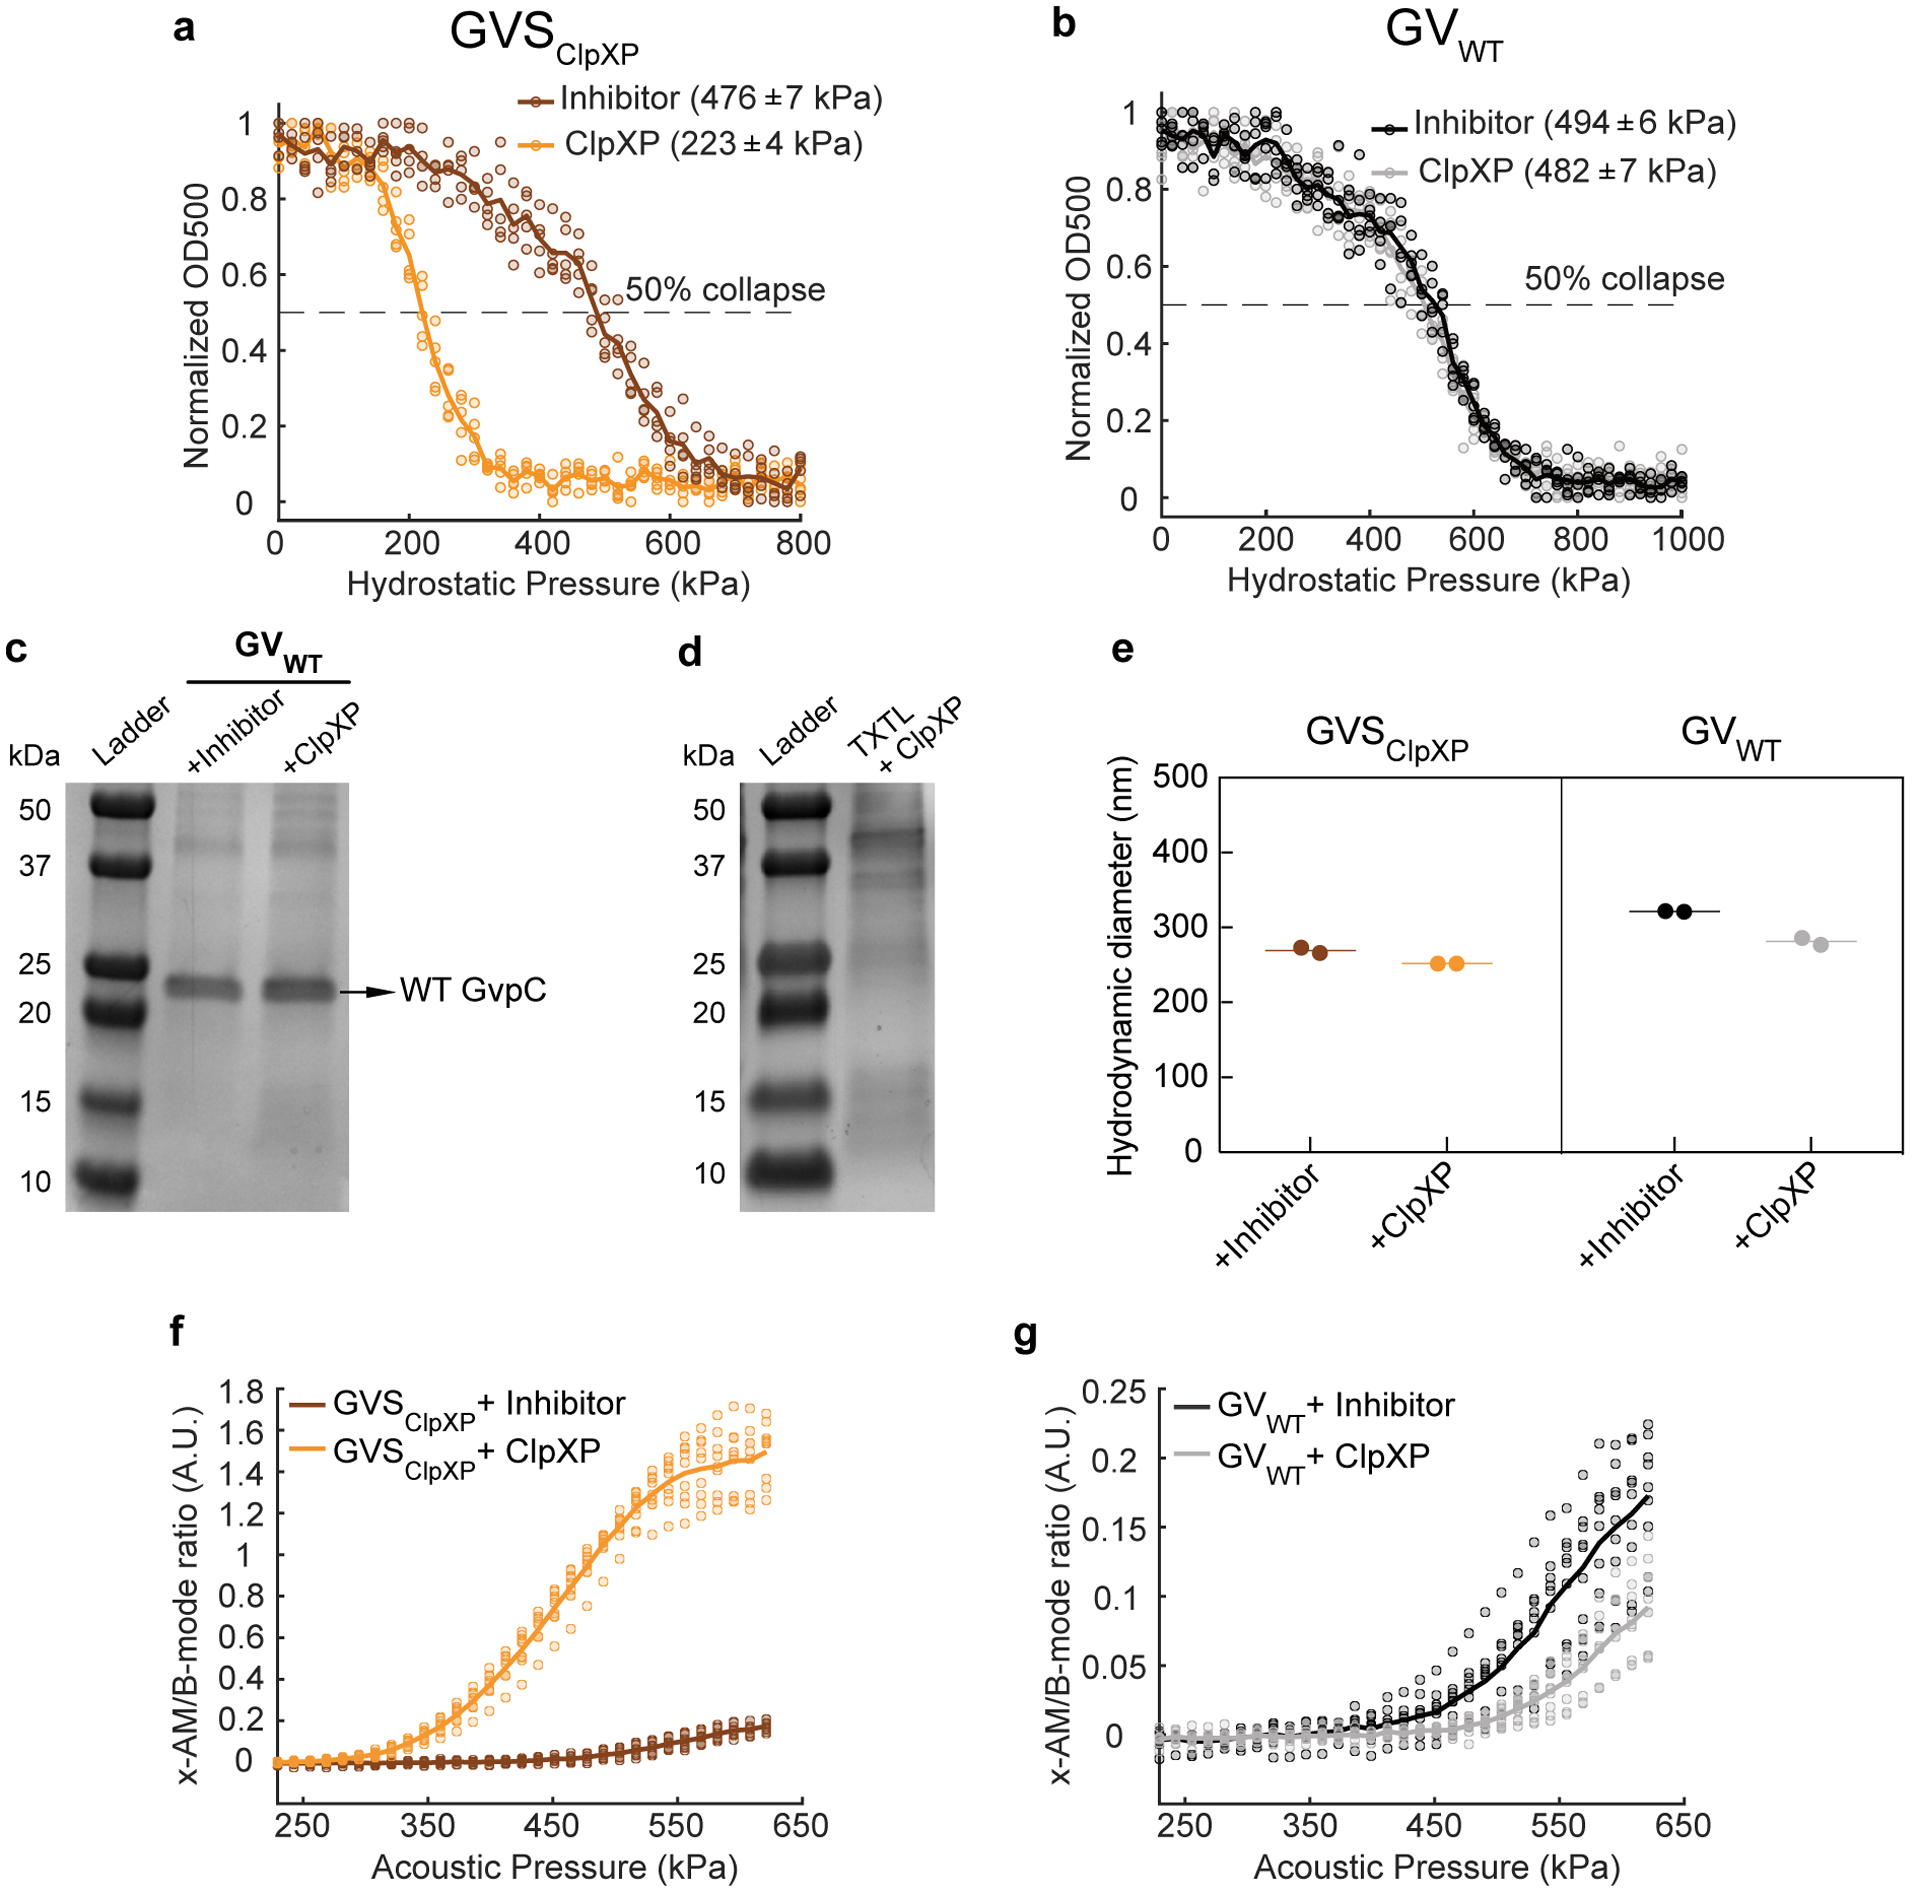
(a) Schematic of GVSClpXP. (b) Coomassie-stained SDS-PAGE gel of OD500nm-matched GVSClpXP samples, incubated in a reconstituted cell-free transcription-translation (TX-TL) system containing a protease inhibitor cocktail or ClpXP (N= 3 biological replicates). Additional bands in these gels arise from components of the TX-TL system (Extended Data Figure 4) (c) Representative TEM images of GVSClpXP after incubations in the presence of a protease inhibitor or ClpXP. Scale bars represent 100 nm. A minimum of 100 GV particles were imaged for the +ClpXP condition and 50 particles for the +inhibitor control. (d) Normalized optical density (OD500nm) measurements of GVSClpXP as a function of hydrostatic pressure after protease incubation (N=5 biological replicates). (e) Representative ultrasound images of agarose phantoms containing GVSClpXP incubated with the inhibitor cocktail or active ClpXP at OD500nm 2.2. (f) Average x-AM/B-mode ratio as a function of applied acoustic pressure for GVSClpXP, after incubation with the protease inhibitor or active ClpXP. (g) Hydrostatic collapse pressure measurements for engineered Ana GVs with WT-GvpC (GVWT) after protease incubation (N=5 biological replicates). For collapse pressure data in d and g, the legend lists the midpoint collapse pressure for each condition (±95% confidence interval), determined from fitting a Boltzmann sigmoid function. (h) Representative ultrasound images of agarose phantoms containing GVWT incubated with the inhibitor cocktail or active ClpXP at OD500nm 2.2. Scale bars in e and h represent 1mm. CNR stands for contrast-to-noise-ratio, and color bars represent relative ultrasound signal intensity on the dB scale. The B-mode images were acquired at 132 kPa and the x-AM images were acquired at 477 kPa. (i) Average ratio of x-AM to B-mode acoustic signal as a function of applied acoustic pressure for GVWT after incubation with the inhibitor cocktail or ClpXP protease. For e, f, h and i, N=3 biological replicates, with each N having 3 technical replicates. For d, f, g and i, solid curves represent the mean and error bars indicate SEM, which were calculated from independent biological replicates. Individual scatter plots for d, f, g and i are shown in Extended Data Figure 4.
To test this hypothesis, we appended the ssrA degron, AANDENYALAA, via a short SG linker, to the C-terminus of Ana GvpC, resulting in a sensor that we named GVSClpXP (Fig. 3a). We tested the performance of this biosensor in vitro using a reconstituted cell-free transcription-translation system comprising E. Coli extract, purified ClpX, and a ClpP-expressing plasmid. Gel electrophoresis performed after incubating GVSClpXP with this cell-free extract showed significant degradation of the engineered GvpC, compared to a negative control condition in which the extract was pre-treated with a protease inhibitor (Fig. 3b). TEM images showed intact GVs under both conditions, confirming that GvpC degradation left the underlying GV shell uncompromised (Fig. 3c). Pressurized absorbance spectroscopy indicated a substantial weakening of the GV shell upon ClpXP exposure, with the hydrostatic collapse midpoint shifting by nearly 250 kPa (Fig. 3d and Extended Data Fig. 4). Ultrasound imaging revealed a 17dB enhancement in the nonlinear contrast produced by GVSClpXP at an acoustic pressure of 477 kPa, in response to ClpXP activity (Fig. 3, e–f and Extended Data Fig. 4). Control GVs containing wild type GvpC showed no sensitivity to ClpXP (Fig. 3, g–i and Extended Data Fig. 4). These results establish the ability of GV-based acoustic biosensors to visualize the activity of a processive protease as turn-on sensors.
Constructing intracellular acoustic sensor genes
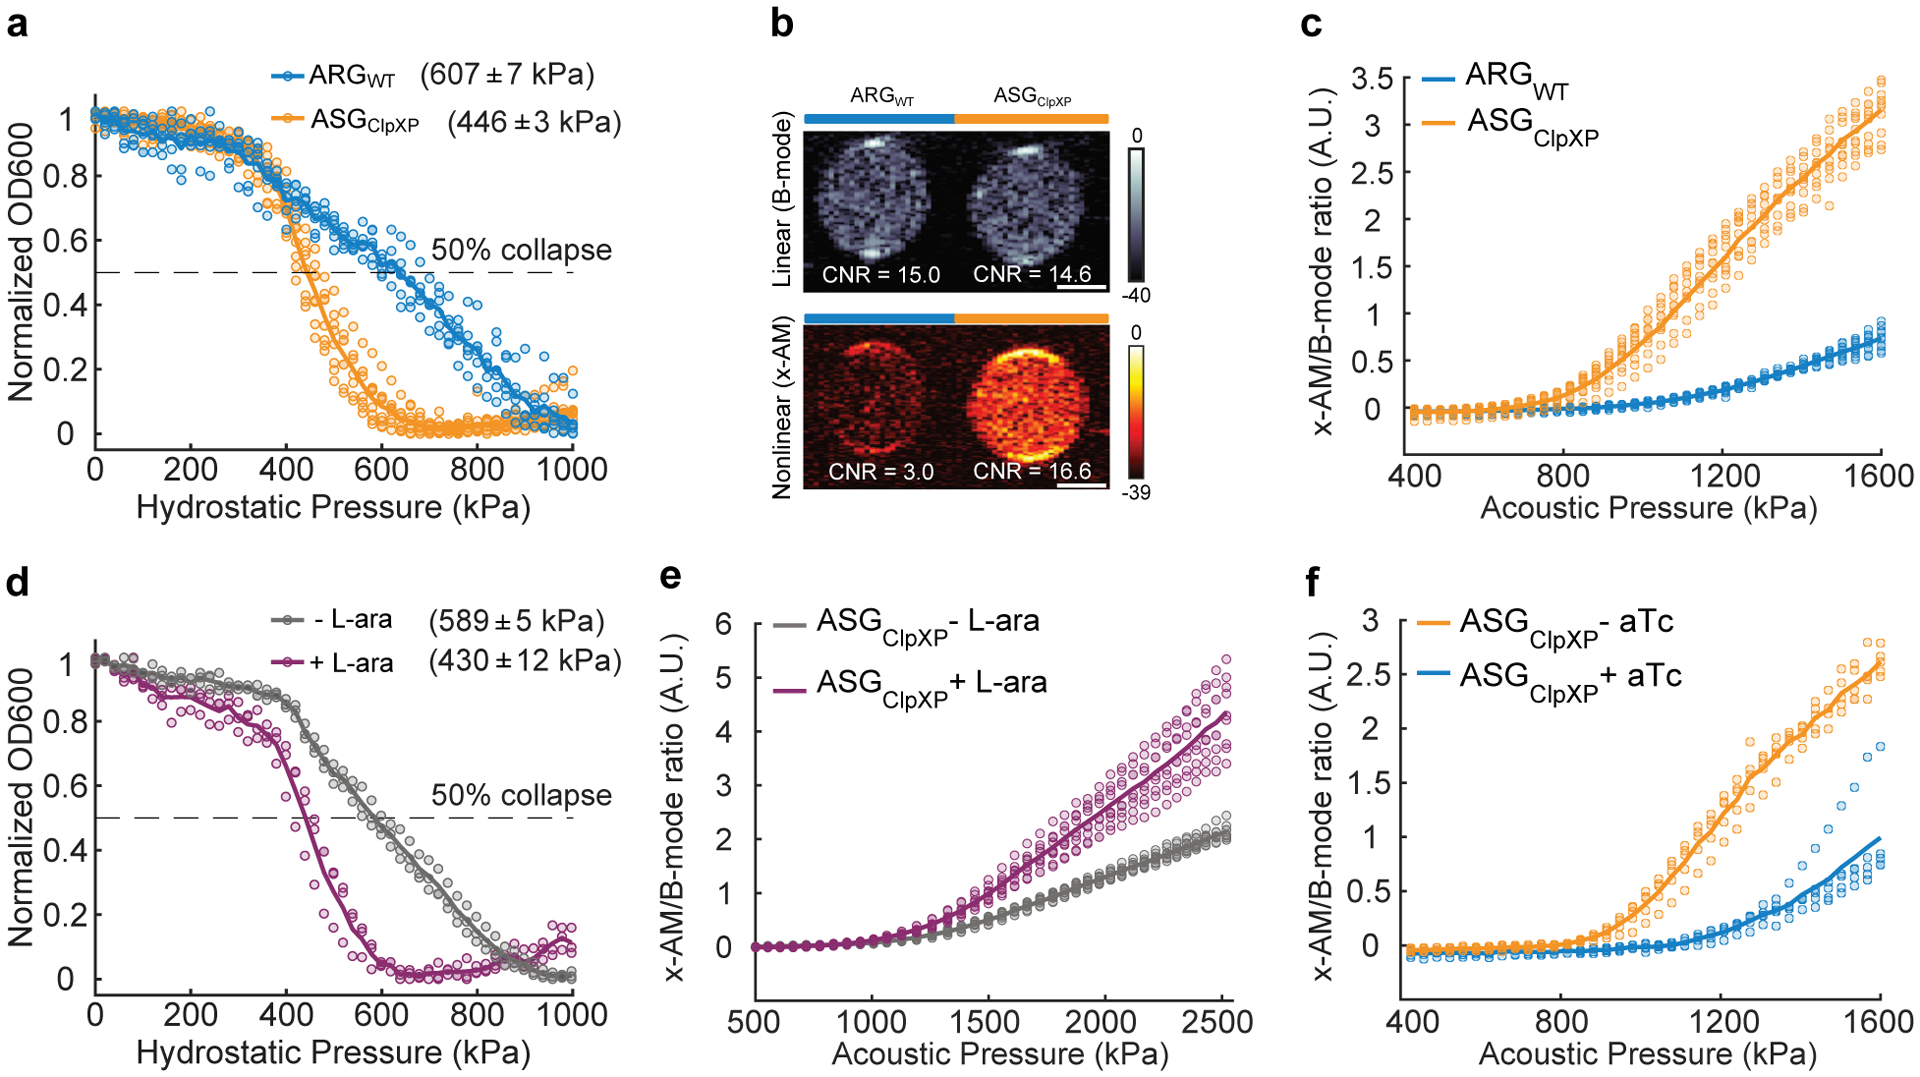
After demonstrating the performance of acoustic biosensors in vitro, we endeavored to show that they could respond to enzymatic activity inside living cells. As the cellular host, we chose E. Coli Nissle 1917. This probiotic strain of E. Coli has the capacity to colonize the mammalian gastrointestinal tract, and is widely used as a chassis for the development of microbial therapeutics35–37, making it a valuable platform for intracellular biosensors. Recently, an engineered operon comprising GV-encoding genes from Anabaena flos-aquae and Bacillus megaterium was expressed in Nissle cells as acoustic reporter genes (ARGs), allowing gene expression to be imaged with linear B-mode ultrasound8. To develop an intracellular acoustic sensor gene targeting ClpXP (ASGClpXP), we swapped the wild type gvpC in the ARG gene cluster (ARGWT) with the modified gvpC from GVSClpXP (dGvpC) (Fig. 4a). For a first test of this intracellular biosensor, we transformed it into wild-type (WT) Nissle cells, which natively express ClpXP protease, hypothesizing that it would show a reduced intracellular collapse pressure and enhanced nonlinear contrast compared to ARGWT. Indeed, pressurized absorbance spectroscopy on intact cells expressing ASGClpXP revealed a reduction in the hydrostatic collapse pressure midpoint of ~ 160 kPa relative to cells expressing ARGWT (Extended Data Fig. 5). In ultrasound imaging, live cells expressing ASGClpXP showed an enhancement in nonlinear contrast of approximately 13 dB (Extended Data Fig. 5), while linear B-mode signal was similar. The nonlinear response of ASGClpXP expressing cells was strongest beyond an acoustic pressure of 784 kPa (Extended Data Fig. 5).
Figure 4: Monitoring intracellular protease activity and circuit-driven gene expression in engineered cells.
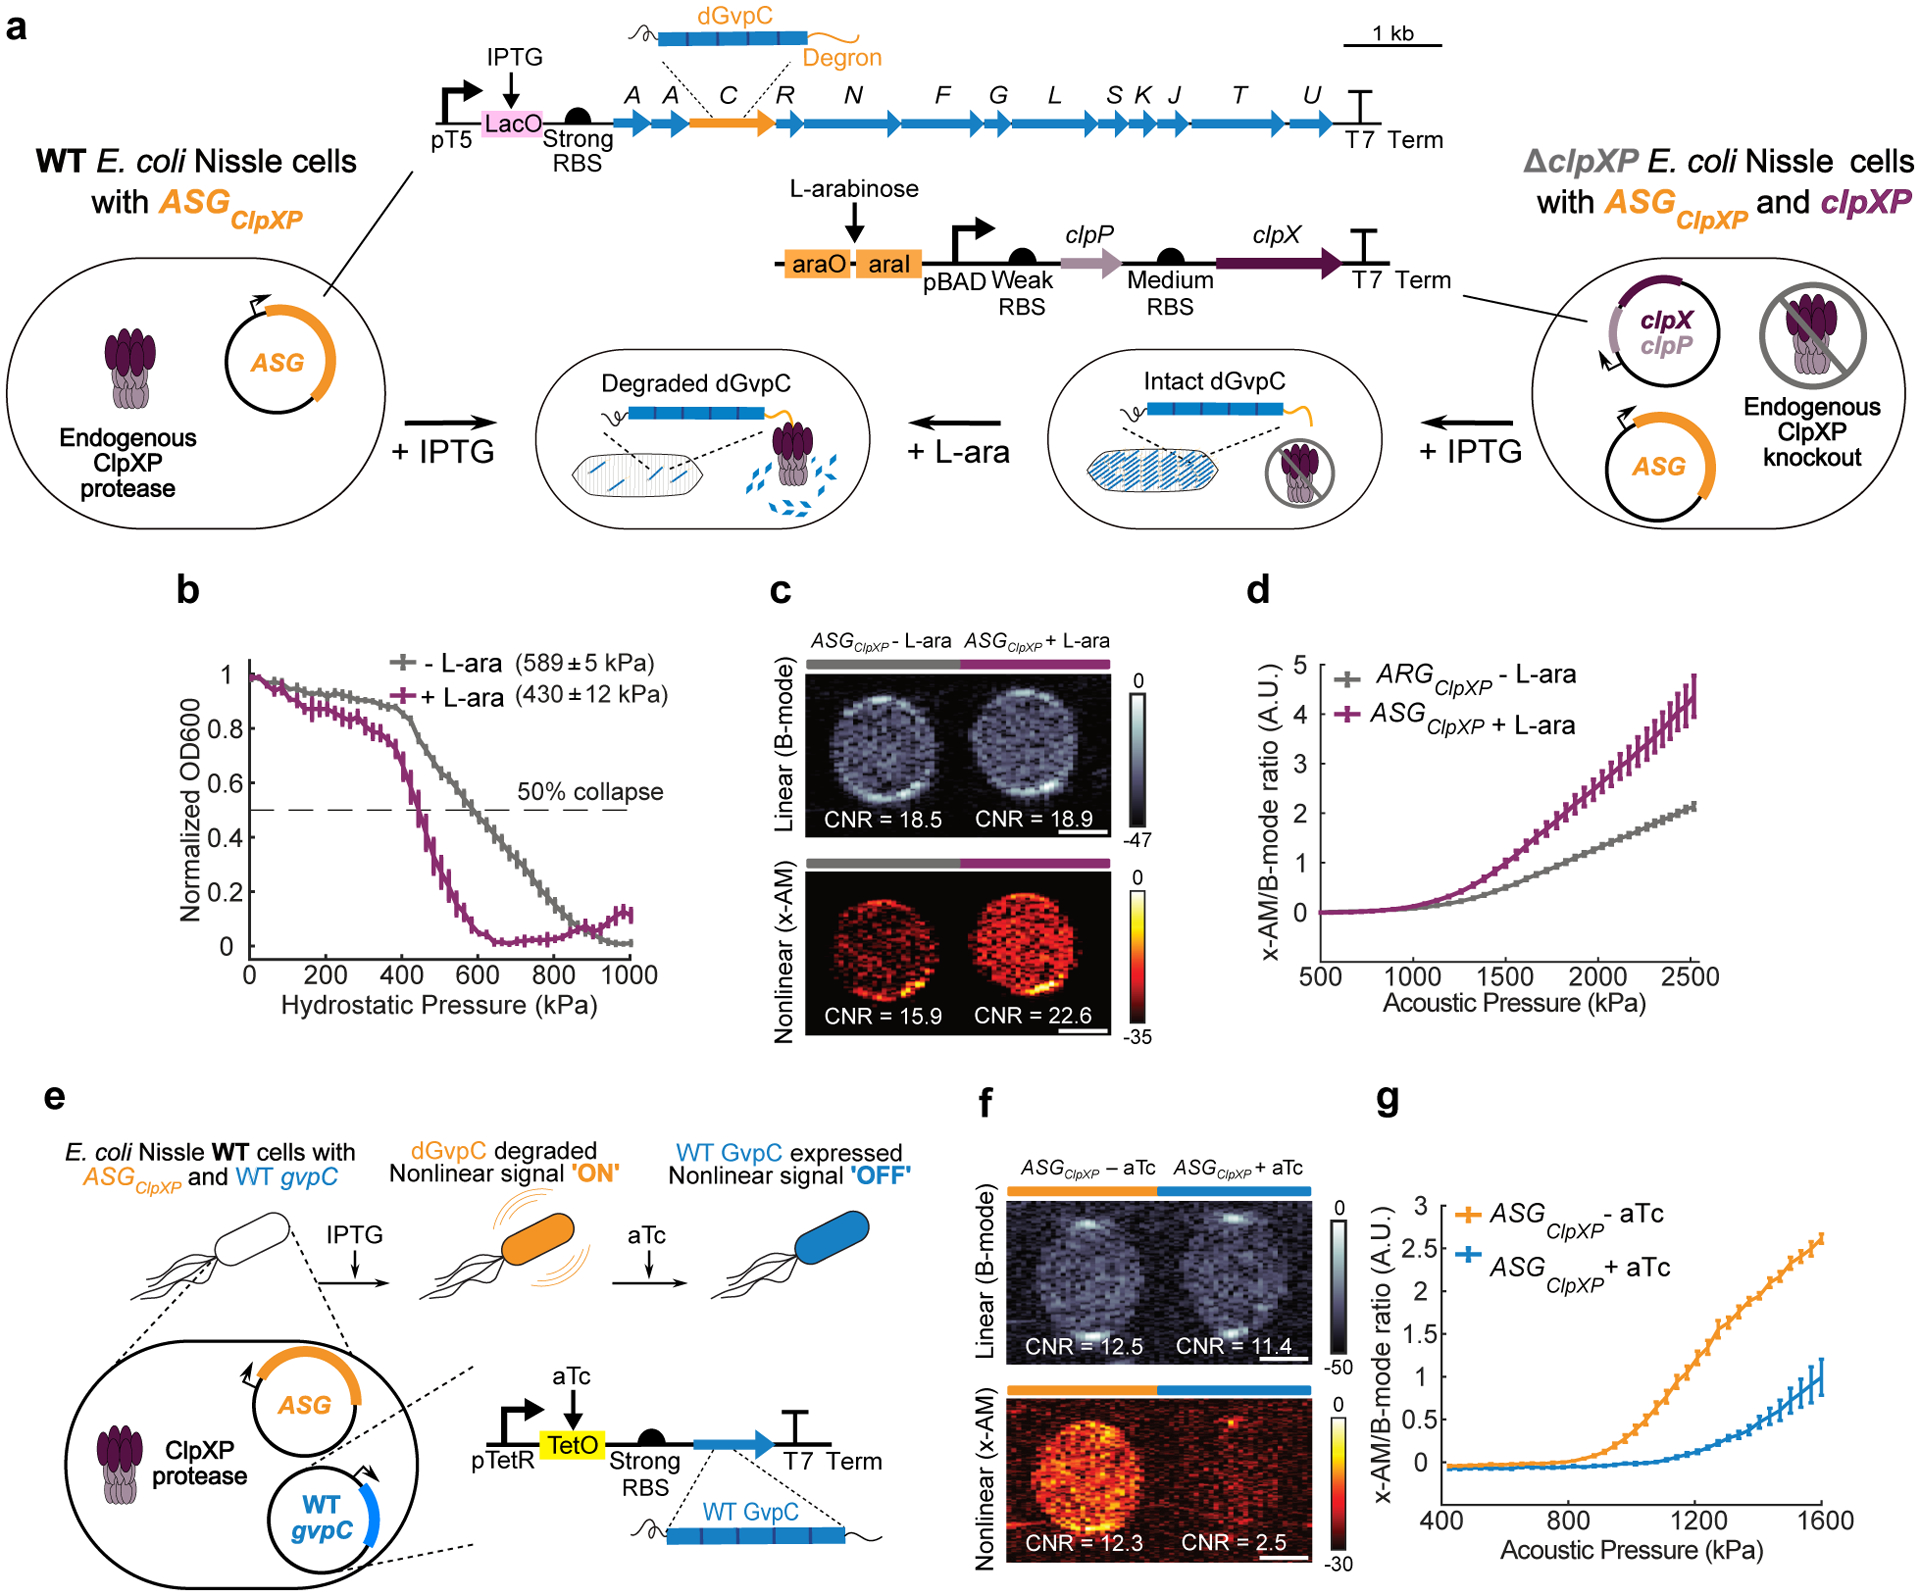
(a) Schematic of E. Coli Nissle cells expressing the acoustic sensor gene construct for ClpXP. In some cases, the Nissle cells are genomically modified to lack the clpX and clpP genes (ΔclpXP), and co-transformed with a plasmid encoding L-arabinose (L-ara) driven ClpXP. (b) Normalized pressure-sensitive optical density at 600 nm of ΔclpXP Nissle cells expressing ASGClpXP with or without L-ara induction of ClpXP protease expression. The legend lists the midpoint collapse pressure for each cell type (±95% confidence interval) determined from fitting a Boltzmann sigmoid function (N = 3 biological replicates). (c) Representative ultrasound images of ΔclpXP Nissle cells expressing ASGClpXP with or without L-ara induction of ClpXP protease at OD600nm 1.5. (d) Average x-AM/B-mode ratio as a function of applied acoustic pressure for ΔclpXP Nissle cells expressing ASGClpXP with or without L-ara induction of ClpXP expression at OD600nm 1.5. N=3 biological replicates, with each N having 3 technical replicates for c and d. (e) Schematic of pT5-LacO driven ASGClpXP and pTet-TetO driven WT gvpC gene circuits co-transformed into Nissle cells for dynamic switching of non-linear acoustic signals from the intracellular GV sensors in response to circuit-driven gene expression. (f) Representative ultrasound images of Nissle cells (OD600nm 1) expressing ASGClpXP, with or without aTc induction to drive expression of WT GvpC. (g) Average x-AM/B-mode ratio as a function of applied acoustic pressure for Nissle cells expressing ASGClpXP, with or without aTc induction. N=5 biological replicates for f and g. CNR stands for contrast-to-noise-ratio, and color bars represent relative ultrasound signal intensity in the dB scale. The B-mode images were acquired at 309 kPa for (c) and 132 kPa for (f). The x-AM images were acquired at 1.61 MPa for (c), and 1.34 MPa for (f). Scale bars in c and f represent 1 mm.For b, d and g, solid curves represent the mean and error bars indicate SEM. Statistics were performed on data from independent biological replicates. Individual scatter plots for b,d and g are shown in Extended Data Figure 5.
Next, to examine the ability of ASGClpXP to respond to intracellular enzymatic activity in a dynamic manner, we generated a ClpXP-deficient strain of Nissle cells (ΔclpXP) through genomic knock-out of the genes encoding ClpX and ClpP, and created a plasmid containing these two genes under the control of an arabinose-inducible promoter (Fig. 4a). This allowed us to externally control the activity of the ClpXP enzyme. ΔclpXP Nissle cells were co-transformed with an inducible clpX-clpP (clpXP) plasmid and ASGClpXP. ClpXP production in these cells after induction with L-arabinose resulted in an approximately 160 kPa reduction in the hydrostatic collapse pressure midpoint (Fig. 4b and Extended Data Fig. 5). Under ultrasound imaging, cells with induced ClpXP activity showed substantially stronger nonlinear contrast (+6.7 dB) compared to cells uninduced for this protease (Fig. 4c), while showing a similar B-mode signal. This enhancement in nonlinear signal was detectable with acoustic pressures above 950 kPa (Fig. 4d and Extended Data Fig. 5). These experiments demonstrate the ability of ASGClpXP to function as an intracellular acoustic sensor to monitor variable enzyme activity.
A major application of dynamic sensors in cells is to monitor the activity of natural or synthetic gene circuits38–40. To test if our acoustic sensors could be used to track the output of a synthetic gene circuit in cells, we co-transformed WT Nissle cells with ASGClpXP, and a separate wild-type gvpC gene controlled by anhydrotetracycline (aTc) (Fig. 4e). Our hypothesis was that induction of this gene circuit only with IPTG would result in the production of GVs with ClpXP-degradable GvpC, resulting in nonlinear contrast, whereas the additional input of aTc would result in the co-production of non-degradable wild-type GvpC, which would take the place of any degraded engineered GvpC on the biosensor shell and lead to reduced nonlinear scattering (Fig. 4e). Indeed, when we induced cells with just IPTG we observed strong nonlinear contrast. However, when aTc was added to the cultures after IPTG induction, this contrast was reduced by approximately 10 dB (Fig. 4f–g and Extended Data Fig. 5). These results, together with our findings in ΔclpXP cells with inducible ClpXP, show that acoustic biosensors can be used to visualize the output of synthetic gene circuits.
Ultrasound imaging of intracellular ClpXP activity in vivo
Finally, after establishing the basic principles of acoustic biosensor engineering in vitro and demonstrating their performance in living cells, we assessed the ability of our sensor constructs to produce ultrasound contrast within a biologically relevant anatomical location in vivo. In particular, approaches to imaging microbes in the mammalian GI tract8,41–43 are needed to support the study of their increasingly appreciated roles in health and disease44,45 and the development of engineered probiotic agents46,47. The GI tract is also an excellent target for ultrasound imaging due to its relatively deep location inside the animal, and the use of ultrasound in clinical diagnosis and animal models of GI pathology, with appropriate measures taken to minimize potential interference from air bubbles and solid matter48,49.
To demonstrate the ability of acoustic biosensors to produce nonlinear ultrasound contrast within the in vivo context of the mouse GI tract, we first co-injected WT Nissle cells expressing ASGClpXP and ARGWT into the mouse colon (schematic shown in Extended Data Fig. 6), distributing one cell population along the lumen wall and the other in the lumen center. In these proof-of-concept experiments, the cells are introduced into the colon in a rectally-injected agarose hydrogel to enable precise positioning and control over composition. Using nonlinear ultrasound imaging, we could clearly visualize the unique contrast generated by the protease-sensitive ASGs as a bright ring of contrast lining the colon periphery (Fig. 5a). When the spatial arrangement was reversed, the bright nonlinear contrast was concentrated in the middle of the lumen (Extended Data Fig. 7). A comparison of ultrasound images acquired before and after acoustic collapse of the GVs, using a high-pressure pulse from the transducer, confirmed that the bright ring of nonlinear contrast was emanating from ASGClpXP -expressing cells (Fig. 5a), and this result was consistent across independent experiments in 9 mice (Fig. 5b).
Figure 5: Ultrasound imaging of bacteria expressing acoustic sensor genes in the gastrointestinal tract of mice.
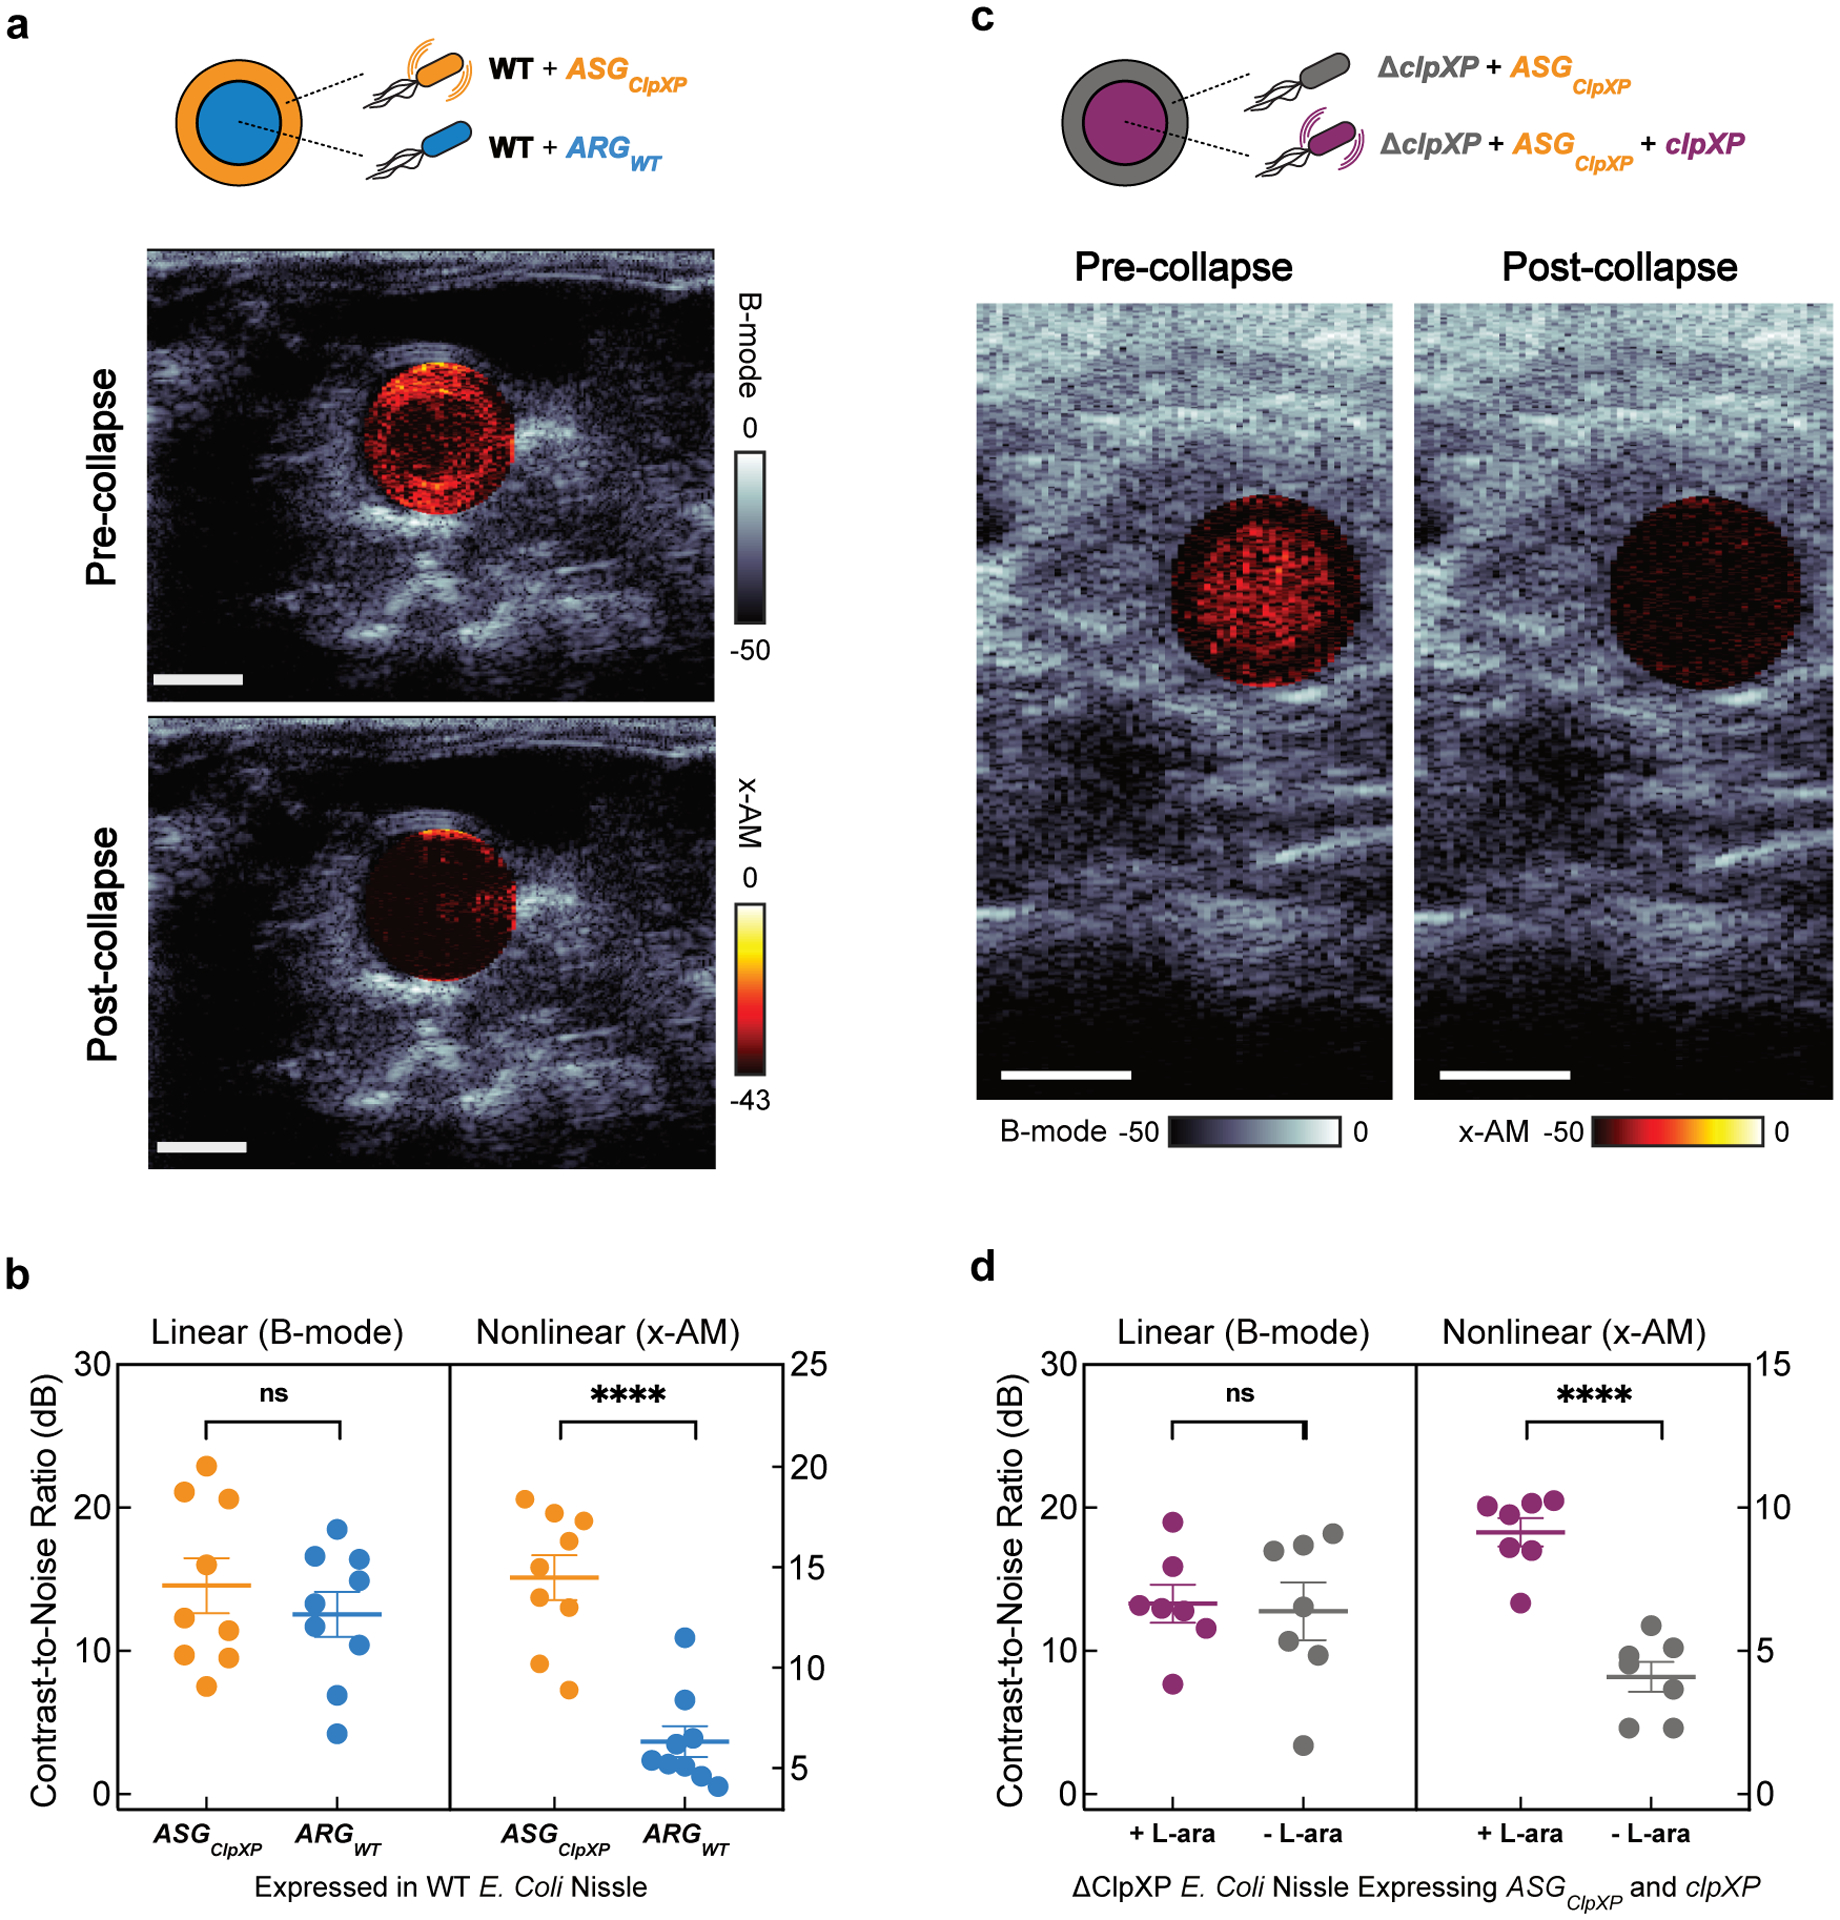
(a) Transverse ultrasound image of a mouse whose colon contains WT Nissle cells expressing ARGWT at the center of the lumen and the same strain expressing ASGClpXP at the periphery of the lumen. These imaging experiments were independently repeated 9 times with similar results. (b) B-mode and xAM contrast-to-noise ratio (CNR) in vivo, for WT Nissle cells expressing ARGWT or ASGClpXP. N = 9 mice. P = 7.8E-5 for x-AM signal from cells expressing ASGClpXP versus the ARGWT control and P = 0.2890 for B-mode signal. (c) Transverse ultrasound image of a mouse whose colon contains ΔclpXP Nissle cells expressing ASGClpXP with L-ara induction of ClpXP protease expression at the center and without L-ara induction at the periphery of the lumen. These imaging experiments were independently repeated 7 times with similar results. Cells were injected in agarose gel at a final concentration of 1.5E9 cells ml−1 for a and c. Nonlinear (x-AM) images of the colon, acquired at 1.27 MPa for (a) and 1.56 MPa for (c) before and after acoustic collapse (hot color map), are superimposed on linear (B-mode) anatomical images (bone colormap). Color bars represent relative ultrasound signal intensity on the dB scale. Scale bars represent 2 mm for a and c. (d) B-mode and xAM CNR in vivo, for ΔclpXP Nissle cells expressing ASGClpXP with or without L-ara induction of ClpXP expression. N = 7 mice. P = 1.8E-5 for x-AM signal from cells expressing ASGClpXP with ClpXP protease expression induced versus non- induced and P = 0.8293 for B-mode signal. Individual dots represent each N, and the thick horizontal line indicates the mean. Error bars indicate SEM. P-values were calculated using a two-tailed paired t-test.
To demonstrate in vivo imaging of enzyme activity, we introduced ΔclpXP Nissle cells expressing ASGClpXP into the mouse colon, with and without transcriptionally activating intracellular ClpXP (schematic shown in Extended Data Fig. 6) . As above, the cells were contained in an agarose hydrogel. Cells induced to express this enzyme showed enhanced nonlinear contrast compared to cells not expressing ClpXP (Fig. 5c). Acoustic collapse confirmed the acoustic biosensors as the primary source of nonlinear signal (Fig. 5c). This performance was consistent across 7 mice and 2 spatial arrangements of the cells (Fig. 5d). These results demonstrate the ability of acoustic biosensors to visualize enzyme activity within the context of in vivo imaging.
Besides molecular sensing, one additional benefit of the nonlinear contrast generated by ASGClpXP -expressing cells is to make the cells easier to detect relative to background tissue compared to linear B-mode imaging. Indeed, the nonlinear contrast of WT Nissle cells expressing ASGClpXP had a significantly higher contrast-to-tissue ratio than either the nonlinear contrast of ARGWT-expressing cells, or the B-mode contrast of either of these two species (Extended Data Fig. 8).
DISCUSSION
Our results establish a paradigm for visualizing protease activity non-invasively with ultrasound imaging. This paradigm is enabled by the dependence of the buckling mechanics of GVs on the reinforcing protein GvpC, and the ability to turn this protein into a protease substrate by incorporating specific internal or terminal peptide sequences. Similar to the earliest work on fluorescent biosensors23,24, this initial study has focused on proteases due to the importance of this class of enzymes in biology, their relatively compact recognition motifs, and the large impact of their activity on protein structure. Based on our success in sensing the function of three distinct proteases, we anticipate that the basic design strategy presented here should be applicable to many enzymes of this type.
Our study lends itself to numerous future investigations to extend the applications of acoustic protease sensors beyond the proof-of-concept demonstrations shown here. While our experiments in E. Coli and within the mouse GI tract establish the critical ability of such biosensors to produce ultrasound contrast in relevant biological settings, additional application-centric optimizations would enable the use of these constructs to address specific problems in basic and synthetic biology. For example, purified acoustic biosensors could be designed to sense extracellular proteases, which play homeostatic and disease-causing roles in tissues ranging from extracellular matrix remodeling and blood clot formation to inter-cellular signaling. Meanwhile, the expression of acoustic biosensor genes in cells could be used to monitor natural cellular enzyme activity or serve as the output of synthetic signaling pathways. Intracellular use in bacteria could be particularly relevant in studying microbes in the mammalian GI tract, provided the successful adaptation of acoustic sensor genes to the relevant host species and ensuring successful delivery via oral gavage, colonization and metabolic viability. For potential applications in mammalian cells, acoustic protease sensor designs must be integrated into recently developed genetic programs enabling the expression of GVs in mammalian cells50. Successful use of acoustic sensors in this context will require increasing the level of mammalian GV expression to enable non-destructive nonlinear imaging.
In parallel, significant scope exists for further optimizing and generalizing the design of acoustic biosensors. While all three of our sensors produced detectable nonlinear contrast in response to protease activity, the changes exhibited by GVSClpXP were significantly larger than for the other two constructs. This is not surprising for an enzyme that processively degrades GvpC, and whose recognition motif can be incorporated outside the main GV-binding region of GvpC. Endopeptidase sensors could be optimized to reach similar performance by incorporating more than one cleavage site within the GvpC sequence and tuning the linkers connecting these sites to the rest of the protein. As with other protease biosensors, the irreversibility of proteolysis means that for repeated or continuous sensing, it is necessary for new sensor molecules to be synthesized or delivered. For genetically encoded biosensors, this occurs through gene expression, potentially posing a metabolic burden to the cell. For GVs, this burden could be reduced by re-expressing only the engineered GvpC rather than the full GV, since this protein can be added onto the shell of existing GVs, as demonstrated in this study and previous work12. Going beyond proteolytic sensors, we anticipate that our biosensor design strategy could be modified to enable allosteric conformational changes in GvpC, rather than its cleavage, to alter ultrasound contrast, thereby creating acoustic biosensors that respond reversibly to non-cleaving enzymes, ions or other signals of interest.
In addition to optimizing the biosensor constructs, it is also possible to improve the ultrasound techniques used for their visualization. In this study, we monitored the activation of our biosensors using a nonlinear x-AM pulse sequence, quantifying the resulting contrast relative to linear B-mode scattering. This ratiometric signal is advantageous for quantification in scenarios where the sensor concentration may vary. However, the dependence of the x-AM response on applied acoustic pressure introduces a variable that may differ across the ultrasonic field of view, and strategies involving dynamic pressure adjustment may be needed to obtain the optimal signal from each point in the imaged plane. In addition, normalization to B-mode signal in complex in vivo contexts may require methods to separate the linear scattering contributions of acoustic sensors from those of background tissue. With these improvements, acoustic biosensors promise to take dynamic imaging of molecular and cellular function to new depths.
ONLINE METHODS
Design and cloning of genetic constructs
All gene sequences were codon optimized for E.Coli expression and inserted into their plasmid backbones via Gibson Assembly or KLD Mutagenesis using enzymes from New England Biolabs and custom primers from Integrated DNA Technologies. The protease recognition sequences for TEV protease and μ-calpain, flanked by flexible linkers, were introduced by substitution-insertion into the second repeat of the wild-type Ana gvpC gene sequence in a pET28a expression vector (Novagen) driven by a T7 promoter and lac operator. The ssrA degradation tag for the ClpXP bacterial proteasome was appended to the C-terminus of Ana gvpC using a short flexible linker. The acoustic sensor gene for intracellular protease sensing of ClpXP was constructed by modifying of the acoustic reporter gene cluster ARG18, by addition of the ssrA degradation tag to the C-terminal of gvpC using a linker sequence. For expression in E.Coli Nissle 1917 cells, the pET28a T7 promoter was replaced by the T5 promoter. For inducible expression of clpX and clpP, the genes encoding those two proteins were cloned from the E. Coli Nissle 1917 genome into a modified pTARA backbone under a PBAD promoter and araBAD operon. For dynamic regulation of intracellular sensing, the wild-type GvpC sequence was cloned into a modified pTARA backbone under a pTet promoter and tetracycline operator. The complete list and source of plasmids used in this study is given in Supplementary Table 1. Plasmid constructs were cloned using NEB Turbo E. Coli (New England Biolabs) and sequence-validated.
Construction of clpX− clpP− strain of E.Coli Nissle 1917 (ΔclpXP)
The knockout of clpX and clpP in E.Coli Nissle (ECN) was accomplished by Lambda Red recombineering using previously published methods51. A FRT-flanked cat gene was recombined into ECN genome to replace the clpX and clpP genes, and the integrated cat gene was then removed by the FLP recombinase from pE-FLP52 to yield the ΔclpXP strain. More information on the recombineering plasmids used in this study and their source is provided in Supplementary Table 1.
GV expression, purification and quantification
For in vitro assays, GVs were harvested and purified from confluent Ana cultures using previously published protocols12,28. Briefly, Ana cells were grown in Gorham’s media supplemented with BG-11 solution (Sigma) and 10 mM sodium bicarbonate at 25°C, 1% CO2 and 100 rpm shaking, under a 14h light and 10h dark cycle. Confluent cultures were transferred to sterile separating funnels and left undisturbed for 2–3 days to allow buoyant Ana cells expressing GVs to float to the top and for their subnatant to be drained. Hypertonic lysis with 10% Solulyse (Genlantis) and 500 mM sorbitol was used to release and harvest the Ana GVs. Purified GVs were obtained through 3–4 rounds of centrifugally assisted floatation, with removal of the subnatant and resuspension in phosphate buffered saline (PBS, Corning) after each round.
For expression of acoustic reporter/sensor genes (ARG/ASG) in bacteria, wild-type E. Coli Nissle 1917 cells (Ardeypharm GmbH) were made electrocompetent and transformed with the genetic constructs. After electroporation, cells were rescued in SOC media supplemented with 2% glucose for 1h at 37°C. Transformed cells were grown for 12–16 hours at 37°C in 5 mL of LB medium supplemented with 50 μg/mL kanamycin and 2% glucose. Large-scale cultures for expression were prepared by a 1:100 dilution of the starter culture in LB medium containing 50 μg/mL kanamycin and 0.2% glucose. Cells were grown at 37°C to an OD600nm of 0.2–0.3, then induced with 3μM Isopropyl β-D-1-thiogalactopyranoside (IPTG) and allowed to grow for 22 hrs at 30°C. Buoyant E.Coli Nissle cells expressing GVs were isolated from the rest of the culture by centrifugally assisted floatation in 50 mL conical tubes at 300g for 3–4 hrs, with a liquid column height less than 10 cm to prevent GV collapse by hydrostatic pressure.
The concentration of Ana GVs was determined by measurement of their optical density (OD) at 500 nm (OD500) using a Nanodrop spectrophotometer (Thermo Fisher Scientific), using the resuspension buffer or collapsed GVs as the blank. As established in previous work28, the concentration of GVs at OD500 = 1 is approximately 114 pM and the gas fraction is 0.0417%. The OD of buoyant cells expressing GVs were quantified at 600 nm using the Nanodrop.
Bacterial expression and purification of GvpC variants
For expression of Ana GvpC variants, plasmids were transformed into chemically competent BL21(DE3) cells (Invitrogen) and grown overnight for 14–16 h at 37°C in 5 mL starter cultures in LB medium with 50 μg/mL kanamycin. Starter cultures were diluted 1:250 in Terrific Broth (Sigma) and allowed to grow at 37°C (250 rpm shaking) to reach an OD600nm of 0.4–0.7. Protein expression was induced by addition of 1 mM IPTG, and the cultures were transferred to 30°C. Cells were harvested by centrifugation at 5500g after 6–8 hours. For the GvpC-ssrA variant, expression was carried out at 25°C for 8 hours to reduce the effect of protease degradation and obtain sufficient protein yield.
GvpC was purified from inclusion bodies by lysing the cells at room temperature using Solulyse (Genlantis), supplemented with lysozyme (400 μg/mL) and DNase I (10 μg/mL). Inclusion body pellets were isolated by centrifugation at 27,000g for 15 mins and then resuspended in a solubilization buffer comprising 20 mM Tris-HCl buffer with 500 mM NaCl and 6 M urea (pH: 8.0), before incubation with Ni-NTA resin (Qiagen) for 2 h at 4°C. The wash and elution buffers were of the same composition as the solubilization buffer, but with 20mM and 250 mM imidazole respectively. The concentration of the purified protein was assayed using the Bradford Reagent (Sigma). Purified GvpC variants were verified to be >95% pure by SDS-PAGE analysis.
Preparation of gas vesicles for in vitro protease assays
Engineered GVs having protease-sensitive or wild-type GvpC were prepared using urea stripping and GvpC re-addition12,28. Briefly, Ana GVs were stripped of their native outer layer of GvpC by treatment with 6M urea solution buffered with 100 mM Tris- HCl (pH:8–8.5). Two rounds of centrifugally assisted floatation with removal of the subnatant liquid after each round were performed to ensure complete removal of native GvpC. Recombinant Ana GvpC variants purified from inclusion bodies were then added to the stripped Ana GVs in 6 M urea a 2–3x molar excess concentration determined after accounting for 1:25 binding ratio of GvpC: GvpA. For a twofold stoichiometric excess of GvpC relative to binding sites on an average Ana GV, the quantity of recombinant GvpC (in nmol) to be added to stripped GVs was calculated according to the formula: 2 * OD * 198 nM * volume of GVs (in liters). The mixture of stripped GVs (OD 500nm = 1–2) and recombinant GvpC in 6 M urea buffer was loaded into dialysis pouches made of regenerated cellulose membrane with a 6–8 kDa M.W. cutoff (Spectrum Labs). The GvpC was allowed to slowly refold onto the surface of the stripped GVs by dialysis in 4 L PBS for at least 12 h at 4 °C. Dialyzed GV samples were subjected to two or more rounds of centrifugally assisted floatation at 300 g for 3–4 h to remove any excess unbound GvpC. Engineered GVs were resuspended in PBS after subnatant removal and quantified using pressure-sensitive OD measurements at 500 nm using a Nanodrop.
Pressurized absorbance spectroscopy
Purified, engineered Ana GVs were diluted in experimental buffers to an OD500nm ~ 0.2–0.4, and 400 μL of the diluted sample was loaded into a flow-through quartz cuvette with a pathlength of 1 cm (Hellma Analytics). Buoyant E.Coli Nissle cells expressing GVs were diluted to an OD600nm of ~ 1 in PBS for measurements. A 1.5 MPa nitrogen gas source was used to apply hydrostatic pressure in the cuvette through a single valve pressure controller (PC series, Alicat Scientific), while a microspectrometer (STS-VIS, Ocean Optics) measured the OD of the sample at 500 nm (for Ana GVs) or 600 nm (for Nissle cells). The hydrostatic pressure was increased from 0 to 1 MPa in 20 kPa increments with a 7 second equilibration period at each pressure before OD measurement. Each set of measurements was normalized by scaling to the Min-Max measurement value, and the data was fitted using the Boltzmann sigmoid function , with the midpoint of normalized OD change (Pc) and the 95% confidence intervals, rounded to the nearest integer, reported in the figures.
TEM sample preparation and imaging
Freshly diluted samples of engineered Ana GVs (OD500nm ~ 0.3) in 10 mM HEPES buffer containing 150 mM NaCl (pH 8) were used for TEM. 2 μL of the sample was added to Formvar/carbon 200 mesh grids (Ted Pella) that were rendered hydrophilic by glow discharging (Emitek K100X). 2% uranyl acetate was added for negative staining. Images were acquired using the FEI Tecnai T12 LaB6 120kV TEM equipped with a Gatan Ultrascan 2k X 2k CCD and ‘Leginon’ automated data collection software suite.
Dynamic light scattering (DLS) measurements
Engineered Ana GVs were diluted to an OD500nm ~ 0.2 in experimental buffers. 150–200 μL of the sample was loaded into a disposable cuvette (Eppendorf UVette®) and the particle size was measured using the ZetaPALS particle sizing software (Brookhaven instruments) with an angle of 90 ° and refractive index of 1.33.
Denaturing polyacrylamide gel electrophoresis (SDS-PAGE)
GV samples were OD500nm matched and mixed 1:1 with 2x Laemmli buffer (Bio-Rad), containing SDS and 2-mercaptoethanol. The samples were then boiled at 95°C for 5 minutes and loaded into a pre-made polyacrylamide gel (Bio-Rad) immersed in 1x Tris-Glycine-SDS Buffer. 10 uL of Precision Plus Protein™ Dual Color Standards (Bio-Rad) was loaded as the ladder. Electrophoresis was performed at 120V for 55 minutes, after which the gel was washed in DI water for 15 minutes to remove excess SDS and commassie-stained for 1 hour in a rocker-shaker using the SimplyBlue SafeStain (Invitrogen). The gel was allowed to destain overnight in DI water before imaging using a Bio-Rad ChemiDoc™ imaging system.
In vitro protease assays
For in vitro assays with the TEV endopeptidase, recombinant TEV protease (R&D Systems, Cat. No. 4469-TP-200) was incubated (25% v/v fraction) with engineered Ana GVs resuspended in PBS (final OD500nm in reaction mixture = 5–6) at 30°C for 14–16 h. This corresponds to a TEV concentration of 0.1~0.125 mg/mL (depending on the lot), within the range used in previous studies with this enzyme53,54. Engineered GVs with wild-type GvpC and TEV protease heat-inactivated at 80°C for 20–30 mins were used as the controls.
For in vitro assays with calpain, calpain-1 from porcine erythrocytes (Millipore Sigma, Cat. No. 208712) was incubated in a 10% v/v fraction with engineered Ana GVs in a reaction mixture containing 50 mM Tris-HCl, 50 mM NaCl, 5 mM 2-mercaptoethanol, 1 mM EDTA and 1 mM EGTA and 5 mM Ca2+ (pH: 7.5) This corresponds to a calpain concentration of ≥ 0.168 units per μl, with 1 unit defined by the manufacturer as sufficient to cleave 1 pmol of a control fluorogenic substrate in 1 min at 25°C. The final concentration of engineered GVs in the reaction mixture was OD500nm ~ 6 and the protease assay was carried out at 25°C for 14–16h. Negative controls included the same reaction mixture without calpain, without calcium, or without calpain and calcium. Engineered GVs with WT-GvpC were used as additional negative controls.
For in vitro assays with ClpXP, a reconstituted cell-free transcription-translation (TX-TL) system adapted for ClpXP degradation assays55 (gift from Zachary Sun and Richard Murray) was used. Briefly, cell-free extract was prepared by lysis of ExpressIQ E.Coli cells (New England Biolabs), and mixed in a 44% v/v ratio with an energy source buffer, resulting in a master mix of extract and buffer comprising: 9.9 mg/mL protein, 1.5 mM each amino acid except leucine, 1.25 mM leucine, 9.5 mM Mg-glutamate, 95 mM K-glutamate, 0.33 mM DTT, 50 mM HEPES, 1.5 mM ATP and GTP, 0.9 mM CTP and UTP, 0.2 mg/mL tRNA, 0.26 mM CoA, 0.33 mM NAD, 0.75 mM cAMP, 0.068 mM folinic acid, 1 mM spermidine, 30 mM 3-PGA and 2% PEG-8000. For purified ClpX protein, a monomeric N-terminal deletion variant Flag-ClpXdeltaNLinkedHexamer-His656 (Addgene ID: 22143) was used. Post Ni-NTA purification, active fractions of ClpX hexamers with sizes above 250 kDa were isolated using a Supradex 2010/300 column, flash frozen at a concentration of 1.95 μM and stored at −80°C in a storage buffer consisting of: 50 mM Tris-Cl (pH 7.5), 100 mM NaCl, 1mM DTT, 1 mM EDTA and 2% DMSO. The final reaction mixture was prepared as follows: 75% v/v fraction of the master mix, 10% v/v of purified ClpX, 1nm of the purified pBEST-ClpP plasmid and engineered Ana GVs (concentration of OD500nm = 2.5–2.7 in the reaction mixture). The mixture was made up to the final volume using ultrapure H2O. The reaction was allowed to proceed at 30°C for 14–16 h. As a negative control, a protease inhibitor cocktail mixture (SIGMAFAST™, Millipore Sigma) was added to the reaction mixture at 1.65x the manufacturer-recommended concentration and pre-incubated at room temperature for 30 mins.
Dynamic sensing of ClpXP activity in ΔclpXP E.Coli Nissle 1917 cells
ClpXP E. Coli Nissle 1917 cells were made electrocompetent and co-transformed with the pET expression plasmid (Lac-driven) containing the ASG for ClpXP and a modified pTARA plasmid (pBAD-driven) containing the clpX and clpP genes. Electroporated cells were rescued in SOC media supplemented with 2% glucose for 2h at 37°C. Transformed cells were grown overnight at 37°C in 5 mL LB medium supplemented with 50 μg/mL kanamycin, 25 μg/mL chloramphenicol and 2% glucose. Starter cultures were diluted 1:100 in LB medium with 50 μg/mL kanamycin, 25 μg/mL chloramphenicol and 0.2% glucose and allowed to grow at 37 °C to reach an OD600nm of 0.2–0.3. ASG expression was induced with 3μM IPTG and the bacterial culture was transferred to the 30 °C incubator with 250 rpm shaking for 30 minutes. The culture was then split into two halves of equal volume, and one half was induced with 0.5% (weight fraction) L-arabinose for expression of ClpXP protease. Cultures with and without L-arabinose induction were allowed to grow for an additional 22 h at 30°C. Cultures were then spun down at 300 g in a refrigerated centrifuge at 4 °C for 3–4 h in 50 mL conical tubes to isolate buoyant cells expressing GVs from the rest of the culture. The liquid column height was maintained at less than 10 cm to prevent GV collapse by hydrostatic pressure.
Dynamic sensing of circuit-driven gene expression in E.Coli Nissle 1917 cells
Electrocompetent E. Coli Nissle cells were co-transformed with the pET expression plasmid (Lac-driven) containing the ASG for ClpXP and a modified pTARA plasmid57 (Tet-driven) containing the WT Ana GvpC gene. Electroporated cells were rescued in SOC media supplemented with 2% glucose for 2h at 37°C. Transformed cells were grown overnight at 37°C in 5 mL LB medium supplemented with 50 μg/mL kanamycin, 50 μg/mL chloramphenicol and 2% glucose. Starter cultures were diluted 1:100 in LB medium with 50 μg/mL kanamycin, 50 μg/mL chloramphenicol and 0.2% glucose and allowed to grow at 37 °C to reach an OD600nm of 0.2–0.3. ASG expression was induced with 3 μM IPTG and the bacterial culture was transferred to 30 °C incubator with 250 rpm shaking for 1.5–2 h. The culture was then split into two halves of equal volume, and one half was induced with 50 ng/mL aTc for expression of WT GvpC. Cultures with and without aTc induction were allowed to grow for an additional 20 h at 30°C. Cultures were then spun down at 300 g in a refrigerated centrifuge at 4 °C for 3–4 h in 50 mL conical tubes to isolate buoyant cells expressing GVs from the rest of the culture. The liquid column height was maintained at less than 10 cm to prevent GV collapse by hydrostatic pressure.
In vitro ultrasound imaging
Imaging phantoms were prepared by melting 1% agarose (w/v) in PBS and casting wells using a custom 3-Dprinted template mold containing a 2-by-2 grid of cylindrical wells with 2 mm diameter and 1 mm spacing between the outer radii in the bulk material. Ana GV samples from in vitro assays or buoyant Nissle cells expressing GVs were mixed 1:1 with 1% molten agarose solution at 42°C and quickly loaded before solidification into the phantom wells. All samples and their controls were OD-matched using the Nanodrop prior to phantom loading, with the final concentration being OD500nm = 2.2 for Ana GVs and OD600nm= 1.0–1.5 for buoyant Nissle cells. Wells not containing sample were filled with plain 1% agarose. Hydrostatic collapse at 1.4 MPa was used to determine that the contribution to light scattering from GVs inside the cells was similar for those expressing the acoustic sensor gene and its wild-type ARG counterpart. The phantom was placed in a custom holder on top of an acoustic absorber material and immersed in PBS to acoustically couple the phantom to the ultrasound imaging transducer.
Imaging was performed using a Verasonics Vantage programmable ultrasound scanning system and a L22–14v 128-element linear array Verasonics transducer, with a specified pitch of 0.1 mm, an elevation focus of 8 mm, an elevation aperture of 1.5mm and a center frequency of 18.5 MHz with 67% −6 dB bandwidth. Linear imaging was performed using a conventional B-mode sequence with a 128-ray-lines protocol. For each ray line, a single pulse was transmitted with an aperture of 40 elements. For nonlinear image acquisition, a custom cross-amplitude modulation (x-AM) sequence detailed in an earlier study15, with an x-AM angle (θ) of 19.5° and an aperture of 65 elements, was used. Both B-mode and x-AM sequences were programmed to operate close to the center frequency of the transducer (15.625 MHz) and the center of the sample wells were aligned to the set transmit focus of 5 mm. Transmitted pressure at the focus was calibrated using a Precision Acoustics fiber-optic hydrophone system. Each image was an average of 50 accumulations. B-mode images were acquired at a transmit voltage of 1.6V (132 kPa), and an automated voltage ramp imaging script (programmed in MATLAB) was used to sequentially toggle between B-mode and x-AM acquisitions. The script acquired x-AM signals at each specified voltage step, immediately followed by a B-mode acquisition at 1.6V (132 kPa), before another x-AM acquisition at the next voltage step. For engineered Ana GVs subjected to in vitro protease assays, an x-AM voltage ramp sequence from 4V (230 kPa) to 10V (621 kPa) in 0.2V increments was used. For wild-type Nissle cells expressing GVs, an x-AM voltage ramp sequence from 7.5V (458 kPa) to 25V (1.6 MPa) in 0.5V increments was used. Samples were subjected to complete collapse at 25V with the B-mode sequence for 10 seconds, and the subsequent B-mode image acquired at 1.6V and x-AM image acquired at the highest voltage of the voltage ramp sequence was used as the blank for data processing. There was no significant difference between the signals acquired at specific acoustic pressures during a voltage ramp or after directly stepping to the same pressure (Extended Data Fig. 9).
Due to transducer failure, a replacement Verasonics transducer (L22–14vX) with similar specifications was used in experiments with ΔclpXP cells. The transmitted pressure at the focus was calibrated in the same way as the L22–14v. B-mode images were acquired at a transmit voltage of 1.6V (309 kPa), and an x-AM voltage ramp sequence from 6V (502 kPa) to 25V (2.52 MPa) was used. The imaging protocol was otherwise unchanged.
In vivo ultrasound imaging
All in vivo experiments were performed on C57BL/6J male mice, aged 14–34 weeks, under a protocol approved by the Institutional Animal Care and Use Committee of the California Institute of Technology. No randomization or blinding were necessary in this study. Mice were anesthetized with 1–2% isoflurane, maintained at 37 °C on a heating pad, depilated over the imaged region, and enema was performed by injecting PBS to expel gas and solid contents in mice colon. For imaging of E. Coli in the gastrointestinal tract, mice were placed in a supine position, with the ultrasound transducer positioned on the lower abdomen, transverse to the colon such that the transmit focus of 5 mm was close to the center of the colon lumen. Prior to imaging, two variants of buoyancy-enriched E. Coli Nissle 1917 were mixed in a 1:1 ratio with 4% agarose in PBS at 42 °C, for a final bacterial concentration of 1.5E9 cells ml−1. An 8-gauge gavage needle was filled with the mixture of agarose and bacteria of one cell population. Before it solidified, a 14-gauge needle was placed inside the 8-gauge needle to form a hollow lumen within the gel. After the agarose-bacteria mixture solidified at room temperature for 10 min, the 14-gauge needle was removed. The hollow lumen was then filled with the agarose–bacteria of the other cell population. After it solidified, the complete cylindrical agarose gel was injected into the colon of the mouse with a PBS back-filled syringe. For the colon imaging, imaging planes were selected to avoid gas bubbles in the field of view. In all in vivo experiments, three transducers were used, including two L22–14v and one L22–14vX, due to transducer failures unrelated to this study. B-mode images were acquired at 1.9V (corresponding to 162 kPa in water) for L22–14v, and 1.6V (309 kPa in water) for L22–14vX. x-AM images were acquired at 20V (1.27 MPa in water) for L22–14v and 15V (1.56 MPa in water) for L22–14vX, with other parameters being the same as those used for in vitro imaging. B-mode anatomical imaging was performed at 7.4V using the ‘L22–14v WideBeamSC’ script provided by Verasonics.
Image processing and data analysis
All in vitro and in vivo ultrasound images were processed using MATLAB. Regions of interest (ROIs) were manually defined so as to adequately capture the signals from each sample well or region of the colon. The sample ROI dimensions (1.2 mm × 1.2 mm square) were the same for all in vitro phantom experiments. The noise ROI was manually selected from the background for each pair of sample wells. For the in vivo experiments, circular ROIs were manually defined to avoid edge effects from the skin or colon wall, and the tissue ROIs were defined as the rest of the region within the same depth range of the signal ROIs. For each ROI, the mean pixel intensity was calculated, and the pressure-sensitive ultrasound intensity (ΔI = Iintact − Icollapsed) was calculated by subtracting the mean pixel intensity of the collapsed image from the mean pixel intensity of the intact image. The contrast-to-noise ratio (CNR) was calculated for each sample well by taking the mean intensity of the sample ROI over the mean intensity of the noise ROI. The x-AM by B-mode ratio at a specific voltage (or applied acoustic pressure) was calculated with the following formula:
where ΔIx−AM(V) is the pressure-sensitive nonlinear ultrasound intensity acquired by the x-AM sequence at a certain voltage V, and ΔIB−mode(V) is the pressure-sensitive linear ultrasound intensity of the B-mode acquisitions at 1.6V (132 kPa) following the x-AM acquisitions at the voltage V. All images were pseudo-colored (bone colormap for B-mode images, hot colormap for x-AM images), with the maximum and minimum levels indicated in the accompanying color bars.
Statistical analysis
Data is plotted as the mean ± standard error of the mean (SEM). Sample size is N=3 biological replicates in all in vitro experiments unless otherwise stated. For each biological replicate, there were technical replicates to accommodate for variability in experimental procedures such as sample loading and pipetting. SEM was calculated by taking the values for the biological replicates, each of which was the mean of its technical replicates. The numbers of biological and technical replicates were chosen based on preliminary experiments such that they would be sufficient to report significant differences in mean values. Individual data for each replicate is given in Extended Data Figures 1–9 in the form of scatter plots. P values, for determining the statistical significance for the in vivo data, were calculated using a two-tailed paired t-test.
Data availability
The authors declare that data supporting the findings of this study are available within the article and its Supplementary Information. Additional data are available from the corresponding author upon reasonable request.
Extended Data
Extended Data Fig. 1. Engineering an acoustic sensor of TEV endopeptidase activity.
(a) Coomassie-stained SDS-PAGE gel of OD500nm-matched samples of GVWT incubated with dTEV and TEV protease, before and after buoyancy purification (labeled pre b.p. and post b.p., respectively). N = 3 biological replicates. (b) Scatter plots showing normalized OD500nm of GVSTEV as a function of hydrostatic pressure. (N = 3 biological replicates for GVSTEV + TEV and N =4 for GVSTEV + dTEV.) (c) Scatter plots showing the ratio of nonlinear (x-AM) to linear (B-mode) ultrasound signal as a function of applied acoustic pressure for all the replicate samples used in the x-AM voltage ramp imaging experiments for GVSTEV. N = 3 biological replicates and total number of replicates is 8. (d) Scatter plots showing normalized OD500nm of GVWT as a function of hydrostatic pressure. (N = 3 biological replicates for GVWT +dTEV and N=4 for GVWT + TEV.) (e) Representative ultrasound images of agarose phantoms containing GVWT incubated with TEV or dTEV protease at OD500nm 2.2. The B-mode image was acquired at 132kPa and the x-AM image at 569 kPa. Similar images acquired for N=3 biological replicates, with each N consisting of 3 technical replicates. CNR stands for contrast-to-noise-ratio, and color bars represent relative ultrasound signal intensity on the dB scale. Scale bars represent 1 mm (f) Scatter plots showing the ratio of nonlinear (x-AM) to linear (B-mode) ultrasound signal as a function of applied acoustic pressure for all the replicate samples used in the x-AM voltage ramp imaging experiments for GVWT. N=3 biological replicates, with each N consisting of 3 technical replicates. Solid curve represents the mean of all the replicates.
Extended Data Fig. 2. Engineering an acoustic sensor of calpain activity.
(a) Individual scatter plots for Fig. 2(b). N = 5 biological replicates for +Calp/+Ca2+, 6 for −Calp/+Ca2+ and +Calp/−Ca2+, 7 for −Calp/−Ca2+. (b) Coomassie-stained SDS-PAGE gel of OD500nm-matched samples of GVScalp incubated in the presence (+) or absence (−) of calpain (first +/−) and calcium (second +/−), before and after buoyancy purification (labeled pre b.p. and post b.p. respectively). N = 3 biological replicates. (c) Representative TEM images of GVScalp after incubations in the presence or absence of calpain and/or calcium. Scale bars represent 100 nm. At least 20 GV particles were imaged for each condition. (d) DLS measurements showing the average hydrodynamic diameter of GVScalp and GVWT samples after calpain/calcium incubations (N = 2 biological replicates for GVScalp +/−, +/+, GVWT +/+ and 3 for other conditions, individual dots represent each N and horizontal line indicates the mean). Error bars indicate SEM when N = 3. (e, f, g) Individual scatter plots for Fig. 2(d, f, h). N = 3 biological replicates with each N consisting of 2 technical replicates (total number of replicates is 18 for +/+ and 6 for each of the remaining conditions). Solid line represents the mean of all the replicates for (a, e–g). (h) Scatter plots for Fig. 2i; N = 3 biological replicates, individual dots represent each N and solid blue line showing the fitted curve (a Hill equation with a coefficient of 1, with a half-maximum response concentration (EC50) of 140 μm).
Extended Data Fig. 3. Characterization of GVWT sample with calpain protease.
(a, b, c) Representative ultrasound images of agarose phantoms containing GVWT incubated in the presence (+) or absence (−) of calpain (first +/−) and calcium (second +/−), at OD500nm 2.2. The B-mode images were taken at 132 kPa for a, b and c and the x-AM images corresponding to the maximum difference in non-linear contrast between the +/+ sample and the negative controls were taken at 438 kPa for a and b and at 425 kPa for c. CNR stands for contrast-to-noise-ratio and color bars represent ultrasound signal intensity in the dB scale. Scale bars represent 1 mm. N = 2 biological replicates for a, b and c. (d, e, f) Scatter plots showing the ratio of x-AM to B-mode ultrasound signal as a function of increasing acoustic pressure for GVWT after incubation in the presence or absence of calpain and/or calcium (N = 2 biological replicates). (g) Hydrostatic collapse curves of GVWT after incubations in the presence (+) or absence (−) of calpain and/or calcium. The legend lists the midpoint collapse pressure for each condition (±95% confidence interval) determined from fitting a Boltzmann sigmoid function (N = 5 biological replicates for −/+ and N = 6 for other conditions) (h) Coomassie-stained SDS-PAGE gel of OD500nm-matched samples of GVWT incubated in the presence (+) or absence (−) of calpain/calcium, before and after buoyancy purification (labeled pre b.p. and post b.p., respectively, N=1). Individual dots in d, e, f and g represent each N and solid line represents the mean of all the replicates.
Extended Data Fig. 4. Engineering an acoustic sensor of ClpXP proteolytic activity.
(a, b) Scatter plots for Figure. 3(d, g). N = 5 biological replicates. (c) Coomassie-stained SDS-PAGE gel of OD500nm-matched GVWT samples incubated in a reconstituted cell-free transcription-translation (TX-TL) system containing a protease inhibitor cocktail or ClpXP. N = 3 biological replicates. (d) Coomassie-stained SDS-PAGE gel of 30× diluted content of TX-TL system containing ClpXP. N = 2 biological replicates(e) DLS measurements showing the average hydrodynamic diameter of GVSClpXP and GVWT samples, after incubations with protease inhibitor or ClpXP (N = 2 biological replicates, individual dots represent each N and horizontal line indicates the mean). (f, g) Scatter plots showing the ratio of x-AM to B-mode acoustic signal as a function of applied acoustic pressure for all the replicate samples used in the x-AM voltage ramp experiments for GVSClpXP (f) and GVWT (g). N = 3 biological replicates, with each N consisting of 3 technical replicates. Individual dots represent each N and solid line represents the mean of all the replicates for a, b, f and g.
Extended Data Fig. 5. Constructing intracellular acoustic sensor genes for dynamic monitoring of protease activity and circuit-driven gene expression.
(a) Normalized pressure-sensitive optical density at 600 nm of WT Nissle cells expressing either ARGWT or ASGClpXP. The legend lists the midpoint collapse pressure for each cell type (±95% confidence interval) determined from fitting a Boltzmann sigmoid function (N = 5 biological replicates and 8 total replicates for ASGClpXP; N = 3 biological replicates for ARGWT and 6 total replicates). (b) Representative ultrasound images of WT Nissle cells expressing either ARGWT or ASGClpXP at OD600nm 1.5 (N = 4 biological replicates and the number of total replicates is 10). (c) Scatter plots showing x-AM/B-mode ratio as a function of applied acoustic pressure for WT Nissle cells expressing either ARGWT or ASGClpXP at OD600nm 1.5 (N = 4 biological replicates and the number of total replicates is 10). (d) Scatter plots for Figure 4b, N = 3 biological replicates. (e, f) Scatter plots showing the ratio of x-AM to B-mode acoustic signal as a function of acoustic pressure for all the replicate samples used in the x-AM voltage ramp experiments for ΔclpXP Nissle cells expressing ASGClpXP and araBAD driven clpXP, with or without L-arabinose induction (e) and WT Nissle cells expressing ASGClpXP and pTet-TetO driven WT gvpC, with or without aTc induction (f). N = 3 biological replicates, with each N having 3 technical replicates for (e) and N = 5 biological replicates for (f). Individual dots represent each N and solid line represents the mean of all the replicates for a, c, d, e and f.
Extended Data Fig. 6. Schematic illustrating the in vivo ultrasound imaging experiment.
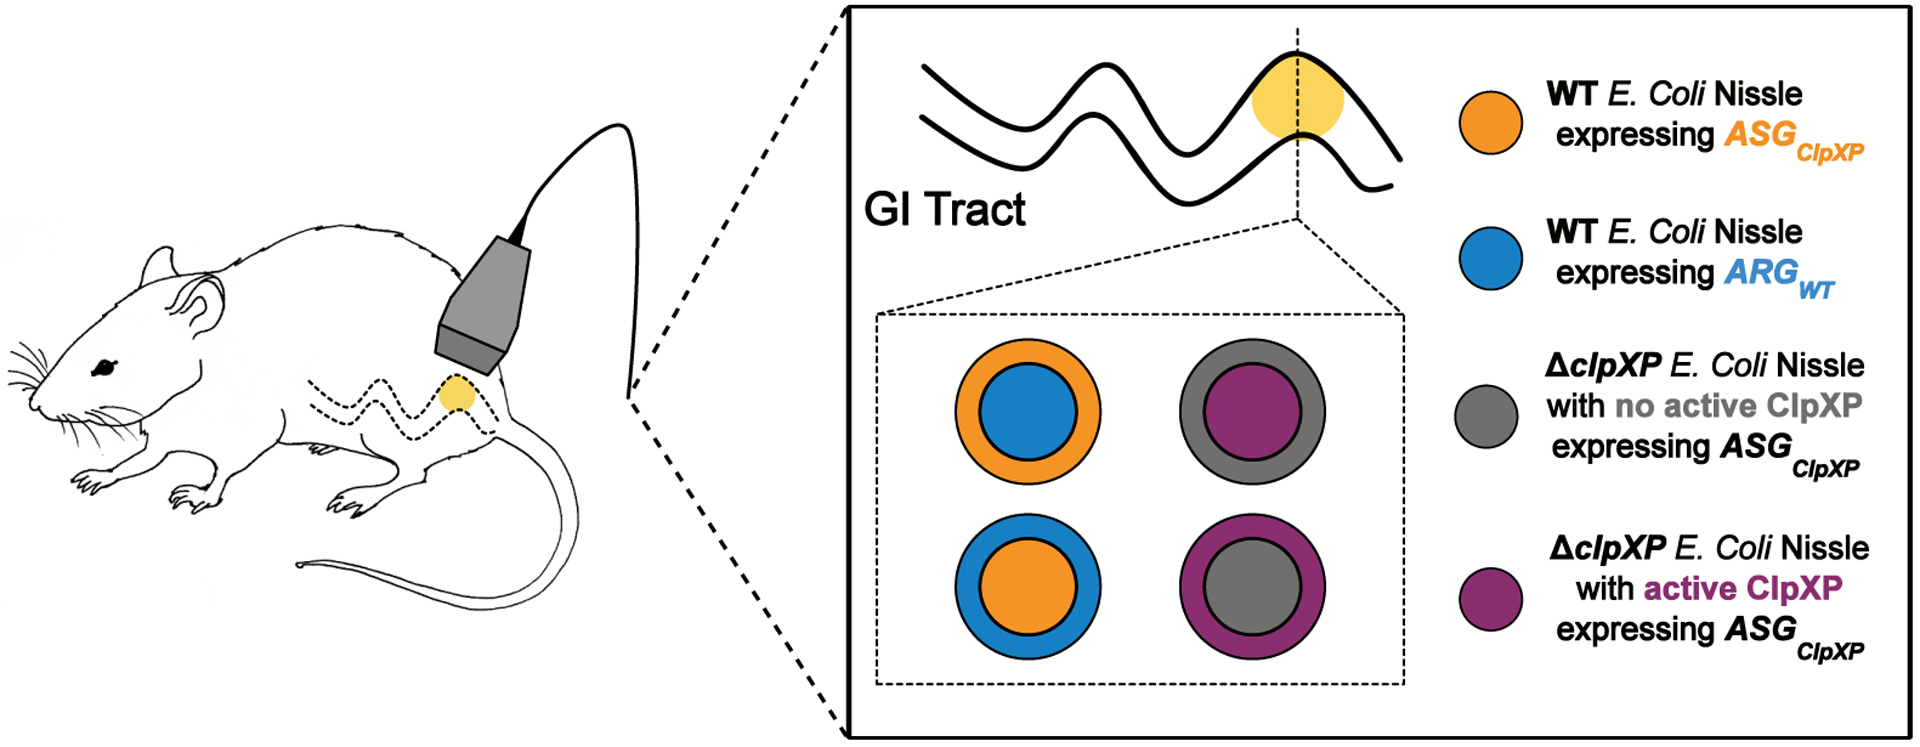
Cells in cylindrical hydrogel with the indicated cross-sectional arrangements were injected into the GI tract of mice and imaged with ultrasound
Extended Data Fig. 7. Ultrasound imaging of bacteria expressing acoustic sensor genes in the gastrointestinal tract of mice.
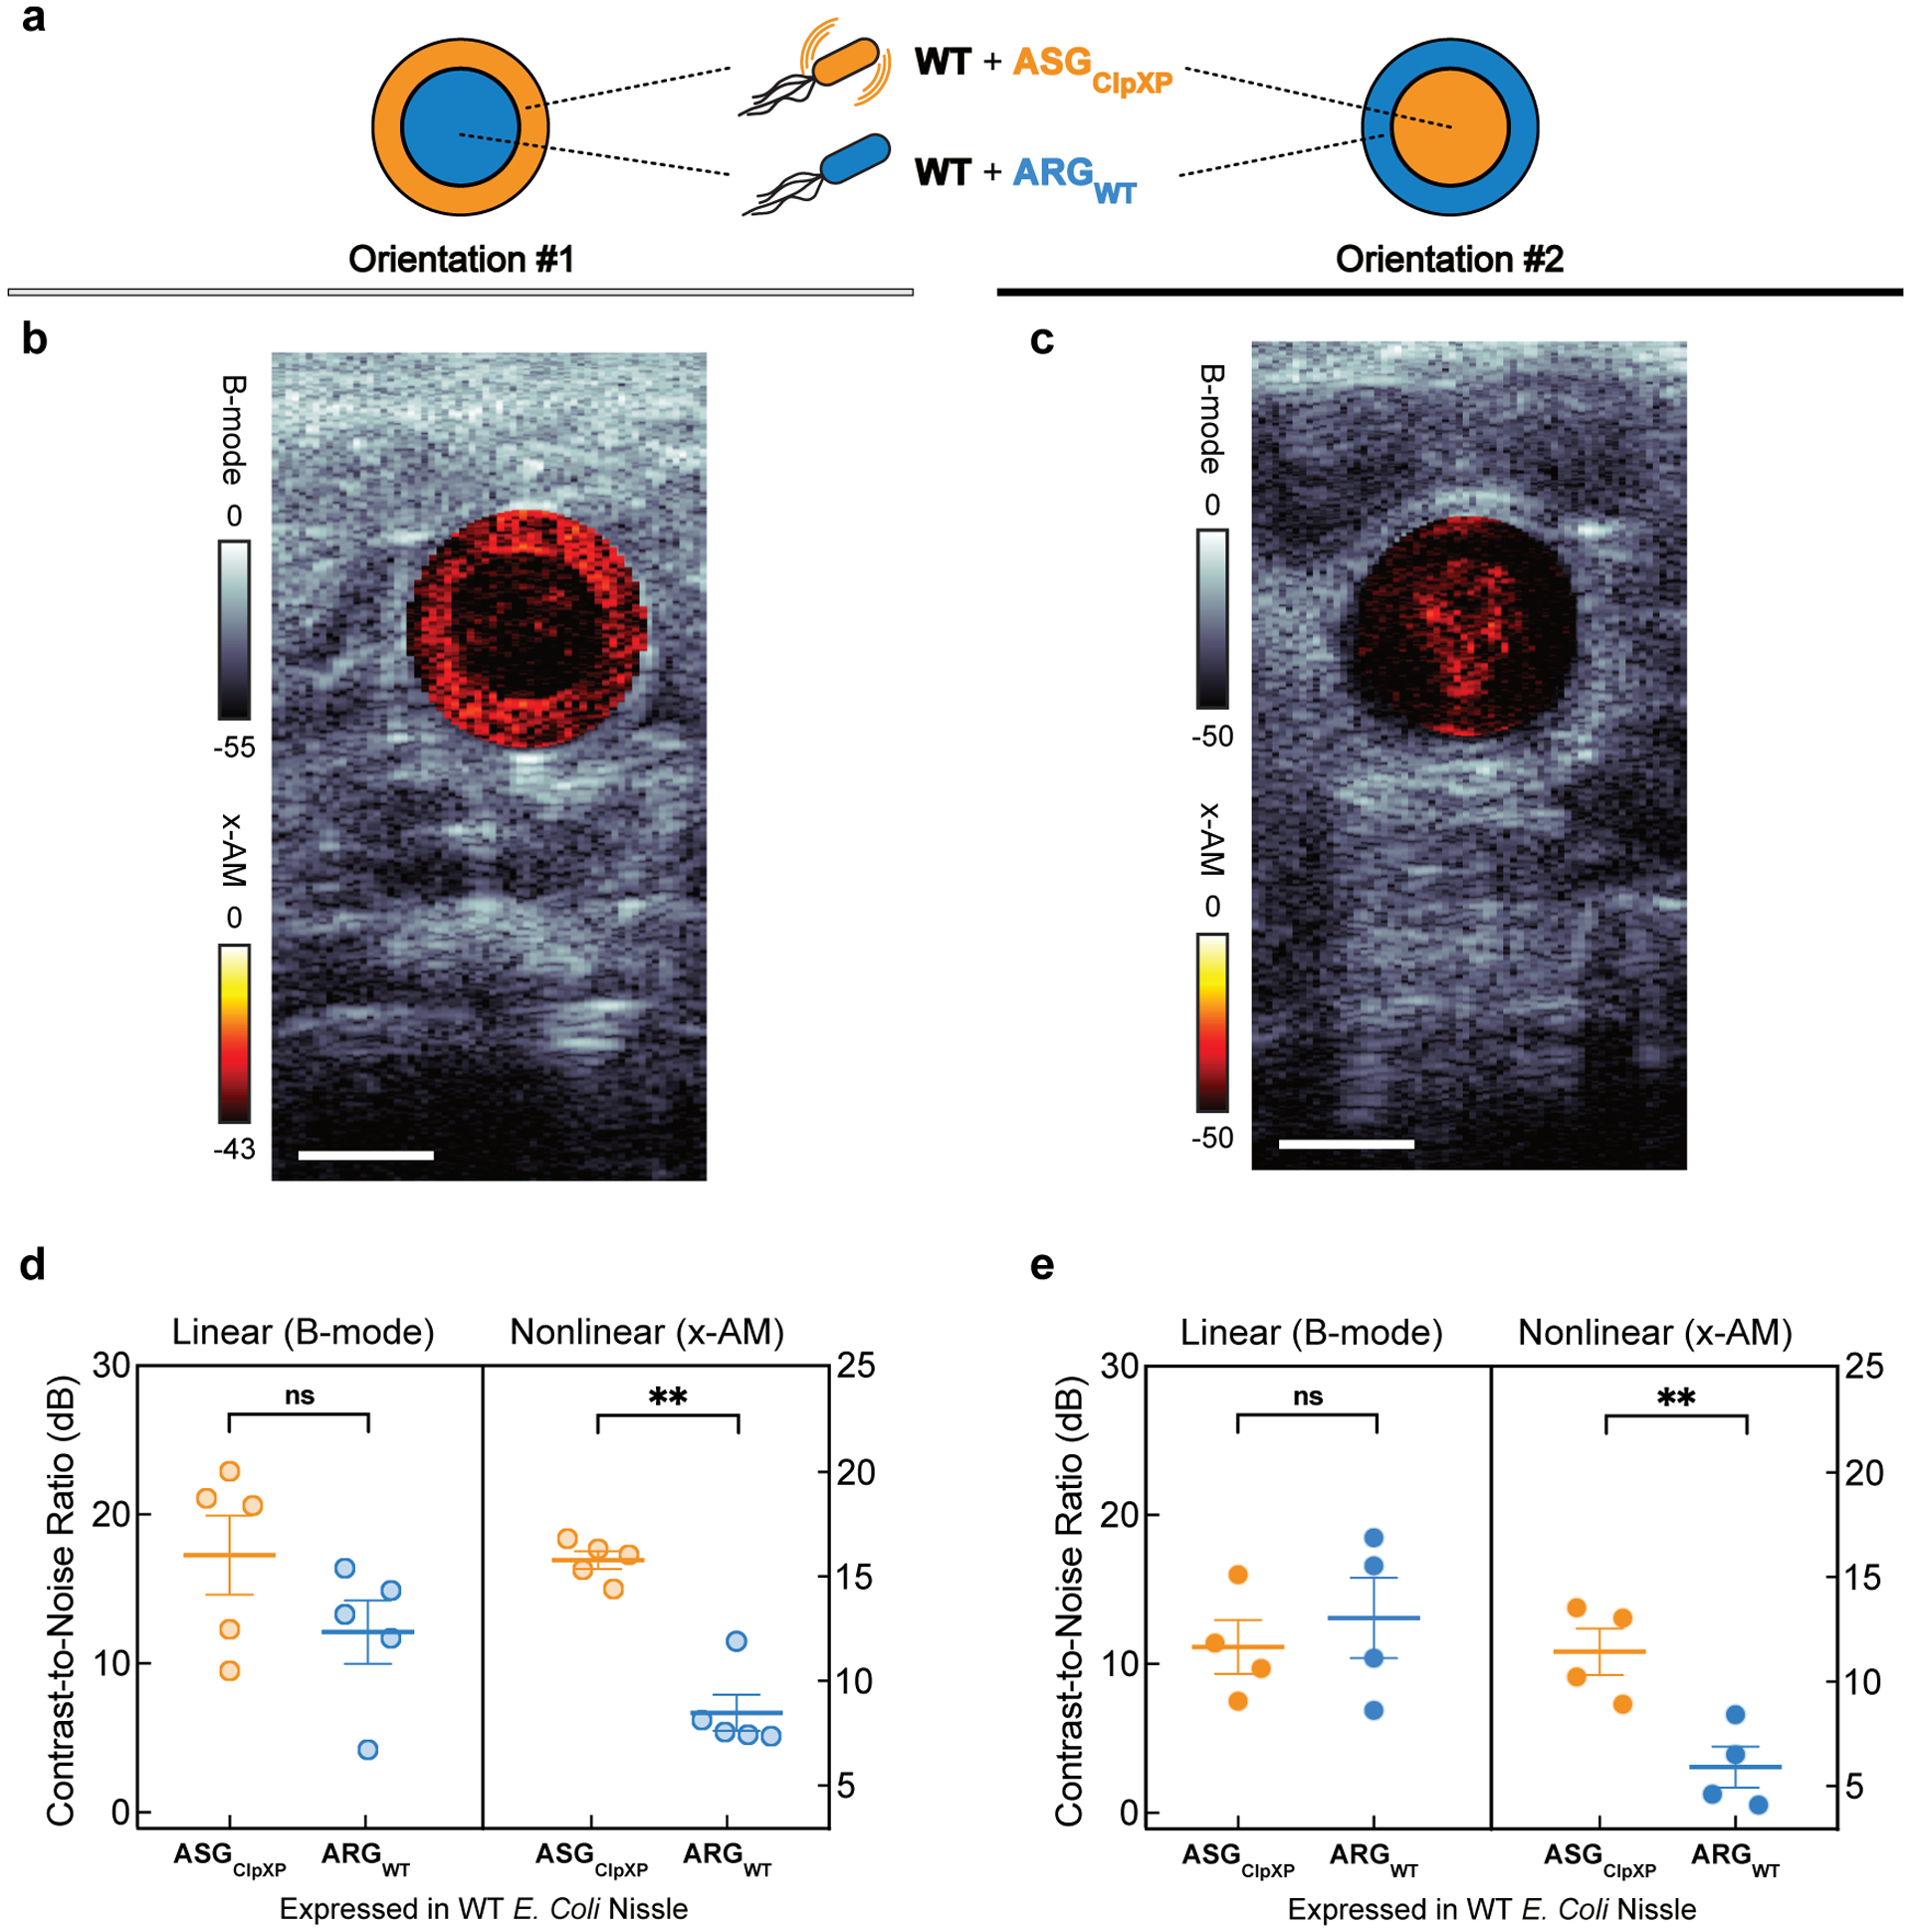
(a) Schematic illustrating two orientations of the wild type (WT) E. coli Nissle cells expressing ARGWT or ASGClpXP introduced into the mouse colon as a hydrogel. (b, c) Representative transverse ultrasound images of the colon for two mice used in the in vivo imaging experiments, with orientation #1 (b) and with orientation #2. (c). Cells are injected at a final concentration of 1.5E9 cells ml−1. B-mode signal is displayed using the bone colormap and x-AM signal is shown using the hot colormap. Color bars represent B-mode and x-AM ultrasound signal intensity in the dB scale. Scale bars represent 2 mm. (d, e) B-mode and xAM contrast-to-noise ratio (CNR) in vivo, for WT Nissle cells expressing ARGWT or ASGClpXP in orientation #1 (d) and orientation #2. (e). N = 5 mice for orientation #1 (b, d) and N = 4 mice for orientation #2 (c, e). Error bars indicate SEM. P = 0.0014 for x-AM signal from cells expressing ASGClpXP versus the ARGWT control in orientation #1, and P = 0.0016 for that in orientation #2. P = 0.0570 for B-mode signal in orientation #1 and P = 0.3445 in orientation #2. P-values were calculated using a two-tailed paired t-test. Individual dots represent each N and horizontal line indicates the mean.
Extended Data Fig. 8. ASGClpXP -expressing cells showed higher contrast to tissue with nonlinear imaging.
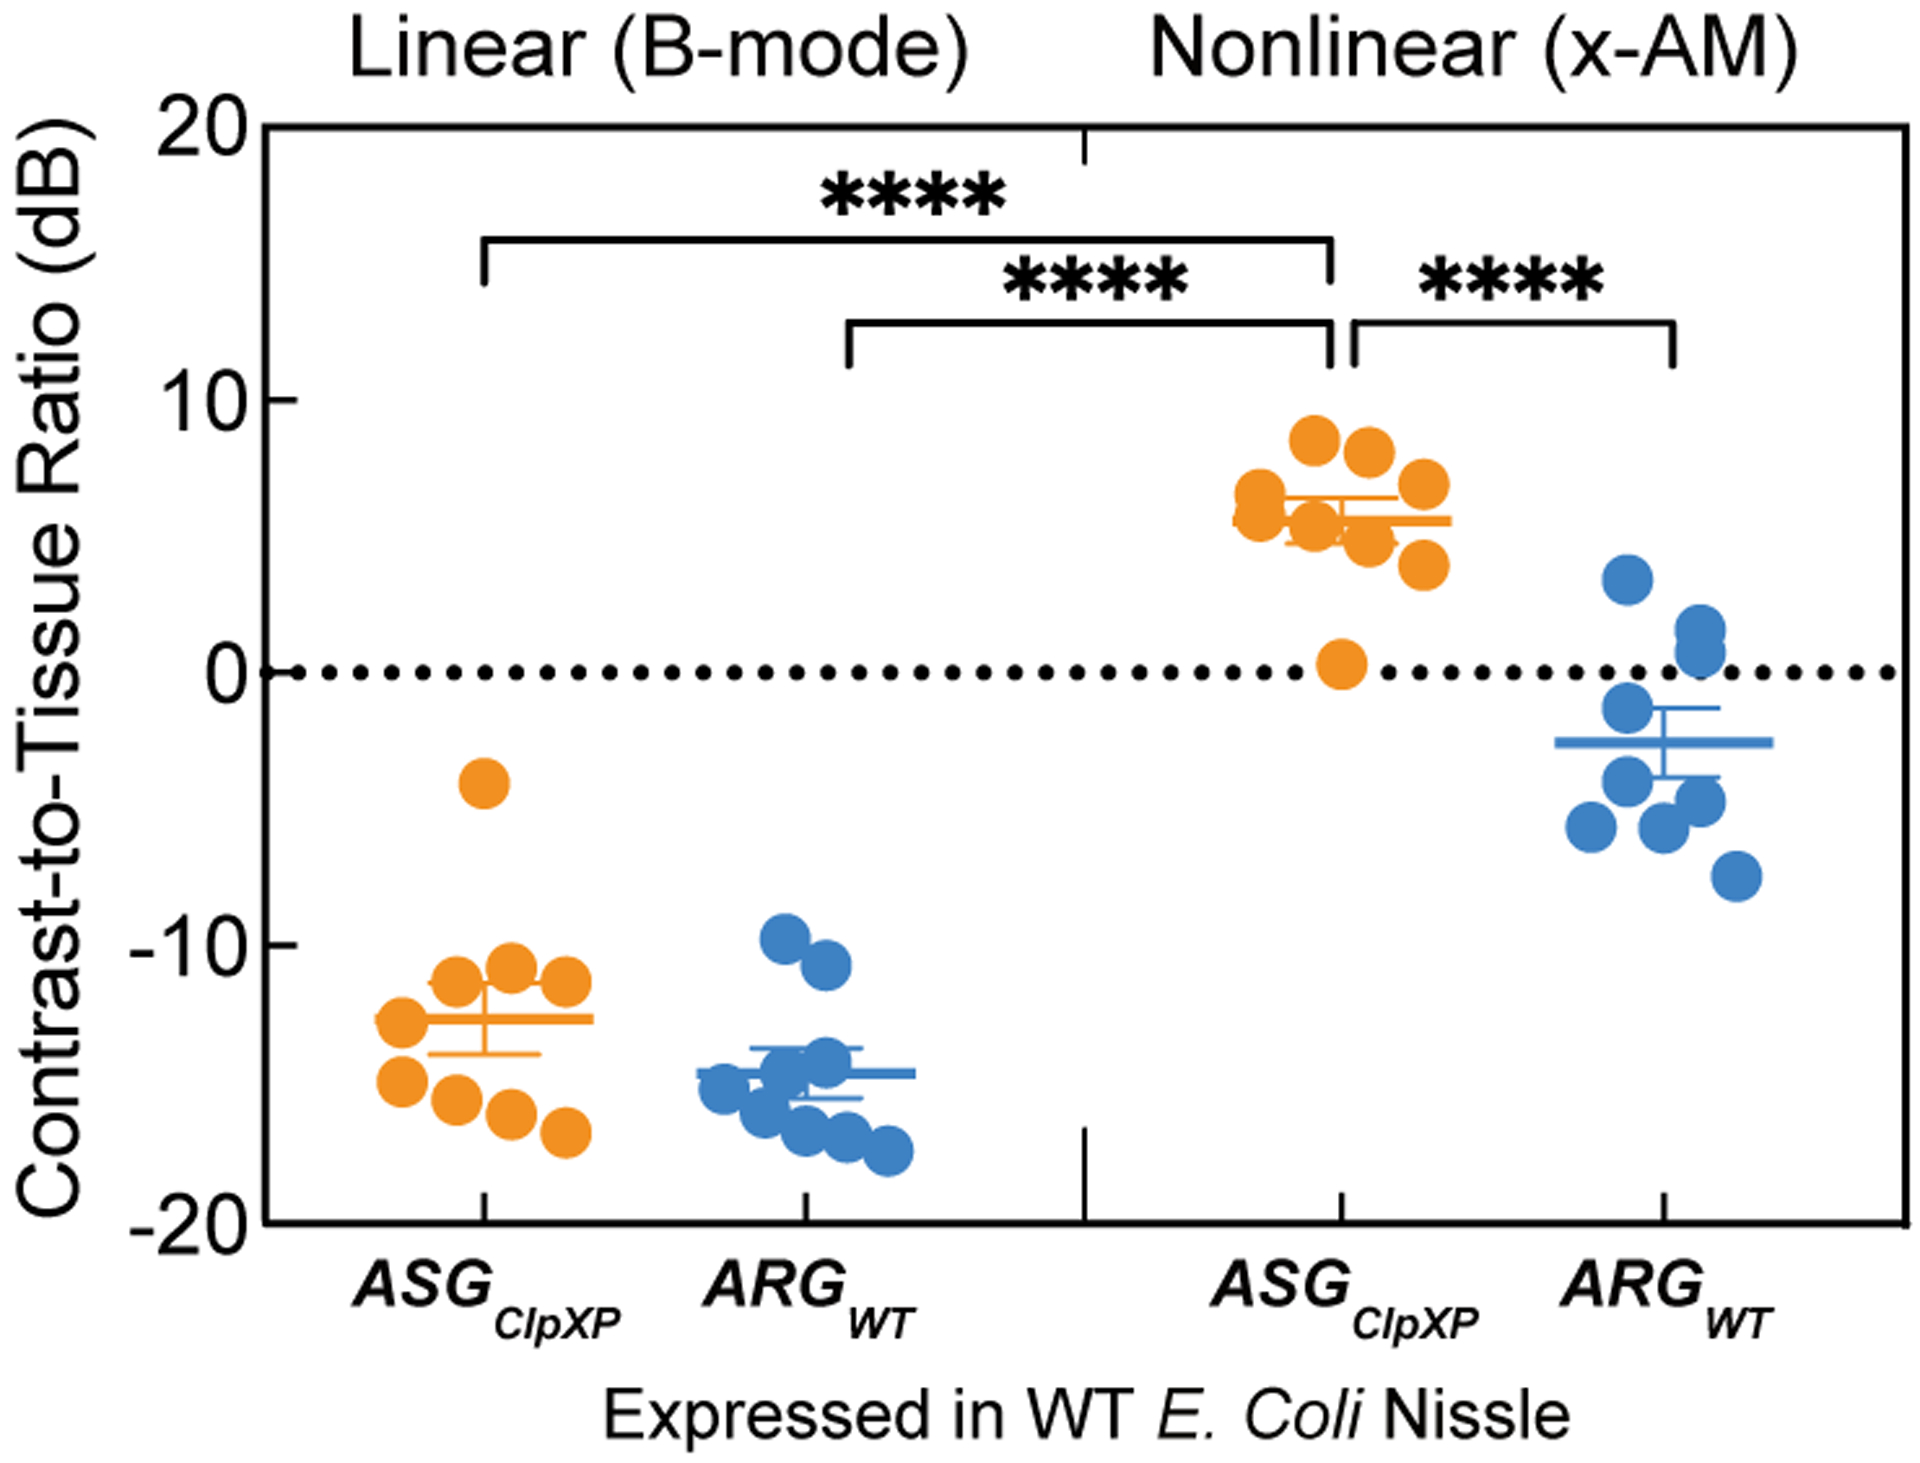
B-mode and xAM contrast-to-tissue ratio (CTR) in vivo, for WT Nissle cells expressing ARGWT or ASGClpXP in both orientations. P = 7.8E-5 for the CTR from xAM imaging of cells expressing ASGClpXP versus CTR from xAM imaging of cells expressing ARGWT. P = 1.4E-6 for the CTR from xAM imaging of cells expressing ASGClpXP versus CTR from B-mode imaging of cells expressing ASGClpXP and P = 4.9E-7 for the CTR from xAM imaging of cells expressing ASGClpXP versus CTR from B-mode imaging of cells expressing ARGWT. Individual dots represent each N, and the thick horizontal line indicates the mean. Error bars indicate SEM. N = 9 mice. P-values were calculated using a two-tailed paired t-test for each comparison independently. Individual dots represent each N and horizontal line indicates the mean.
Extended Data Fig. 9. Absence of memory effect from imaging at sequentially increasing acoustic pressure.
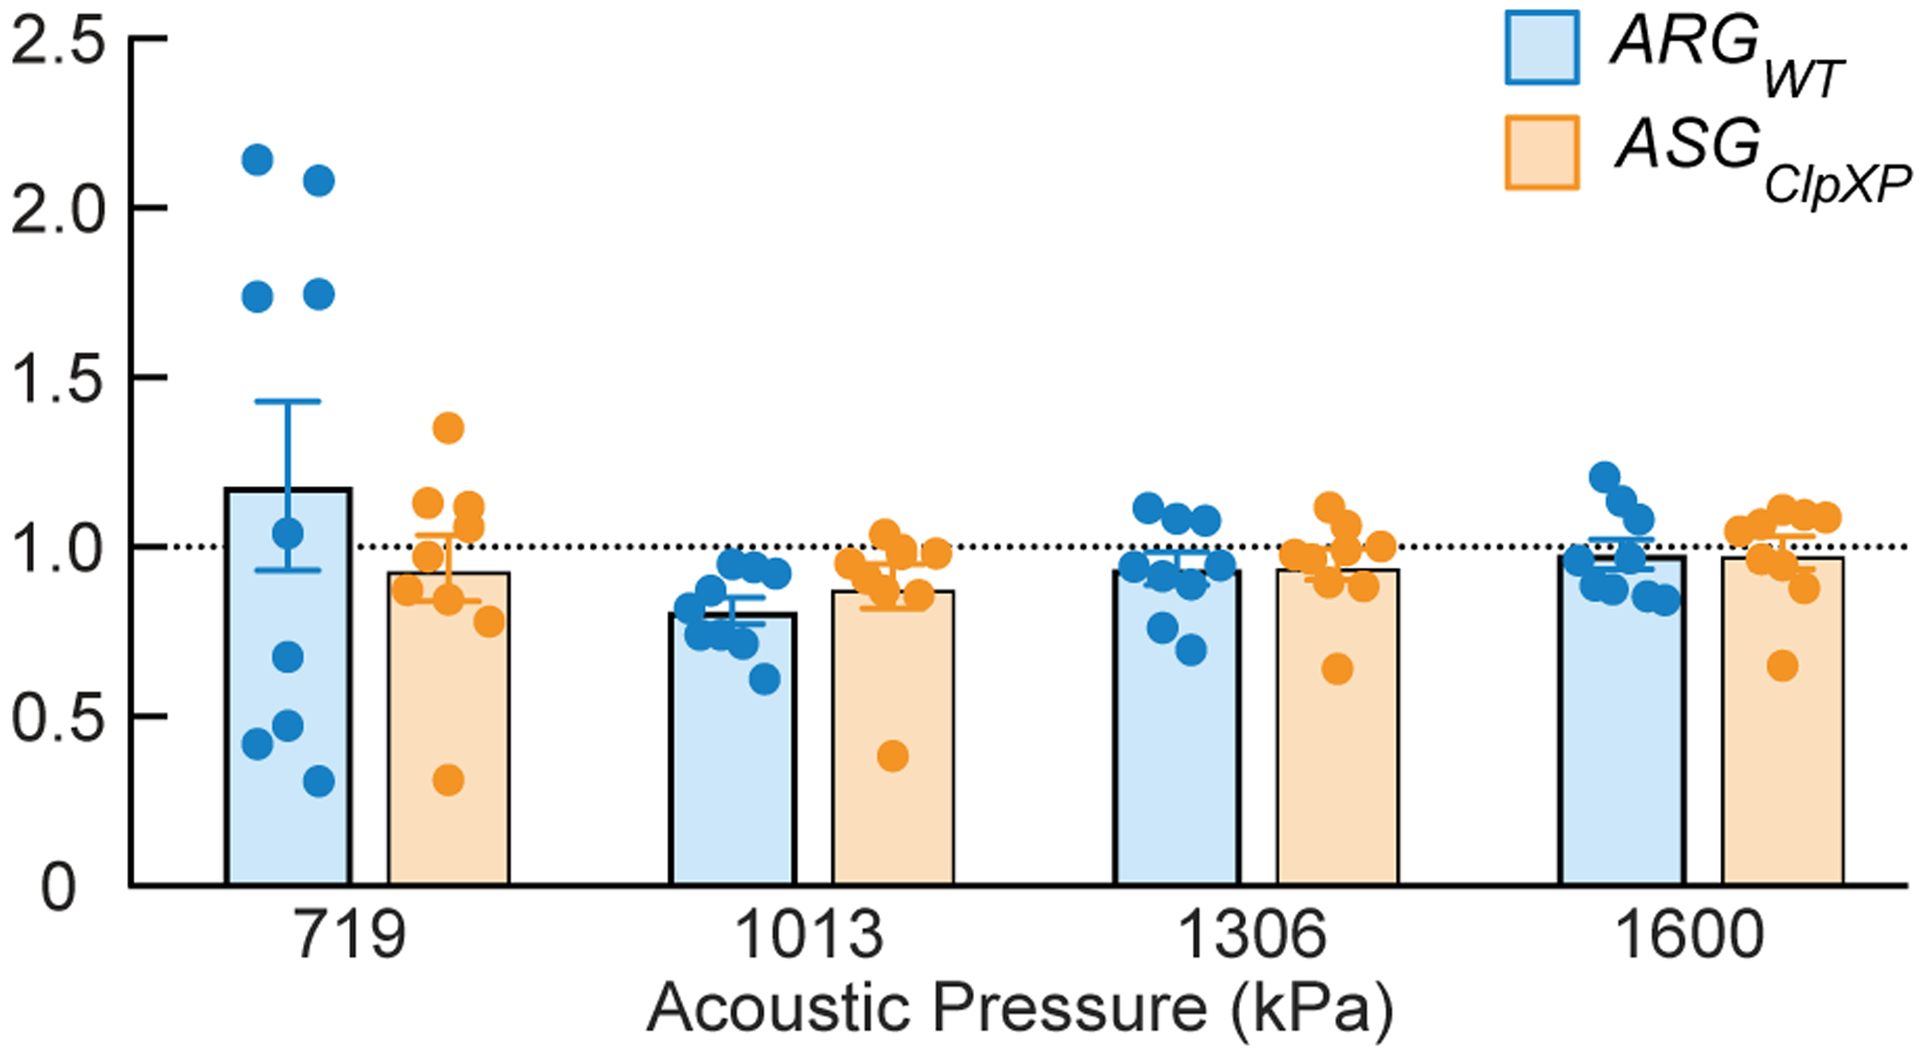
Ratio of sensor-specific signal (xAM/B-mode) acquired at the indicated acoustic pressures in the process of voltage ramping (comprising 36 points from 458 kPa to 1.6 MPa) or stepping the transducer output directly to corresponding pressure in a single step, for WT Nissle cells expressing either ARGWT or ASGClpXP. N=3 biological replicates, with each N having 3 technical replicates. Individual dots represent each replicate, and the thick horizontal line indicates the mean. Error bars indicate SEM derived from biological replicates (see Online Methods).
Supplementary Material
ACKNOWLEDGEMENTS
The authors thank Z. Sun, A. Shur and R. Murray for sharing protocols and reagents for using the cell-free transcription-translation system. Transmission electron microscopy was done in the Beckman Institute Resource Center for Transmission Electron Microscopy at Caltech. This research was supported by the NIH (R01-EB018975) and DARPA (W911NF-14-1-0111). A.L. was supported by the NSF graduate research fellowship (Award No. 1144469) and the Biotechnology Leadership pre-doctoral Training Program in Micro/Nanomedicine (Rosen Bioengineering Center and NIH Training Grant 5T32GM112592-03/04). D.P.S. is supported by the NSF graduate research fellowship (Award No. 1745301). D.M. is supported by the Human Frontier Science Program (Grant No. LT000637/2016). Related research in the Shapiro Laboratory is also supported by the Heritage Medical Research Institute, Burroughs Wellcome Career Award at the Scientific Interface, the Pew Scholarship in the Biomedical Sciences, and the Packard Fellowship for Science and Engineering.
Footnotes
COMPETING FINANCIAL INTERESTS
The authors declare no competing financial interests.
REFERENCES
- 1.Lin MZ & Schnitzer MJ Genetically encoded indicators of neuronal activity. Nature Neuroscience 19, 1142–1153 (2016). [DOI] [PMC free article] [PubMed] [Google Scholar]
- 2.Palmer AE, Qin Y, Park JG & McCombs JE Design and application of genetically encoded biosensors. Trends in Biotechnology 29, 144–152 (2011). [DOI] [PMC free article] [PubMed] [Google Scholar]
- 3.Rodriguez EA et al. The growing and glowing toolbox of fluorescent and photoactive proteins. Trends in Biochemical Sciences 42, 111–129 (2017). [DOI] [PMC free article] [PubMed] [Google Scholar]
- 4.Miyawaki A & Niino Y Molecular spies for bioimaging—fluorescent protein-based probes. Molecular Cell 58, 632–643 (2015). [DOI] [PubMed] [Google Scholar]
- 5.Piraner DI et al. Going Deeper: Biomolecular Tools for Acoustic and Magnetic Imaging and Control of Cellular Function. Biochemistry (2017). [DOI] [PMC free article] [PubMed] [Google Scholar]
- 6.Maresca D et al. Biomolecular Ultrasound and Sonogenetics. Annual Review of Chemical and Biomolecular Engineering 9, 229–252 (2018). [DOI] [PMC free article] [PubMed] [Google Scholar]
- 7.Shapiro MG et al. Biogenic gas nanostructures as ultrasonic molecular reporters. Nature Nanotechnology 9, 311–316 (2014). [DOI] [PMC free article] [PubMed] [Google Scholar]
- 8.Bourdeau RW et al. Acoustic reporter genes for noninvasive imaging of microorganisms in mammalian hosts. Nature 553, 86–90 (2018). [DOI] [PMC free article] [PubMed] [Google Scholar]
- 9.Walsby AE Gas vesicles. Microbiological Reviews 58, 94–144 (1994). [DOI] [PMC free article] [PubMed] [Google Scholar]
- 10.Pfeifer F Distribution, formation and regulation of gas vesicles. Nature Reviews Microbiology 10, 705–715 (2012). [DOI] [PubMed] [Google Scholar]
- 11.Farhadi A et al. Recombinantly Expressed Gas Vesicles as Nanoscale Contrast Agents for Ultrasound and Hyperpolarized MRI. AIChE Journal 64, 2927–2933 (2018). [DOI] [PMC free article] [PubMed] [Google Scholar]
- 12.Lakshmanan A et al. Molecular Engineering of Acoustic Protein Nanostructures. ACS Nano 10, 7314–7322 (2016). [DOI] [PMC free article] [PubMed] [Google Scholar]
- 13.Hayes P, Buchholz B & Walsby A Gas vesicles are strengthened by the outer-surface protein, GvpC. Archives of Microbiology 157, 229–234 (1992). [DOI] [PubMed] [Google Scholar]
- 14.Maresca D et al. Nonlinear ultrasound imaging of nanoscale acoustic biomolecules. Applied Physics Letters 110, 073701–073705 (2017). [DOI] [PMC free article] [PubMed] [Google Scholar]
- 15.Maresca D, Sawyer DP, Renaud G, Lee-Gosselin A & Shapiro MG Nonlinear X-Wave Ultrasound Imaging of Acoustic Biomolecules. Physical Review X 8, 041001–0410012 (2018). [DOI] [PMC free article] [PubMed] [Google Scholar]
- 16.Lopez-Otin C & Bond JS Proteases: multifunctional enzymes in life and disease. Journal of Biological Chemistry 283, 30433–7 (2008). [DOI] [PMC free article] [PubMed] [Google Scholar]
- 17.Drag M & Salvesen GS Emerging principles in protease-based drug discovery. Nature Reviews Drug Discovery 9, 690 (2010). [DOI] [PMC free article] [PubMed] [Google Scholar]
- 18.Sauer RT & Baker TA AAA+ proteases: ATP-fueled machines of protein destruction. Annual Review of Biochemistry 80, 587–612 (2011). [DOI] [PubMed] [Google Scholar]
- 19.Turk B, Turk D & Turk V Protease signalling: the cutting edge. The EMBO Journal 31, 1630–1643 (2012). [DOI] [PMC free article] [PubMed] [Google Scholar]
- 20.Stein V & Alexandrov K Protease-based synthetic sensing and signal amplification. Proceedings of the National Academy of Sciences 111, 15934–15939 (2014). [DOI] [PMC free article] [PubMed] [Google Scholar]
- 21.Fernandez-Rodriguez J & Voigt CA Post-translational control of genetic circuits using Potyvirus proteases. Nucleic Acids Research 44, 6493–6502 (2016). [DOI] [PMC free article] [PubMed] [Google Scholar]
- 22.Gao XJ, Chong LS, Kim MS & Elowitz MB Programmable protein circuits in living cells. Science 361, 1252–1258 (2018). [DOI] [PMC free article] [PubMed] [Google Scholar]
- 23.Mitra RD, Silva CM & Youvan DC Fluorescence resonance energy transfer between blue-emitting and red-shifted excitation derivatives of the green fluorescent protein. Gene 173, 13–17 (1996). [DOI] [PubMed] [Google Scholar]
- 24.Heim R & Tsien RY Engineering green fluorescent protein for improved brightness, longer wavelengths and fluorescence resonance energy transfer. Current Biology 6, 178–182 (1996). [DOI] [PubMed] [Google Scholar]
- 25.Ong ILH & Yang KL Recent developments in protease activity assays and sensors. Analyst 142, 1867–1881 (2017). [DOI] [PubMed] [Google Scholar]
- 26.Phan J et al. Structural basis for the substrate specificity of tobacco etch virus protease. Journal of Biological Chemistry 277, 50564–50572 (2002). [DOI] [PubMed] [Google Scholar]
- 27.Parks TD, Leuther KK, Howard ED, Johnston SA & Dougherty WG Release of proteins and peptides from fusion proteins using a recombinant plant virus proteinase. Analytical Biochemistry 216, 413–417 (1994). [DOI] [PubMed] [Google Scholar]
- 28.Lakshmanan A et al. Preparation of biogenic gas vesicle nanostructures for use as contrast agents for ultrasound and MRI. Nature Protocols 12, 2050 (2017). [DOI] [PMC free article] [PubMed] [Google Scholar]
- 29.Goll DE, Thompson VF, Li H, Wei WEI & Cong J The calpain system. Physiological Reviews 83, 731–801 (2003). [DOI] [PubMed] [Google Scholar]
- 30.Ono Y & Sorimachi H Calpains—an elaborate proteolytic system. Biochimica et Biophysica Acta (BBA)-Proteins and Proteomics 1824, 224–236 (2012). [DOI] [PubMed] [Google Scholar]
- 31.Ono Y, Saido TC & Sorimachi H Calpain research for drug discovery: challenges and potential. Nature Reviews Drug Discovery 15, 854–876 (2016). [DOI] [PubMed] [Google Scholar]
- 32.Suzuki S et al. Development of an artificial calcium-dependent transcription factor to detect sustained intracellular calcium elevation. ACS Synthetic Biology 3, 717–722 (2014). [DOI] [PubMed] [Google Scholar]
- 33.Sauer RT et al. Sculpting the proteome with AAA(+) proteases and disassembly machines. Cell 119, 9–18 (2004). [DOI] [PMC free article] [PubMed] [Google Scholar]
- 34.Baker TA & Sauer RT ClpXP, an ATP-powered unfolding and protein-degradation machine. Biochimica et Biophysica Acta (BBA)-Molecular Cell Research 1823, 15–28 (2012). [DOI] [PMC free article] [PubMed] [Google Scholar]
- 35.Sonnenborn U & Schulze J The non-pathogenic Escherichia coli strain Nissle 1917–features of a versatile probiotic. Microbial Ecology in Health and Disease 21, 122–158 (2009). [Google Scholar]
- 36.Danino T et al. Programmable probiotics for detection of cancer in urine. Science Translational Medicine 7, 289ra84 (2015). [DOI] [PMC free article] [PubMed] [Google Scholar]
- 37.Blum-Oehler G et al. Development of strain-specific PCR reactions for the detection of the probiotic Escherichia coli strain Nissle 1917 in fecal samples. Research in Microbiology 154, 59–66 (2003). [DOI] [PubMed] [Google Scholar]
- 38.Elowitz MB & Leibler S A synthetic oscillatory network of transcriptional regulators. Nature 403, 335–338 (2000). [DOI] [PubMed] [Google Scholar]
- 39.Khalil AS & Collins JJ Synthetic biology: applications come of age. Nature Reviews Genetics 11, 367–379 (2010). [DOI] [PMC free article] [PubMed] [Google Scholar]
- 40.Tigges M, Marquez-Lago TT, Stelling J & Fussenegger M A tunable synthetic mammalian oscillator. Nature 457, 309–312 (2009). [DOI] [PubMed] [Google Scholar]
- 41.Mark Welch JL, Hasegawa Y, McNulty NP, Gordon JI & Borisy GG Spatial organization of a model 15-member human gut microbiota established in gnotobiotic mice. Proceedings of the National Academy of Sciences 114, E9105–E9114 (2017). [DOI] [PMC free article] [PubMed] [Google Scholar]
- 42.Geva-Zatorsky N et al. In vivo imaging and tracking of host-microbiota interactions via metabolic labeling of gut anaerobic bacteria. Nature Medicine 21, 1091–100 (2015). [DOI] [PMC free article] [PubMed] [Google Scholar]
- 43.Foucault ML, Thomas L, Goussard S, Branchini BR & Grillot-Courvalin C In vivo bioluminescence imaging for the study of intestinal colonization by Escherichia coli in mice. Applied and Environmental Microbiology 76, 264–74 (2010). [DOI] [PMC free article] [PubMed] [Google Scholar]
- 44.Round JL & Mazmanian SK The gut microbiota shapes intestinal immune responses during health and disease. Nature Reviews Immunology 9, 313–323 (2009). [DOI] [PMC free article] [PubMed] [Google Scholar]
- 45.Derrien M & Vlieg JETV Fate, activity, and impact of ingested bacteria within the human gut microbiota. Trends in Microbiology 23, 354–366 (2015). [DOI] [PubMed] [Google Scholar]
- 46.Steidler L et al. Treatment of murine colitis by Lactococcus lactis secreting interleukin-10. Science 289, 1352–1355 (2000). [DOI] [PubMed] [Google Scholar]
- 47.Daniel C, Roussel Y, Kleerebezem M & Pot B Recombinant lactic acid bacteria as mucosal biotherapeutic agents. Trends in Biotechnology 29, 499–508 (2011). [DOI] [PubMed] [Google Scholar]
- 48.Muradali D & Goldberg DR US of gastrointestinal tract disease. Radiographics 35, 50–68 (2015). [DOI] [PubMed] [Google Scholar]
- 49.Machtaler S, Knieling F, Luong R, Tian L & Willmann JK Assessment of inflammation in an acute on chronic model of inflammatory bowel disease with ultrasound molecular imaging. Theranostics 5, 1175 (2015). [DOI] [PMC free article] [PubMed] [Google Scholar]
- 50.Farhadi A, Ho GH, Sawyer DP, Bourdeau RW & Shapiro MG Ultrasound imaging of gene expression in mammalian cells. Science 365, 1469 (2019). [DOI] [PMC free article] [PubMed] [Google Scholar]
- 51.Datsenko KA & Wanner BL One-step inactivation of chromosomal genes in Escherichia coli K-12 using PCR products. Proceedings of the National Academy of Sciences 97, 6640–6645 (2000). [DOI] [PMC free article] [PubMed] [Google Scholar]
- 52.St-Pierre F et al. One-step cloning and chromosomal integration of DNA. ACS Synthetic Biology 2, 537–541 (2013). [DOI] [PubMed] [Google Scholar]
- 53.Raran-Kurussi S, Cherry S, Zhang D & Waugh DS Removal of Affinity Tags with TEV Protease. in Heterologous Gene Expression in E.Coli: Methods and Protocols (ed. Burgess-Brown NA) 221–230 (Springer New York, New York, NY, 2017). [DOI] [PMC free article] [PubMed] [Google Scholar]
- 54.Sequeira AF et al. Gene design, fusion technology and TEV cleavage conditions influence the purification of oxidized disulphide-rich venom peptides in Escherichia coli. Microbial Cell Factories 16, 4 (2017). [DOI] [PMC free article] [PubMed] [Google Scholar]
- 55.Zachary ZS, Jongmin K, Vipul S & Richard MM Protein degradation in a TX-TL cell-free expression system using ClpXP protease. bioRxiv (2015). [Google Scholar]
- 56.Martin A, Baker TA & Sauer RT Rebuilt AAA + motors reveal operating principles for ATP-fuelled machines. Nature 437, 1115–1120 (2005). [DOI] [PubMed] [Google Scholar]
- 57.Wycuff DR & Matthews KS Generation of an AraC-araBAD promoter-regulated T7 expression system. Analytical Biochemistry 277, 67–73 (2000). [DOI] [PubMed] [Google Scholar]
Associated Data
This section collects any data citations, data availability statements, or supplementary materials included in this article.
Supplementary Materials
Data Availability Statement
The authors declare that data supporting the findings of this study are available within the article and its Supplementary Information. Additional data are available from the corresponding author upon reasonable request.