

Abstract
Objective
We implemented automated methods to analyze speech and evaluate the hypothesis that cognitive and motor factors impair prosody in partially distinct ways in patients with amyotrophic lateral sclerosis (ALS).
Methods
We recruited 213 participants, including 67 with ALS (44 with motor ALS, 23 with ALS and frontotemporal degeneration [FTD]), 33 healthy controls, and neurodegenerative reference groups with behavioral variant FTD (n = 90) and nonfluent/agrammatic primary progressive aphasia (n = 23). Digitized, semistructured speech samples obtained from picture descriptions were automatically segmented with a Speech Activity Detector; continuous speech segments were pitch-tracked; and duration measures for speech and silent pause segments were extracted. Acoustic measures were calculated, including fundamental frequency (f0) range, mean speech and pause segment durations, total speech duration, and pause rate (pause count per minute of speech). Group comparisons related performance on acoustic measures to clinical scales of cognitive and motor impairments and explored MRI cortical thinning in ALS and ALS-FTD.
Results
The f0 range was significantly impaired in ALS spectrum disorders and was related to bulbar motor disease, and regression analyses related this to cortical thickness in primary motor cortex and perisylvian regions. Impaired speech and pause duration measures were related to the degree of cognitive impairment in ALS spectrum disorders, and regressions related duration measures to bilateral frontal opercula and left anterior insula.
Conclusion
Automated analyses of acoustic speech properties dissociate motor and cognitive components of speech deficits in ALS spectrum disorders.
A progressive motor disorder defines patients with amyotrophic lateral sclerosis (ALS), and up to half also have accompanying cognitive, language, and behavioral impairments.1 Elements of behavioral variant (bv) of frontotemporal degeneration (FTD) are most frequently implicated, and features of nonfluent/agrammatic (na) variant of primary progressive aphasia (PPA) also are reported.2,3 Studies examining linguistic deficits in ALS have described a variety of impairments in grammatical processing,4,5 action verb knowledge,6,7 and discourse and social communication.8,9 Very few studies have investigated the prosodic characteristics of speech in ALS quantitatively. This entails analyzing acoustic properties such as pitch, also known as fundamental frequency (f0), speech and pause segment duration, and speech rate.10,11 Because speech is a multidimensional skill requiring the collaboration of multiple cognitive and motor domains, the current study assesses the intersection of motor and cognitive components in prosodic aspects of speech in ALS spectrum disorders. We hypothesized that a granular analysis of prosody, based on extraction of acoustic features of patients' speech, can discern partially distinct markers that reflect motor and cognitive impairments.
We evaluated acoustic prosodic markers in natural connected speech from a digitized, semistructured speech sample in patients with ALS spectrum disorders. Using an automated, quantitative algorithm, we aimed to associate specific prosodic acoustic elements with clinical deficits in motor or cognitive function. We designed our study to include several control groups without a motor disorder, including those with no obvious clinical deficit (healthy controls [HC]) or with a nonmotor cognitive impairment (bvFTD) or language impairment (naPPA) that may accompany ALS. Finally, we used MRI to explore the relationship of prosodic deficits in ALS with areas of cortical atrophy. We hypothesized that motor-derived components of speech would be related to motor cortex atrophy, while aspects of speech that are mediated by cognitive components would be related to prefrontal areas of the brain.
Methods
Participants
Digitized speech samples describing the Cookie Theft picture were collected from 67 native English speakers with an ALS spectrum disorder (44 patients with pure motor ALS, 23 with ALS-FTD) and 33 HC between January 2000 and September 2018. We included speakers who at the time of speech collection met criteria for suspected, possible, or probable ALS.12 We included cases with progressive muscular atrophy because this variant is closely related to ALS and has a similar disease course, and we excluded cases with primary lateral sclerosis, a variant with a very different disease progression. We used a total score cutoff of 105 on the Edinburgh Cognitive Assessment Scale (ECAS),13 to identify the subgroup of patients with ALS and ALS-FTD. Total ECAS score was available in 54 patients with ALS and ALS-FTD. One case was labeled as having ALS-FTD on the basis of a very low ALS-specific score alone (51). When the ECAS score was completely unavailable because the speech data were collected before ECAS was available (n = 12), we labeled ALS-FTD on the basis of well-documented FTD phenotypes in the medical records (5 had bvFTD, 2 had naPPA) in accordance with published clinical criteria.14,15 A case with a concomitant early-onset bipolar disorder was excluded. Three patients with ALS, including 1 with ALS-FTD, had confirmed pathology. To examine whether the speech features were related to a specific cognitive-behavioral feature in the ALS spectrum, we also included speech samples from 2 reference groups with brain damage without motor impairment, bvFTD (n = 90) and naPPA (n = 23); some of these data were published previously.16,17 These patient groups were diagnosed according to published clinical research criteria14,15 and confirmed in a multidisciplinary consensus conference.
We aimed to collect digitized speech data in a quiet room with minimal background noise. We reviewed pitch-tracking in all recordings in which pitch range averaged 1.5 SD above or below their group's mean and identified samples with unfavorable conditions for pitch-tracking such as loud background noises or creaky voice (5 ALS, 1 ALS-FTD, 5 HC, 12 bvFTD, 4 naPPA). Such conditions are highly prone to pitch-tracking errors. Thus, we excluded them from all analyses involving f0 (they are included only in analyses of duration; see below).
In addition, 3 women were excluded from the HC group to better match the groups for sex distribution. It was not possible to match the groups for their ages and education levels; therefore, we covaried for these factors as necessary in the statistical models below.
Clinical tests were available for most of the ALS cohort and included the ECAS and Amyotrophic Lateral Sclerosis Functional Rating Scale–Revised18 for motor symptom functional severity. A motor examination determined the presence of bulbar motor disease at the time of speech collection. The bulbar scale of 0 to 4 from the Penn upper motor neuron score was used to estimate severity of bulbar motor disease.19 We also measured forced vital capacity in seated position (%FVC). This is tightly related to the passage of air through the vocal cords to produce sounds and is closely linked to respiration. The speech samples were manually coded for various linguistic features as well, as previously described in detail.20 We focus here specifically on the commonly used measure of speech rate (words per minute), which is a reliable marker of slowed, effortful speech. The final groups and their demographic and clinical characteristics are summarized in table 1.
Table 1.
Mean (SD) clinical and demographic characteristics

Standard protocol approvals, registrations, and patient consents
All patients and HC participated in an informed consent procedure approved by the Institutional Review Board at the University of Pennsylvania.
Speech collection and processing
We automatically segmented the digital acoustic signal with a Speech Activity Detector (SAD), developed at the University of Pennsylvania Linguistic Data Consortium.21 The SAD stamps the timing of each speech and silent segment, which are then visually reviewed for validation and diarization (labeling out interviewer's parts). This relies on the audio signal solely, without the use of transcripts.
Following our previously published protocol,17 we pitch-tracked the segments of continuous speech with Praat.22 We extracted the f0, which is the longest estimated periodicity in the complex sound wave and is closely related to the perceived pitch.23 We also extracted the durations of speech segments and the number of pauses. With these measurements, we calculated the following parameters: f0 range, transformed to a semitone logarithmic scale to control for individual and sex differences in pitch; mean speech segment duration; total speech duration; pause count; and pause rate, which was calculated as the number of pauses per minute over total speech time. Detailed specifications of SAD and pitch-tracking and the methods for the acoustic measurement transformation and calculation have been published previously.17
Statistical analysis
We compared acoustic markers (f0 range, mean speech segment duration, total speech duration, and pause rate) between the groups with analysis of covariance models covarying for significant demographic variables and using ALS-FTD as the reference group for contrasts. All p values were adjusted for multiple comparisons with a Bonferroni adjustment.
Our next aim was to associate our acoustic measures with cognitive and motor functions within the ALS cohort (including both ALS and ALS-FTD). First, we tested the direct correlation between the acoustic measures and respiratory capacity by running a Pearson correlation test between each acoustic measure and %FVC. We found all duration measures to be appropriately correlated with respiratory function, as expected. Then we tested whether prosodic features are associated with cognitive impairment, estimated by the ALS-specific subscore from the ECAS, or with motor impairment (either bulbar or respiratory) by running univariate linear regression models. In each model, we examined an acoustic marker as the outcome measure and tested for major effects of cognitive and motor clinical scores and minor effects of demographic variables. We used the backward stepwise elimination method to eliminate nonsignificant demographic variables and report here the results of the best-fit models. We confirmed associations by visualizing the data in scatterplots. We did not obtain ECAS score in patients with bvFTD or naPPA to minimize patient burden, and although this is a widely used but imperfect measure of cognition, we used the Mini-Mental State Examination (MMSE) to test the association of cognition with each duration measure within the full dataset (i.e., all ALS and nonmotor reference and HC groups). In addition, we correlated total speech time, an automatically derived acoustic prosodic marker, with words per minute, a frequently reported manual measure of speech rate (table 1), to make some inferences on speech production from the total speech time.
Neuroimaging
We explored the relationship between speech markers and T1 volumetric brain MRI data that were available from 18 patients with ALS (n = 7) or ALS-FTD (n = 11) within ≈6 months of speech collection (range 0.2–6.5, mean 3.2). This subset did not differ from the full dataset in demographic, clinical, or acoustic characteristics. Imaging was obtained at 3T from a Siemens Trio scanner (Siemens, Malvern, PA) at 1-mm isotropic resolution. Nine images were acquired in an axial plane with the following parameters: repetition time 1,620 milliseconds; echo time 3.87 milliseconds; slice thickness 1.0 mm; flip angle 15°; matrix 192 × 256; and in-plane resolution 0.9766 × 0.9766 mm. The remaining 9 were collected using a sagittal acquisition with these parameters: repetition time 2,300 milliseconds; echo time 2.95 milliseconds; slice thickness 1.2 mm; flip angle 9°; matrix 256 × 240; and in-plane resolution 1.1 × 1.1 mm. Whole-brain MRI volumes were preprocessed with Advanced Normalization Tools (github.com/ANTsX/ANTs) with the state-of-the-art antsCorticalThickness pipeline described previously.24–26 The Advanced Normalization Tools Atropos tool used template-based priors, built using the Open Access Series of Imaging Studies cross-sectional brains27 to segment images into 6 tissue classes (cortical gray matter, white matter, CSF, deep gray structures, brainstem, and cerebellum), and generated the probability images of each tissue class.28 DiReCT was then used to estimate gray matter cortical thickness.29 For each participant, pseudo-geodesic joint label fusion based on the method of Wang et al.30 was used to estimate the BrainColor regions of interest (ROIs).31 The intersection of the labeled ROIs and the cortical thickness >0 was used as the estimate of the cortex, and the mean cortical thickness of this intersection was extracted from each ROI.
We used univariate multiple regression analyses to estimate the effect of key acoustic markers (f0 range, total speech duration, and pause rate) on cortical thickness, controlling for the confounding effects of age and disease duration and for the 2 sets of acquisition parameters. Mean speech segment duration was similar to total speech time but less robust in the group comparisons and clinical correlates; thus, we selected the total speech time for this imaging analysis. Considering our relatively small samples, we report hypothesis-driven exploratory analyses using an uncorrected t statistic at a significance level of 0.05. We ran a model for the mean cortical thickness in each of 18 ROIs selected out of the BrainColor32 label system to include all perisylvian regions that are associated with language and primary motor cortices bilaterally.
Data availability
Anonymized data will be shared by request from any qualified investigator for purposes of validation and/or replication of study methods.
Results
Automated acoustic markers in ALS
The group means of the acoustic markers are summarized in table 1 and visualized in figure 1.
Figure 1. Acoustic markers by group.

Automated acoustics measures by group: (A) fundamental frequency (f0) percentiles, which represent pitch, and (B–D) duration measures. ALS = amyotrophic lateral sclerosis; bvFTD = behavioral variant of FTD; FTD = frontotemporal dementia; HC = healthy controls; naPPA = nonfluent/agrammatic variant of primary progressive aphasia; ppm = pauses per minute.
The f0 range
The f0 range (figure 1A) was restricted in cases with ALS-FTD and differed statistically from that in HC (F6,179 = 6.78, 95% confidence interval [CI] 0.64–2.60, p = 0.005), but f0 range in motor ALS did not statistically differ from that in HC (p = 0.15). The f0 range in ALS-FTD was statistically similar to that of all other patient groups, including the motor ALS, bvFTD, and naPPA groups (all contrasts p > 0.1).
A regression model in all ALS (including ALS-FTD and motor ALS) revealed a strong association between f0 range and the degree of bulbar impairment (figure 2A) after controlling for the effects of cognitive impairment and respiratory restriction (table 2). To further test the hypothesis that f0 range is independent of cognitive function in all study patients and because ECAS was not available in our cognitive control groups, we ran a model with MMSE score as predictor of f0 range in all patient groups regardless of motor impairment, and this did not show an association with f0 range (β = 0.028, p = 0.34). Together, these findings associate restricted f0 range with bulbar motor disease in ALS spectrum disorders.
Figure 2. Clinical correlates.

(A) Fundamental frequency (f0) range is associated with the degree of bulbar disease (estimated with the Penn upper motor neuron bulbar subscale) in amyotrophic lateral sclerosis (ALS) spectrum disorders. The duration measures, including (B) mean speech segment duration, (C) total speech time, and (D) pause rate, calculated as pause count over total speech time per minute, are associated with cognitive impairment (estimated with the ALS-specific subscore of the Edinburgh Cognitive Assessment Scale test) in ALS. FTD = frontotemporal dementia.
Table 2.
Clinical regression results

Speech durations
Mean speech segment duration (figure 1B) was reduced in cases with ALS-FTD relative to HC (F4,208 = 18.7, 95% CI 0.24–0.79, p < 0.001) and those with motor ALS (95% CI 0.08–0.59, p = 0.042). Mean speech segment duration was longer in cases with ALS-FTD compared with those with naPPA (95% CI −0.74 to −0.15, p = 0.014) and did not differ from that of bvFTD (p = 1.0).
Regression analyses within the motor-ALS and ALS-FTD groups associated mean speech segment duration with the ALS-specific ECAS score after controlling for the effects of motor impairments (bulbar and respiratory, figure 2B and table 2). The MMSE score was associated with mean speech segment duration in all study groups regardless of motor impairment (β = 0.022, p < 0.001).
We calculated the total speech time (figure 1C) by summing all speech segment durations. Cases with ALS-FTD had reduced total speech time compared to those with motor ALS (F5,204 = 17.2, 95% CI 6.45–22.52, p = 0.002) and HC (95% CI 12.21–29.35, p < 0.001). Total speech in the ALS-FTD group was similar to that of the bvFTD and naPPA groups (p > 0.1 in both contrasts).
A regression model in cases with motor ALS and ALS-FTD found a significant effect for the ALS-specific ECAS subscore on total speech time, controlling for motor impairments (figure 2C and table 2). We also found an association between the MMSE score and total speech time in the full dataset, including all ALS and the nonmotor reference and HC groups (β = 0.048, p < 0.001). Total speech also correlated with the manual measure of speech rate (in words per minute, r = 0.57, p < 0.001).
These findings associate speech duration measures with cognitive impairment independently of motor dysfunctions in ALS spectrum disorders.
Pause rate
Pause rate (figure 1D) represents the pause count after controlling for total speech time. Pause rate in cases with ALS-FTD was significantly higher than in HC (F4,208 = 16.5, 95% CI −20.49 to −4.46, p = 0.01) and significantly lower than in those with naPPA (95% CI 8.54–25.94, p < 0.001) and did not differ from that of individuals with motor ALS and bvFTD (p > 0.1 in both contrasts). Pause rate also was higher in those with naPPA compared to all other groups (F4,208 = 16.5, p < 0.001 for all contrasts).
A regression model in motor ALS– and ALS-FTD associated pause rate with the ALS-specific ECAS score, after controlling for respiratory and bulbar impairments (figure 2D and table 2). To further test this association between pause rate and cognitive function in the larger dataset, we ran a model in all ALS and nonmotor reference groups and found MMSE score to have a small but significant effect on pause rate (β = −0.018, p < 0.001). These findings suggest that pause rate, an automatically derived dysfluency measure, is related to cognitive function in ALS spectrum disorders.
Neuroimaging
The results of our exploratory imaging regression analyses are summarized in table 3, and scatterplots relating cortical thickness to speech measures are presented in figure 3. Figure 4 illustrates the anatomic distribution of these associations. Imaging analyses revealed associations between f0 range and cortical thickness in 6 hypothesized ROIs, including the precentral gyri and inferior frontal gyri (IFG) bilaterally and the right angular gyrus and the left planum temporale. Total speech duration was associated with cortical thickness in the frontal opercula and IFG bilaterally, the left anterior insula, and the bilateral superior temporal gyri. Pause rate was associated with cortical thickness in the right frontal operculum and left superior temporal gyri.
Table 3.
MRI regression results

Figure 3. Neuroanatomic correlates.

Cortical thickness significant regression results with (A) f0 range, (B) total speech duration, and (C) pause rate. ALS = amyotrophic lateral sclerosis; FTD = frontotemporal dementia; IFG = inferior frontal gyrus; STG = superior temporal gyrus.
Figure 4. MRI regression images.
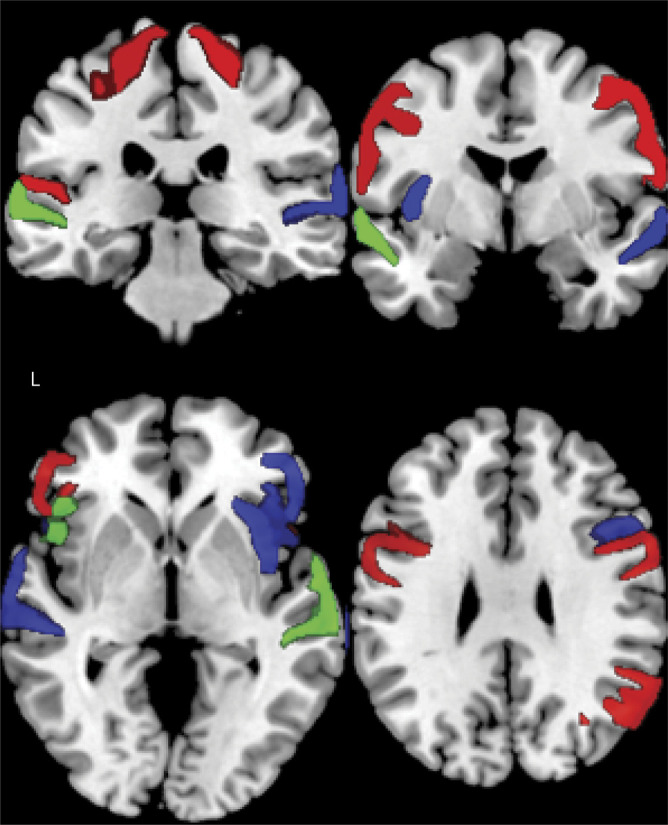
Coronal (top) and axial (bottom) brain slices illustrating significant regions of interest where cortical thickness is associated with fundamental frequency range (red), total speech (blue), and pause rate (green).
Discussion
In this study, we analyzed speech samples in ALS spectrum disorders, relying on digitized acoustic data extracted with the help of automated methods, with the goal of identifying characteristics related to motor and cognitive components of prosodic impairment. Attenuated or complete versions of naPPA and bvFTD may be seen in patients with ALS,1 and we assessed these acoustic markers in ALS spectrum disorders because they have been proven to be informative in naPPA and bvFTD.16,17 Here, we find that f0 range, speech duration, and pause rate may be clinically informative attributes of impaired prosody in ALS spectrum disorders: f0 range appears to be relatively impaired in association with bulbar motor features of ALS, while speech duration and pause rate appear to be associated with severity of cognitive impairment in these patients. Exploratory analyses also find partially distinct anatomic associations in regression analyses relating each of these acoustic markers to MRI cortical thinning in areas associated in part with motor or cognitive functioning, respectively. We discuss each of these findings below.
In our cohort, potential motor and cognitive features of ALS spectrum disorders may affect prosody. Consider first cognitive complications of ALS spectrum disorders. Patients with ALS-FTD may have cognitive impairments in linguistic domains and social functioning,33,34 and these may affect their prosody in a fashion somewhat similar to the dysprosody of naPPA and bvFTD, respectively.16,17 In this study, automatically derived duration measures are impaired in ALS-FTD compared to motor ALS. Patients with ALS with FTD thus differ in speech segment duration and pause rate compared to patients with motor ALS, and this is highly correlated with the frequently studied measure of fluency, i.e., words per minute. We also find that shortened speech segments and frequent pauses are related to cognitive function in ALS-FTD, resembling our findings in pure FTD phenotypes. Within ALS spectrum disorders, these speech duration measures are related to ECAS cognitive scores. While our observations support a main cognitive effect on duration measures of speech production in ALS, our study cannot determine whether this deficit is related more specifically to a behavioral or a linguistic deficit. The pattern of speech deficit may more closely resemble the bvFTD reference group in part due to the relatively higher frequency of bvFTD features compared to naPPA features in ALS-FTD spectrum disorders.1 Previous work has demonstrated picture description deficits in patients with bvFTD,35,36 and total speech duration may be related in part to an executive deficit limiting the content that a speaker can perceive and convey in an organized and comprehensive fashion. Likewise, previous work has shown abnormal picture descriptions in patients with naPPA35,37 whereby the speakers' significantly limited words per minute and restricted grammar may lead to simpler sentences that contain fewer words. Future research is needed to relate our observations based on a simple acoustic analysis with more detailed cognitive and language measures.
Consider next the role of motor difficulty in the speech of patients with ALS. Two potential motor effects may affect speech measures23: bulbar disease and respiratory function. In the current report, f0 range was restricted in ALS spectrum disorders. We find a strong association between f0 range and bulbar disease in motor ALS and ALS-FTD. Sex is a significant confounder in our current study, which is consistent with known physiologic effects due to laryngeal size.23 While motor bulbar disease can compromise f0, additional work is needed to identify the specific motor component of bulbar disease that is interfering with prosody in patients with ALS spectrum disorders. One possibility is that upper motor neuron disease affecting laryngeal muscles may interfere with f0. It is important to point out that f0 is multifactorial and can be compromised by nonmotor factors as well, although we do not find that f0 is related to the cognitive measures that we obtained in these ALS spectrum patients. The f0 may be limited in bvFTD, for example, due in part to the limited ability of individuals with bvFTD to perceive the emotional or pragmatic value of prosody in human discourse,17 and the f0 range may be limited in individuals with naPPA due in part to their difficulty in appreciating the grammatical properties of speech that make use of prosody.16 While elements of bvFTD and naPPA may be seen in ALS-FTD, we may not have found f0 to be related to ECAS measures for several reasons. One possibility is that ECAS does not specifically measure grammatical and social measures in ALS. Alternately, nonmotor FTD-related syndromes differ somewhat from partial manifestations of bvFTD and naPPA in ALS. For example, naPPA in ALS is associated with FTLD-TDP pathology, while non-ALS naPPA is more often associated with FTLD-tau pathology,38,39 and FTLD-TDP and FTLD-tau pathologies in the setting of PPA have different linguistic associations and anatomic distributions.40 Thus, f0 is a complex phenomenon that may be compromised in many ways, and additional work is needed to understand the restricted f0 in ALS spectrum disorders.
Reduced respiratory capacity is a motor feature of ALS that is linked in a relatively distinct manner to our automatically derived measures of speech duration: the SAD identifies stretches of continuous speech, based on acoustic features without referring to transcripts, and these continuous speech segments are typically referred to as breath groups by phoneticians because they are breaks most commonly taken in order to breathe. Thus, connected speech segments may be abbreviated due to the speaker running out of breath. However, our regression models confirm that after controlling for respiratory restriction and bulbar dysfunction (which may slow articulation), all of the duration measures, including mean speech segment duration, total speech duration, and pause rate, are independently associated with cognitive function but not %FVC (table 2). In a previous report that analyzed speech samples in patients with ALS, the authors linked lengthened reading time to impaired respiratory function.10 That study, however, did not include an analysis testing the association of lengthened speech with speech during a semistructured sample such as during picture description or with a cognitive impairment. Restriction of respiratory capacity also may reduce f0, which relies heavily on subglottal air pressure; however, we do not find an association between %FVC and f0. The cohort we examined has a mild to moderate range of impairment on the Amyotrophic Lateral Sclerosis Functional Rating Scale–Revised, and we cannot rule out that %FVC contributes to speech limitations in patients with ALS spectrum disorders with more severe motor deficits that have greater diaphragmatic weakness.
The results of our exploratory neuroanatomical regression analyses should be interpreted with caution because they rely on a relatively small sample and predefined hypothesis-driven ROIs and were not robust to adjustment for multiple comparisons. With this in mind, the analyses are consistent with our behavioral analyses. In detailed studies of language in ALS, previous work has associated impairments in lexical, grammatical, and narrative expression with atrophy in inferior, orbital, dorsolateral, anterior insular, and anterior cingulate regions of the frontal lobe and the anterior temporal lobe.4,7,8 Regression analyses in the present study relate prosodic markers of speech production and dysfluency, speech duration and pause rate, to cortical thinning in IFG, frontal opercula, anterior insula, and other perisylvian regions. This overlaps in part with previous studies in ALS spectrum disorders relating a cognitive component of impaired speech to cortical atrophy in the frontal lobe. The left insula has been associated with mood and social cognition in bvFTD,41 and our previous work has associated right frontal regions with specific linguistic aspects of speech in ALS.8 Other researchers have also reported direct correlations between prosodic acoustic measures of speech expression in other non-ALS disorders, including f0 and speech duration with right frontal opercular regions.42–44
The neuroanatomic basis for motor aspects of speech is more complicated. The motor component of speech that we identified, f0 range, may be related in part to motor deficits, as discussed. Bulbar deficits in ALS have been related to motor cortex,45 and in patients with ALS with bulbar disease, atrophy has been localized to the homuncular representation of the larynx.46–50 Consistent with these findings, our direct assessment of a relationship between f0 range and cortical thickness supports the association of this acoustic measure with bulbar disease mediated in part by atrophy in precentral gyri. The association with the planum temporale may be related in part to a feedback mechanism to monitor the acoustic properties of one's own speech and may be helpful in clarifying articulatory production. However, even though the cognitive measures we obtained are not statistically related to f0, we find additional regions within the neural network for language in ALS that are associated with f0, including the frontal opercula and IFG. This may be related in part to dual motor and cognitive components that contribute to f0 during picture description. Additional work is needed to examine the full spectrum of factors contributing to f0. We speculate that the left frontal operculum may represent a hub in the neural substrate contributing to speech production because this region is shared in its support of both f0 range and speech and pause durations. Further work is needed to clarify the specific roles for each of these anatomic regions in prosodic expression.
A strength of our study is the demonstration of an automated approach to analysis of the digitized acoustic speech signal in the study of neurodegenerative disease. Because this is fully automated, entirely objective, and highly reproducible, our method offers an opportunity to contribute to the identification of clinically validated motor and cognitive endpoints in treatment trials. Nevertheless, our study has some limitations. Even though we are studying relatively rare cohorts of patients, we examined small sample sizes, and this was particularly evident in exploratory imaging analyses. There are also pitfalls surrounding pitch-tracking. Pitch-tracking is merely an estimation of the actual f0 and is subject to many errors. All pitch-tracking methods rely on the same assumption of 1 f0, when in reality prosodic pitch may include a mixture of frequencies, resulting in what we perceive as a difference in voice quality. Investigating other acoustic markers for voice quality may improve our ability to analyze pitch and furthermore may offer additional acoustic markers of disease. While our previous work involved manual analyses of the content of Cookie Theft descriptions,4,7,8 fully automated analyses of lexical content are currently under development, and their absence in the present study limits the interpretability of our findings because we cannot directly relate acoustic markers to automated measures such as word frequencies or concreteness. Relatedly, a more complete assessment of cognition across ALS spectrum patients and nonmotor reference groups would facilitate a richer interpretation of f0 results.
With these caveats in mind, speech samples from patients with ALS spectrum disorders can provide highly objective and reproducible markers of disease derived purely from the acoustic speech signal. Such acoustic markers relate to prosodic elements of natural language such as fluency and intonation, and our automated method easily extracts these features. We identified acoustic speech markers that appear to reflect bulbar motor aspects of disease such as f0 and relate cognitive deficits that are present in many patients with ALS to features of speech such as speech duration and pause rate, and we validated these measures in regression analyses relating these speech measures to cortical atrophy in ALS spectrum patients.
Glossary
- ALS
amyotrophic lateral sclerosis
- bvFTD
behavior variant of FTD
- CI
confidence interval
- ECAS
Edinburgh Cognitive Assessment Scale
- FTD
frontotemporal degeneration
- %FVC
forced vital capacity (percent of predicted by age)
- f0
fundamental frequency
- HC
healthy controls
- IFG
inferior frontal gyrus
- MMSE
Mini-Mental State Examination
- naPPA
nonfluent/agrammatic PPA
- PPA
primary progressive aphasia
- ROI
region of interest
- SAD
Speech Activity Detector
Appendix. Authors
Study funding
Funded by the NIH (AG017586, AG053940, AG052943, NS088341, DC013063, AG054519), the Institute on Aging at the University of Pennsylvania, the Alzheimer's Association (AACSF-18-567131), an anonymous donor, and the Wyncote Foundation.
Disclosure
N. Nevler, S. Ash, C. McMillan, L. Elan, L. McCluskey, D. Irwin, S. Cho, and M. Liberman report no disclosures relevant to the manuscript. M. Grossman participates in clinical trials sponsored by Alector, Eisai, and Biogen. He also receives research support from NIH, research support from Biogen, and in-kind support from Avid. He receives financial support from Neurology® for his work as an associate editor. Go to Neurology.org/N for full disclosures.
References
- 1.Strong MJ, Abrahams S, Goldstein LH, et al. Amyotrophic lateral sclerosis–frontotemporal spectrum disorder (ALS-FTSD): revised diagnostic criteria. Amyotroph Lateral Scler Frontotemporal Degener 2017;124:1–22. [DOI] [PMC free article] [PubMed] [Google Scholar]
- 2.Vinceti G, Olney N, Mandelli ML, et al. Primary progressive aphasia and the FTD-MND spectrum disorders: clinical, pathological, and neuroimaging correlates. Amyotroph Lateral Scler Frontotemporal Degener 2019;20:1–13. [DOI] [PMC free article] [PubMed] [Google Scholar]
- 3.Strong MJ, Abrahams S, Goldstein LH, et al. Amyotrophic lateral sclerosis–frontotemporal spectrum disorder (ALS-FTSD): revised diagnostic criteria. Amyotroph Lateral Scler Frontotemporal Degener 2017;18:153–174. [DOI] [PMC free article] [PubMed] [Google Scholar]
- 4.Ash S, Olm C, McMillan CT, et al. Deficits in sentence expression in amyotrophic lateral sclerosis. Amyotroph Lateral Scler Frontotemporal Degener 2015;16:31–39. [DOI] [PMC free article] [PubMed] [Google Scholar]
- 5.Tsermentseli S, Leigh PN, Taylor LJ, Radunovic A, Catani M, Goldstein LH. Syntactic processing as a marker for cognitive impairment in amyotrophic lateral sclerosis. Amyotroph Lateral Scler Frontotemporal Degener 2015;17:69–76. [DOI] [PMC free article] [PubMed] [Google Scholar]
- 6.Grossman M, Anderson C, Khan A, Avants B, Elman L, McCluskey L. Impaired action knowledge in amyotrophic lateral sclerosis. Neurology 2008;71:1396–1401. [DOI] [PMC free article] [PubMed] [Google Scholar]
- 7.Cousins KAQ, Ash SP, Grossman M. Production of verbs related to body movement in amyotrophic lateral sclerosis (ALS) and Parkinson's disease (PD). Cortex 2018;100:127–139. [DOI] [PMC free article] [PubMed] [Google Scholar]
- 8.Ash S, Menaged A, Olm C, et al. Narrative discourse deficits in amyotrophic lateral sclerosis. Neurology 2014;83:520–528. [DOI] [PMC free article] [PubMed] [Google Scholar]
- 9.Roberts-South A, Findlater K, Strong MJ, Orange JB. Longitudinal changes in discourse production in amyotrophic lateral sclerosis. Semin Speech Lang 2012;33:79–94. [DOI] [PubMed] [Google Scholar]
- 10.Yunusova Y, Graham NL, Shellikeri S, et al. Profiling speech and pausing in amyotrophic lateral sclerosis (ALS) and frontotemporal dementia (FTD). PLoS One 2016;11:e0147573. [DOI] [PMC free article] [PubMed] [Google Scholar]
- 11.Congia S, Di Ninni S, Zonza F, Melis M. Prosody alterations in amyotrophic lateral sclerosis. Adv Exp Med Biol 1987;209:121–123. [DOI] [PubMed] [Google Scholar]
- 12.Brooks BR, Miller RG, Swash M, Munsat TL. El Escorial revisited: revised criteria for the diagnosis of amyotrophic lateral sclerosis. Amyotroph Lateral Scler 2000;1:293–299. [DOI] [PubMed] [Google Scholar]
- 13.Niven E, Newton J, Foley J, et al. Validation of the Edinburgh Cognitive and Behavioural Amyotrophic Lateral Sclerosis Screen (ECAS): a cognitive tool for motor disorders. Amyotroph Lateral Scler Frontotemporal Degener 2015;16:172–179. [DOI] [PubMed] [Google Scholar]
- 14.Rascovsky K, Hodges JR, Knopman D, et al. Sensitivity of revised diagnostic criteria for the behavioural variant of frontotemporal dementia. Brain 2011;134:2456–2477. [DOI] [PMC free article] [PubMed] [Google Scholar]
- 15.Gorno-Tempini ML, Hillis AE, Weintraub S, et al. Classification of primary progressive aphasia and its variants. Neurology 2011;76:1006–1014. [DOI] [PMC free article] [PubMed] [Google Scholar]
- 16.Nevler N, Ash S, Irwin DJ, Liberman M, Grossman M. Validated automatic speech biomarkers in primary progressive aphasia. Ann Clin Transl Neurol 2019;6:4–14. [DOI] [PMC free article] [PubMed] [Google Scholar]
- 17.Nevler N, Ash S, Jester C, Irwin DJ, Liberman M, Grossman M. Automatic measurement of prosody in behavioral variant FTD. Neurology 2017;89:650–656. [DOI] [PMC free article] [PubMed] [Google Scholar]
- 18.Cedarbaum JM, Stambler N, Malta E, et al. The ALSFRS-R: a revised ALS functional rating scale that incorporates assessments of respiratory function. J Neurol Sci 1999;169:13–21. [DOI] [PubMed] [Google Scholar]
- 19.Woo JH, Wang S, Melhem ER, et al. Linear associations between clinically assessed upper motor neuron disease and diffusion tensor imaging metrics in amyotrophic lateral sclerosis. PLoS One 2014;9:e105753. [DOI] [PMC free article] [PubMed] [Google Scholar]
- 20.Ash S, Jester C, York C, et al. Longitudinal decline in speech production in Parkinson's disease spectrum disorders. Brain Lang 2017;171:42–51. [DOI] [PMC free article] [PubMed] [Google Scholar]
- 21.Yuan J, Ryant N, Liberman M, Stolcke A, Mitra V, Wang W. Automatic Phonetic Segmentation Using Boundary Models. Presented at INTERSPEECH 2013: 14th Annual Conference of the International Speech Communication Association; August 25--29, 2013; Lyon Paris. [Google Scholar]
- 22.Praat: Doing Phonetics by Computer [computer program]. Version 5.4.11. Amsterdam: University of Amsterdam; 2013. [Google Scholar]
- 23.Liberman P. Intonation, Perception, and Language. Cambridge, MA: MIT Press; 1968. [Google Scholar]
- 24.Avants BB, Epstein CL, Grossman M, Gee JC. Symmetric diffeomorphic image registration with cross-correlation: evaluating automated labeling of elderly and neurodegenerative brain. Med Image Anal 2008;12:26–41. [DOI] [PMC free article] [PubMed] [Google Scholar]
- 25.Klein A, Ghosh SS, Avants BB, et al. Evaluation of volume-based and surface-based brain image registration methods. NeuroImage 2010;51:214–220. [DOI] [PMC free article] [PubMed] [Google Scholar]
- 26.Tustison NJ, Cook PA, Klein A, et al. Large-scale evaluation of ANTs and FreeSurfer cortical thickness measurements. NeuroImage 2014;99:166–179. [DOI] [PubMed] [Google Scholar]
- 27.Marcus DS, Wang TH, Parker J, Csernansky JG, Morris JC, Buckner RL. Open Access Series of Imaging Studies (OASIS): cross-sectional MRI data in young, middle aged, nondemented, and demented older adults. J Cogn Neurosci 2007;19:1498–1507. [DOI] [PubMed] [Google Scholar]
- 28.Avants BB, Tustison NJ, Wu J, Cook PA, Gee JC. An open source multivariate framework for n-tissue segmentation with evaluation on public data. Neuroinformatics 2011;9:381–400. [DOI] [PMC free article] [PubMed] [Google Scholar]
- 29.Das SR, Avants BB, Grossman M, Gee JC. Registration based cortical thickness measurement. NeuroImage 2009;45:867–879. [DOI] [PMC free article] [PubMed] [Google Scholar]
- 30.Wang H, Suh JW, Das SR, Pluta JB, Craige C, Yushkevich PA. Multi-atlas segmentation with joint label fusion. IEEE Trans Pattern Anal Mach Intell 2013;35:611–623. [DOI] [PMC free article] [PubMed] [Google Scholar]
- 31.Klein A, Tourville J. 101 Labeled brain images and a consistent human cortical labeling protocol. Front Neurosci 2012;6:171. [DOI] [PMC free article] [PubMed] [Google Scholar]
- 32.Wang H, Yushkevich PA. Multi-atlas segmentation with joint label fusion and corrective learning-an open source implementation. Front Neuroinform 2013;7:27. [DOI] [PMC free article] [PubMed] [Google Scholar]
- 33.Taylor LJ, Brown RG, Tsermentseli S, et al. Is language impairment more common than executive dysfunction in amyotrophic lateral sclerosis? J Neurol Neurosurg Psychiatry 2013;84:494–498. [DOI] [PubMed] [Google Scholar]
- 34.van der Hulst E-J, Bak TH, Abrahams S. Impaired affective and cognitive theory of mind and behavioural change in amyotrophic lateral sclerosis. J Neurol Neurosurg Psychiatry 2015;86:1208–1215. [DOI] [PubMed] [Google Scholar]
- 35.Ash S, Evans E, O'Shea J, et al. Differentiating primary progressive aphasias in a brief sample of connected speech. Neurology 2013;81:329–336. [DOI] [PMC free article] [PubMed] [Google Scholar]
- 36.Ash S, Moore P, Antani S, McCawley G, Work M, Grossman M. Trying to tell a tale: discourse impairments in progressive aphasia and frontotemporal dementia. Neurology 2006;66:1405–1413. [DOI] [PubMed] [Google Scholar]
- 37.Gunawardena D, Ash S, McMillan C, Avants B, Gee J, Grossman M. Why are patients with progressive nonfluent aphasia nonfluent? Neurology 2010;75:588–594. [DOI] [PMC free article] [PubMed] [Google Scholar]
- 38.Spinelli EG, Mandelli ML, Miller ZA, et al. Typical and atypical pathology in primary progressive aphasia variants. Ann Neurol 2017;81:430–443. [DOI] [PMC free article] [PubMed] [Google Scholar]
- 39.Grossman M. The non-fluent/agrammatic variant of primary progressive aphasia. Lancet Neurol 2012;11:545–555. [DOI] [PMC free article] [PubMed] [Google Scholar]
- 40.Giannini LA, Xie SX, McMillan CT, et al. Divergent patterns of TDP-43 and tau pathologies in primary progressive aphasia. Ann Neurol 2019:630–643. [DOI] [PMC free article] [PubMed] [Google Scholar]
- 41.Ibañez A, Manes F. Contextual social cognition and the behavioral variant of frontotemporal dementia. Neurology 2012;78:1354–1362. [DOI] [PMC free article] [PubMed] [Google Scholar]
- 42.Montavont A, Demarquay G, Guenot M, Isnard J, Mauguiere F, Ryvlin P. Ictal dysprosody and the role of the non-dominant frontal operculum. Epileptic Disord 2005;7:193–197. [PubMed] [Google Scholar]
- 43.Patel S, Oishi K, Wright A, et al. Right hemisphere regions critical for expression of emotion through prosody. Front Neurol 2018;9:224. [DOI] [PMC free article] [PubMed] [Google Scholar]
- 44.Sammler D, Grosbras M-H, Anwander A, Bestelmeyer Patricia EG, Belin P. Dorsal and ventral pathways for prosody. Curr Biol 2015;25:3079–3085. [DOI] [PubMed] [Google Scholar]
- 45.Menke RAL, Körner S, Filippini N, et al. Widespread grey matter pathology dominates the longitudinal cerebral MRI and clinical landscape of amyotrophic lateral sclerosis. Brain 2014;137:2546–2555. [DOI] [PMC free article] [PubMed] [Google Scholar]
- 46.Avants BB, Khan A, McCluskey L, Elman L, Grossman M. Longitudinal cortical atrophy in amyotrophic lateral sclerosis with frontotemporal dementia. Arch Neurol 2009;66:138–139. [DOI] [PMC free article] [PubMed] [Google Scholar]
- 47.Mezzapesa DM, D ÄôErrico E, Tortelli R, et al. Cortical thinning and clinical heterogeneity in amyotrophic lateral sclerosis. PLoS One 2013;8:e80748-80187. [DOI] [PMC free article] [PubMed] [Google Scholar]
- 48.Grosskreutz J, Kaufmann J, Fradrich J, Dengler R, Heinze HJ, Peschel T. Widespread sensorimotor and frontal cortical atrophy in amyotrophic lateral sclerosis. BMC Neurol 2006;6:17. [DOI] [PMC free article] [PubMed] [Google Scholar]
- 49.Mioshi E, Lillo P, Yew B, et al. Cortical atrophy in ALS is critically associated with neuropsychiatric and cognitive changes. Neurology 2013;80:1117–1123. [DOI] [PubMed] [Google Scholar]
- 50.Bede P, Bokde A, Elamin M, Byrne S. Grey matter correlates of clinical variables in amyotrophic lateral sclerosis (ALS): a neuroimaging study of ALS motor phenotype heterogeneity and cortical focality. J Neurol 2013;84:766–773. [DOI] [PubMed] [Google Scholar]
Associated Data
This section collects any data citations, data availability statements, or supplementary materials included in this article.
Data Availability Statement
Anonymized data will be shared by request from any qualified investigator for purposes of validation and/or replication of study methods.