Abstract
Objective
To test the association between physical function and the social environment in multiple sclerosis (MS), we quantified personal social networks.
Methods
In this cross-sectional study, we analyzed data from 2 academic MS centers, with center 1 serving as a discovery group and center 2 as the extension group. We performed a meta-analysis of the centers to extend the analysis. We used responses from a questionnaire to map the structure and health habits of participants' social networks as well as the NIH Patient-Reported Outcomes Measurement Information System (PROMIS) physical function scale (0–100, mean 50 for US general population) as the primary outcome. We applied multivariable models to test the association between network metrics and physical function.
Results
The discovery cohort included 263 patients with MS: 81% were women, 96% non-Hispanic European, 78% had relapsing MS, average age was 50 (12.4) years, and mean disease duration was 17 (12.3) years. The extension group included 163 patients, who were younger, more racially diverse, and less physically disabled, and had shorter disease duration. In the meta-analysis, higher network constraint, a measure of tightly bound networks, was associated with worse physical function (β = −0.163 ± 0.047, p < 0.001), while larger network effective size, a measure of clustered groups in the network, correlated with better physical function (β = 0.134 ± 0.046, p = 0.003).
Conclusions
Our study highlights personal networks as an important environmental factor associated with physical function in MS. Patients with close-knit networks had worse function than those with more open networks. Longitudinal studies are warranted to evaluate a causal relationship between network structure and physical impairment.
Multiple sclerosis (MS) is the leading cause of nontraumatic neurologic disability in young adults.1 Several possible risk factors for disability include high body mass index, tobacco smoking, and physical inactivity.2–4 Another potential factor is social environment. Loss of employment, withdrawal from leisure activities, and divorce are common in MS.5,6 Social isolation may be associated with the expression of immune-related genes and may have a proinflammatory effect.7 The potential biological effect of isolation provides a compelling rationale to investigate the link between the social environment, neuroinflammation, and disability.8
Social network science, a quantitative study of connectivity, has uncovered the impact of interpersonal relationships on systemic diseases.9 Patients inhabit dynamic networks, which serve as conduits for health care information and behaviors, thereby influencing cardiovascular outcomes,10 cancer prognosis,11 and overall mortality.12 Social networks range from small, close-knit cohorts of family and friends to large clusters of loosely connected acquaintances. The latter groups are less constrained networks that enable the flow of novel information and exposure to different resources.13 Consequently, they may have a favorable impact on health outcomes in neurologic diseases where early symptom recognition and access to new therapies are beneficial.14
To date, few studies have explored the role of the social network as a significant environmental factor influencing MS outcomes. Following our previous analytic approach to quantify personal networks using a structured online questionnaire that is publicly available,15 we examined the interrelationship among social network characteristics and physical function in adults with MS. We hypothesize that certain network metrics will vary with the degree of physical impairment.
Methods
Study design and participants
In this cross-sectional design, we recruited patients consecutively at the University of Pittsburgh Medical Center (UPMC) and Columbia University Irving Medical Center (CUIMC) between December 2017 and August 2019. UPMC began recruitment first and served as the discovery cohort, while CUIMC served as the extension cohort. At their clinic visit, we enrolled patients who were 18 years of age or older and had a confirmed diagnosis of MS. We excluded non-English speakers, because the social network instrument has not been validated in this population. We obtained demographic and clinical histories from the research registries at each center.
Standard protocol approvals, registrations, and patient consents
The institutional review boards of UPMC and CUIMC approved the study protocols. All participants provided written informed consent.
Social network measurements
We deployed a structured social network questionnaire adapted from the General Social Survey and a national study of personal networks and health.15,16 First, we asked participants to identify people with whom they had discussed important matters, socialized, or sought support in the last 3 months. Next, we explored the connections among all persons in the network. Finally, participants evaluated the characteristics and health habits of each network member. The Research Electronic Data Capture (REDCap) server, an institution-approved secure web platform, hosted the questionnaire.17
Network structure is the quantitative measure of social ties. Using graph theoretical statistics, we calculated 6 structural metrics for each individual's social network: size, density, constraint, effective size, maximum degree, and mean degree. Size is the number of network members, excluding the patient. Density is a measure of connectivity, calculated as the sum of ties, excluding the patient's ties, divided by all possible ties.18 Constraint is the extent to which network members have connections to each other, and summarizes size, density, and tie strength. Effective size, conceptually the inverse of constraint, is the number of members who occupy structurally unique positions.19 Maximum and mean degree capture the highest and average number of ties by a network member, respectively. Both values reflect the distribution of ties in the network.
Network composition is the proportion of demographic and health behavior characteristics across members. Percentage kin is the ratio of network members who are family. The SD of members' age reflects the range of ages in the network. The diversity of sex index represents the proportion of sexes. A value of 0 means all network members are one sex and a value of 1 indicates an equal ratio of men and women.20 The diversity of race is the proportion of races in the network with a value of 0 indicating that all persons are of the same race. We evaluated the health behavior environment by examining the percentage of network members with negative health habits, including smoking, sedentary lifestyle, and poor compliance with prescription medications. We divided each compositional variable by the total network size to create the percentage.
Outcomes
The primary outcome was self-reported physical function, which we quantified using a standardized measure called the NIH Patient-Reported Outcomes Measurement Information System (PROMIS) Physical Function v1.2. PROMIS is a nationally validated, computer adaptive test to measure self-reported health in patients across a range of chronic diseases and demographics.21 T scores from the US general population have a normal distribution with a mean score of 50 and an SD of 10. PROMIS is a continuous outcome comparable to traditional measures, but it has better precision, reduced skew, and less participant burden.22 We chose this outcome over less sensitive metrics to detect differences in physical function among patients with MS with mild to moderate disability.
As a secondary outcome, we employed the Multiple Sclerosis Rating Scale–Revised (MSRS-R), a self-reported measure of neurologic dysfunction validated for people with MS. The MSRS-R is a brief questionnaire that correlates with traditional clinical instruments of disability.23,24 The 8 domains of MSRS-R include walking, using arms and hands, vision, speech, swallowing, cognition, sensation, and bowel and bladder function for a maximum score of 32. We previously utilized this outcome in the development of our social network instrument.15
As an additional secondary outcome, we assessed self-reported gait impairment using Patient-Determined Disease Steps (PDDS). We categorized patients as having severe disability based on assistive device reliance for distances longer than 25 feet. This cutoff approximates an Extended Disability Status Scale score of 6.25
Statistical analyses
We compared the demographic and clinical characteristics between the discovery and extension cohorts using (1) t tests for age, MS disease duration, social network size, and PROMIS T score, (2) χ2 tests for dichotomous variables of sex, marital status, race, living alone, MS subtype (relapsing vs progressive), and gait impairment, and (3) nonparametric Wilcoxon rank-sum tests for years of education, median household income, and MSRS-R.
Using an approach from our previous study,15 we first performed an empirical omnibus test to examine the hypothesis that as a category, social network structure or composition was associated with the PROMIS T score. In the first stage, we calculated the p values of association between each network variable and PROMIS T score using linear regressions as described below. In the second stage, we used a Fisher meta-analysis to combine these p values and calculate a χ2 statistic. We then compared the observed χ2 statistic to an empirical distribution of χ2 statistics as generated by 10,000 random permutations. By permuting the associations with PROMIS T score, we maintained the correlation structure of the social network metrics. We calculated the empirical omnibus p value by dividing the number of times that the computed χ2 statistic was greater than the observed χ2 statistic by the total number of permutations. To create a quantile-quantile plot, we graphed the observed −log10 (p value) of each pair of associations between a network metric and PROMIS T score against the expected −log10 (p value). We determined the 90th and 95th empirical confidence intervals (CIs) using empirical p values as generated by the 10,000 permutations.
To assess the association with PROMIS T score and MSRS-R score, we performed a linear regression for each network metric, adjusting for age, sex, median household income, education, race, marital status, and MS disease duration. In these analyses, we tested each network metric separately. For gait impairment severity, we performed a binomial logistic regression analysis for each network variable, adjusting for the same covariates. Finally, we combined the results from the 2 MS center groups using a fixed-effects meta-analytic approach. We chose a fixed-effects method over a random effects model to avoid exacerbating potential bias due to differences in sample size and available data in the 2 cohorts.
To examine any potential bias due to non-normal distributions, we performed a sensitivity analysis applying nonparametric Spearman correlation tests. Analyses were completed using SPSS version 25.0 (IBM Corp., Armonk, NY) and R version 3.5.0.
Data availability
The social network questionnaire, “Personal Network Survey for Clinical Research,” is available in the REDCap Shared Library. A comprehensive R codebase for researchers who use the instrument to analyze and visualize their data is available at github.com/AmarDhand/PersonalNetworks. The authors agree to share anonymized data from this study by request from any qualified investigator. Supplementary data are available from Dryad (tables e-1 through e-6, doi:10.5061/dryad.hdr7sqvdt).
Results
Demographics of the discovery cohort
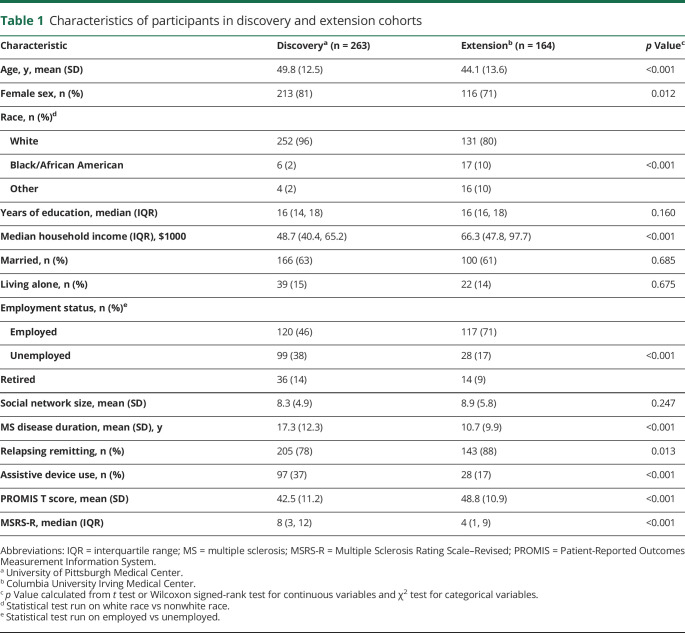
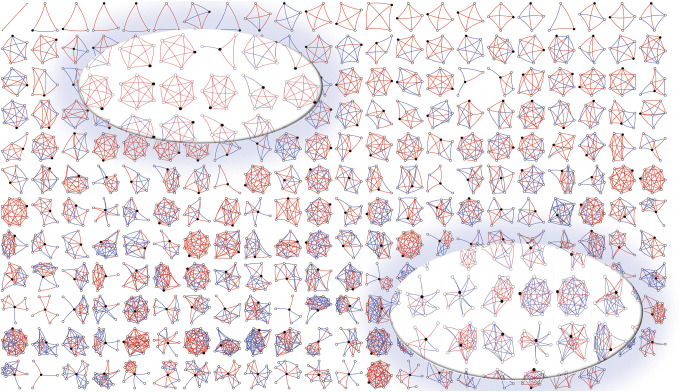
We first deployed the social network instrument in patients with MS at UPMC (table 1). This discovery cohort included 263 patients, of whom 213 (81%) were women and 205 (78%) had a relapsing-remitting MS phenotype. The average age was 48.8 (12.5) years and mean disease duration was 17.7 (12.5) years. The overall cohort was characterized by predominantly mild to moderate clinical disability based on a median MSRS-R of 8 (interquartile range 3, 12). The demographics of the discovery cohort largely resemble the corresponding clinic-based population (data available from Dryad, table e-1, doi:10.5061/dryad.hdr7sqvdt). To visualize each participant's social network structure, we plotted a montage of all personal networks, ranging from most constraint to least constraint, with the strength of each tie highlighted in color (figure 1). The average social network size and constraint were 8.2 (4.9) and 53.8 (17.8), respectively.
Table 1.
Characteristics of participants in discovery and extension cohorts
Figure 1. Structure of participants' personal social networks in the discovery cohort at University of Pittsburgh Medical Center.
Each egocentric network has a black circle that represents the participant and white circles that represent the network members. The lines connecting the circles are red if the relationship is strong and blue if the relationship is weak. Networks are arranged in order of constraint from the most constrained (top left) to the least constrained (bottom right). Constraint is a measure of tightly bound networks and ranges in value from 0 to 125. In the upper left inset, several highly constrained networks have identical structures; in the lower inset, we highlight several networks with low constraint scores because they include many weak (blue) connections.
Association of personal network structure and composition with physical function
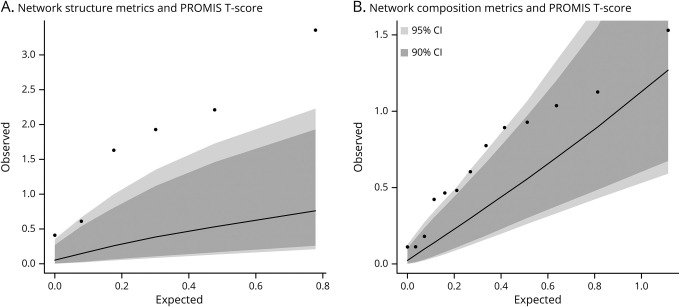
We examined whether, a priori, a relationship between social network metrics and self-reported physical function existed using the PROMIS T score as the outcome. Higher scores on the PROMIS indicate better overall physical function. In the first stage of the analysis, we grouped the network metrics into 1 of 2 categories: structure and composition. Then, we used a permutation-based omnibus test to examine the presence of an excess of associations for either of these 2 categories with the PROMIS T score. The observed distribution of p values in the omnibus test was significantly greater than chance for network structure (p = 0.002) but only suggestive (p = 0.047) for network composition, using a stringent Bonferroni-corrected threshold of significance in this stage of analysis (p < 0.025) (data available from Dryad, table e-2, doi:10.5061/dryad.hdr7sqvdt, and figure 2). Consequently, we focused on network structure in downstream analyses. For completeness, detailed analyses of the compositional variables, none of which are significant after correcting for multiple hypotheses, are presented in table e-3 (data available from Dryad, doi:10.5061/dryad.hdr7sqvdt).
Figure 2. Comparison of expected vs observed regression results for social network structure and composition.
Quantile-quantile plot of expected vs observed p values of composite network structure (A) and network composition (B) metrics in relation to physical function (Patient-Reported Outcomes Measurement Information System [PROMIS] T score) in the discovery cohort at University of Pittsburgh Medical Center. The expected p values (−log10 [p value]) are shown on the x-axis and the observed p values (−log10 [p value]) are shown on the y-axis. The dark gray and light gray areas indicate the confidence interval (CI) ranges as generated by 10,000 permutations at a threshold of p = 0.10, and at p = 0.05, respectively. The observed p values for social network structure metrics are outside of the gray areas, suggesting that network structure is associated with the PROMIS T score beyond chance after accounting for multiple testing burden.
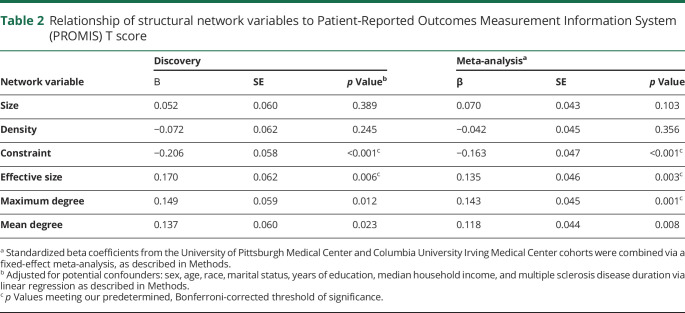
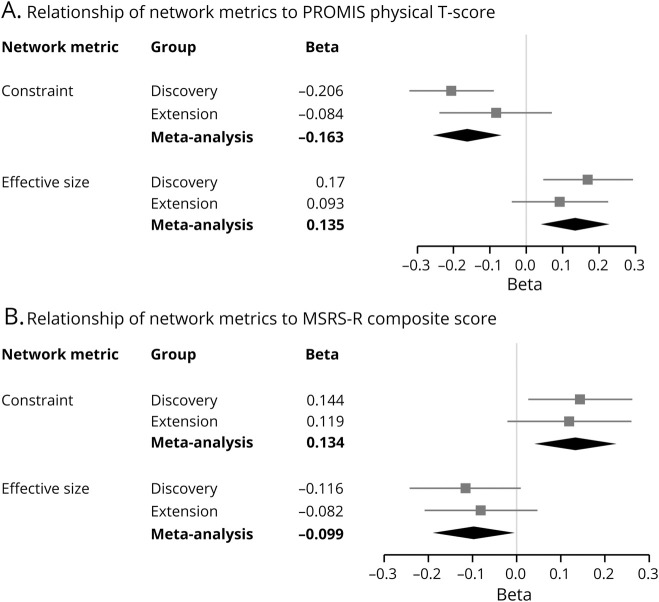
In the second stage of analysis, we examined the relationship of each structural metric with the PROMIS T score, after adjusting for known confounding factors related to disability and personal network structure (table 2 and figure 3A). Given the testing burden of 6 structural measures, our threshold of significance in these analyses was p < 0.008. We observed that a larger network effective size (β = 0.170 ± 0.062, p = 0.006) correlated with better physical function, while network constraint correlated with worse physical function (β = −0.206 ± 0.058, p < 0.001). Effective size is a measure of nonredundant network members and the openness of a network, while constraint is a measure of tightly bound networks and is functionally an inverse of effective size. We also noted 2 suggestive associations with physical function: maximum degree (β = 0.149 ± 0.059, p = 0.012) and mean degree (β = 0.137 ± 0.060, p = 0.023) of the network.
Table 2.
Relationship of structural network variables to Patient-Reported Outcomes Measurement Information System (PROMIS) T score
Figure 3. Forest plots of personal social network metrics and their relationship to neurologic outcomes.
For each cohort, the standardized beta coefficients from linear regressions of network metrics were plotted for Patient-Reported Outcomes Measurement Information System (PROMIS) (A) and Multiple Sclerosis Rating Scale–Revised (MSRS-R) (B). Higher scores on PROMIS indicate better physical function, whereas higher scores on MSRS-R indicate greater disability. Each square is the β coefficient, and each line is the 95% confidence interval (CI) of a network metric after adjustment for covariates. The diamond represents the summary β coefficient and 95% CI after a fixed-effects meta-analysis of the 2 cohorts. Constraint was inversely associated with PROMIS and directly associated with MSRS-R in the meta-analyses.
Association of personal network and physical function in the extension cohort
To extend our results to an independent set of participants, we recruited 164 adults with MS at CUIMC (table 1). Compared to the discovery group, the extension cohort was younger (44.1 ± 13.6 years), was more racially diverse, had a higher proportion of participants with employed status, had a higher household income, and included a higher proportion of men (table 1). These patients had better mean physical function, shorter mean MS disease duration, and greater predominance of the relapsing-remitting disease phenotype. There was no significant difference in marital status, percentage of participants who lived alone, years of education, and overall social network size between the 2 groups.
We extended the discovery investigation by performing a meta-analysis of the UPMC and CUIMC data for the correlation of network effective size with PROMIS T score (β = 0.135 ± 0.046, p = 0.003). This finding in the meta-analysis is consistent with that from the discovery study (table 2). Importantly, since the p value is more significant in the meta-analysis after the addition of the second data set, the extension data are contributing additional support to the original observation. Likewise, network constraint was associated with a lower PROMIS T score in the meta-analysis (β = −0.163 ± 0.047, p < 0.001), confirming the discovery finding. For network effective size and constraint associations, both cohorts exhibited the same directions of effect, though the effect size in the extension cohort was more modest than the discovery cohort, likely due to its characteristics (data available from Dryad, table e-3, doi:10.5061/dryad.hdr7sqvdt, and figure 3A). Next, we examined the 2 suggestive results from the discovery analysis in the meta-analysis: maximum degree (β = 0.143 ± 0.045, p = 0.001) and mean degree (β = 0.135 ± 0.046, p = 0.003); both showed consistent directions of association with PROMIS T score (table 2). These results suggest that additional network variables, while not significant in our current analysis, may deserve investigation in future studies.
Associations of personal network with alternative outcomes of disability
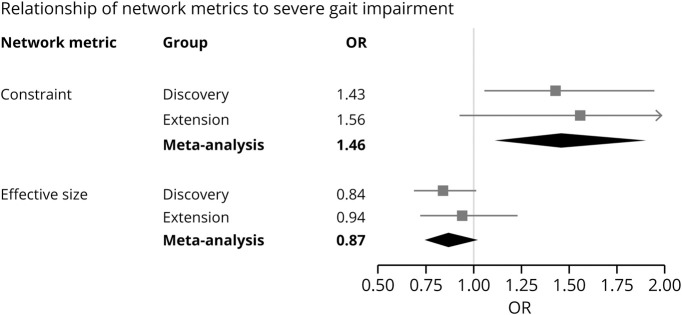
To assess whether the structural network associations were unique to physical function as measured by PROMIS, we tested 2 alternative outcomes. First, we used the MSRS-R, in which higher scores indicate greater neurologic dysfunction and disability. Greater network constraint correlated with a higher MSRS-R (β = 0.134 ± 0.046, p = 0.004), whereas a larger network effective size was associated with a lower MSRS-R in the meta-analysis (β = −0.099 ± 0.046, p = 0.030) (data available from Dryad, table e-4, doi:10.5061/dryad.hdr7sqvdt, and figure 3, B). Next, we examined the requirement for an assistive device for distances greater than 25 feet as an indicator of the severity of gait impairment. For every 1 SD increase in social network constraint, there was a significantly higher odds of severe gait impairment in the meta-analysis (odds ratio 1.46, 95% CI 1.12–1.90, p = 0.005) (data available from Dryad, table e-5, doi:10.5061/dryad.hdr7sqvdt, and figure 4). Consequently, these other measures of function yield consistent results with PROMIS.
Figure 4. Forest plot of network metrics and association with severe gait impairment.
Severe gait impairment is defined as requiring an assistive device for walking distances greater than 25 feet. For each cohort, the square is the odds ratio (OR) and lines are the 95% confidence interval (CI) of a network metric after adjustment for covariates. The diamond represents the summary OR and 95% CI after a fixed-effects meta-analysis of the 2 cohorts. A standardized measure of network constraint was associated with severe gait impairment in the meta-analysis.
Sensitivity analysis
We tested the reproducibility of the findings after accounting for non-normative distributions by performing nonparametric Spearman correlation tests. We examined the relationship between structural network metrics and PROMIS T score. The results (data available from Dryad, table e-6, doi:10.5061/dryad.hdr7sqvdt) were consistent with findings from the primary analysis. In the discovery cohort, we again observed a significant association between network effective size and PROMIS T score (ρ = 0.242, p < 0.001), and an inverse relationship between network constraint and PROMIS T score (ρ = −0.264, p < 0.001).
Discussion
In this cross-sectional study of 427 adults with MS from 2 different centers, we found associations of overall social network structure with physical function. Patients with MS who inhabit close-knit social networks reported greater physical impairment. These associations were independent of typical risk factors for disability, including age, sex, race, and disease duration.26
We observed an inverse relationship between physical function and constraint, a measure of the tight-knit structure in a social network. While this cross-sectional study cannot establish the directionality of the association, the observation has several potential implications. As patients with MS develop greater physical disability and more significant ambulatory impairment, they are less likely to participate in complex social activities over time.27 Confinement to the home environment further restricts social support and tends to limit interactions to closely connected groups of family and friends, increasing a network's constraint.28 Finally, physical disability increases the likelihood of unemployment in MS,29 and contributes to the consequent loss of weak social ties through diminished coworker connections and decreases in network heterogeneity after exiting from the workforce.30 Interestingly, the discovery cohort has more severe disability (PDDS, PROMIS, MSRS) than the extension cohort, which may contribute to the higher proportion of unemployment in the discovery cohort, and the potentially stronger association between physical disability and network constraint in the discovery cohort.
Although physical function may influence social dynamics, a negative effect of highly constrained networks on disability may also exist. Close-knit networks are often smaller, thereby limiting novel information flow and restricting individual autonomy, while potentially propagating stressful interactions and reinforcing unhealthy behaviors.28,31 These maladaptive exchanges are especially problematic in neurologic conditions, like stroke, where resultant delays in hospital presentation can lead to irreversible disability.31
Belonging to a network with weak interpersonal ties has distinct advantages. Members in these open and socially complex networks can serve as bridges between 2 or more persons or groups who would otherwise have no connections to each other.32 Bridging is helpful in medical situations by enabling access to nonredundant health information and diverse opinions. Complex networks with bridging potential also expose individuals to a wider range of intellectual and social pursuits, thereby providing greater reserve against cognitive and physical decline as they age.33,34 For patients with MS, engagement in these intellectually enriching activities can mitigate the effect of brain atrophy on memory impairment.35 The possibility that social network structure mediates this relationship is supported by the protective effect of network complexity in other neurologic diseases, including Alzheimer dementia36 and stroke recovery.37
Our discovery that the social environment may be an important health factor in MS has potential implications for disease management. Prior studies have shown a limited and nonsustained impact of MS peer support groups on quality of life and depression.38 Engaging network members who occupy bridging nodes may be a successful alternative strategy to promote behavioral changes.39 Such individuals have significant influence by way of their strategic, boundary-spanning roles, and are often more receptive to different beliefs.40 Interventions that target bridging members, for example, have led to changes in sexual practices, and have reduced HIV transmission in at-risk communities.41 Extending network interventions to the MS population may encourage the adoption of healthy lifestyle habits that could delay disability worsening, i.e., physical exercise, weight loss, and smoking cessation.
The strengths of this study include the rigorous measure of social networks in 2 large and independent cohorts. Our online network instrument was accessible for patients with different levels of disability and enabled rapid collection of data. The questionnaire can be readily repurposed for other studies and diseases since it is part of the REDcap-based library of questionnaires under the Personal Network Survey for Clinical Research (redcap.vanderbilt.edu/consortium/library/search.php). A second novelty was the utilization of the PROMIS as a quantitative measure of global physical function. PROMIS outperforms most measures of health quality, and has demonstrated validity and reliability in diverse patient populations.21 Consequently, PROMIS provides a useful, standardized outcome measure for social network studies in MS and other diseases. Finally, we found associations between several key structural network variables and physical function. These correlations were not limited to PROMIS, but were observed with other functional outcomes (MSRS-R and severity of gait impairment). The associations were consistent between 2 different MS populations, suggesting that they may be generalizable and could guide further investigations of the social environment in MS.
This study has several limitations. First, we were unable to determine the causality and directionality of our findings given the cross-sectional design. While we are pursuing a longitudinal investigation of social network data in our cohorts, the current study is informative and has clinical relevance in its own right. Second, our outcome measures of disability are all self-reported and may deviate from objective neurologic assessments. We chose the main outcome measures based on prior studies that showed overall consistency of PROMIS, MSRS-R, and PDDS with neurologic examinations.22,23,42 Third, our social network instrument relies on self-report, which could introduce recall bias. Reassuringly, prior research has demonstrated excellent agreement between self-reported and informant-based assessments of social network in other chronic conditions.43 Fourth, we cannot exclude a selection bias as we excluded patients who were non-English speakers or were unable to complete the electronic questionnaire due to cognitive and/or upper extremity impairment. Fifth, in this study we did not have access to data on the comorbidity burden, which may influence physical function and social network characteristics. Finally, the 2 cohorts have differences in demographic characteristics and sample sizes. The UPMC cohort included an older and more physically disabled patient population than CUIMC. The current CUIMC cohort was smaller, had less disability, and was likely underpowered to detect associations in all variables. Consequently, we used a meta-analysis to rigorously assess the combined findings and to interrogate the consistency in the direction of association and effect size.
Our study highlights the social network as a significant environmental factor associated with physical function and disability in MS. Patients with close-knit social networks had worse physical function and greater disability than those with more open social networks. Future longitudinal studies with parallel clinical and biomarker assessments are warranted to explore a possible causal relationship between effectively small, constrained networks and physical impairment in MS. Interventions that target the broader social networks may offer a promising approach to improve physical function and reduce disability in MS.
Acknowledgment
The authors thank the participants at UPMC and CUIMC for their time in contributing to this research study.
Glossary
- CI
confidence interval
- CUIMC
Columbia University Irving Medical Center
- MS
multiple sclerosis
- MSRS-R
Multiple Sclerosis Rating Scale–Revised
- PDDS
Patient-Determined Disease Steps
- PROMIS
Patient-Reported Outcomes Measurement Information System
- REDCap
Research Electronic Data Capture
- UPMC
University of Pittsburgh Medical Center
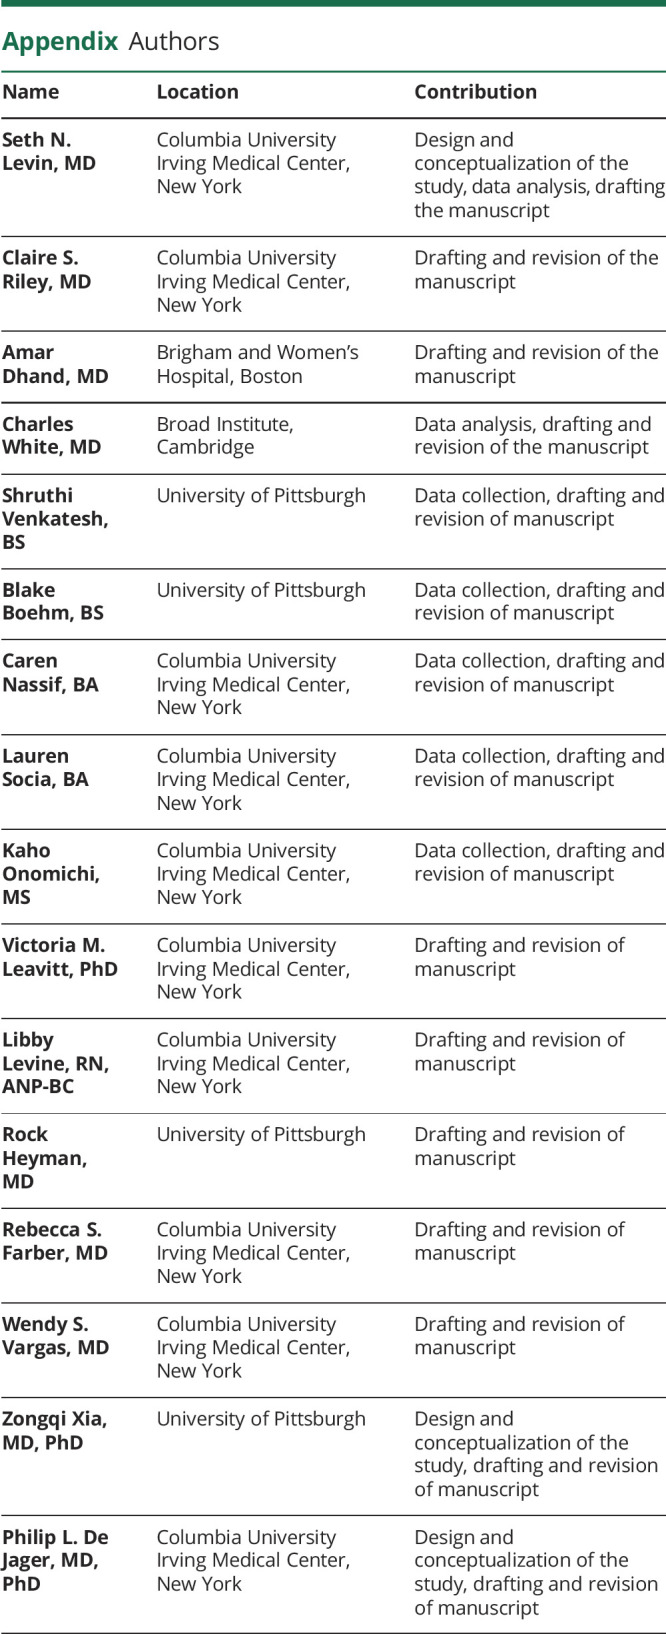
Appendix. Authors
Footnotes
Editorial, page 463
Study funding
No targeted funding reported.
Disclosure
S.N. Levin has received a fellowship training grant through Genentech and honoraria for advisory work with Biogen. C.S. Riley has received honoraria for advisory or consulting work with Biogen, Genentech/Roche, EMD Serono, TG Therapeutics, Celgene, Teva, and Genzyme. A. Dhand, C.C. White, S. Venkatash, B. Boehm, C. Nassif, L. Socia, and K. Onomichi report no disclosures relevant to the manuscript. V.M. Leavitt has received grant funding from the NIH and NMSS, fellowship funding through NMSS, honoraria for consulting work with Healios, LLC, and is cofounder of eSupport Health, PBC. L. Levine, R. Heyman, and R.S. Farber report no disclosures relevant to the manuscript. W.S. Vargas has received honoraria for advising or consulting work with Biogen, Octapharma, and Alexion, and grant support from Teva. Z. Xia serves on the scientific advisory board of Roche/Genentech and has a research agreement with Subtle Medical and Octave Bioscience. P.L. De Jager serves on the scientific advisory board for Neuroimmunology Newco, Roche, Biogen, and Celgene, has a sponsored research agreement with Biogen and Roche, and has fellowship funding through Genentech. Go to Neurology.org/N for full disclosures.
References
- 1.Koch-Henriksen N, Sorensen PS. The changing demographic pattern of multiple sclerosis epidemiology. Lancet Neurol 2010;9:520–532. [DOI] [PubMed] [Google Scholar]
- 2.Stampanoni Bassi M, Iezzi E, Buttari F, et al. Obesity worsens central inflammation and disability in multiple sclerosis. Mult Scler 2019;1352458519853473. [DOI] [PubMed] [Google Scholar]
- 3.Manouchehrinia A, Tench CR, Maxted J, Bibani RH, Britton J, Constantinescu CS. Tobacco smoking and disability progression in multiple sclerosis: United Kingdom cohort study. Brain 2013;136:2298–2304. [DOI] [PMC free article] [PubMed] [Google Scholar]
- 4.Motl RW, Dlugonski D, Pilutti L, Sandroff B, McAuley E. Premorbid physical activity predicts disability progression in relapsing-remitting multiple sclerosis. J Neurol Sci 2012;323:123–127. [DOI] [PubMed] [Google Scholar]
- 5.Hakim EA, Bakheit AM, Bryant TN, et al. The social impact of multiple sclerosis: a study of 305 patients and their relatives. Disabil Rehabil 2000;22:288–293. [DOI] [PubMed] [Google Scholar]
- 6.Pfleger CC, Flachs EM, Koch-Henriksen N. Social consequences of multiple sclerosis: part 2: divorce and separation: a historical prospective cohort study. Mult Scler 2010;16:878–882. [DOI] [PubMed] [Google Scholar]
- 7.Cole SW, Hawkley LC, Arevalo JM, Sung CY, Rose RM, Cacioppo JT. Social regulation of gene expression in human leukocytes. Genome Biol 2007;8:R189. [DOI] [PMC free article] [PubMed] [Google Scholar]
- 8.Karelina K, Norman GJ, Zhang N, Morris JS, Peng H, DeVries AC. Social isolation alters neuroinflammatory response to stroke. Proc Natl Acad Sci USA 2009;106:5895–5900. [DOI] [PMC free article] [PubMed] [Google Scholar]
- 9.Smith KP, Christakis NA. Social networks and health. Annu Rev Sociol 2008;34:405–429. [Google Scholar]
- 10.Kawachi I, Colditz GA, Ascherio A, et al. A prospective study of social networks in relation to total mortality and cardiovascular disease in men in the USA. J Epidemiol Community Health 1996;50:245–251. [DOI] [PMC free article] [PubMed] [Google Scholar]
- 11.Kroenke CH, Kubzansky LD, Schernhammer ES, Holmes MD, Kawachi I. Social networks, social support, and survival after breast cancer diagnosis. J Clin Oncol 2006;24:1105–1111. [DOI] [PubMed] [Google Scholar]
- 12.Yang YC, McClintock MK, Kozloski M, Li T. Social isolation and adult mortality: the role of chronic inflammation and sex differences. J Health Soc Behav 2013;54:183–203. [DOI] [PMC free article] [PubMed] [Google Scholar]
- 13.Cornwell B. Good health and the bridging of structural holes. Soc Networks 2009;31:92–103. [DOI] [PMC free article] [PubMed] [Google Scholar]
- 14.Dhand A, Luke DA, Lang CE, Lee JM. Social networks and neurological illness. Nat Rev Neurol 2016;12:605–612. [DOI] [PMC free article] [PubMed] [Google Scholar]
- 15.Dhand A, White CC, Johnson C, Xia Z, De Jager PL. A scalable online tool for quantitative social network assessment reveals potentially modifiable social environmental risks. Nat Commun 2018;9:3930. [DOI] [PMC free article] [PubMed] [Google Scholar]
- 16.Burt RS. Network items and the general social survey. Social Networks 1984;6:293–339. [Google Scholar]
- 17.Harris PA, Taylor R, Thielke R, Payne J, Gonzalez N, Conde JG. Research electronic data capture (REDCap)-a metadata-driven methodology and workflow process for providing translational research informatics support. J Biomed Inform 2009;42:377–381. [DOI] [PMC free article] [PubMed] [Google Scholar]
- 18.Wasserman S, Faust K. Social Network Analysis. Cambridge: Cambridge University Press; 2009. [Google Scholar]
- 19.Burt RS. Structural holes and good ideas. Am J Sociol 2004;110:349–399. [Google Scholar]
- 20.Agresti A, Agresti BF. Statistical analysis of qualitative variation. Soc Methodol 1978;204–237. [Google Scholar]
- 21.Cella D, Riley W, Stone A, et al. The Patient-Reported Outcomes Measurement Information System (PROMIS) developed and tested its first wave of adult self-reported health outcome item banks: 2005-2008. J Clin Epidemiol 2010;63:1179–1194. [DOI] [PMC free article] [PubMed] [Google Scholar]
- 22.Senders A, Hanes D, Bourdette D, Whitham R, Shinto L. Reducing survey burden: feasibility and validity of PROMIS measures in multiple sclerosis. Mult Scler 2014;20:1102–1111. [DOI] [PMC free article] [PubMed] [Google Scholar]
- 23.Wicks P, Vaughan TE, Massagli MP. The Multiple Sclerosis Rating Scale, Revised (MSRS-R): development, refinement, and psychometric validation using an online community. Health Qual Life Outcomes 2012;10:70. [DOI] [PMC free article] [PubMed] [Google Scholar]
- 24.Bove R, Secor E, Healy BC, et al. Evaluation of an online platform for multiple sclerosis research: patient description, validation of severity scale, and exploration of BMI effects on disease course. PLoS One 2013;8:e59707. [DOI] [PMC free article] [PubMed] [Google Scholar]
- 25.Hohol MJ, Orav EJ, Weiner HL. Disease steps in multiple sclerosis: a longitudinal study comparing disease steps and EDSS to evaluate disease progression. Mult Scler 1999;5:349–354. [DOI] [PubMed] [Google Scholar]
- 26.Vasconcelos CC, Aurencao JC, Thuler LC, Camargo S, Alvarenga MP, Alvarenga RM. Prognostic factors associated with long-term disability and secondary progression in patients with multiple sclerosis. Mult Scler Relat Disord 2016;8:27–34. [DOI] [PubMed] [Google Scholar]
- 27.Johansson S, Ytterberg C, Gottberg K, Holmqvist LW, von Koch L, Conradsson D. Participation in social/lifestyle activities in people with multiple sclerosis: changes across 10 years and predictors of sustained participation. Mult Scler 2019;1352458519881991. [DOI] [PubMed] [Google Scholar]
- 28.Cornwell B. Network bridging potential in later life: life-course experiences and social network position. J Aging Health 2009;21:129–154. [DOI] [PMC free article] [PubMed] [Google Scholar]
- 29.Moore P, Harding KE, Clarkson H, Pickersgill TP, Wardle M, Robertson NP. Demographic and clinical factors associated with changes in employment in multiple sclerosis. Mult Scler 2013;19:1647–1654. [DOI] [PubMed] [Google Scholar]
- 30.Montgomery JD. Weak ties, employment, and inequality: an equilibrium-analysis. Am J Sociol 1994;99:1212–1236. [Google Scholar]
- 31.Dhand A, Luke D, Lang C, Tsiaklides M, Feske S, Lee JM. Social networks and risk of delayed hospital arrival after acute stroke. Nat Commun 2019;10:1206. [DOI] [PMC free article] [PubMed] [Google Scholar]
- 32.Burt RS. The network structure of social capital. Res Organ Behav 2000;22:345–423. [Google Scholar]
- 33.Escobar-Bravo MA, Puga-Gonzalez D, Martin-Baranera M. Protective effects of social networks on disability among older adults in Spain. Arch Gerontol Geriat 2012;54:109–116. [DOI] [PubMed] [Google Scholar]
- 34.Ellwardt L, Van Tilburg TG, Aartsen M. The mix matters: complex personal networks relate to higher cognitive functioning in old age. Soc Sci Med 2015;125:107–115. [DOI] [PubMed] [Google Scholar]
- 35.Sumowski JF, Wylie GR, Chiaravalloti N, DeLuca J. Intellectual enrichment lessens the effect of brain atrophy on learning and memory in multiple sclerosis. Neurology 2010;74:1942–1945. [DOI] [PMC free article] [PubMed] [Google Scholar]
- 36.Bennett DA, Schneider JA, Tang Y, Arnold SE, Wilson RS. The effect of social networks on the relation between Alzheimer's disease pathology and level of cognitive function in old people: a longitudinal cohort study. Lancet Neurol 2006;5:406–412. [DOI] [PubMed] [Google Scholar]
- 37.Dhand A, Lang CE, Luke DA, et al. Social network mapping and functional recovery within 6 months of ischemic stroke. Neurorehabil Neural Repair 2019;33:922–932. [DOI] [PMC free article] [PubMed] [Google Scholar]
- 38.Messmer Uccelli M, Mancuso Mohr L, Battaglia MA, Zagami P, Mohr DC. Peer support groups in multiple sclerosis: current effectiveness and future directions. Mult Scler 2004;10:80–84. [DOI] [PubMed] [Google Scholar]
- 39.Valente TW. Network interventions. Science 2012;337:49–53. [DOI] [PubMed] [Google Scholar]
- 40.Valente TW, Fujimoto K. Bridging: locating critical connectors in a network. Soc Networks 2010;32:212–220. [DOI] [PMC free article] [PubMed] [Google Scholar]
- 41.Amirkhanian YA, Kelly JA, Takacs J, et al. Effects of a social network HIV/STD prevention intervention for MSM in Russia and Hungary: a randomized controlled trial. AIDS 2015;29:583–593. [DOI] [PMC free article] [PubMed] [Google Scholar]
- 42.Learmonth YC, Motl RW, Sandroff BM, Pula JH, Cadavid D. Validation of Patient-Determined Disease Steps (PDDS) scale scores in persons with multiple sclerosis. BMC Neurol 2013;13:37. [DOI] [PMC free article] [PubMed] [Google Scholar]
- 43.Green HD, Hoover MA, Wagner GJ, Ryan GW, Ssegujja E. Measuring agreement between egos and alters understanding informant accuracy in personal network studies. Field Method 2014;26:126–140. [Google Scholar]
Associated Data
This section collects any data citations, data availability statements, or supplementary materials included in this article.
Data Availability Statement
The social network questionnaire, “Personal Network Survey for Clinical Research,” is available in the REDCap Shared Library. A comprehensive R codebase for researchers who use the instrument to analyze and visualize their data is available at github.com/AmarDhand/PersonalNetworks. The authors agree to share anonymized data from this study by request from any qualified investigator. Supplementary data are available from Dryad (tables e-1 through e-6, doi:10.5061/dryad.hdr7sqvdt).


