Abstract
Objective
To test the hypothesis that there is shared regional or global functional connectivity dysfunction in a large cohort of patients with isolated focal dystonia affecting different body regions compared to control participants. In this case-control study, we obtained resting-state MRI scans (three or four 7.3-minute runs) with eyes closed in participants with focal dystonia (cranial [17], cervical [13], laryngeal [18], or limb [10]) and age- and sex-matched controls.
Methods
Rigorous preprocessing for all analyses was performed to minimize effect of head motion during scan acquisition (dystonia n = 58, control n = 47 analyzed). We assessed regional functional connectivity by computing a seed-correlation map between putamen, pallidum, and sensorimotor cortex and all brain voxels. We assessed significant group differences on a cluster-wise basis. In a separate analysis, we applied 300 seed regions across the cortex, cerebellum, basal ganglia, and thalamus to comprehensively sample the whole brain. We obtained participant whole-brain correlation matrices by computing the correlation between seed average time courses for each seed pair. Weighted object-oriented data analysis assessed group-level whole-brain differences.
Results
Participants with focal dystonia had decreased functional connectivity at the regional level, within the striatum and between lateral primary sensorimotor cortex and ventral intraparietal area, whereas whole-brain correlation matrices did not differ between focal dystonia and control groups. Rigorous quality control measures eliminated spurious large-scale functional connectivity differences between groups.
Conclusion
Regional functional connectivity differences, not global network level dysfunction, contributes to common pathophysiologic mechanisms in isolated focal dystonia. Rigorous quality control eliminated spurious large-scale network differences between patients with focal dystonia and control participants.
Most isolated adult-onset dystonias are focal and idiopathic,1 but improved genetic, imaging, and laboratory techniques have expanded the known etiologies. Challenges remain because clinical manifestations do not always correspond to specific etiologies.2 Focal dystonia (FD) includes a group of heterogenous disorders involving different body parts often associated with somatopically related distinct regional brain dysfunction.3–5 Thus interpretation of findings in one type of FD may not generalize to other forms. This raises questions as to whether various FD subtypes share common mechanisms.
Substantial experimental and clinical observations link basal ganglia dysfunction with FD,5–12 although recent neuroimaging studies implicate pathophysiologic contributions from other brain regions or related networks including cerebellum, sensorimotor cortical areas, brainstem, and thalamus.3,13–24 Importantly, some of the purported network abnormalities may reflect inconsistent methods to address motion-related confounds in fMRI studies. Such data analysis methods likely contribute to statistically significant false-positive findings related to motion artifact,25,26 complicating interpretability, reproducibility, and generalizability of the results.6,13,14,19,21,27–29
We hypothesized that resting-state functional connectivity MRI (rs-fcMRI) could identify functional connectivity (FC) dysfunction shared across a large cohort containing 4 separate FD subtypes. We used rs-fcMRI with rigorous evidence-based methods to control for motion artifact and applied both hypothesis-driven regional and unbiased data-driven whole-brain approaches. We further hypothesized that implementation of global signal regression (GSR) and current rs-fcMRI motion correction techniques would substantially reduce potential motion-related artifact from sources such as respirations that may contribute to false-positive findings.25,26,30,31
Methods
Standard protocol approvals, registrations, and patient consents
The Human Research Protection Office at Washington University in St. Louis approved this study. All participants provided written informed consent and received monetary compensation for their time.
Participants
Inclusion criteria for the FD group included adults (age ≥18) with a clinical diagnosis of isolated idiopathic FD of adductor-type laryngeal, focal upper limb (including writer's cramp), cervical, or craniofacial (including blepharospasm) with or without botulinum toxin injections (but not administered less than 3 months prior to imaging). We recruited participants with FD from the Movement Disorders Clinic at Washington University in St. Louis between May 2011 and May 2014. On the study day, FD was confirmed by an expert in movement disorders neurology (J.S.P., S.A.N., M.K.). Exclusion criteria included combined dystonia (FD group only), comorbid neurologic disorders aside from tremor, inability to keep the head and body still while lying supine, history of birth trauma or serious head injury, any history of exposure to medications blocking dopamine receptors, exposure to any medication affecting the dopaminergic system (e.g., carbidopa-levodopa) in the preceding 3 months, or any contraindication to MRI. FD data passing quality assurance criteria (described below) were matched to the control group by age and sex. Healthy control data were obtained from a database of rs-fcMRI scans collected using the same imaging sequences and exclusion criteria under data sharing protocols approved by the Washington University in St. Louis Human Research Protection Office. All study visits occurred at Washington University in St. Louis.
Data acquisition and preprocessing
All participants underwent resting-state functional and structural T1- and T2-weighted MRI scans with image acquisition and preprocessing as described previously.26,32 Participants completed 3–4 rs-fcMRI runs using a gradient echo pulse sequence (200 volumes/run [7.33 minutes]). Participants were observed directly for movement during scanning and any runs during which participants had sustained tremor, dystonia, or other movements were excluded. Participant wakefulness was assessed verbally after each run. Anatomical T1-weighted images were processed using the FreeSurfer5.0 default recon-all processing pipeline with manual edits to ensure accuracy (surfer.nmr.mgh.harvard.edu/). rs-fcMRI data were preprocessed using standard techniques, including (1) atlas transformation via composition of affine transforms involving a sequence of coregistrations between the fMRI volumes, T2- and T1-weighted structural images, and atlas representative target; (2) realignment of images to account for head motion; (3) removal of the voxel-wise mean signal and linear trend; (4) regression of several nuisance variables (motion regression derived by Volterra expansion33 and signal from ventricles, white matter, and averaged over the whole brain); (5) generation of temporal masks flagging frames contaminated by excess motion (see Motion correction and quality assurance); (6) repeat removal of the voxel-wise mean signal and linear trend and regression of nuisance variables, this time ignoring frames previously censored for motion; (7) interpolation to replace censored frames using least-squares spectral estimation; (8) temporal band-pass filtering (0.009 Hz < f < 0.08 Hz) of the interpolated data; and (9) spatial smoothing (6 mm full width at half maximum Gaussian blur in each cardinal direction). Interpolation was performed to enable band-pass filtering on a continuous data set, but interpolated frames were not included in analyses.
We controlled for motion-related confounds using a combination of GSR and frame censoring. Framewise displacement was calculated from low-pass filtered (fc < 0.1 Hz) motion parameters and volumes with framewise displacement exceeding 0.1 mm were excluded.34 This was done to help distinguish between frames where actual large motion occurred from frames where only apparent motion occurred due to respiratory motion–induced magnetic field distortions.35 Because temporal filtering of blood oxygenation level–dependent (BOLD) data was performed after frame censoring, it was not necessary to exclude neighboring volumes when removing those with excess motion. After frame censoring, BOLD rs-fcMRI runs with less than 30 volumes and participants with fewer than 120 volumes across all included runs were excluded (FD, n = 9; controls, n = 8). Preprocessing was then repeated using the updated temporal masks to remove volumes contaminated by motion from the outset of preprocessing.
Regional (a priori seed-based) analysis
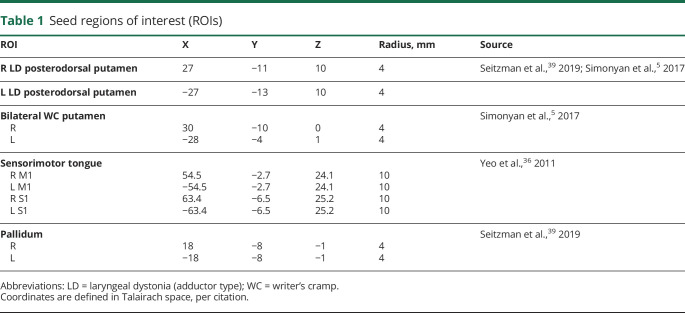
A hypothesis-based approach provides maximum power to detect differences in regional rs-fcMRI and test whether areas identified by other neuroimaging studies in dystonia have common abnormalities across a mixed cohort of FD. We defined spherical seeds within the basal ganglia and sensorimotor cortex (table 1). Because spatial distribution of striatal abnormalities in FD may be localized to small, topologically distinct regions based on the particular somatotopy of involved body regions,3–5 we elected to define bilateral striatal seeds based on a prior influential PET study by Simonyan et al.5 that describes peak coordinates for abnormal D1-like receptor binding in laryngeal dystonia and writer's cramp that correlated with symptoms. The unilateral laryngeal dystonia cluster closely overlapped the functionally defined posterodorsal putamen seed determined using a winner-take-all approach parcellating the basal ganglia based on FC. Accordingly, we opted to use the latter bilateral posterodorsal putamen seeds to approximate striatal regions implicated in laryngeal dystonia. Because writer's cramp clusters were bilateral,5 we combined left and right spheres into a single seed for analyses. Finally, we seeded the globus pallidus by combining left and right pallidal seeds, and tongue sensorimotor cortex by combining 4 spherical seeds corresponding to the left and right tongue representations in primary sensory and primary motor cortex.36
Table 1.
Seed regions of interest (ROIs)
For each participant, time series data were extracted for each voxel within the seed and averaged over all included voxels. White matter and ventricular signals were masked from the seed image. Correlation maps were computed between each seed and all voxels in the brain using the Pearson product moment formula. Maps were transformed using Fisher z-transform to obtain z(r) maps that were averaged over participants to obtain group-mean correlation maps and group difference (controls − FD) z(r) images. To assess statistical significance, random effects analyses (voxel-wise t map) were done at the group level and t images were converted to equally probable Z score images and assessed for the presence of significant voxel clusters. Cluster-wise significance criteria were determined by nonparametric analysis of surrogate Z images generated by Monte Carlo permutation (10,000 iterations) simulation of the null hypothesis and corrected for multiple comparisons with a fixed false-positive rate of 5%. Clusters were selected based on nonparametric statistical methods accounting for false-positive rate as previously described.37,38 To better estimate group-level effect size for significant seed-cluster pairs, we created histogram plots of individual participant mean seed-cluster z(r) correlations. We then calculated group mean ± SD for each seed-cluster z(r) for FD and control groups, describing the SD between groups.
Whole-brain object-oriented data analysis
We employed a separate unbiased whole-brain approach to assess FC across the entire brain. Each brain was seeded with a set of 300 spherical regions of interest (ROIs), including 239 × 10-mm diameter cortical and 61 × 8-mm diameter subcortical and cerebellar ROIs, providing whole-brain coverage including thalamus, basal ganglia, amygdala, hippocampus, and cerebellum.39 ROI network assignments are reported at wustl.app.box.com/s/twpyb1pflj6vrlxgh3rohyqanxbdpelw (last accessed September 12, 2020). We excluded 12 unassigned ROIs from analyses as these regions have particularly low signal-to-noise and do not cluster well.
Given the substantial heterogeneity of brain regions implicated across functional imaging studies, we employed an unbiased approach to identify large-scale group-level differences in rs-fcMRI using weighted graph object-oriented data analysis (OODA) to directly compare whole-brain connectivity matrix objects (i.e., connectomes) while avoiding substantial data reduction.32,40 For each participant, time courses were averaged across all included voxels for each ROI to generate a mean ROI time course, and Pearson correlations were computed for each ROI pair to create an individual participant correlation matrix. Correlation values were averaged across participants to obtain group-mean correlation matrices. Group difference matrices were derived from subtraction of group-mean data (control − FD).
We used multidimensional scaling (MDS) to visually represent the distribution of individual correlation matrices based on the distances (i.e., dissimilarities) between them.32 Euclidean distances between each pair of correlation matrices were calculated to generate a pairwise distance matrix. The matrix objects then are represented in a dimensional space where the principal components of distance are the primary dimensions. Each dot on the plot represents an individual correlation matrix and the distance between points correlates with their actual distance. The central tendencies of each group (g*) are also represented in the MDS plots. MDS computations were performed using the cmdscale.m function in MATLAB R2018b.
If OODA analysis led to rejection of the null hypothesis that whole-brain connectivity matrix objects were similar across groups, intent was to apply the 300 network-assigned ROIs to compute composite network-to-network FC scores. Calculated average cross-correlation between network nodes for each participant would be compared across groups using a 2-sample independent t test with false discovery rate correction for multiple comparisons.
Effects of GSR and frame censoring
We tested the effects of GSR and frame censoring on the number of significant correlations related to motion in our dataset. We first sought to replicate previous work in healthy adults with high head motion (“high movers”) vs low head motion (“low movers”)26 by comparing the bottom and top tertiles of control participants (i.e., control vs control analysis) based on framewise displacement computed on uncensored data under the following conditions: (1) no GSR, no frame censoring; (2) no GSR with frame censoring; (3) GSR without frame censoring; and (4) GSR and frame censoring. The observed group differences for each pair of seed ROIs (see ROI selections) were tested against the null expectations and significance levels established by 1,000 permutations of group label assignment (high vs low motion). The number of significant correlations was counted for each processing condition. We then repeated this permutation testing for 50 rounds to establish the mean and SD number of significant correlations for each condition. We selected 50 repetitions empirically to ensure steady-state for each condition. We next assessed the efficacy of these processing strategies in reducing significant correlations related to motion in FD high vs low movers using the same strategy (i.e., FD vs FD). Finally, we applied these tests in control vs FD groups, matched for motion to determine the effect of movement-related artifact on the number of significant correlations in comparing FD vs control populations, even when matched for motion.
Data availability
Anonymized data will be shared by request from any qualified investigator.
Results
Participants
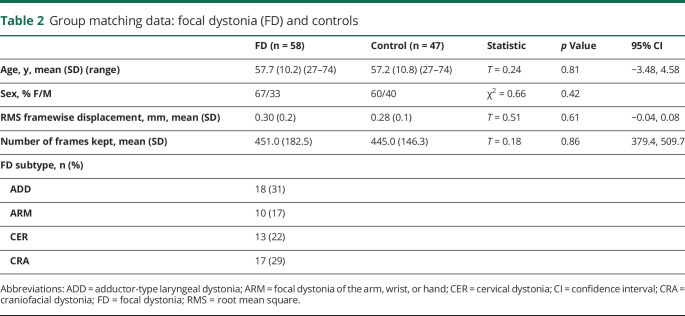
Sixty-nine participants with FD were enrolled. One patient with FD and 3 matched control participants were excluded with anatomical abnormalities on structural MRI, and 9 patients with FD and 8 matched control participants with inadequate rs-fcMRI data after censoring volumes contaminated with excessive motion. One additional patient with FD was excluded due to a 9-year age discrepancy with available control participants. We display demographic and rs-fcMRI motion parameters information for the 58 FD and 47 control participants included in analyses that met quality assurance standards (table 2). The analyzed FD and control groups did not differ in age, sex, or motion parameters. Forty-six participants with FD received botulinum toxin as standard clinical symptomatic management. Median time from botulinum toxin injections to study participation was 3.1 months (range 3 weeks to 135 months; 8 participants received injections longer than 12 months, 15 between 3 and 12 months, and 20 less than 3 months prior to study participation).
Table 2.
Group matching data: focal dystonia (FD) and controls
Regional seed-cluster group FC comparison
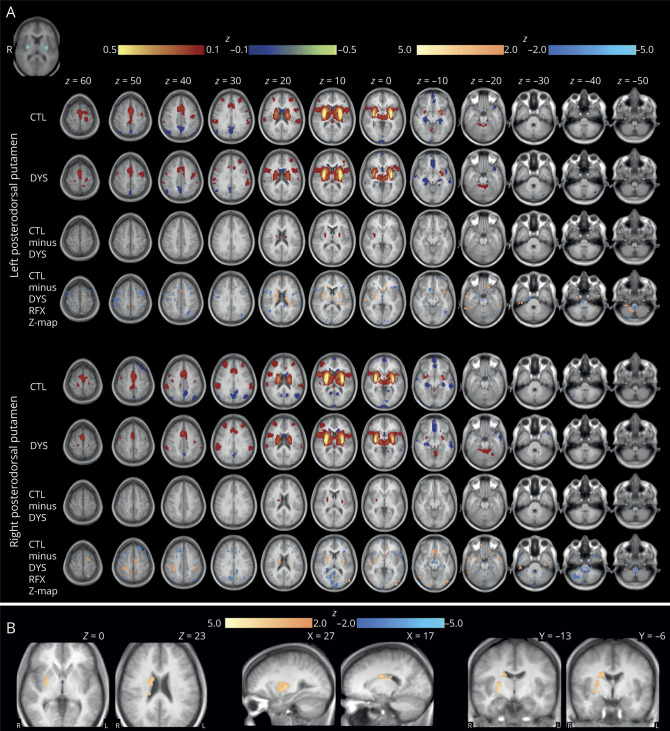
We show individual group, group subtraction, and random effects analyses for the posterodorsal putamen seed (figure 1A). These data demonstrate the thresholded voxel-wise effect size. Cluster analysis revealed weaker (t ≥ 3.3, minimum cluster of 38 contiguous voxels) FC between the left posterodorsal putamen and the right striatum, including the head and body of the caudate and throughout the putamen (figure 1B) for the FD group. Although the right posterodorsal putamen seed also had weaker FC within the striatum in the FD group, it did not meet our stringent requirements for significance. Comparison of individual participant mean posterodorsal seed-cluster z(r) correlation histogram plots demonstrate a normal unimodal distribution, where mean FD FC = 0.295 ± 0.175 and mean control FC = 0.442 ± 0.156.
Figure 1. Posterodorsal putamen functional connectivity (FC) in focal dystonia (FD) and controls.
(A) Group average and subtraction (control − FD) correlation maps are depicted for the seeds defined in the left (top) and right (bottom) posterodorsal putamen. Color maps are thresholded at |z| ≥ 0.1 for control (CTL), dystonia (DYS), and CTL − DYS. Random effects analyses (voxel-wise t map) were done at the group level and t images were converted to equally probable Z-score images (bottom rows). Random effects color maps are thresholded at |Z| ≥ 2.0. Warm colors represent positive and cool colors represent negative correlations. The seeds are depicted in the top left corner. (B) Significantly decreased striatal FC in FD. The cluster of significant group difference for the group effect z-score subtraction map (control − FD) is shown in axial, sagittal, and coronal planes, thresholded at |z| ≥ 2.0, for the seed in left posterodorsal putamen. The FD group has significantly decreased positive FC with the right caudate and putamen, displayed here at a significance threshold of t ≥ 3.0 and a minimum cluster extent of 80 voxels. Images are oriented in radiologic convention.
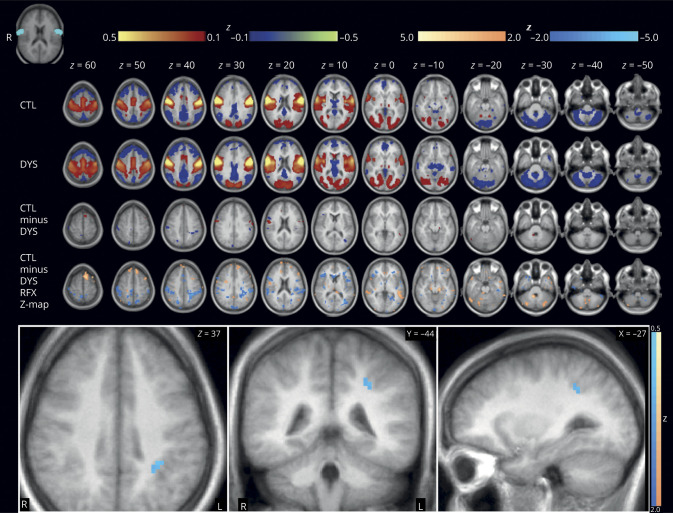
We show individual group, group subtraction, and random effects analyses for the sensorimotor mouth seed (figure 2). These data demonstrate the thresholded voxel-wise effect size. Cluster analysis revealed weaker (t ≥ 3.9, minimum cluster of 10 contiguous voxels) negative FC between the bilateral sensorimotor mouth and left intraparietal sulcus (IPS) for the FD group. Random effects analysis suggested weaker negative FC in the right IPS in the FD group that did not reach significance. Comparison of individual participant mean sensorimotor mouth seed-cluster z(r) correlation histogram plots demonstrate a normal unimodal distribution, where mean FD FC = 0.089 ± 0.140 and mean control FC = −0.025 ± 0.082.
Figure 2. Bilateral sensorimotor tongue functional connectivity (FC) in focal dystonia (FD) and controls.
Group average and subtraction (controls − FD) correlation maps are depicted for the seed defined in the bilateral tongue representations in S1 and M1. Group average and subtraction color maps are thresholded at |z| ≥ 0.1 for control (CTL), dystonia (DYS), and CTL – DYS. Random effects analyses (voxel-wise t map) were done at the group level and t images were converted to equally probable Z-score images (random effects Z map), shown with color maps thresholded at |Z| ≥ 2.0. Cluster analysis revealed a cluster of significantly decreased negative FC in the left intraparietal sulcus, depicted in the axial, coronal, and sagittal planes (bottom) at a significance threshold of t ≥ 3.9 with a minimum cluster extent of 10 voxels. Warm colors represent positive and cool colors represent negative correlations. The seed is depicted in the top left corner. Images are oriented in radiologic convention.
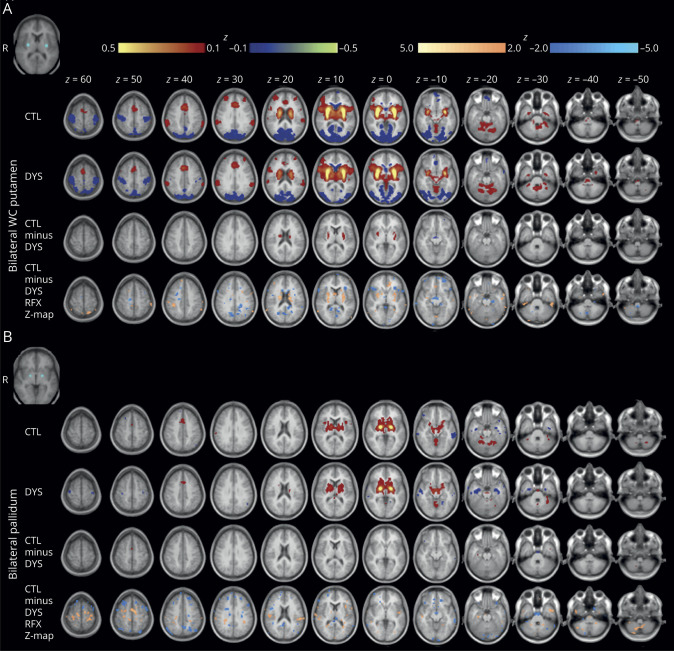
We show group − group subtraction and random effects seed maps for the bilateral writer's cramp putamen and pallidum seeds (figure 3). Writer's cramp putamen or pallidum seed FC did not differ between groups. To test the potential influence of therapeutic botulinum toxin injections on primary outcomes, we compared the distribution and mean FC values between no and remote (>12 months prior to MRI, n = 20) vs recent (<3 months prior to MRI, n = 19) botulinum toxin injections for the left posterodorsal putamen seed cluster (similar distributions with mean FC = 0.309 ± 0.184 vs 0.286 ± 0.186, T = 0.389, 95% confidence interval [CI] −0.097, 0.143) and sensorimotor mouth seed cluster (similar distributions with mean FC = 0.060 ± 0.109 vs 0.116 ± 0.161, T = −1.27, 95% CI −0.033, 0.145). We did not include data from the 3- to 12-month period following botulinum toxin injections (n = 19) due to potential indeterminate effect of botulinum toxin for this period.
Figure 3. Putamen functional connectivity (FC) in focal dystonia (FD) and controls.
Group average and subtraction (control − FD) correlation maps are depicted for the seeds defined in (A). (A) Bilateral putamen at the area of peak difference in D1-like receptor binding in writer's cramp vs controls and (B) bilateral pallidum. Color maps are thresholded at |z| ≥ 0.1 for control (CTL), dystonia (DYS), and CTL – DYS. Random effects analyses (voxel-wise t map) were done at the group level and t images were converted to equally probable Z-score images (bottom row). Random effects color maps are thresholded at |Z| ≥ 2.0. Warm colors represent positive and cool colors represent negative correlations. The seed is depicted in the top left corner. Images are oriented in radiologic convention.
Whole-brain group FC comparisons
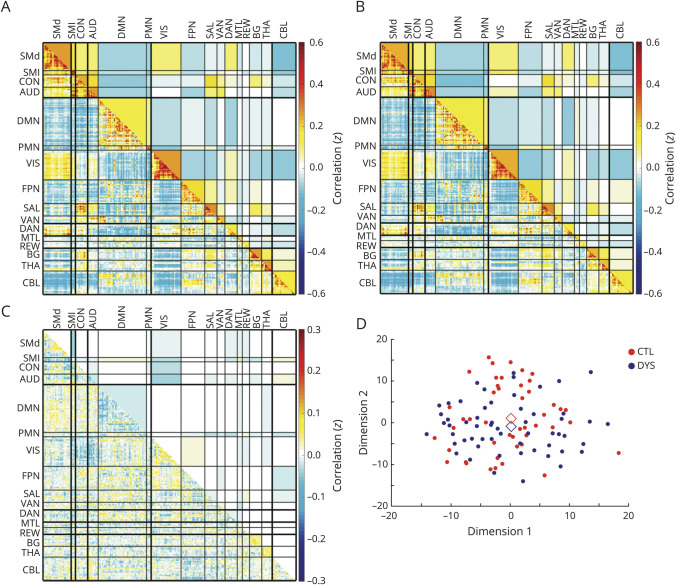
Each group's central matrix object (g*) representing the group average whole-brain functional connectome was calculated as depicted (figure 4, A and B). Group-average correlation matrices for control and FD show typical “block” network structure with high within-network FC (blocks along the diagonal) and lower between-network FC (off-diagonal blocks). Overall network organization appears similar in both groups.
Figure 4. Preserved whole-brain correlation matrices in focal dystonia (FD).
Central weighted connectome object (g*) for (A) control and (B) FD groups, and (C) subtraction (control g* – FD g*). Upper triangles show composite block FC scores (average cross-correlation between regions of interest); the lower triangles show the matrix objects with all edges preserved. There is no difference between control and FD whole-brain correlation matrices structure (p = 0.23). (D) Multidimensional scaling shows clustering of FD subgroups and control whole-brain correlation matrices represented in 2D space. Diamonds indicate the central object for each group. AUD = auditory; BG = basal ganglia; CBL = cerebellum; CON = controls; DAN = dorsal attention network; DMN = default mode network; DYS = dystonia; FPN = fronto-pariatal network; MTL = medial temporal lobe; PMN = parietal memory network; REW = reward network; SAL = salience network; SMd = somatomotor dorsal; SMl = somatomotor lateral; THA = thalamus; VS = visual; VAN = ventral attention network.
We quantified the dissimilarity between the 2 g* correlation matrices by computing their distance (control g* − FD g*) in multidimensional space (figure 4C). Visual inspection of this difference matrix shows that overall the magnitude of difference between the groups is small and restricted to a few blocks. The FD group has a slightly higher magnitude of network FC within the lateral somatomotor and default mode networks and decreased average FC within basal ganglia and thalamus networks. Internetwork composite FC differences in the subtraction image appear most prominently as increased visual network FC with somatomotor, dorsal somatomotor, auditory, and frontoparietal networks and increased visual network negative FC with the cingulo-opercular network. Average cerebellum internetwork FC with the frontoparietal, auditory, and somatomotor and parietomedial cross-network FC with the salience networks appear to have increased magnitude (of both positive and negative correlations) in FD.
We next determined the statistical significance of the observed differences in the group-level correlation matrices using bootstrapping (n = 1,000 iterations). The functional correlation matrices did not differ between participants with FD compared with controls (p = 0.226). We visually represented the distribution of correlation matrices based on their Euclidean distances in a multidimensional scaling plot (figure 4D). The groups highly overlap and do not cluster distinctly along the first 2 MDS dimensions. As the omnibus OODA result did not demonstrate significant group-level correlation matrix differences, we did not conduct post hoc analysis at the network level.
Effects of processing strategies on motion artifact and FC measures
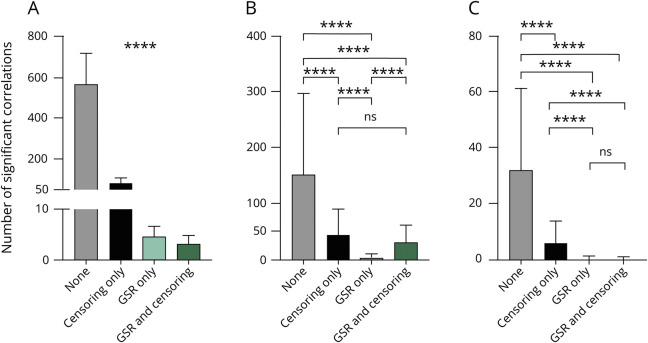
We evaluated the impact of GSR and frame censoring on the quantity of statistically significant spurious correlations related to motion artifact in our cohort of FD and control participants. For the control vs control analysis (see Effects of GSR and frame censoring), framewise displacement in the low (n = 12, mean = 0.15 mm) and high (n = 12, mean = 0.44 mm) mover participants differed (Welch-corrected t = 12.26, df = 13.99, p = 0.003). The highest mean number of significant correlations related to motion were found in the no GSR and no frame censoring condition (mean 570.0, SD 147.1), followed by frame censoring without GSR (mean 86.2, SD 20.7). Very few significant correlations related to motion were identified in the GSR only (mean 4.9, SD 1.8) and GSR with frame censoring conditions (mean 3.4, SD 1.4). There was an effect of processing condition on the number of significant correlations related to motion at the p < 0.05 level for the 4 conditions (F3.0,97.28 = 508.6, p < 0.0001). Post hoc comparisons using the Games-Howell multiple comparisons test indicated that all pairwise comparisons were different at p < 0.0001, corrected (figure 5A).
Figure 5. Global signal regression (GSR) and frame censoring reduce motion-related correlations.
Bar graphs show the number of significantly different correlations within the 300 × 300 region of interest whole-brain correlation matrix for (A) control (CTL) high vs CTL low mover participants, (B) focal dystonia (FD) high mover vs low mover participants, and (C) CTL vs FD motion-matched groups. GSR and frame censoring substantially reduce the number of spurious correlations arising from motion in all 3 comparisons. ****p < 0.0001.
A similar pattern of results occurred for the FD vs FD analysis. Framewise displacement differed between low (n = 15, mean 0.15 mm) and high (n = 15, mean 0.48 mm) movers (Welch-corrected t = 6.83, df = 14.71, p < 0.001). Significant correlations related to motion were again highest in the no GSR and no censoring condition (mean 154.3, SD 142.8), then with frame censoring without GSR (mean 45.0, SD 45.1). The GSR without frame censoring condition had the fewest significant correlations (mean 4.0, SD 5.3) and the GSR with frame censoring had an intermediate value (mean 32.4, SD 29.1). There was an effect of processing condition on the number of significant correlations related to motion at the p < 0.05 level for the 4 conditions (F3.0,84.12 = 45.65, p < 0.0001). Post hoc comparisons using the Games-Howell multiple comparisons test indicated that all pairwise comparisons were different at p < 0.0001, corrected, with the exception of the censoring without GSR vs censoring with GSR conditions, which were not different (p = 0.35) (figure 5B).
We investigated the effect of processing strategies on the motion-matched control vs FD large correlation matrix. FD and controls did not differ in baseline framewise displacement or the number of frames censored (table 2). Significant correlations related to motion were once again highest in the no GSR and no censoring condition (mean 32.4, SD 29.1), then with frame censoring without GSR (mean 6.6, SD 7.5). The GSR conditions performed similarly with the fewest significant correlations (GSR without censoring: mean 0.56, SD 0.86; GSR with censoring: mean 0.38, SD 0.70). There was an effect of processing condition on the number of significant correlations related to motion at the p < 0.05 level for the 4 conditions (F3.0,97.4 = 31.04, p < 0.0001). Post hoc comparisons using the Games-Howell multiple comparisons test indicated that all pairwise comparisons were significantly different at p < 0.0001, corrected, with the exception of the GSR with and without censoring conditions, which were not different (p = 0.95) (figure 5C).
Discussion
Using hypothesis-driven, seed-based analyses with strict motion censoring, we identified regional patterns of decreased FC within the striatum and between lateral primary sensorimotor cortex and the ventral intraparietal area in a large cohort of participants with various forms of isolated, idiopathic FD. We additionally demonstrate that when motion artifact is adequately removed, large-scale (whole-brain and network-level) correlation structure and magnitude does not differ between FD and healthy control groups. We illustrate how failure to apply GSR and frame censoring during standard preprocessing of FC data in dystonia, even with group-level matching of motion and rigorous statistical tests, can cause spurious but widespread differences in FC masquerading as robust network effects in FD. Together, these data support the notion that regional FC differences, not global FC dysfunction, contribute to common pathophysiologic mechanisms in isolated FD.
Our seed-based analyses identified robust differences of regional FC in participants with FD. Specifically, the left posterodorsal putamen seed gave rise to a cluster of decreased FC within the contralateral caudate (head and body) and putamen. We observed lower striatal FC bilaterally in the random effects analysis of both left and right postereodorsal putamen seed maps. These observations of lower intrastriatal FC support a wide body of evidence implicating the striatum in dystonia.5,11,24,27 Interestingly, seeds defined within regions of putamen implicated in writer's cramp5 had a markedly different pattern of FC from the posterodorsal putamen seeds, despite very close proximity. Writer's cramp is relatively underrepresented in our cohort, and may represent regional differences for which our study is not powered to explore. However, group average maps in FD and control participants are strikingly similar to identical seed maps in focal embouchure dystonia and musician control participants,41 thereby supporting reliability and validity of these seed-based approaches in our data. Sharp discrepancies between the correlation maps obtained from neighboring putamen seeds in our study draw attention to the importance of seed placement and challenges with interpretation across studies. This is of particular interest given potential regional or individual variability in dopaminergic signaling imbalance previously observed in participants with isolated writer's cramp and laryngeal dystonia.5 Here, we specifically elected to apply seeds derived from a prior PET study by Simonyan et al.5 identifying regional striatal dopamine dysfunction across distinct FD subtypes. These prior high-resolution data provided the basis for our seed-based approach and robust seed-based rs-fcMRI observations. We acknowledge that FC may vary at the individual rather than group level, a promising approach in development.42,43 Furthermore, we did not observe group FC differences in internal globus pallidus (GPi), a common surgical target for dystonia. Individual variability of FC, poor regional signal-to-noise, or mechanisms not detected by fcMRI might account for lack of functional connectivity differences in GPi, a common target for deep brain stimulation therapy in dystonia.44,45 Of course, surgical intervention targeted at GPi may produce downstream effects that interfere with abnormal signaling, thereby reducing manifestations of dystonia, yet the GPi itself may not play a key part of the underlying pathophysiology.
We also identified decreased regional FC between the combined bilateral sensorimotor tongue representation seed and the left IPS, specifically in the functionally defined ventral intraparietal area.46 The IPS is responsible for perceptuomotor integration, and neurons within the IPS respond selectively to various goal-directed movements such as reaching or eye movement tasks.47 Dysfunctional parietomotor plasticity involving projections from the IPS to M1 was previously identified in participants with cervical dystonia using a transcranial magnetic stimulation protocol to induce parietomotor facilitation.48 Functional neuroimaging studies have also implicated decreased FC within cortical somatomotor networks in the superior parietal lobule in participants with cervical dystonia.14 The application of an effective sensory trick in cervical dystonia, normalizing participant head position, relates to increased activation in superior and inferior parietal lobules overlapping the location of our cluster, and decreased activation in sensorimotor cortex, as measured by H215O PET.49 Taken together, our results fit within broader evidence supporting impaired sensorimotor-parietal integration in FD.
Whole-brain level FC in our study did not differ between the FD and control groups despite group power availability. Application of OODA allowed us to characterize whole-brain group comparison metrics without requiring substantial dimensionality reduction.40 While some networks and connections appeared different between the groups based on their difference matrix, these findings were not sufficiently robust to drive an overall difference in correlation matrix structure. Visualization of the central tendencies for each participant's correlation matrix in multidimensional space further illustrated the similarities between the FD and control groups, both sharing highly similar means, variance, and distributions. Lack of whole-brain level FC group differences was particularly surprising given a wide body of literature demonstrating large-scale network effects in FD using rs-fcMRI.3,6,13,14,28 This discrepancy may, in part, be attributable to the lack of utilization of GSR in these older studies. Functional connectivity measures are frequently confounded with head motion and therefore need to be apropriately controlled to avoid misinterpretation of statistically significant spurious correlations.25,26,30,31 Frame-wise displacement of as little as 0.2 millimeters can induce massive global shifts in BOLD signals and these artifacts cause artificially inflated distance-dependent correlations.25,26 Multiple processing strategies have been tested to minimize the effect of head motion on rs-fcMRI data, and GSR is consistently the most effective method for minimizing the number of functional correlations related to participant motion.30 Furthermore, when applying GSR, censoring of frames contaminated by motion is necessary to reduce distance-dependent correlations. Some extant data in rs-fcMRI apply maximum mean or framewise displacement criteria for participant inclusion, but none employs frame censoring.6,13,14,19,21,27–29
We support the notion that without GSR, false-positive correlations driven by motion occur despite preprocessing strategies commonly employed in the dystonia literature, including nuisance regression of 24 motion parameters and white matter and CSF signals and group matching for motion.30 We explicitly demonstrate that differences in the number of significant correlations across the whole-brain correlation matrices are virtually absent when comparing FD vs control groups when GSR is performed, consistent with the results from our OODA analysis. First, we replicated results demonstrating a comparable pattern of motion-related correlations for processing methods with and without GSR and frame censoring in healthy control participants.26 Then, we applied this strategy in a split cohort of FD high and low movers. The maximum magnitude of significant correlations was lower for this comparison than in the control vs control group. However, GSR still clearly reduced the number of motion-related statistically significant spurious findings. These findings parallel a previous analysis of resting-state FC in relation to cognitive performance measures.50 Interestingly, the incorporation of frame censoring with GSR led to more significant correlations than in GSR alone. Frame censoring reduces the distance-dependent correlations that are prominent after GSR and, though it reduces the degrees of freedom in the data by removing frames, it tends to yield less noisy data in groups that tend to have higher motion during scans, including older adults and patient populations.30 Thus, the increase in positive results in the GSR plus frame censoring condition could be attributable to true group differences within these cohorts, which emerged upon reducing the noise in the data with frame censoring. It is important to note, however, that subtype heterogeneity may have contributed to the lack of detectable large-scale network differences in FD if each subtype had its own specific pattern of involved network nodes.
Limitations of this study include a lack of clinical and behavioral measures to correlate with identified FC differences. Thus, the clinical relevance of the present findings is uncertain. Some participants received therapeutic botulinum toxin injections at variable times during the study. However, botulinum toxin influence on our primary results appears low based on the lack of difference in seed–cluster relationships for those with no/remote vs recent botulinum toxin injections. Furthermore, the heterogeneous composition of our dystonia cohort may mask subtype-specific features relating to mechanisms driving different phenomenologic patterns of FD. Although our overall large sample size is a strength of this study, the individual dystonia subtypes' sample sizes were relatively small. Our data therefore were underpowered for dystonia subtype analyses. Follow-up studies in a larger cohort should determine whether regional FC patterns for these implicated seeds show characteristic topologic differences across dystonia subtypes.
We have identified robust pathophysiologic regional differences in FC within the striatum and a sensorimotor-parietal network as a common feature across focal dystonias. We did not observe group differences in whole-brain level or network-level FC between FD and controls after applying rigorous motion control parameters. Finally, we quantitatively demonstrate that failure to apply GSR and frame censoring during preprocessing led to numerous spurious but statistically significant group-level differences in FC, even when groups are matched for amount of head motion.
Acknowledgment
The authors thank Benjamin Seitzman and Aaron Tanenbaum for intellectual discussions regarding methodology and Allison Bischoff, Tasha Doty, Anja Pogarcic, Stacy Pratt, and Linda Hood for assistance with participant recruitment, consent, and data collection. Morvarid Karimi is deceased.
Glossary
- BOLD
blood oxygenation level–dependent
- CI
confidence interval
- FC
functional connectivity
- FD
focal dystonia
- GPi
internal globus pallidus
- GSR
global signal regression
- IPS
intraparietal sulcus
- MDS
multidimensional scaling
- OODA
object-oriented data analysis
- ROI
region of interest
- rs-fcMRI
resting-state functional connectivity MRI
- VIP
ventral intraparietal
Appendix. Authors

Footnotes
Editorial, page 711
Study funding
NIH: T32NS007205, T32 GM07356, U54NS116025 (Dystonia Coalition), a part of the Rare Diseases Clinical Research Network, an initiative of the Office of Rare Diseases Research through collaboration between National Center for Advancing Translational Sciences and the National Institute of Neurologic Diseases and Stroke; Dystonia Medical Research Foundation Clinical Fellowship; American Parkinson Disease Association (APDA) Advanced Research Center for PD at WUSTL; Greater St. Louis Chapter of the APDA; Murphy fund; Jo Oertli fund; Schmidt Foundation for Integrative Brain Research; Geoffrey Waasdorp Pediatric Neurology Fund; and the Wilbur Smith Pediatric Neurology Fund.
Disclosure
S.A. Norris received research support from NIH T32NS007205 and U54NS116025 as well as the Dystonia Medical Research Foundation Clinical Fellowship for portions of this work. A.E. Morris received research support from NIH T32 GM07356, the Geoffery Wassdorp Pediatric Neurology Fund (University of Rochester), Wilbur Smith Pediatric Neurology fund (University of Rochester), and Schmidt Foundation for Integrative Brain Research (University of Rochester). M.C. Campbell receives NIH research support and a Veterens Affairs Department stipend and travel for grant review. M. Karimi is deceased and unable to report disclosures. A. Babatunde, R.C. Paniello, A.Z. Snyder, and S.E. Petersen report no disclosures relevant to the manuscript. J.W. Mink reports grants from Abeona Inc, consultant fees from Neurogene Inc, Amicus Inc, and is chair/DSMB for Censa Inc, J.S. Perlmutter reports grants from NIH, including U54NS116025 and NS075321; grants from American Parkinson Disease Association (including Greater St. Louis Chapter); research support from the Murphy Fund, Paula C & Rodger O Riney Fund, and Jo Oerteli Fund; and serves as the Scientific Director of the Dystonia Medical Research Foundation (unpaid). Go to Neurology.org/N for full disclosures.
References
- 1.Steeves TD, Day L, Dykeman J, Jette N, Pringsheim T. The prevalence of primary dystonia: a systematic review and meta-analysis. Mov Disord 2012;27:1789–1796. [DOI] [PubMed] [Google Scholar]
- 2.Saunders-Pullman R, Fuchs T, San Luciano M, et al. Heterogeneity in primary dystonia: lessons from THAP1, GNAL, and TOR1A in Amish-Mennonites. Mov Disord 2014;29:812–818. [DOI] [PMC free article] [PubMed] [Google Scholar]
- 3.Berman BD, Honce JM, Shelton E, Sillau SH, Nagae LM. Isolated focal dystonia phenotypes are associated with distinct patterns of altered microstructure. NeuroImage Clin 2018;19:805–812. [DOI] [PMC free article] [PubMed] [Google Scholar]
- 4.Black KJ, Snyder AZ, Mink JW, et al. Spatial reorganization of putaminal dopamine D2-like receptors in cranial and hand dystonia. PLoS One 2014;9:e88121. [DOI] [PMC free article] [PubMed] [Google Scholar]
- 5.Simonyan K, Cho H, Hamzehei Sichani A, Rubien-Thomas E, Hallett M. The direct basal ganglia pathway is hyperfunctional in focal dystonia. Brain 2017;140:3179–3190. [DOI] [PMC free article] [PubMed] [Google Scholar]
- 6.Mohammadi B, Kollewe K, Samii A, Beckmann CF, Dengler R, Munte TF. Changes in resting-state brain networks in writer's cramp. Hum Brain Mapp 2012;33:840–848. [DOI] [PMC free article] [PubMed] [Google Scholar]
- 7.Mink JW. The basal ganglia and involuntary movements: impaired inhibition of competing motor patterns. Arch Neurol 2003;60:1365–1368. [DOI] [PubMed] [Google Scholar]
- 8.Berman BD, Hallett M, Herscovitch P, Simonyan K. Striatal dopaminergic dysfunction at rest and during task performance in writer's cramp. Brain 2013;136:3645–3658. [DOI] [PMC free article] [PubMed] [Google Scholar]
- 9.Carbon M, Eidelberg D. Abnormal structure-function relationships in hereditary dystonia. Neuroscience 2009;164:220–229. [DOI] [PMC free article] [PubMed] [Google Scholar]
- 10.Perlmutter JS, Stambuk MK, Markham J, et al. Decreased [18F]spiperone binding in putamen in idiopathic focal dystonia. J Neurosci 1997;17:843–850. [DOI] [PMC free article] [PubMed] [Google Scholar]
- 11.Simonyan K, Berman BD, Herscovitch P, Hallett M. Abnormal striatal dopaminergic neurotransmission during rest and task production in spasmodic dysphonia. J Neurosci 2013;33:14705–14714. [DOI] [PMC free article] [PubMed] [Google Scholar]
- 12.Zhuang P, Li Y, Hallett M. Neuronal activity in the basal ganglia and thalamus in patients with dystonia. Clin Neurophysiol 2004;115:2542–2557. [DOI] [PubMed] [Google Scholar]
- 13.Battistella G, Termsarasab P, Ramdhani RA, Fuertinger S, Simonyan K. Isolated focal dystonia as a disorder of large-scale functional networks. Cereb Cortex 2017;27:1203–1215. [DOI] [PMC free article] [PubMed] [Google Scholar]
- 14.Delnooz CC, Pasman JW, Beckmann CF, van de Warrenburg BP. Task-free functional MRI in cervical dystonia reveals multi-network changes that partially normalize with botulinum toxin. PLoS One 2013;8:e62877. [DOI] [PMC free article] [PubMed] [Google Scholar]
- 15.Dresel C, Haslinger B, Castrop F, Wohlschlaeger AM, Ceballos-Baumann AO. Silent event-related fMRI reveals deficient motor and enhanced somatosensory activation in orofacial dystonia. Brain 2006;129:36–46. [DOI] [PubMed] [Google Scholar]
- 16.Furuya S, Uehara K, Sakamoto T, Hanakawa T. Aberrant cortical excitability reflects the loss of hand dexterity in musician's dystonia. J Physiol 2018;596:2397–2411. [DOI] [PMC free article] [PubMed] [Google Scholar]
- 17.Haslinger B, Altenmuller E, Castrop F, Zimmer C, Dresel C. Sensorimotor overactivity as a pathophysiologic trait of embouchure dystonia. Neurology 2010;74:1790–1797. [DOI] [PubMed] [Google Scholar]
- 18.Hubsch C, Roze E, Popa T, et al. Defective cerebellar control of cortical plasticity in writer's cramp. Brain 2013;136:2050–2062. [DOI] [PMC free article] [PubMed] [Google Scholar]
- 19.Jochim A, Li Y, Gora-Stahlberg G, et al. Altered functional connectivity in blepharospasm/orofacial dystonia. Brain Behav 2018;8:e00894. [DOI] [PMC free article] [PubMed] [Google Scholar]
- 20.Kadota H, Nakajima Y, Miyazaki M, et al. An fMRI study of musicians with focal dystonia during tapping tasks. J Neurol 2010;257:1092–1098. [DOI] [PubMed] [Google Scholar]
- 21.Mantel T, Meindl T, Li Y, et al. Network-specific resting-state connectivity changes in the premotor-parietal axis in writer's cramp. NeuroImage Clin 2018;17:137–144. [DOI] [PMC free article] [PubMed] [Google Scholar]
- 22.Rothkirch I, Granert O, Knutzen A, et al. Dynamic causal modeling revealed dysfunctional effective connectivity in both, the cortico-basal-ganglia and the cerebello-cortical motor network in writers' cramp. NeuroImage Clin 2018;18:149–159. [DOI] [PMC free article] [PubMed] [Google Scholar]
- 23.Suppa A, Marsili L, Giovannelli F, et al. Abnormal motor cortex excitability during linguistic tasks in adductor-type spasmodic dysphonia. Eur J Neurosci 2015;42:2051–2060. [DOI] [PubMed] [Google Scholar]
- 24.Zeuner KE, Knutzen A, Granert O, et al. Increased volume and impaired function: the role of the basal ganglia in writer's cramp. Brain Behav 2015;5:e00301. [DOI] [PMC free article] [PubMed] [Google Scholar]
- 25.Power JD, Barnes KA, Snyder AZ, Schlaggar BL, Petersen SE. Spurious but systematic correlations in functional connectivity MRI networks arise from subject motion. Neuroimage 2012;59:2142–2154. [DOI] [PMC free article] [PubMed] [Google Scholar]
- 26.Power JD, Mitra A, Laumann TO, Snyder AZ, Schlaggar BL, Petersen SE. Methods to detect, characterize, and remove motion artifact in resting state fMRI. Neuroimage 2014;84:320–341. [DOI] [PMC free article] [PubMed] [Google Scholar]
- 27.Delnooz CC, Pasman JW, Beckmann CF, van de Warrenburg BP. Altered striatal and pallidal connectivity in cervical dystonia. Brain Struct Funct 2015;220:513–523. [DOI] [PubMed] [Google Scholar]
- 28.Fuertinger S, Simonyan K. Connectome-wide phenotypical and genotypical associations in focal dystonia. J Neurosci 2017;37:7438–7449. [DOI] [PMC free article] [PubMed] [Google Scholar]
- 29.Li Z, Prudente CN, Stilla R, Sathian K, Jinnah HA, Hu X. Alterations of resting-state fMRI measurements in individuals with cervical dystonia. Hum Brain Mapp 2017;38:4098–4108. [DOI] [PMC free article] [PubMed] [Google Scholar]
- 30.Ciric R, Wolf DH, Power JD, et al. Benchmarking of participant-level confound regression strategies for the control of motion artifact in studies of functional connectivity. Neuroimage 2017;154:174–187. [DOI] [PMC free article] [PubMed] [Google Scholar]
- 31.Murphy K, Birn RM, Bandettini PA. Resting-state fMRI confounds and cleanup. Neuroimage 2013;80:349–359. [DOI] [PMC free article] [PubMed] [Google Scholar]
- 32.Gratton C, Koller JM, Shannon W, et al. Emergent functional network effects in Parkinson disease. Cereb Cortex 2019;29:1701. [DOI] [PMC free article] [PubMed] [Google Scholar]
- 33.Friston KJ, Williams S, Howard R, Frackowiak RS, Turner R. Movement-related effects in fMRI time-series. Magn Reson Med 1996;35:346–355. [DOI] [PubMed] [Google Scholar]
- 34.Gratton C, Coalson RS, Dworetsky A, et al. Removal of high frequency contamination from motion estimates in single-band fMRI saves data without biasing functional connectivity. Available at: biorxiv.org/content/biorxiv/early/2019/11/09/837161.full.pdf. Accessed October 3, 2020. [DOI] [PMC free article] [PubMed]
- 35.Fair DA, Miranda-Dominguez O, Snyder AZ, et al. Correction of respiratory artifacts in MRI head motion estimates. Neuroimage 2020;208:116400. [DOI] [PMC free article] [PubMed] [Google Scholar]
- 36.Yeo BT, Krienen FM, Sepulcre J, et al. The organization of the human cerebral cortex estimated by intrinsic functional connectivity. J Neurophysiol 2011;106:1125–1165. [DOI] [PMC free article] [PubMed] [Google Scholar]
- 37.Eklund A, Nichols TE, Knutsson H. Cluster failure: why fMRI inferences for spatial extent have inflated false-positive rates. Proc Natl Acad Sci USA 2016;113:7900–7905. [DOI] [PMC free article] [PubMed] [Google Scholar]
- 38.Hayasaka S, Nichols TE. Validating cluster size inference: random field and permutation methods. Neuroimage 2003;20:2343–2356. [DOI] [PubMed] [Google Scholar]
- 39.Seitzman BA, Gratton C, Marek S, et al. A set of functionally-defined brain regions with improved representation of the subcortex and cerebellum. Neuroimage 2019:116290. [DOI] [PMC free article] [PubMed] [Google Scholar]
- 40.La Rosa PS, Brooks TL, Deych E, et al. Gibbs distribution for statistical analysis of graphical data with a sample application to fcMRI brain images. Stat Med 2016;35:566–580. [DOI] [PubMed] [Google Scholar]
- 41.Morris A. Functional Brain Structure in Focal Embouchure Dystonia Disorders. PhD thesis: University of Rochester, NY; 2019.
- 42.Hacker CD, Laumann TO, Szrama NP, et al. Resting state network estimation in individual subjects. Neuroimage 2013;82:616–633. [DOI] [PMC free article] [PubMed] [Google Scholar]
- 43.Gordon EM, Laumann TO, Gilmore AW, et al. Precision functional mapping of individual human brains. Neuron 2017;95:791–807 e797. [DOI] [PMC free article] [PubMed] [Google Scholar]
- 44.Quartarone A, Hallett M. Emerging concepts in the physiological basis of dystonia. Mov Disord 2013;28:958–967. [DOI] [PMC free article] [PubMed] [Google Scholar]
- 45.Greene DJ, Marek S, Gordon EM, et al. Integrative and network-specific connectivity of the basal ganglia and thalamus defined in individuals. Neuron 2020;105:742–758. [DOI] [PMC free article] [PubMed] [Google Scholar]
- 46.Grefkes C, Fink GR. The functional organization of the intraparietal sulcus in humans and monkeys. J Anat 2005;207:3–17. [DOI] [PMC free article] [PubMed] [Google Scholar]
- 47.Mountcastle VB, Lynch JC, Georgopoulos A, Sakata H, Acuna C. Posterior parietal association cortex of the monkey: command functions for operations within extrapersonal space. J Neurophysiol 1975;38:871–908. [DOI] [PubMed] [Google Scholar]
- 48.Porcacchia P, Palomar FJ, Caceres-Redondo MT, et al. Parieto-motor cortical dysfunction in primary cervical dystonia. Brain Stimulation 2014;7:650–657. [DOI] [PubMed] [Google Scholar]
- 49.Naumann M, Magyar-Lehmann S, Reiners K, Erbguth F, Leenders KL. Sensory tricks in cervical dystonia: perceptual dysbalance of parietal cortex modulates frontal motor programming. Ann Neurol 2000;47:322–328. [PubMed] [Google Scholar]
- 50.Siegel JS, Mitra A, Laumann TO, et al. Data quality influences observed links between functional connectivity and behavior. Cereb Cortex 2017;27:4492–4502. [DOI] [PMC free article] [PubMed] [Google Scholar]
Associated Data
This section collects any data citations, data availability statements, or supplementary materials included in this article.
Data Availability Statement
Anonymized data will be shared by request from any qualified investigator.


