Abstract
Objective
To examine the relationship between scalp EEG biomarkers of hyperexcitability in Alzheimer disease (AD) and to determine how these electric biomarkers relate to the clinical expression of seizures in AD.
Methods
In this cross-sectional study, we performed 24-hour ambulatory scalp EEGs on 43 cognitively normal elderly healthy controls (HC), 41 participants with early-stage AD with no history or risk factors for epilepsy (AD-NoEp), and 15 participants with early-stage AD with late-onset epilepsy related to AD (AD-Ep). Two epileptologists blinded to diagnosis visually reviewed all EEGs and annotated all potential epileptiform abnormalities. A panel of 9 epileptologists blinded to diagnosis was then surveyed to generate a consensus interpretation of epileptiform abnormalities in each EEG.
Results
Epileptiform abnormalities were seen in 53% of AD-Ep, 22% of AD-NoEp, and 4.7% of HC. Specific features of epileptiform discharges, including high frequency, robust morphology, right temporal location, and occurrence during wakefulness and REM, were associated with clinical seizures in AD. Multiple EEG biomarkers concordantly demonstrated a pattern of left temporal lobe hyperexcitability in early stages of AD, whereas clinical seizures in AD were often associated with bitemporal hyperexcitability. Frequent small sharp spikes were specifically associated with epileptiform EEGs and thus identified as a potential biomarker of hyperexcitability in AD.
Conclusion
Epileptiform abnormalities are common in AD but not all equivalent. Specific features of epileptiform discharges are associated with clinical seizures in AD. Given the difficulty recognizing clinical seizures in AD, these EEG features could provide guidance on which patients with AD are at high risk for clinical seizures.
Neuronal hyperexcitability has emerged as an important electric abnormality that could contribute not only to memory failure in early stages of Alzheimer disease (AD) but also to disease progression.1–5 Seizures are reported in 10% to 22% of patients with AD6 and may be a presenting symptom of the disease.3,7,8 In patients with AD without seizures, subclinical epileptiform abnormalities were identified in 21% to 38% with the use of long-term scalp EEG recordings9,10 and may be associated with accelerated cognitive decline.9
There is increasing interest in developing novel therapeutics that target network hyperexcitability for symptomatic relief or disease modification in AD.11–13 A major barrier to progress is our limited understanding of biomarkers of hyperexcitability in AD and their clinical relevance to AD pathophysiology and seizures. The best-known biomarker of hyperexcitability in humans is the epileptiform discharge. There is growing evidence for mesial temporal lobe (mTL) hyperexcitability in AD,12,14–16 but most mTL epileptiform discharges cannot be seen on scalp EEG.16–18 EEG waveforms known as temporal intermittent rhythmic delta activity (TIRDA)19–22 and small sharp spikes (SSS)23,24 have been identified in patients with epilepsy as potential scalp EEG biomarkers of mTL epileptogenicity but have not yet been evaluated in AD.
Here, we performed a comprehensive analysis of scalp EEG biomarkers of hyperexcitability in AD to examine the relationship between these biomarkers and to understand how these electric manifestations of hyperexcitability relate to the expression of clinical seizures in AD.
Methods
Standard protocol approvals, registrations, and patient consents
All prospective and retrospective study procedures were performed under protocols approved by the Institutional Review boards at our centers. Written informed consent was obtained from all prospectively recruited research participants.
Study population
Ambulatory EEG recordings were prospectively acquired from research participants between 2010 and 2019 and retrospectively collected from patients who underwent ambulatory EEG for clinical purposes between 2014 and 2019. Study size was guided by prior ambulatory EEG studies on epileptiform abnormalities in AD.9,10 Figure e-1 (data available from Dryad, doi.org/10.5061/dryad.8gtht76kc) shows the recruitment flowchart.
Participants were 50 to 90 years old and classified into 3 groups: cognitively normal healthy controls (HC) with no history/risk factors for epilepsy, participants with probable AD with no history/risk factors for epilepsy (AD-NoEp), or participants with probable AD with epilepsy related to AD (AD-Ep).
All HC were research participants with neuropsychiatric test scores within the normal range and Clinical Dementia Rating global score of 0. All participants with AD had Clinical Dementia Rating global scores of 0.5 or 1 at the time of EEG. Exclusion criteria for HC and AD-NoEp were (1) history of epilepsy or ongoing spells suspicious for seizures; (2) history of stroke, traumatic brain injury with loss of consciousness, meningitis/encephalitis, brain tumor, or brain surgery; and (3) current use of benzodiazepines, seizure medications, sleep aids, or bupropion. Participants with AD-Ep developed epilepsy from 4 years before to 3 years after the onset of cognitive decline; the etiology of epilepsy was presumed to be AD, given no structural cortical lesions or convincing alternative etiologies. Diagnosis of epilepsy was based on International League Against Epilepsy criteria25; age at onset was defined as age at first seizure.
One hundred percent of HC and 68% of those with AD-NoEp were research participants who underwent prospective research ambulatory EEGs. Research participants were consecutively recruited from the Massachusetts Alzheimer's Disease Research Center, the Massachusetts General Hospital Memory Disorders Unit, and Brigham and Women's/South Shore Hospital Neurology and Epilepsy Clinics. Participants recruited from the Massachusetts Alzheimer's Disease Research Center either were HC or had a consensus diagnosis of amnestic mild cognitive impairment or mild dementia with a primary etiologic diagnosis of AD. Participants recruited from clinics had probable AD according to the National Institute on Aging–Alzheimer's Association diagnostic guidelines.26,27
Thirty-two percent of participants with AD-NoEp and 100% of those with AD-Ep were patients who previously underwent ambulatory EEGs for clinical purposes (workup of cognitive decline for AD-NoEp; workup of seizures for AD-Ep). Their clinical EEG data were obtained retrospectively. We included all patients who underwent clinical ambulatory EEGs ≥24 hours at Massachusetts General Hospital Memory Disorders Unit and Brigham and Women's/South Shore Hospital Neurology and Epilepsy Clinics between 2014 and 2019 and met the inclusion/exclusion criteria above.
EEG recordings
Scalp electrodes were placed using the International 10–20 system with anterior temporal electrodes (T1, T2). Twenty-four–hour ambulatory EEG recordings were acquired with XLTEK TREX hardware (Natus Medical Inc, Pleasanton, CA), sampling at 200 Hz.
EEG review and annotation
EEGs were visually reviewed and annotated by 2 board-certified epileptologists (A.D.L., R.A.S.) blinded to diagnosis using a graphic user interface created in MATLAB (MathWorks, Natick, MA). Reviewers could adjust EEG amplitude and time scale, add/remove filters (low-pass filter at 70 Hz, high-pass filter at 1 Hz, and notch filter at 60 Hz), hide bad channels, and switch between montages (longitudinal bipolar with coronal ring, common referential, average referential, and transverse). The epileptologists independently marked all seizures, spikes, sharp waves, TIRDA, sharp transients of uncertain significance, and SSS. Examples of focal and diffuse slowing were also marked. After independent review, annotations were reviewed jointly to create an initial set of annotations.
Consensus determination of epileptiform abnormalities
To generate a robust consensus for which participants' EEGs showed epileptiform abnormalities, we polled a panel of 9 actively practicing, fellowship-trained academic epileptologists. To reduce the burden of review, an initial EEG reviewer (A.D.L) blinded to diagnosis selected examples of potential epileptiform abnormalities for the panel to review. All epileptiform discharges were selected for review, with a maximum of 7 per EEG (in which case, 7 representative examples were chosen). The same was done for examples of TIRDA. Many EEGs did not have 7 epileptiform discharges but had annotations for sharp transients of uncertain significance. In these cases, A.D.L. selected the most epileptiform-appearing examples of sharp transients, with the total number of epileptiform discharges and sharp transients capped at 7 per EEG. One EEG had 9 electrographic seizures; 2 representative seizures were selected for review. A.D.L. did not participate in the expert panel. R.A.S. participated in the panel and remained blinded for the entire procedure.
Each panelist blinded to diagnosis independently reviewed examples of potential epileptiform abnormalities (epileptiform discharges, TIRDA, and seizures) using a web-based interface. Each example was shown in 2 montages (longitudinal bipolar with coronal ring, and common or average referential). For each example of a potential epileptiform discharge, TIRDA, or seizure, reviewers were asked to rate their agreement with this designation. Their choices were: (1) strongly agree, (2) agree, (3) neither agree nor disagree, (4) disagree, or (5) strongly disagree.
On the basis of the panel responses, individual examples of epileptiform discharges, TIRDA, and seizures were classified as follows. All examples for which ≥5 reviewers chose strongly disagree or disagree were classified as not epileptiform and were excluded from further analysis. The remaining examples were categorized as follows: definite (≥7 reviewers chose strongly agree or agree), probable (5–6 reviewers chose strongly agree or agree), and equivocal (<5 reviewers chose strongly agree or agree and <5 reviewers chose strongly disagree or disagree) epileptiform abnormalities.
Epileptiform abnormalities for each participant were displayed together to recapitulate clinical EEG interpretation. After reviewing all examples from a participant, the panel was asked, “Given that all images on this page come from the same patient, how would you interpret this patient's EEG findings overall?” Response options were as follows: (1) shows a definite epileptogenic focus; (2) shows an abnormality of clinical relevance, more likely epileptiform than not; (3) shows an abnormality of clinical relevance, equivocal as to whether it is epileptiform or not; (4) shows an abnormality of clinical relevance, unlikely to be epileptiform; or (5) no abnormality present.
Expert consensus for an overall epileptiform EEG was defined as having ≥6 reviewers rating it as either “shows a definite epileptogenic focus” or “shows an abnormality of clinical relevance, more likely epileptiform than not.” We calculated a confidence index (CI) for expert consensus that was based on a weighted average across all responses, with weightings set as +5 (shows a definite epileptogenic focus), +3 (shows an abnormality of clinical relevance, more likely epileptiform than not), 0 (shows an abnormality of clinical relevance, equivocal as to whether it is epileptiform or not), −3 (shows an abnormality of clinical relevance, unlikely to be epileptiform), and −5 (no abnormality present). The CI ranges from −5 to +5, with +5 indicating the highest confidence that an EEG is epileptiform.
Spatiotemporal and morphologic analysis of epileptiform discharges
Epileptiform discharge location was determined visually (by A.D.L., R.A.S.) on the basis of the location of the voltage maximum on bipolar, average, and common referential montages. Epileptiform discharge morphologic analysis was performed on the average referential channel with voltage maximum with custom software described previously.28 For each epileptiform discharge, 5 fiducial points were assigned to mark the start, peak, trough, slow-wave peak, and end. Using these fiducial points, we extracted 22 morphologic features related to voltage, duration, slope, and area (data available from Dryad, table e-1, doi.org/10.5061/dryad.8gtht76kc). Equivocal and probable epileptiform discharges were grouped and compared to definite epileptiform discharges. Sleep staging was performed with EEG data according to the American Academy of Sleep Medicine scoring manual.
Statistical analysis
Statistical testing was performed in MATLAB (MathWorks). Population statistics are presented as mean ± SD. We used Fisher exact tests for comparison of 2-sample proportions, Cochrane-Armitage tests for trend in proportions across groups, Mann-Whitney U tests for comparison of independent samples, and the Cuzick test for assessment of trend across groups. Statistical tests were 2 tailed, with α = 0.05 used to determine significance. Odds ratios (ORs) are shown with 95% CIs. For spike morphologic analysis, multiple-comparisons correction used the positive false discovery rate with q < 0.05 to determine significance.29
Data availability
Data that support the findings of this study are available from the corresponding author on reasonable request.
Results
Study demographics
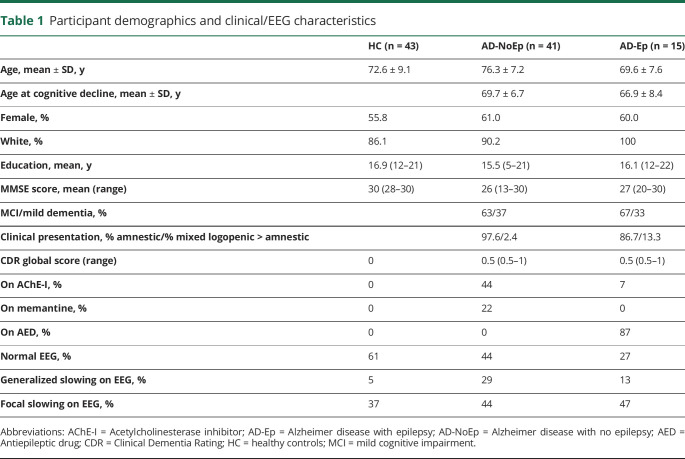
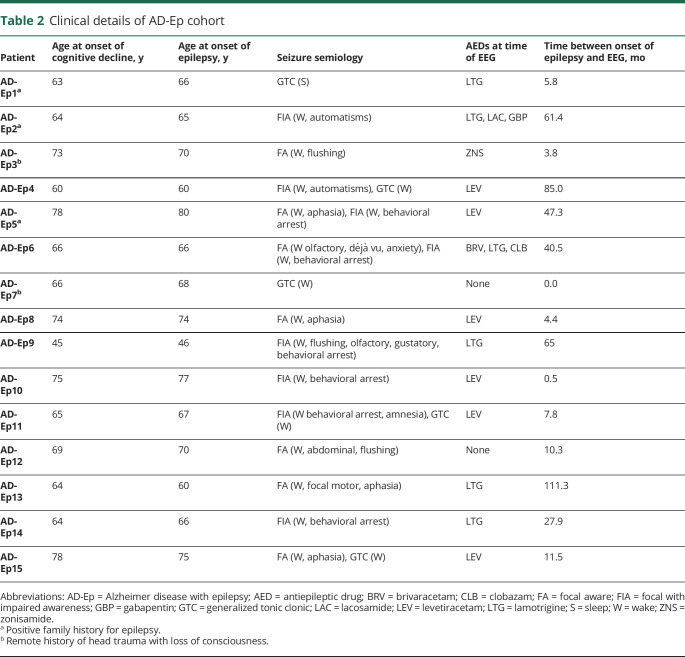
Between 2010 and 2019, we prospectively performed research ambulatory EEGs on 43 HC and 28 participants with AD-NoEp and obtained retrospective clinical ambulatory EEG data from an additional 13 patients with AD-NoEp and 15 with AD-Ep. Tables 1 and 2 show the clinical characteristics of our study population. Average age at onset of cognitive decline for participants with AD-NoEp was 69.7 ± 6.7 years and for those with AD-Ep was 66.9 ± 8.4 years. For participants with AD-Ep, the average age at epilepsy onset was 67.3 ± 8.2 years. Among those with AD-Ep, 20% had a family history of epilepsy, and 13% had a remote history of head trauma with loss of consciousness. Table e-2 (data available from Dryad, doi.org/10.5061/dryad.8gtht76kc) shows the available biomarker data for all study participants.
Table 1.
Participant demographics and clinical/EEG characteristics
Table 2.
Clinical details of AD-Ep cohort
Epileptiform abnormalities are common in AD
Across the HC, AD-NoEp, and AD-Ep groups, there was a gradient of increasing frequency of overall epileptiform EEGs and increasing CI in the epileptiform nature of these EEGs (figure 1). On the basis of expert consensus, 4.7% of HC, 22% of participants with AD-NoEp, and 53.3% of those with AD-Ep had an overall epileptiform EEG, an increasing trend that was statistically significant (p < 0.001). The proportion of epileptiform EEGs was significantly higher for those with AD-NoEp compared to HC (p = 0.024, OR 5.77, 95% CI 1.16–28.57) and for those with AD-Ep compared to those with AD-NoEp (p = 0.046, OR 4.06, 95% CI 1.16–14.26).
Figure 1. Epileptiform abnormalities in AD.
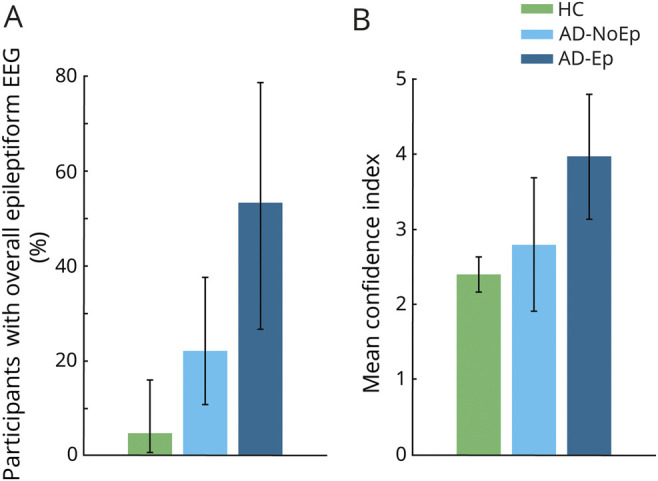
(A) Percentage of participants with an overall epileptiform EEG based on expert consensus. Error bars show the 95% confidence interval for the population proportion. (B) Mean confidence index for rating overall epileptiform EEGs in each group. Error bars show the 95% confidence interval of the mean. AD = Alzheimer disease; AD-Ep = AD with epilepsy; AD-NoEp = AD with no epilepsy; HC = healthy controls.
The CI associated with designating EEGs as overall epileptiform also showed an increasing trend across groups, with HC being lowest (2.44 ± 0.16), the AD-NoEp group being intermediate (2.79 ± 1.4), and the AD-Ep group being highest (3.97 ± 1.2) (p = 0.059). Of participants with AD-Ep, 40% had an epileptiform EEG with a CI ≥3 compared to only 9.8% of those with AD-NoEp (p = 0.016, OR 6.17, 95% CI 1.43–26.55). Thus, while epileptiform abnormalities were common in AD-NoEp, there was a clear difference in the robustness of these abnormalities between AD-NoEp and AD-Ep. We next investigated which EEG features accounted for this difference.
Robust epileptiform discharge morphology is associated with clinical seizures in AD
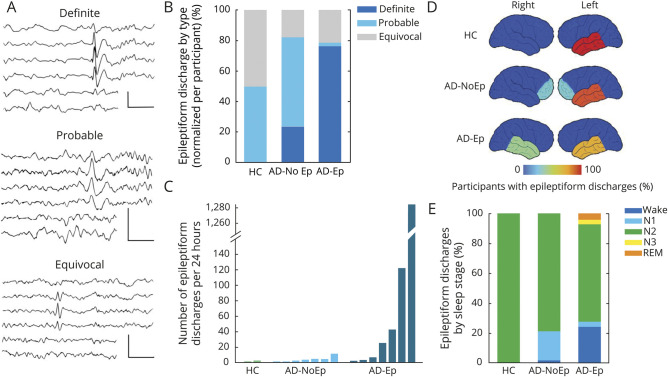
Epileptiform discharges were present in 4.7% of HC, 17% of participants with AD-NoEp, and 46.7% of those with AD-Ep, an increasing trend that was statistically significant (p < 0.001). We first assessed whether the morphology of epileptiform discharges differed between AD-Ep and AD-NoEp. Figure 2A shows representative images of epileptiform discharges classified as definite, probable, and equivocal. Definite epileptiform discharges had more robust morphologic features than probable or equivocal epileptiform discharges, including significantly larger trough voltage, peak-to-trough voltage, and slope of falling half-wave of peak (data available from Dryad, table e-1, doi.org/10.5061/dryad.8gtht76kc). Eighty-eight percent of all epileptiform discharges in AD-Ep were categorized as definite compared to 41% in AD-NoEp (p < 0.001, OR 10.8, 95% CI 2.82–41.6) and 0% in HC (p < 0.001). To ensure that these results were not biased by participants with frequent epileptiform discharges, we calculated the relative distribution of epileptiform discharge type for each participant and averaged these distributions across participants (figure 2B). The results were similar, with 76.2% of epileptiform discharges in AD-Ep classified as definite compared to 23.8% in AD-NoEp (p = 0.05).
Figure 2. Characterization of epileptiform discharges in AD.
(A) Representative examples of definite, probable, and equivocal epileptiform discharges arising from the left temporal region in AD-Ep1, AD-NoEp7, and HC1, respectively. EEG channels (top to bottom): Fp1-ave, F7-ave, T1-ave, T3-ave, T5-ave, and O1-ave. Calibration bars: 100 µV, 500 milliseconds. (B) Averaged distribution of epileptiform discharge type, normalized to each participant. (C) Frequency of epileptiform discharges across groups. Each bar represents 1 participant with at least 1 epileptiform discharge on 24-hour EEG. Bars are in order of increasing frequency of epileptiform discharges within each group. (D) Schematic representation of epileptiform discharge location. Color bar represents the percentage of participants with epileptiform discharges with a specific localization. Numbers add up to >100% in AD-NoEp and AD-Ep because some participants had epileptiform discharges in >1 location. (E) Distribution of epileptiform discharges by sleep stage, normalized to each participant. AD = Alzheimer disease; AD-Ep = AD with epilepsy; AD-NoEp = AD with no epilepsy; HC = healthy controls.
Frequency of epileptiform discharges correlates with expression of clinical seizures in AD
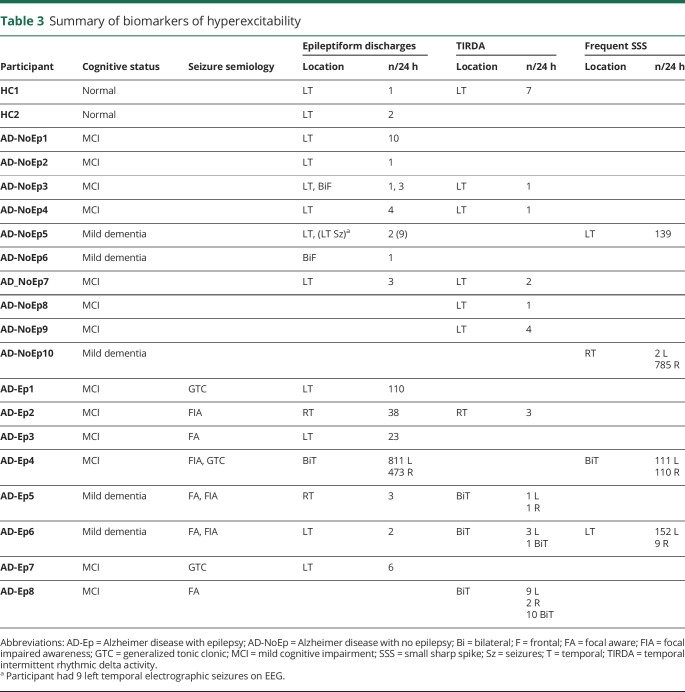
Figure 2C and table 3 show the number of epileptiform discharges in each 24-hour EEG recording for participants with an overall epileptiform EEG. Epileptiform discharges were sparse in HC and participants with AD-NoEp, with a median frequency of 1.5 and 3 per 24 hours, respectively. In contrast, epileptiform discharges in participants with AD-Ep occurred with a median frequency of 23 per 24 hours. Epileptiform discharge frequency differed between those with AD-Ep and AD-NoEp (p = 0.05) and between those with AD-Ep and HC (p = 0.05) but not between those with AD-NoEp and HC (p = 0.37). Participants with AD-Ep with high frequencies of epileptiform discharges were more likely to have generalized convulsions, but not all participants with generalized convulsions had high frequencies of epileptiform discharges.
Table 3.
Summary of biomarkers of hyperexcitability
Right temporal location of epileptiform discharges is associated with clinical seizures in AD
We next assessed whether the location of epileptiform discharges differed between groups (figure 2D and table 3). In HC, epileptiform discharges were exclusively left temporal. In AD-NoEp, epileptiform discharges were primarily left temporal (85.7% of participants) but also bifrontal (28.6% of participants). One participant had independent left temporal and bifrontal epileptiform discharges. No HC or participants with AD-NoEp had right temporal epileptiform discharges. In contrast, in those with AD-Ep, epileptiform discharges were seen in both the left and right temporal regions (71.4% and 42.9% of participants with epileptiform discharges, respectively). One participant had independent left and right temporal epileptiform discharges.
Epileptiform discharges during awake and REM states are associated with clinical seizures in AD
In all groups, epileptiform discharges occurred most frequently during N2 sleep (figure 2E). We assessed the frequency of epileptiform discharges occurring during awake and REM states, which are the least permissive states for expression of epileptiform discharges in patients with focal epilepsy.30–32 Epileptiform discharges were rare during awake and REM states in HC and those with AD-NoEp (0% and 2.4%, respectively) but occurred significantly more often in these states in participants with AD-Ep (28.7%) (p = 0.005).
Predicting clinical seizure risk in AD from epileptiform discharge characteristics
Given the differences in epileptiform discharge characteristics between AD-NoEp and AD-Ep, we examined the utility of specific features of epileptiform discharges in distinguishing which participants with AD had clinical seizures. High frequency (>10 per 24 hours) and right temporal location of epileptiform discharges each had 100% specificity for predicting clinical seizures, with sensitivities of 57% and 43%, respectively. Occurrence during awake/REM states had good specificity (85.7%) and sensitivity (85.7%) for predicting clinical seizures. Dual criteria of either high frequency or right temporal location yielded 100% specificity and 71.4% sensitivity for predicting clinical seizures in our study population. We applied these dual criteria to a previously published population of 7 participants with AD-NoEp with epileptiform discharges9 and obtained a specificity of 71.4% (2 of 7 participants had spike rates >10 per 24 hours, and none had right temporal epileptiform discharges).
Relationship among TIRDA, epileptiform discharges, and clinical seizures in AD
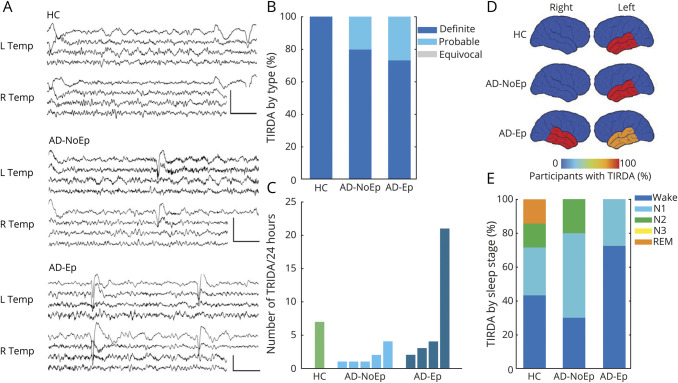
TIRDA is a scalp EEG biomarker previously described in patients with temporal lobe epilepsy that has a strong association with mTL epilepsy.19–22 Given the significance of mTL hyperexcitability in AD, we next evaluated the relationship among TIRDA, epileptiform discharges, and clinical seizures in AD. Figure 3A shows representative examples of TIRDA, and table 3 gives additional details. TIRDA was seen in 2.3% of HC, 12.2% of participants with AD-NoEp, and 26.7% of those with AD-Ep; this increasing trend was statistically significant (p = 0.006). Notably, TIRDA was diagnosed with higher confidence compared to epileptiform discharges, particularly for HC and participants with AD-NoEp. One hundred percent and 80% of all TIRDA was classified as definite for HC and those with AD-NoEp, respectively (figure 3B), compared to 0% and 23.8% of epileptiform discharges classified as definite in the same groups (figure 2B). Across all participants, the presence of TIRDA (definite, probable, or equivocal) had a 83.3% positive predictive value for determining whether a participant's EEG was classified as overall epileptiform (10 of 12 participants with TIRDA had an overall epileptiform EEG). In comparison, epileptiform discharges (definite, probable, or equivocal) had a positive predictive value of 61.5% (16 of 26 participants with epileptiform discharges had an overall epileptiform EEG).
Figure 3. Characterization of TIRDA as a scalp biomarker of mesial temporal lobe hyperexcitability in AD.
(A) Representative examples of definite TIRDA. Top: Left TIRDA in HC1. Middle: Left TIRDA in AD-NoEp8. Bottom: Right TIRDA in AD-Ep2. EEG channels (top to bottom): L Temp (Fp1–F7, F7–T3, T3–T5, T5–O1) and R Temp (Fp2–F8, F8–T4, T4–T6, T6–O2). Calibration bars: 100 µV, 1 second. (B) Averaged distribution of TIRDA type normalized to each participant. (C) Frequency of TIRDA occurrence across groups. Each bar represents 1 participant with at least 1 example of TIRDA on 24-hour EEG. Bars are in order of increasing TIRDA occurrence within each group. (D) Schematic representation of TIRDA lateralization. Color bar represents the percentage of participants with TIRDA with a given lateralization. Numbers add up to >100% in AD-Ep because 3 participants had bitemporal TIRDA. (E) Distribution of TIRDA by sleep stage, normalized to each participant. AD = Alzheimer disease; AD-Ep = AD with epilepsy; AD-NoEp = AD with no epilepsy; HC = healthy controls; Temp = temporal; TIRDA = temporal intermittent rhythmic delta activity.
TIRDA occurred at low frequencies in most participants (figure 3C). All participants with AD-Ep with TIRDA had focal seizures; none had generalized convulsions (table 3). TIRDA in HC and participants with AD-NoEp was exclusively left temporal, while TIRDA was predominantly bitemporal in those with AD-Ep (figure 3D). When TIRDA was present with epileptiform discharges in a given participant, the lateralization of TIRDA matched that of epileptiform discharges (table 3). Like epileptiform discharges, TIRDA was more likely to occur during wakefulness in participants with AD-Ep (72.5%) compared to HC and those with AD-NoEp (42.8% and 30%, respectively) (figure 3E).
Frequent SSS are a potential epileptiform variant in AD
SSS, also known as benign epileptiform transients of sleep, are low-amplitude (<50 µV), short-duration (<50 millisecond) spikes that occur during drowsiness and light sleep and that are typically seen independently over the bitemporal regions, although can also occur unilaterally. SSS are considered a normal EEG variant (no association with epilepsy), although recent studies have shown that in some cases SSS-like waveforms can be a scalp EEG correlate of mTL epileptiform discharges.16,24,33
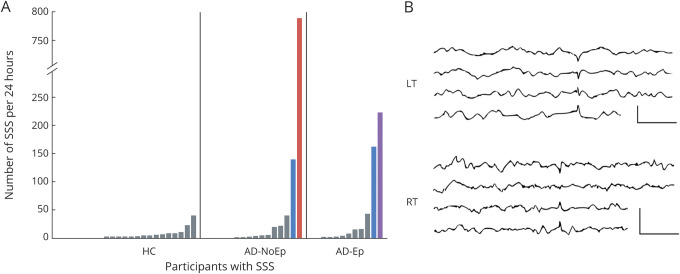
We evaluated the range of expression of waveforms meeting morphologic and spatiotemporal criteria for SSS. Figure 4A shows the number of SSS-like waveforms present in 24 hours for all study participants. In HC, the number of SSS-like waveforms over 24 hours ranged from 0 to 40, and all HC with ≥5 examples had bilateral representation (gray bars). Four participants with AD were clear outliers from this distribution (figure 4A, colored bars).
Figure 4. Frequent SSS-like waveforms are a potential epileptiform abnormality in AD.
(A) Number of SSS-like waveforms per 24 hours for all participants with at least 1 example. Each bar represents 1 participant. Bars are organized by increasing number of SSS-like waveforms within each group. Gray bars indicate participants with either ≤5 SSS-like waveforms or >5 SSS-like waveforms with bilateral representation over a 24-hour EEG. Blue bar indicates >5 SSS-like waveforms with >90% left temporal. Red bar indicates >5 SSS-like waveforms with >90% right temporal. Purple bar indicates frequent independent bitemporal SSS-like waveforms. (B) Representative examples of SSS-like waveforms. Top: Left temporal example from AD-NoEp5. Bottom: Right temporal example from AD-NoEp10. EEG channels (top to bottom): LT (Fp1–F7, F7–T3, T3–T5, T5–O1) and RT (Fp2–F8, F8–T3, T3–T5, T5–O1). Calibration bars: 50 µV, 500 milliseconds. AD = Alzheimer disease; AD-Ep = probable AD with epilepsy related to AD; AD-NoEp = probable AD with no history/risk factors for epilepsy; HC = healthy controls; LT = left temporal; RT = right temporal; SSS = small sharp spike.
AD-NoEp5 had 139 SSS-like waveforms, all left temporal (figure 4A, AD-NoEp, blue bar; figure 4B, top). This participant had an overall epileptiform EEG (CI 4.3), with 9 subclinical left temporal seizures and 2 left temporal epileptiform discharges (neither classified as definite). AD-Ep6 had 161 SSS-like waveforms, 94% left temporal (figure 4A, AD-Ep, blue bar). This participant had an overall epileptiform EEG (CI 1.8), with left temporal epileptiform discharges and left temporal and bitemporal TIRDA. AD-Ep4 had 221 SSS-like waveforms, divided equally between left and right temporal regions (figure 4A, purple bar). This participant had an overall epileptiform EEG (CI 4.8) with abundant epileptiform discharges arising independently from the left and right temporal regions.
AD-NoEp10 had 787 SSS-like waveforms in 24 hours, with 99% right temporal (figure 4A, red bar; figure 4B, bottom). The expert panel initially reviewed 6 examples of the SSS-like waveforms from AD-NoEp8 and classified all 6 as not epileptiform. The panel was then asked, “If there were >500 examples of these ‘spikes’ in this patient's 24-hour EEG recording, all of which were right temporal in location and occurred during sleep, how would you classify these ‘spikes’?” With this contextual information, the panel reclassified the EEG as overall epileptiform, with a CI of 1.3.
Discussion
This study provides a comprehensive analysis of epileptiform abnormalities in early stages of AD. Using 24-hour ambulatory EEGs, we examined multiple features of epileptiform discharges, incorporating additional EEG biomarkers of mTL hyperexcitability and integrating this with information about clinical seizures.
Our study examined the relationship between electric and clinical expression of hyperexcitability in AD. We found that specific features of epileptiform discharges, including robust morphology, higher frequency, occurrence during wakefulness and REM, and right temporal location, were associated with clinical seizures. Given the difficulty in recognizing clinical seizures in AD,3,34 these EEG features could potentially be used for seizure risk assessment in AD, although larger validation studies are needed. Our findings demonstrate that not all forms of hyperexcitability in AD are equivalent and that epileptiform discharges should not be viewed as a binary biomarker of hyperexcitability but rather as existing on a spectrum of hyperexcitability.
We found evidence of temporal lobe and bifrontal hyperexcitability in early stages of AD. In AD-NoEp, hyperexcitability was predominantly left temporal and bifrontal, a finding corroborated by a previous study.9 The asymmetry in temporal lobe hyperexcitability was concordant across multiple biomarkers, including epileptiform discharges, electrographic seizures, and TIRDA. Given that AD pathology is generally assumed to be symmetric, the finding of asymmetric hyperexcitability in 20% of AD-NoEp is unexpected. Because studies in animal AD models have established a direct link between neuronal hyperactivity and propagation of amyloid and tau pathology,35–38 we hypothesize that the asymmetry in temporal lobe hyperexcitability could be related to an asymmetric cascade of AD pathology in these participants.
In contrast, participants with AD-Ep had left and/or right temporal epileptiform discharges and predominantly bitemporal TIRDA. This might suggest that patients with AD with widespread network disturbances are more likely develop clinical seizures. However, because 27% of those with AD-Ep had only unitemporal epileptiform abnormalities and 47% had no epileptiform abnormalities on scalp EEG, additional features likely play a role in the development of clinical seizures.
An interesting observation was that epileptiform abnormalities during wakefulness were more common in AD-Ep compared to AD-NoEp. One interpretation is that AD-Ep have a more severe hyperexcitability phenotype, allowing epileptiform abnormalities to be expressed in the “less permissive” awake state. This is consistent with our finding that epileptiform discharges in AD-Ep were also more frequent and morphologically robust than in AD-NoEp. An alternative interpretation is that patients with AD with epileptiform abnormalities during wakefulness are more likely to have seizures during wakefulness, which are more likely to be recognized clinically. Similarly, patients with AD-NoEp with epileptiform abnormalities during sleep might have nocturnal seizures that largely go unrecognized. We captured subclinical seizures during sleep in 1 participant with AD-NoEp (AD-NoEp5). The prevalence with which nocturnal seizures occur in AD is unknown but likely higher than observed here in that our EEGs sampled only 24 hours.
Our study examined scalp EEG biomarkers of mTL hyperexcitability in AD, including TIRDA and frequent SSS. While the frequency of TIRDA was lower than that of epileptiform discharges, TIRDA was diagnosed with higher confidence, and its presence had a 83% positive predictive value for whether an EEG was considered overall epileptiform. Thus, TIRDA should be incorporated into future studies of hyperexcitability in AD.
SSS have long been considered a normal EEG variant with no association with epilepsy. However, the characterization of SSS as benign was based on routine scalp EEGs with limited sleep data in a younger population with few elderly participants.39 Here, we evaluated the normal range of the expression of SSS-like waveforms in a healthy elderly control population using 24-hour EEGs, with detailed analysis of rate and lateralization. On the basis of these normative data and corroborative epileptiform features on EEG, we propose that the frequent appearance (>100 in 24 hours) of SSS-like waveforms, especially when unilateral, should raise suspicion for mTL hyperexcitability in AD. We hypothesize that these frequent and lateralized waveforms, which otherwise share the same morphology as SSS and would likely be classified as SSS by most EEG readers, are physiologically distinct from benign SSS. Rather, they likely represent a surface correlate of mesial temporal epileptiform discharges.24
A unique strength of our study is the use of a blinded, 9-expert panel to establish a consensus interpretation of EEG abnormalities. Prior EEG studies in AD used only 1 or 2 blinded reviewers to interpret the EEG and treated the diagnosis of epileptiform discharges as a binary decision.9,10 It is well known that the decision of what constitutes an epileptiform discharge is not always clear, and considerable variation exists among experts in interpreting epileptiform abnormalities.28,40,41 Here, crowd-sourcing opinions from a large pool of experts resulted in a consensus opinion that correlated with objective morphologic features on EEG.
Our study has several limitations. First, while our study is comparable in size to prior long-term EEG studies in AD9,10 and the only study to combine participants with AD with and without clinical seizures with healthy elderly controls under the same analytic framework, it remains limited in the numbers of participants. Second, some of our data were obtained retrospectively from clinical studies. These clinical studies did not bias our results toward more epileptiform abnormalities, however. Among AD-NoEp, only 8% of clinical EEGs had epileptiform abnormalities compared to 29% of research EEGs. Third, because our study took place at urban academic centers, our study population may not represent the general population. Our participants were primarily White and highly educated. Twenty-four percent of participants with AD-NoEp and 40% of those with AD-Ep had early-onset AD, although the latter is consistent with the finding that seizures are associated with an earlier age at onset of cognitive decline in AD.3,42–44 Future studies should examine electric biomarkers in an AD population with more racial and socioeconomic diversity. Fourth, many participants did not have biomarker data to confirm the diagnosis of AD. We also could not rule out the possibility that some HC might have preclinical AD. If AD pathology drives hyperexcitability, we would expect the magnitude of results reported here to be falsely decreased by this diagnostic impurity; i.e., we are reporting fewer epileptiform abnormalities in AD and more epileptiform abnormalities in HC than expected from diagnostically pure cohorts. Fifth, most participants with AD-Ep were taking anticonvulsants. If anything, anticonvulsants would decrease the frequency and morphologic robustness of epileptiform discharges45,46 but should not affect their location. Sixth, while we focused on the relationship between electric and clinical hyperexcitability in AD, we did not address whether these abnormalities are related to cognitive function or clinical course. The clinical significance of the epileptiform abnormalities found in 1 in 5 patients with early-stage AD remains unclear. It has long been recognized that epileptiform activity can have detrimental effects on cognition,47–49 and the presence of epileptiform discharges was associated with a faster rate of cognitive decline in a small study in a population with early-onset AD.9 Larger studies are needed to determine whether epileptiform abnormalities can predict which patients with AD are at risk for seizures (clinical, subclinical, or silent16) or for rapid cognitive decline.9 It also remains unknown whether treatment with antiseizure medications could effectively alter the clinical course or provide symptomatic relief in AD. Given these clinical ambiguities, we do not recommend ambulatory EEG as a routine screening tool in early-stage AD at this time but reserve this for patients with AD presenting with subtle symptoms concerning for seizures or with an unusually rapid cognitive decline. Finally, this was a cross-sectional study, and how and when biomarkers of hyperexcitability arise in relation to the AD pathophysiologic cascade and emergence of clinical seizures is unknown. Longitudinal EEG studies are needed to better define this electroclinical cascade of hyperexcitability in AD and its relationship with cognition and clinical course.
Nevertheless, this study demonstrates the frequency and asymmetry of epileptiform abnormalities in the early stages of AD and details an important relationship between electric and clinical manifestations of hyperexcitability in AD. While the links between this electroclinical spectrum of hyperexcitability and disease course remain to be elucidated, it is clear that this relationship needs to be understood as we work toward novel and more effective means of diagnosing, prognosticating, and altering the course of AD.
Acknowledgment
The authors thank the research participants for their time and generosity; Yangling Chou for administrative support; Anand Viswanathan for providing biomarker data; Douglas Maus for providing blinded EEG interpretation and thoughtful discussion; and Lori Chibnik for statistical support.
Glossary
- AD
Alzheimer disease
- AD-Ep
AD with epilepsy
- AD-NoEp
AD with no epilepsy
- CI
confidence index
- mTL
mesial temporal lobe
- 95% CI
95% confidence interval
- OR
odds ratio
- SSS
small sharp spikes
- TIRDA
temporal intermittent rhythmic delta activity
Appendix. Authors
Footnotes
CME Course: NPub.org/cmelist
Study funding
Research performed through the Massachusetts Alzheimer's Disease Research Center and reported in this publication was supported by NIH National Institute on Aging (P30 AG062421). A.D. Lam was supported by NIH National Institute of Neurological Disorders and Stroke (K23NS101037, R25NS065743) and the American Academy of Neurology Institute. R.A. Sarkis was supported by the AJ Trustey Epilepsy Research Endowed Fund. J. Jing was supported by Sage Therapeutics. M.B. Westover was supported by NIH National Institute of Neurological Disorders and Stroke (K23NS090900, R01NS102190, R01NS102574, R01NS107291). S.S. Cash was supported by NIH National Institute of Neurological Disorders and Stroke (R01 NS062092, K24 NS088568).
Disclosure
The authors report no disclosures relevant to the manuscript. Go to Neurology.org/N for full disclosures.
References
- 1.Palop JJ, Mucke L. Network abnormalities and interneuron dysfunction in Alzheimer disease. Nat Rev Neurosci 2016;17:777–792. [DOI] [PMC free article] [PubMed] [Google Scholar]
- 2.Noebels J. A perfect storm: converging paths of epilepsy and Alzheimer's dementia intersect in the hippocampal formation. Epilepsia 2011;52:39–46. [DOI] [PMC free article] [PubMed] [Google Scholar]
- 3.Vossel KA, Beagle AJ, Rabinovici GD, et al. Seizures and epileptiform activity in the early stages of Alzheimer disease. JAMA Neurol 2013;70:1158–1166. [DOI] [PMC free article] [PubMed] [Google Scholar]
- 4.Busche MA, Konnerth A. Neuronal hyperactivity: a key defect in Alzheimer's disease? Bioessays 2015;37:624–632. [DOI] [PubMed] [Google Scholar]
- 5.Busche MA, Konnerth A. Impairments of neural circuit function in Alzheimer's disease. Philos Trans R Soc B Biol Sci 2016;371:20150429. [DOI] [PMC free article] [PubMed] [Google Scholar]
- 6.Friedman D, Honig LS, Scarmeas N. Seizures and epilepsy in Alzheimer's disease. CNS Neurosci Ther 2012;18:285–294. [DOI] [PMC free article] [PubMed] [Google Scholar]
- 7.Cretin B, Sellal F, Philippi N, et al. Epileptic prodromal Alzheimer's disease, a retrospective study of 13 new cases: expanding the spectrum of Alzheimer's disease to an epileptic variant? J Alzheimers Dis 2016;52:1125–1133. [DOI] [PubMed] [Google Scholar]
- 8.Sarkis RA, Dickerson BC, Cole AJ, Chemali ZN. Clinical and neurophysiologic characteristics of unprovoked seizures in patients diagnosed with dementia. J Neuropsychiatry Clin Neurosci 2016;28:56–61. [DOI] [PubMed] [Google Scholar]
- 9.Vossel KA, Ranasinghe KG, Beagle AJ, et al. Incidence and impact of subclinical epileptiform activity in Alzheimer's disease. Ann Neurol 2016;80:1–13. [DOI] [PMC free article] [PubMed] [Google Scholar]
- 10.Horváth A, Szcs A, Hidasi Z, Csukly G, Barcs G, Kamondi A. Prevalence, semiology, and risk factors of epilepsy in Alzheimer's disease: an ambulatory EEG study. J Alzheimers Dis 2018;63:1045–1054. [DOI] [PubMed] [Google Scholar]
- 11.Sanchez PE, Zhu L, Verret L, et al. Levetiracetam suppresses neuronal network dysfunction and reverses synaptic and cognitive deficits in an Alzheimer's disease model. Proc Natl Acad Sci USA 2012;109:E2895–E2903. [DOI] [PMC free article] [PubMed] [Google Scholar]
- 12.Bakker A, Krauss GL, Albert MS, et al. Reduction of hippocampal hyperactivity improves cognition in amnestic mild cognitive impairment. Neuron 2012;74:467–474. [DOI] [PMC free article] [PubMed] [Google Scholar]
- 13.Kazim SF, Chuang SC, Zhao W, Wong RKS, Bianchi R, Iqbal K. Early-onset network hyperexcitability in presymptomatic Alzheimer's disease transgenic mice is suppressed by passive immunization with anti-human APP/Aβ antibody and by mGluR5 blockade. Front Aging Neurosci 2017;9:71. [DOI] [PMC free article] [PubMed] [Google Scholar]
- 14.Yassa MA, Stark SM, Bakker A, Albert MS, Gallagher M, Stark CE. High-resolution structural and functional MRI of hippocampal CA3 and dentate gyrus in patients with amnestic mild cognitive impairment. Neuroimage 2010;51:1242–1252. [DOI] [PMC free article] [PubMed] [Google Scholar]
- 15.Dickerson BC, Salat DH, Greve DN, et al. Increased hippocampal activation in mild cognitive impairment compared to normal aging and AD. Neurology 2005;65:404–411. [DOI] [PMC free article] [PubMed] [Google Scholar]
- 16.Lam AD, Deck G, Goldman A, Eskandar EN, Noebels J, Cole AJ. Silent hippocampal seizures and spikes identified by foramen ovale electrodes in Alzheimer's disease. Nat Med 2017;23:678–680. [DOI] [PMC free article] [PubMed] [Google Scholar]
- 17.Fernandez Torre JL, Alarcon G, Binnie CD, et al. Comparison of sphenoidal, foramen ovale and anterior temporal placements for detecting interictal epileptiform discharges in presurgical assessment for temporal lobe epilepsy. Clin Neurophysiol 1999;110:895–904. [DOI] [PubMed] [Google Scholar]
- 18.Tao JX, Ray A, Hawes-Ebersole S, Ebersole JS. Intracranial EEG substrates of scalp EEG interictal spikes. Epilepsia 2005;46:669–676. [DOI] [PubMed] [Google Scholar]
- 19.Normand MM, Wszolek ZK, Klass DW. Temporal intermittent rhythmic delta activity in electroencephalograms. J Clin Neurophysiol 1995;12:280–284. [DOI] [PubMed] [Google Scholar]
- 20.Di Gennaro G, Quarato PP, Onorati P, et al. Localizing significance of temporal intermittent rhythmic delta activity (TIRDA) in drug-resistant focal epilepsy. Clin Neurophysiol 2003;114:70–78. [DOI] [PubMed] [Google Scholar]
- 21.Gambardella A, Gotman J, Cendes F, Andermann F. Focal intermittent delta activity in patients with mesiotemporal atrophy: a reliable marker of the epileptogenic focus. Epilepsia 1995;36:122–129. [DOI] [PubMed] [Google Scholar]
- 22.Reiher J, Beaudry M, Leduc CP. Temporal intermittent rhythmic delta activity (TIRDA) in the diagnosis of complex partial epilepsy: sensitivity, specificity and predictive value. Can J Neurol Sci 1989;16:398–401. [DOI] [PubMed] [Google Scholar]
- 23.Saito F, Fukushima Y, Kubota S, Sato T. Clinico-electroencephalographical significance of small sharp spikes [in Japanese]. No To Shinkei 1983;35:221–227. [PubMed] [Google Scholar]
- 24.Issa NP, Wu S, Rose S, Towle VL, Warnke PC, Tao JX. Small sharp spikes as EEG markers of mesiotemporal lobe epilepsy. Clin Neurophysiol 2018;129:1796–1803. [DOI] [PubMed] [Google Scholar]
- 25.Fisher RS, Acevedo C, Arzimanoglou A, et al. ILAE official report: a practical clinical definition of epilepsy. Epilepsia 2014;55:475–482. [DOI] [PubMed] [Google Scholar]
- 26.McKhann GM, Knopman DS, Chertkow H, et al. The diagnosis of dementia due to Alzheimer's disease: recommendations from the National Institute on Aging-Alzheimer’s Association workgroups on diagnostic guidelines for Alzheimer's disease. Alzheimers Dement 2011;7:263–269. [DOI] [PMC free article] [PubMed] [Google Scholar]
- 27.Albert MS, DeKosky ST, Dickson D, et al. The diagnosis of mild cognitive impairment due to Alzheimer's disease: recommendations from the National Institute on Aging-Alzheimer's Association workgroups on diagnostic guidelines for Alzheimer's disease. Alzheimers Dement 2011;7:270–279. [DOI] [PMC free article] [PubMed] [Google Scholar]
- 28.Jing J, Herlopian A, Karakis I, et al. Interrater reliability of experts in identifying interictal epileptiform discharges in electroencephalograms. JAMA Neurol 2019;77:49–57. [DOI] [PMC free article] [PubMed] [Google Scholar]
- 29.Storey JD. A direct approach to false discovery rates. J R Stat Soc B 2002;64:479–498. [Google Scholar]
- 30.Malow BA, Kushwaha R, Lin X, Morton KJ, Aldrich MS. Relationship of interictal epileptiform discharges to sleep depth in partial epilepsy. Electroencephalogr Clin Neurophysiol 1997;102:20–26. [DOI] [PubMed] [Google Scholar]
- 31.Sammaritano M, Gigli GL, Gotman J. Interictal spiking during wakefulness and sleep and the localization of foci in temporal lobe epilepsy. Neurology 1991;41:290. [DOI] [PubMed] [Google Scholar]
- 32.Díaz-Negrillo A. Influence of sleep and sleep deprivation on ictal and interictal epileptiform activity. Epilepsy Res Treat 2013;2013:492524. [DOI] [PMC free article] [PubMed] [Google Scholar]
- 33.Wennberg R, Valiante T, Cheyne D. EEG and MEG in mesial temporal lobe epilepsy: where do the spikes really come from? Clin Neurophysiol 2011;122:1295–1313. [DOI] [PubMed] [Google Scholar]
- 34.Hesdorffer DC, Hauser WA, Annegers JF, Kokmen E, Rocca WA. Dementia and adult-onset unprovoked seizures. Neurology 1996;46:727–730. [DOI] [PubMed] [Google Scholar]
- 35.Busche MA, Chen X, Henning HA, et al. Critical role of soluble amyloid-for early hippocampal hyperactivity in a mouse model of Alzheimer's disease. Proc Natl Acad Sci USA 2012;109:8740–8745. [DOI] [PMC free article] [PubMed] [Google Scholar]
- 36.Cirrito JR, Yamada KA, Finn MB, et al. Synaptic activity regulates interstitial fluid amyloid-beta levels in vivo. Neuron 2005;48:913–922. [DOI] [PubMed] [Google Scholar]
- 37.Pooler AM, Phillips EC, Lau DHW, Noble W, Hanger DP. Physiological release of endogenous tau is stimulated by neuronal activity. EMBO Rep 2013;14:389–394. [DOI] [PMC free article] [PubMed] [Google Scholar]
- 38.Yamada K, Holth JK, Liao F, et al. Neuronal activity regulates extracellular tau in vivo. J Exp Med 2014;211:387–393. [DOI] [PMC free article] [PubMed] [Google Scholar]
- 39.White JC, Langston JW, Pedley TA. Benign epileptiform transients of sleep: clarification of the small sharp spike controversy. Neurology 1977;27:1061–1068. [DOI] [PubMed] [Google Scholar]
- 40.Scheuer ML, Bagic A, Wilson SB. Spike detection: inter-reader agreement and a statistical Turing test on a large data set. Clin Neurophysiol 2017;128:243–250. [DOI] [PubMed] [Google Scholar]
- 41.Halford JJ, Arain A, Kalamangalam GP, et al. Characteristics of EEG interpreters associated with higher interrater agreement. J Clin Neurophysiol 2017;34:168–173. [DOI] [PMC free article] [PubMed] [Google Scholar]
- 42.Scarmeas N, Honig L, Choi H, et al. Seizures in Alzheimer disease. Arch Neurol 2009;66:992–997. [DOI] [PMC free article] [PubMed] [Google Scholar]
- 43.Irizarry MC, Jin S, He F, et al. Incidence of new-onset seizures in mild to moderate Alzheimer disease. Arch Neurol 2012;69:368–372. [DOI] [PMC free article] [PubMed] [Google Scholar]
- 44.Amatniek JC, Hauser WA, DelCastillo-Castaneda C, et al. Incidence and predictors of seizures in patients with Alzheimer's disease. Epilepsia 2006;47:867–872. [DOI] [PubMed] [Google Scholar]
- 45.Van Wieringen A, Binnie CD, De Boer PT, Van Emde Boas W, Overweg J, De Vries J. Electroencephalographic findings in antiepileptic drug trials: a review and report of 6 studies. Epilepsy Res 1987;1:3–15. [DOI] [PubMed] [Google Scholar]
- 46.Guida M, Iudice A, Bonanni E, Giorgi FS. Effects of antiepileptic drugs on interictal epileptiform discharges in focal epilepsies: an update on current evidence. Expert Rev Neurother 2015;15:947–959. [DOI] [PubMed] [Google Scholar]
- 47.Binnie CD. Cognitive impairment during epileptiform discharges: is it ever justifiable to treat the EEG? Lancet Neurol 2003;2:725–730. [DOI] [PubMed] [Google Scholar]
- 48.Kleen JK, Scott RC, Holmes GL, et al. Hippocampal interictal epileptiform activity disrupts cognition in humans. Neurology 2013;81:18–24. [DOI] [PMC free article] [PubMed] [Google Scholar]
- 49.Tatum WO, Ross J, Cole AJ. Epileptic pseudodementia. Neurology 1998;50:1472–1475. [DOI] [PubMed] [Google Scholar]
Associated Data
This section collects any data citations, data availability statements, or supplementary materials included in this article.
Data Availability Statement
Data that support the findings of this study are available from the corresponding author on reasonable request.


