Abstract
Objective
To examine whether fast ripples (FRs) are an accurate marker of the epileptogenic zone, we analyzed overnight stereo-EEG recordings from 43 patients and hypothesized that FR resection ratio, maximal FR rate, and FR distribution predict postsurgical seizure outcome.
Methods
We detected FRs automatically from an overnight recording edited for artifacts and visually from a 5-minute period of slow-wave sleep. We examined primarily the accuracy of removing ≥50% of total FR events or of channels with FRs to predict postsurgical seizure outcome (Engel class I = good, classes II–IV = poor) according to the whole-night and 5-minute analysis approaches. Secondarily, we examined the association of low overall FR rates or absence or incomplete resection of 1 dominant FR area with poor outcome.
Results
The accuracy of outcome prediction was highest (81%, 95% confidence interval [CI] 67%–92%) with the use of the FR event resection ratio and whole-night recording (vs 72%, 95% CI 56%–85%, for the visual 5-minute approach). Absence of channels with FR rates >6/min (p = 0.001) and absence or incomplete resection of 1 dominant FR area (p < 0.001) were associated with poor outcome.
Conclusions
FRs are accurate in predicting epilepsy surgery outcome at the individual level when overnight recordings are used. Absence of channels with high FR rates or absence of 1 dominant FR area is a poor prognostic factor that may reflect suboptimal spatial sampling of the epileptogenic zone or multifocality, rather than an inherently low sensitivity of FRs.
Classification of evidence
This study provides Class II evidence that FRs are accurate in predicting epilepsy surgery outcome.
High-frequency oscillations (HFOs) >80 Hz, divided into ripples (80–250 Hz) and fast ripples (FRs, >250 Hz), are a promising new biomarker of epilepsy.1 FRs recorded intracranially with clinical macroelectrodes have proved to be a very specific marker of the seizure onset zone (SOZ)2,3 and of postsurgical seizure outcome.4–11 However, they are thought to have weak sensitivity3,6,8,9,11 because their rate of occurrence is low and they are even absent in some patients in clinical macroelectrode recordings.6,9,12
Because visual HFO identification is highly time-consuming,13 most intracranial studies relating interictal HFOs to surgical outcome have used 3- to 20-minute segments of non-REM (NREM) sleep for HFO identification.4,5 The rate of HFOs varies across longer time frames according to sleep/vigilance stage,14–17 medication,13 and seizure activity.18 Consequently, a randomly selected short epoch of NREM sleep may not be representative of the whole spectrum of FRs in all patients.18
Evaluating longer segments is currently feasible with automatic detectors.11,17–19 We investigated whether FRs can become a better marker of the epileptogenic zone (EZ) if we use a much longer period of intracranial EEG. We hypothesized that (1) analyzing FRs from a whole-night recording results in higher postsurgical seizure outcome prediction accuracy than analyzing a 5-minute sample of NREM sleep and that (2) absence of channels with a high FR rate or absence of 1 clear FR focus would indicate that the EZ was suboptimally sampled by the implantation scheme or was multifocal and would consequently be associated with a poor outcome.
Methods
Standard protocol approvals, registrations, and patient consents
The Montreal Neurologic Institute and Hospital Review Ethics Board approved the study protocol. Patients signed an ethics board–approved written informed consent before study participation.
Patient sample
Between January 2010 and March 2015, 102 patients underwent stereo-EEG (SEEG) at the Montreal Neurologic Institute and Hospital. The decision to perform the SEEG was exclusively clinical, and electrode locations were decided independently of this study. The inclusion criteria were as follows: (1) resective surgery after the intracranial investigation; (2) ≥12-month postsurgical follow-up; (3) good-quality preimplantation, peri-implantation, and postsurgical brain imaging enabling exact localization of individual electrode contacts and resection cavity; (4) ≥5 implanted electrodes; and (5) at least 1 night (>4 hours of data free of seizures and artifacts) sampled at 2,000 Hz. We chose the 5-electrode minimum to prevent situations in which all available contacts would be included in the resection.20 Forty-three patients fulfilled the inclusion criteria and were included in the analysis.
Intracerebral EEG electrodes were implanted stereotactically with an image-guided system.21 During intracranial EEG acquisition, we used a referential montage (an epidural parietal reference electrode contralateral to the suspected EZ), 2,000-Hz sampling frequency, and 0.3-Hz high-pass and 600-Hz low-pass-filters.
FR detection
We marked FRs using a bipolar montage. To mark FRs from the whole-night sample, we used an automatic detector22 that finds increases in the root mean square amplitude of the signal in narrow frequency bands and compares it to the background in a 5-second sliding window. A detection occurs when the root mean square amplitude in any narrow frequency band is at least 3 times larger than the background, during an interval >4 cycles of the central frequency of the band plus the effective duration of the impulse response of the narrowband filter. The detector relies first on a wideband filter (band-pass finite impulse response filters, equiripple, order 200, transition bands of 15-Hz width, pass band from 80 to 500 Hz, weighting factor 10 on the low-frequency stop band) and 5 narrowband filters in the 250- to 500-Hz range (250–285–330–380–435–500 Hz, band-pass finite impulse response filters, equiripple, order 500, transition bands of 5 Hz width, weighting factor 10 on the low-frequency stop band). The Matlab code for the automatic detector is available on request.
The analysis period began when the patient fell asleep and ended when the patient awoke in the morning. We excluded malfunctioning and extracranial channels, channels with recurrent muscle artifacts, and periods with visually detected artifacts (e.g., muscle and movement artifacts during arousals). We also excluded 5 minutes before and after focal electrographic or focal clinical seizures. In case the postictal SEEG attenuation exceeded 5 minutes or the seizures continued in series, we stopped detections 5 minutes preictally and did not resume them postictally. One reader validated visually the first 50 automatically detected FRs for each channel and patient and excluded events produced by artifacts. Hence, we did not exclude events that the validating author would not have marked unless they were caused by artifact. Likewise, we did not confirm whether the automatic detector detected all events marked by the human reader. We chose this approach to keep the results of the automatic detector as independent of the human reader as possible. To calculate the validated FR rate, we multiplied the automatic FR rate by the ratio of included events divided by all inspected events.
For comparison with the whole-night recording, 1 reader (blinded to resection area and outcome) marked manually a 5-minute period of NREM sleep independently of the automatic detection following the methodology of previous studies.13,23 The display was split vertically with a 0.5-Hz high-pass filter (normal SEEG) on the left side and a 250-Hz high-pass filter on the right side, with finite impulse response filters used to limit ringing. We regarded an event as an FR if it was visible on the right (250 Hz) and there was no detectable artifact in the normal SEEG. Events had to contain at least 4 consecutive oscillations to be regarded as FRs, and 2 events had to be separated by at least 2 non-HFO oscillations. We then calculated the FR rates per channel on the basis of the whole-night automatic analysis, the 5-minute visual analysis, and automatic analysis of the same 5 minutes as the visual analysis.
Classification of channels
We classified SEEG channels as channels within and outside the operated area by superimposing the electrode contact locations, derived from peri-implantation images, with postsurgical images. We considered bipolar channels removed if at least 1 of the contacts was in the resection cavity or within 5 mm of its borders on the postsurgical MRIs. We chose this 5-mm margin to account for possible sagging, coregistration error, and partial contact resection.24
Surgical outcome
The decision for surgery was based on the intracranial investigation and noninvasive investigations. FR occurrence and rates were not available for the clinicians making the surgical decisions. A board-certified neurologist blinded to the FR results classified the postsurgical seizure outcome as good (Engel class I) or poor (Engel classes II–IV)25 on the basis of documentation of the patients' postsurgical visits.
Statistical analysis
We performed the statistical analyses using IBM SPSS Statistics version 23.0 (IBM Corp, Armonk, NY) and Matlab version R2018b (MathWorks, Natick, MA). On the basis of the reported FR rates in normal brain areas,26 we considered channels with an FR rate <0.2/min normal and discarded them from statistical analyses.
At the group level, we compared the FR resection ratio (number of FR events on removed channels divided by total number of FR events; figure 1), FR channel resection ratio (number of removed channels with FRs divided by total number of channels with FRs), and the maximal FR rate (the rate of the channel with most events) between patients with good and poor outcomes with Mann-Whitney U test because these variables were not normally distributed. For effect size, we used Ω, which can take values between −1 and 1 and is centered at zero; values of |Ω| = 0.1, 0.3, and 0.4 are viewed as small, medium, and large effect sizes.27
Figure 1. Example of calculation of FR resection ratio and FR channel resection ratio for 1 patient who became seizure-free.
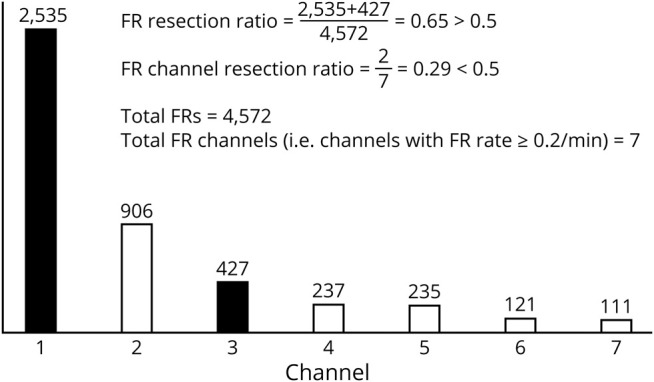
Seven channels had ≥0.2/min fast ripple (FR) rate and were included in the calculations. Bars depict the number of FRs on each of the 7 channels. Dark bars represent resected channels; white bars represent nonresected channels. FR resection ratio clearly exceeds the 0.5 threshold, whereas FR channel resection ratio does not.
For our primary study question of determining the accuracy of FRs in epilepsy surgery outcome prediction at a single-patient level, we applied a 0.5 resection ratio threshold as used in previous studies20,23 to predict good vs poor outcome. We considered as true positive those patients with poor outcome in whom <50% of FRs or FR channels were resected or in whom no channels showed an FR rate ≥0.2/min (and consequently no FRs or FR channels were removed in such cases), as false positive those patients with good outcome in whom <50% of FRs or FR channels were resected or no channels showed an FR rate ≥0.2/min, as false negative those patients with poor outcome in whom ≥50% of FRs or FR channels were resected, and as true negative those patients with good outcome in whom ≥50% of FRs or FR channels were resected. For comparison, we applied a data-driven approach and constructed receiver operating characteristic curves to find the optimal resection ratio threshold that would minimize false predictions in our sample. We calculated the accuracy, sensitivity, specificity, and positive and negative predictive values, as well as diagnostic odds ratios (DORs) including 95% confidence intervals (CIs). The p values from the χ2 test were corrected for multiple comparisons with Bonferroni correction. We considered values of p < 0.05 significant.
We also used receiver operating characteristic curves to investigate whether the absence of channels above a certain FR rate threshold was associated with postsurgical seizure outcome at the individual level (χ2 test with corresponding DOR and 95% CI) because predefining a threshold was not possible due to lack of prior studies of this issue.
Finally, we investigated whether absence of 1 dominant FR area or its incomplete resection was associated with poor outcome (χ2 test with corresponding DOR and 95% CI). We considered 1 dominant FR area to exist if the dominant FR channels (defined as the set of highest FR rate channels, in rank order, sufficient to reach ≥0.5 PR resection ratio) were confined to a continuous brain area that could be removed in a single resection. This definition included (1) neighboring channels of the same electrode, (2) ipsilateral amygdala and hippocampus, and (3) neighboring neocortical electrodes in the same lobe. On the contrary, we considered several dominant areas to exist in cases when the dominant channels were (1) in different hemispheres, (2) in the same hemisphere but different lobes (unless both were close to the border of the 2 lobes e.g., the parietotemporal area), or (3) in the same lobe but there was a nonactive electrode in between.
Data availability
Raw SEEG files supporting the findings of this study are available (from N. von Ellenrieder) on reasonable request and approval by the ethics boards of the corresponding institutions.
Results
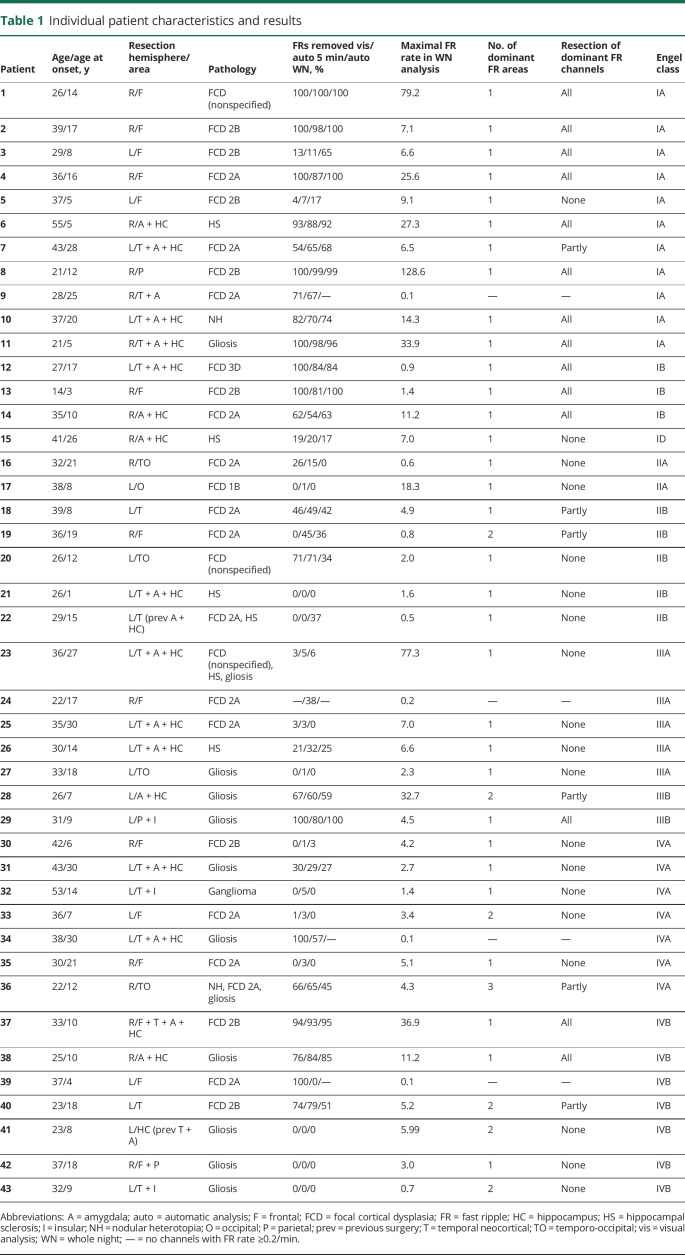
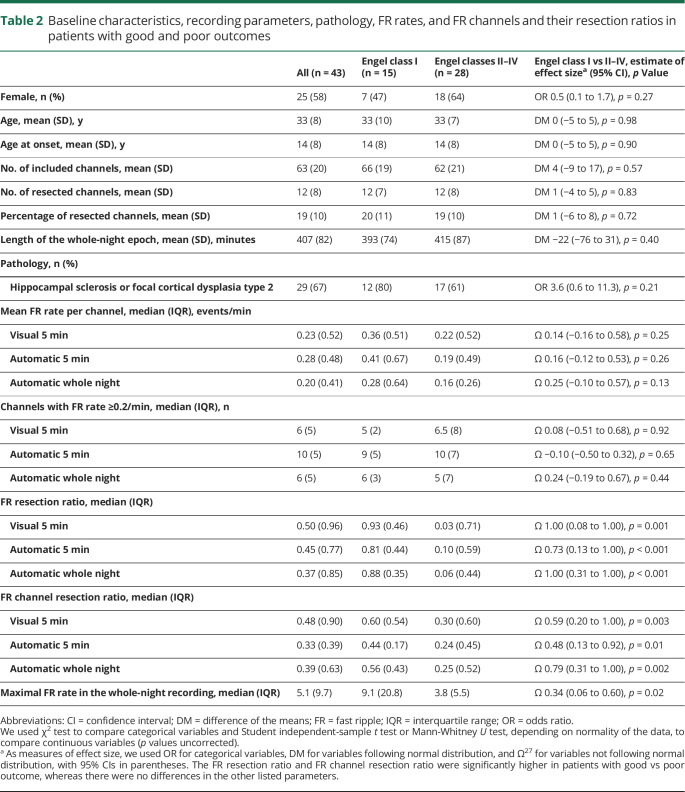
From our initial cohort of 102 patients, 43 (25 women, age 14–55 years) fulfilled the inclusion criteria and qualified for the study (figure 2 and table 1). The postsurgical seizure outcome was good in 15 (35%) patients and poor in 28 (65%). The baseline characteristics (sex, age, age at onset), recording parameters (number of included channels or resected channels, percentage of resected channels, or length of the overnight recording), or pathology did not differ significantly between the patients with good and poor outcomes (table 2). The mean FR rate per channel did not differ significantly between the automatic and visual analysis of the 5-minute segment of NREM sleep (p = 0.069, medians shown in table 2), indicating that the automatic detector and the human reader did not differ in their sensitivity to detect events. The mean length of the analyzed whole-night epoch was 407 (SD 82) minutes per patient. During visual validation, the median of rejected events was 0.2% (interquartile range 1%) per patient. In the whole cohort, only 1 of the original 285 FR channels changed to <0.2/min after visual validation. Visual validation did not significantly affect any of the statistical results presented in the following paragraphs; therefore, we report all results using the automatic whole-night detections without correction based on visual validation.
Figure 2. Flowchart of study population.
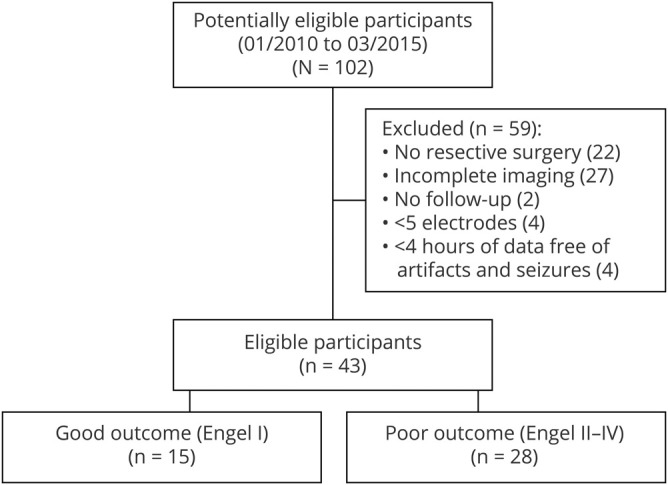
Table 1.
Individual patient characteristics and results
Table 2.
Baseline characteristics, recording parameters, pathology, FR rates, and FR channels and their resection ratios in patients with good and poor outcomes
Resection ratios and outcome
Table 2 shows the medians and interquartile ranges of FR and FR channel resection ratios derived from each analysis approach. At group level, the resection ratios were significantly higher in patients with good than poor outcome regardless of whether the analysis was based on the whole night or the automatic or visual analysis of 5 minutes of NREM sleep (table 2 provides statistics).
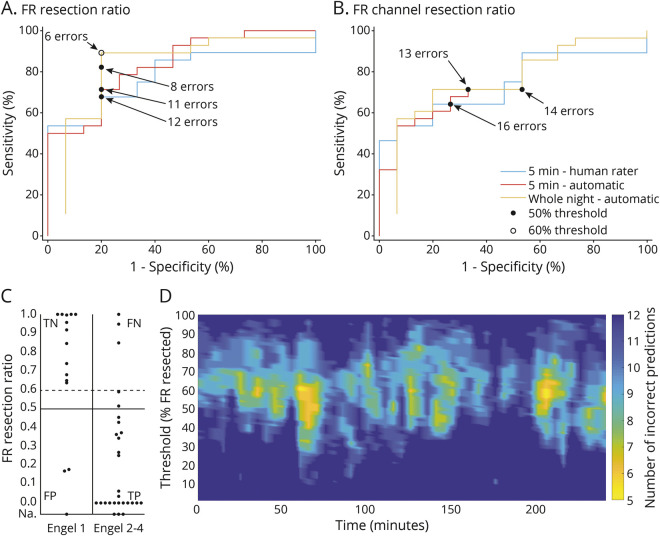
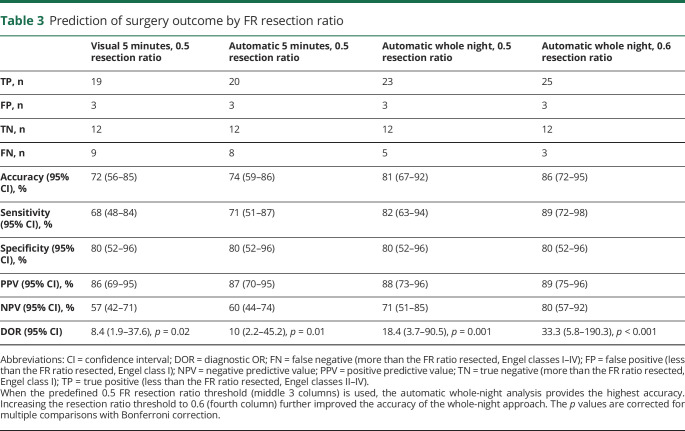
At the individual level, when the predefined 0.5 resection ratio threshold was used, the FR resection ratio calculated from the whole-night recording produced the lowest number of false predictions (8, accuracy 81%, 95% CI 67%−92%, figure 3, A–C). The number of false predictions could be further reduced to 6 by selecting the optimal FR resection ratio threshold of 0.6 (accuracy 86%, 95% CI 72%–95%, figure 3, A and C). Table 3 shows the accuracy, sensitivity, specificity, positive and negative predictive values, and DORs of the FR resection ratios calculated with the different analysis approaches. We excluded the FR channel resection ratio (figure 3B) from the calculations in table 3 because it clearly produced a higher number of false predictions than the FR resection ratio. Figure 3D shows how the predictive accuracy of different FR resection ratios varied between consecutive 5-minute segments. At 2 time points with ≈0.6 threshold, the accuracy (88%) exceeds that of the whole-night analysis but mostly remains inferior to it.
Figure 3. Association of FR or FR channel resection ratios with outcome.
(A and B) Receiver operating characteristic curves of different (A) fast ripple (FR) and (B) FR channel resection ratios in relation to outcome. Black dots correspond to the predefined 0.5 resection ratio threshold; white circle shows the point of best prediction accuracy of whole-night data, which corresponds to a 0.6 FR resection ratio threshold. (C) FR resection ratios calculated from the whole-night analysis in each patient with good vs poor outcome. Horizontal lines show the predefined 0.5 (solid line) and the optimal 0.6 (dashed line) resection ratio thresholds. Patients with no channels showing an FR rate ≥0.2/min are displayed according to their outcome on the line marked not available (Na). (D) Outcome prediction accuracy by automatic analysis at consecutive 5-minute segments. The x-axis shows the time from sleep start; the y-axis depicts the FR resection ratio threshold; and colors show the number of incorrect predictions of 43 patients at each time point and resection ratio. Overall, outcome prediction depends on the selection of the 5-minute episode during the overnight recording. Number of incorrect predictions tends to be lowest at an ≈0.6 FR resection ratio. Lowest number of incorrect predictions at any single 5-minute segment is 5 (accuracy 88%). However, number of incorrect predictions of most segments remains above that of the optimal whole-night analysis (i.e., >6 incorrect predictions). Patients who had no channels with an FR rate ≥0.2/min are included in all figures as true positive (TP; if the outcome was poor) or false positive (FP; if the outcome was good). FN = false negative; TN = true negative.
Table 3.
Prediction of surgery outcome by FR resection ratio
Association of FR rate and spatial extent with outcome
The whole-night maximal FR rate was associated with outcome at individual level, so that if no channel showed an FR rate >6/min, the outcome was likely to be poor (21 of 24 patients, DOR 12, 95% CI 3–55, p = 0.001, figure 4). Pathology did not explain the low FR rates because the patients with no channels showing FR rate >6/min fell into various pathology categories, including both mesial temporal and neocortical structures (table 1).
Figure 4. Association of the maximal FR rate and spatial extent of FRs with outcome.

Each shape corresponds to 1 patient. Circles indicate patients with at least 1 channel with fast ripple (FR) rates >6/min; squares indicate patients without channels showing FR rates >6/min. The fill of the shape shows the completeness of dominant FR channel resection: black = complete, gray = partial (or no channels with FR rate ≥0.2/min), white = none resected.
If the FRs were confined to 1 dominant area and it was completely resected, the outcome was likely to be good (11 of 14 patients, figure 4). On the contrary, 10 of the 11 patients with >1 dominant FR area and 15 of 18 patients in whom the 1 dominant area was not completely resected had poor outcome (DOR 23, 95% CI 4–120, p < 0.001, figure 4).
Discussion
Our data from a large, single-center patient sample show that the FR resection ratio accurately predicts epilepsy surgery outcome at the individual level when whole-night recordings are used. This result agrees with a recent study demonstrating that in some patients HFOs analyzed from a short segment of NREM sleep are not representative of the whole spectrum of HFOs over longer time periods,18 unlike previously suggested.15,28 In addition, in the present study, the absence of channels with a high FR rate or absence of 1 dominant FR area was associated with poor outcome and likely reflects insufficient spatial sampling of the EZ. Previous studies have not addressed the issue of whether the EZ was sufficiently sampled, even though it is a key issue in intracranial EEG investigations.
HFO rates vary overnight, with highest rates in NREM sleep14–17,29 and highest pathologic-to-physiologic ratio during the first sleep cycle.29 Although HFO studies have generally concentrated on NREM sleep due to higher number of events, events in REM sleep may be more specific to the EZ.16 In patients with multifocal seizure onset areas, independent HFO-generating areas can be active at different times, probably reflecting the changing overall epileptic activity of each area.18
In our study, the length of the analysis period affected the outcome prediction at individual level so that the whole-night approach resulted in higher accuracy than the 5-minute approach. Although it would be interesting to evaluate the sleep stages separately in long recordings, we chose to concentrate on the current whole-night approach because it is easily adaptable for clinical use due to its simplicity. The automatic analysis of the artifact-edited whole-night data yielding results similar to those of the visually validated approach further increases the clinical appeal of the whole-night approach.
FRs have proven to be fairly specific to epileptogenic cortex, and FR rates in nonepileptogenic cortex are very low.26 Animal studies show that, whereas ripples can represent physiologic events in mesial temporal structures closely linked to memory consolidation30 and pathologic events in epilepsy models,31 FRs are almost exclusively pathologic and closely linked to epileptogenesis.32–34 In patients, the specificity of FRs to identify the SOZ2,3 and to predict outcome after epilepsy surgery has consistently been higher than that of ripples.4,5,8–11,19,35,36 In particular, if high-FR-rate channels remain untouched, the patient is unlikely to become seizure-free.6–8,10,11,19,36
In our study, FRs identified the EZ also with high sensitivity. The EZ is the area of cortex that needs to be removed for seizure freedom37 and is thus conceptually different from the SOZ, the area showing the first ictal changes. Many previous studies reporting low sensitivity examined channel, not patient-level, sensitivity, comparing the FR channels to the resected channels in patients with good outcome,11 to the SOZ channels,2 or to the epileptogenicity index zone channels.3 All of these definitions may overestimate or misestimate the EZ, consequently lowering sensitivity because many channels defined this way show no FRs.
The other few studies examining, like our study, the sensitivity of FRs at the patient level showed a large variability between them (29%19–90%20). This is likely due to different definitions of true and false positives and negatives, which depend on the definition of FR channels and the FR or FR channel resection ratio threshold. We calculated the predictive values almost identically to a recent study with a comparable sample size,20 yet our prediction accuracy was clearly higher (81% vs 69%). This may be explained by our longer analysis period, but in addition, our study population (age >14 years), methods of intracranial EEG registration (SEEG exclusively), and surgical procedures (sublobar resections exclusively) were more homogeneous than those of the previous study (all ages, SEEG or electrocorticography, any resection type). Our data-driven analysis showed that the optimal FR resection ratio threshold might be higher than the previously used 0.5. Confirming this observation remains a prospect for future studies.
Despite the good predictive accuracy of the FR resection ratio, this retrospective measure does not provide sufficient information for prospective surgical planning for 2 reasons: it does not tell whether the EZ was sampled or whether the detected FRs originate in areas outside the EZ, and it does not indicate unambiguously which channels to remove because several channel combinations can add up to ≥50% of total FRs. Previous studies suggested that an ictal increase in HFOs38 and a specific combination of changes in fast and slow activity at ictal onset, an ictal fingerprint,39 would differentiate between the actual onset and propagation areas.
In accordance with our hypothesis, the absence of high FR rate channels and absence of 1 dominant FR area were associated with a poor outcome, which we interpret as indicating in such cases that the EZ was either suboptimally sampled or was widespread. These 2 measures can be determined prospectively and hence could be used to guide surgical decisions. One might question whether the low FR rates were due to the low sensitivity of the automatic detector because we did not evaluate whether all visually marked events were detected by the detector. Conceptually, this is, however, not relevant because we defined FRs as those detected by the detector (independently of the human reader), and with such a definition, most patients with low FR rates had poor outcome. Second, even in practice, the mean FR rate per channel did not differ significantly between the automatic and visual analysis approaches, indicating that the automatic detector and the human reader did not differ in their sensitivity to detect events. The low FR rates also could not be explained by pathology because the patients with no channels showing FR rate >6/min had various underlying pathologies involving both the mesial temporal and neocortical structures.
Contradicting our hypothesis, 3 patients had good outcome despite low FR rates. One had an ischemic lesion and a focal cortical dysplasia type 3D, and according to the SEEG report, the EZ was thought to have been slightly missed by the electrodes. The other 2 patients had a focal cortical dysplasia type 2, but neither showed the typical interictal SEEG pattern. Because FR generators are very focal,40,41 the low FR rate may also here reflect a suboptimal spatial sampling of the EZ, even if it was subsequently included in the resection. This hypothesis could be further supported in the future by examining FRs in patients who underwent implantation of additional electrodes in the course of the SEEG recording. Implanting additional electrodes during SEEG is, however, a rare procedure, and our cohort did not include such patients, so this issue remains a topic for future studies.
If the dominant FR channels were confined to 1 area and removed completely, the outcome was usually good, whereas if they remained untouched, the outcome was usually poor. For prospective surgical planning, this means that if the majority of FRs originate from 1 continuous area, one should consider including this area in the resection. However, this measure is not perfect; 2 patients achieved good outcome even though the dominant FR channels, located in the mesial temporal structures in both cases, remained untouched. A previous study also found interictal FRs bitemporally in patients with temporal lobe epilepsy with unilateral seizure generator and seizure-free outcome after surgery.42 The explanation may be a postsurgical decrease of the unresected mesial temporal FRs because in intraoperative electrocorticography the FRs remaining in the postresection recording6,7 provide the best prediction of seizure recurrence, not the percentage of removed preresection FRs.7
Because we counted each FR on each channel as a separate event, both the FR resection ratio and the definition of dominant FR area depended on the number of contacts sampling each area producing FRs. Hence, these measures can give only an approximation of the FR area and extension of its resection. However, such simple measures are practical, and recent data showing that removing the high-rate channels is as good for outcome prediction as removing the first source channels of HFO networks43 also support their use.
We excluded data 5 minutes preictally and postictally of short focal seizures, whereas most studies selected epochs at least 2 hours from any seizure. However, HFO rates increase only within seconds,44,45 not minutes, preceding seizure onset.44,46 To the best of our knowledge, no study has systematically examined the rate of HFOs immediately or shortly postictally. Although this could be seen as a limitation of our study, at the same time, it demonstrates the robustness of the whole-night approach and expands its use to patients with multiple nocturnal seizures.
Our results show that at the individual level the sensitivity of FRs may not be as poor as previously suggested because the absence of high-FR-rate channels was associated with a poor surgical outcome, probably indicating a suboptimal spatial sampling of the EZ rather than inherently low sensitivity of FRs. Our results do not contradict previous claims that FRs cannot define the entire EZ.3 They suggest that FRs mark the core of the EZ and, consequently, that the absence of high-FR-rate channels or 1 dominant FR area presents a red flag that the EZ is suboptimally sampled or may be multifocal. We also show that using a long analysis duration tends to result in more accurate outcome prediction.
Acknowledgment
The authors thank Dr. Andreas Koupparis and Natalja Zazubovits from the Montreal Neurological Institute for assistance with data extraction and management.
Glossary
- CI
confidence interval
- DOR
diagnostic odds ratio
- EZ
epileptogenic zone
- FR
fast ripples
- HFO
high-frequency oscillation
- NREM
non-REM
- SEEG
stereo-EEG
- SOZ
seizure onset zone
Appendix. Authors
Footnotes
Class of Evidence: NPub.org/coe
Study funding
This research was funded in part by grant FDN 143208 of the Canadian Institutes of Health Research to J. Gotman and startup funding of the Montreal Neurologic Institute to B. Frauscher. In addition, P. Nevalainen received a research scholarship from the Internal Federation of Clinical Neurophysiology, P. Klimeš was supported by the Molson Neuroengineering fellowship of the Montreal Neurologic Institute, and B. Frauscher was supported by a salary award (Chercheur-boursier clinicien Junior 2) of the Fonds de Recherche du Québec–Santé.
Disclosure
The authors report no disclosures relevant to the manuscript. Go to Neurology.org/N for full disclosures.
References
- 1.Frauscher B, Bartolomei F, Kobayashi K, et al. High-frequency oscillations: the state of clinical research. Epilepsia 2017;58:1316–1329. [DOI] [PMC free article] [PubMed] [Google Scholar]
- 2.Andrade-Valença L, Mari F, Jacobs J, et al. Interictal high frequency oscillations (HFOs) in patients with focal epilepsy and normal MRI. Clin Neurophysiol 2012;123:100–105. [DOI] [PMC free article] [PubMed] [Google Scholar]
- 3.Roehri N, Pizzo F, Lagarde S, et al. High-frequency oscillations are not better biomarkers of epileptogenic tissues than spikes. Ann Neurol 2018;83:84–97. [DOI] [PubMed] [Google Scholar]
- 4.Akiyama T, McCoy B, Go CY, et al. Focal resection of fast ripples on extraoperative intracranial EEG improves seizure outcome in pediatric epilepsy. Epilepsia 2011;52:1802–1811. [DOI] [PubMed] [Google Scholar]
- 5.Kerber K, Dümpelmann M, Schelter B, et al. Differentiation of specific ripple patterns helps to identify epileptogenic areas for surgical procedures. Clin Neurophysiol 2014;125:1339–1345. [DOI] [PubMed] [Google Scholar]
- 6.van 't Klooster MA, van Klink NEC, Leijten FSS, et al. Residual fast ripples in the intraoperative corticogram predict epilepsy surgery outcome. Neurology 2015;85:120–128. [DOI] [PubMed] [Google Scholar]
- 7.van 't Klooster MA, van Klink NEC, Zweiphenning WJEM, et al. Tailoring epilepsy surgery with fast ripples in the intraoperative electrocorticogram. Ann Neurol 2017;81:664–676. [DOI] [PubMed] [Google Scholar]
- 8.Hussain SA, Mathern GW, Hung P, Weng J, Sankar R, Wu JY. Intraoperative fast ripples independently predict postsurgical epilepsy outcome: comparison with other electrocorticographic phenomena. Epilepsy Res 2017;135:79–86. [DOI] [PMC free article] [PubMed] [Google Scholar]
- 9.Wang S, So NK, Jin B, et al. Interictal ripples nested in epileptiform discharge help to identify the epileptogenic zone in neocortical epilepsy. Clin Neurophysiol 2017;128:945–951. [DOI] [PubMed] [Google Scholar]
- 10.Weiss SA, Berry B, Chervoneva I, et al. Visually validated semi-automatic high-frequency oscillation detection aides the delineation of epileptogenic regions during intra-operative electrocorticography. Clin Neurophysiol 2018;129:2089–2098. [DOI] [PubMed] [Google Scholar]
- 11.Cuello-Oderiz C, von Ellenrieder N, Sankhe R, et al. Value of ictal and interictal epileptiform discharges and high frequency oscillations for delineating the epileptogenic zone in patients with focal cortical dysplasia. Clin Neurophysiol 2018;129:1311–1319. [DOI] [PubMed] [Google Scholar]
- 12.Cho JR, Koo DL, Joo EY, et al. Resection of individually identified high-rate high-frequency oscillations region is associated with favorable outcome in neocortical epilepsy. Epilepsia 2014;55:1872–1883. [DOI] [PubMed] [Google Scholar]
- 13.Zijlmans M, Jacobs J, Zelmann R, Dubeau F, Gotman J. High-frequency oscillations mirror disease activity in patients with epilepsy. Neurology 2009;72:979–986. [DOI] [PMC free article] [PubMed] [Google Scholar]
- 14.Staba RJ, Wilson CL, Bragin A, Jhung D, Fried I, Engel J. High-frequency oscillations recorded in human medial temporal lobe during sleep. Ann Neurol 2004;56:108–115. [DOI] [PubMed] [Google Scholar]
- 15.Bagshaw AP, Jacobs J, LeVan P, Dubeau F, Gotman J. Effect of sleep stage on interictal high-frequency oscillations recorded from depth macroelectrodes in patients with focal epilepsy. Epilepsia 2009;50:617–628. [DOI] [PMC free article] [PubMed] [Google Scholar]
- 16.Sakuraba R, Iwasaki M, Okumura E, et al. High frequency oscillations are less frequent but more specific to epileptogenicity during rapid eye movement sleep. Clin Neurophysiol 2016;127:179–186. [DOI] [PubMed] [Google Scholar]
- 17.Dümpelmann M, Jacobs J, Schulze-Bonhage A. Temporal and spatial characteristics of high frequency oscillations as a new biomarker in epilepsy. Epilepsia 2015;56:197–206. [DOI] [PubMed] [Google Scholar]
- 18.Gliske SV, Irwin ZT, Chestek C, et al. Variability in the location of high frequency oscillations during prolonged intracranial EEG recordings. Nat Commun 2018;9:2155. [DOI] [PMC free article] [PubMed] [Google Scholar]
- 19.Fedele T, Burnos S, Boran E, et al. Resection of high frequency oscillations predicts seizure outcome in the individual patient. Sci Rep 2017;7:13836. [DOI] [PMC free article] [PubMed] [Google Scholar]
- 20.Jacobs J, Wu JY, Perucca P, et al. Removing high-frequency oscillations. Neurology 2018;91:e1040–e1052. [DOI] [PMC free article] [PubMed] [Google Scholar]
- 21.Frauscher B, Von Ellenrieder N, Zelmann R, et al. Atlas of the normal intracranial electroencephalogram: neurophysiological awake activity in different cortical areas. Brain 2018;141:1130–1144. [DOI] [PubMed] [Google Scholar]
- 22.von Ellenrieder N, Andrade-Valença LP, Dubeau F, Gotman J. Automatic detection of fast oscillations (40-200 Hz) in scalp EEG recordings. Clin Neurophysiol 2012;123:670–680. [DOI] [PMC free article] [PubMed] [Google Scholar]
- 23.Jacobs J, Zijlmans M, Zelmann R, et al. High-frequency electroencephalographic oscillations correlate with outcome of epilepsy surgery. Ann Neurol 2010;67:209–220. [DOI] [PMC free article] [PubMed] [Google Scholar]
- 24.Cuello Oderiz C, Von Ellenrieder N, Dubeau F, et al. Association of cortical stimulation-induced seizure with surgical outcome in patients with focal drug-resistant epilepsy. JAMA Neurol 2019;76:1070–1078. [DOI] [PMC free article] [PubMed] [Google Scholar]
- 25.Engel JJ. Update on surgical treatment of the epilepsies: summary of the Second International Palm Desert Conference on the Surgical Treatment of the Epilepsies (1992). Neurology 1993;43:1612–1617. [DOI] [PubMed] [Google Scholar]
- 26.Frauscher B, von Ellenrieder N, Zelmann R, et al. High-frequency oscillations in the normal human brain. Ann Neurol 2018;84:374–385. [DOI] [PubMed] [Google Scholar]
- 27.Wilcox R. A robust nonparametric measure of effect size based on an analog of Cohen's d, plus inferences about the median of the typical difference. J Mod Appl Stat Methods 2018;17:eP2726. [Google Scholar]
- 28.Zelmann R, Zijlmans M, Jacobs J, Châtillon CE, Gotman J. Improving the identification of high frequency oscillations. Clin Neurophysiol 2009;120:1457–1464. [DOI] [PMC free article] [PubMed] [Google Scholar]
- 29.von Ellenrieder N, Dubeau F, Gotman J, Frauscher B. Physiological and pathological high-frequency oscillations have distinct sleep-homeostatic properties. Neuroimage Clin 2017;14:566–573. [DOI] [PMC free article] [PubMed] [Google Scholar]
- 30.Draguhn A, Traub RD, Bibbig A, Schmitz D. Ripple (approximately 200-Hz) oscillations in temporal structures. J Clin Neurophysiol 2000;17:361–376. [DOI] [PubMed] [Google Scholar]
- 31.Bragin A, Wilson CL, Almajano J, Mody I, Engel J. High-frequency oscillations after status epilepticus: epileptogenesis and seizure genesis. Epilepsia 2004;45:1017–1023. [DOI] [PubMed] [Google Scholar]
- 32.Bragin A, Wilson CL, Staba RJ, Reddick M, Fried I, Engel J. Interictal high-frequency oscillations (80-500 Hz) in the human epileptic brain: entorhinal cortex. Ann Neurol 2002;52:407–415. [DOI] [PubMed] [Google Scholar]
- 33.Staba RJ, Wilson CL, Bragin A, Fried I, Engel J. Quantitative analysis of high-frequency oscillations (80–500 Hz) recorded in human epileptic Hippocampus and entorhinal cortex. J Neurophysiol 2002;88:1743–1752. [DOI] [PubMed] [Google Scholar]
- 34.Menendez de la Prida L, Staba RJ, Dian JA. Conundrums of high-frequency oscillations (80-800 Hz) in the epileptic brain. J Clin Neurophysiol 2015;32:207–219. [DOI] [PMC free article] [PubMed] [Google Scholar]
- 35.Fedele T, Ramantani G, Burnos S, et al. Prediction of seizure outcome improved by fast ripples detected in low-noise intraoperative corticogram. Clin Neurophysiol 2017;128:1220–1226. [DOI] [PubMed] [Google Scholar]
- 36.Fedele T, van 't Klooster M, Burnos S, et al. Automatic detection of high frequency oscillations during epilepsy surgery predicts seizure outcome. Clin Neurophysiol 2016;127:3066–3074. [DOI] [PubMed] [Google Scholar]
- 37.Lüders HO, Najm I, Nair D, Widdess-Walsh P, Bingman W. The epileptogenic zone: general principles. Epileptic Disord 2006;8:S1–S9. [PubMed] [Google Scholar]
- 38.Jirsch JD, Urrestarazu E, LeVan P, Olivier A, Dubeau F, Gotman J. High-frequency oscillations during human focal seizures. Brain 2006;129:1593–1608. [DOI] [PubMed] [Google Scholar]
- 39.Grinenko O, Li J, Mosher JC, et al. A fingerprint of the epileptogenic zone in human epilepsies. Brain 2018;141:117–131. [DOI] [PMC free article] [PubMed] [Google Scholar]
- 40.Worrell GA, Gardner AB, Stead SM, et al. High-frequency oscillations in human temporal lobe: simultaneous microwire and clinical macroelectrode recordings. Brain 2008;131:928–937. [DOI] [PMC free article] [PubMed] [Google Scholar]
- 41.Despouy E, Curot J, Denuelle M, et al. Neuronal spiking activity highlights a gradient of epileptogenicity in human tuberous sclerosis lesions. Clin Neurophysiol 2019;130:537–547. [DOI] [PubMed] [Google Scholar]
- 42.Liu C, Zhang R, Zhang G, et al. High frequency oscillations for lateralizing suspected bitemporal epilepsy. Epilepsy Res 2016;127:233–240. [DOI] [PubMed] [Google Scholar]
- 43.González Otárula KA, von Ellenrieder N, Cuello-Oderiz C, Dubeau F, Gotman J. High-frequency oscillation networks and surgical outcome in adult focal epilepsy. Ann Neurol 2019;85:485–494. [DOI] [PubMed] [Google Scholar]
- 44.Khosravani H, Mehrotra N, Rigby M, et al. Spatial localization and time-dependant changes of electrographic high frequency oscillations in human temporal lobe epilepsy. Epilepsia 2009;50:605–616. [DOI] [PubMed] [Google Scholar]
- 45.Zijlmans M, Jacobs J, Kahn YU, Zelmann R, Dubeau F, Gotman J. Ictal and interictal high frequency oscillations in patients with focal epilepsy. Clin Neurophysiol 2011;122:664–671. [DOI] [PMC free article] [PubMed] [Google Scholar]
- 46.Jacobs J, Zelmann R, Jirsch J, Chander R, Dubeau F, Gotman J. High frequency oscillations (80-500 Hz) in the preictal period in patients with focal seizures. Epilepsia 2009;50:1780–1792. [DOI] [PMC free article] [PubMed] [Google Scholar]
Associated Data
This section collects any data citations, data availability statements, or supplementary materials included in this article.
Data Availability Statement
Raw SEEG files supporting the findings of this study are available (from N. von Ellenrieder) on reasonable request and approval by the ethics boards of the corresponding institutions.


